Determination of the Reasons for Deterioration of …...i DETERMINATION OF THE REASONS FOR...
119
DETERMINATION OF THE REASONS FOR DETERIORATION OF THE RUM JUNGLE WASTE ROCK COVER Graham Taylor, Alister Spain, Andrew Nefiodovas, Gregory Timms, Valerian Kuznetsov and John Bennett July 2003 Principal Sponsor
Transcript of Determination of the Reasons for Deterioration of …...i DETERMINATION OF THE REASONS FOR...

DETERMINATION OF THE REASONS FOR DETERIORATION OF THE RUM JUNGLE
WASTE ROCK COVER
Graham Taylor, Alister Spain, Andrew Nefiodovas, Gregory Timms, Valerian Kuznetsov
and John Bennett
July 2003
Principal Sponsor

i
DETERMINATION OF THE REASONS FOR DETERIORATION OF THE RUM JUNGLE
WASTE ROCK COVER
Graham Taylor (1), Alister Spain (1), Andrew Nefiodovas(1), Gregory Timms(2,3), Valerian Kuznetsov(2)
John Bennett(2)
(1)CSIRO Land & Water (2)ANSTO Sulfide Solutions (3)CSIRO Telecommunications and Industrial Physics
July 2003
Australian Centre for Mining Environmental Research PO Box 883
Kenmore Qld 4069 Australia

ii
Foreword This report, published by the Australian Centre for Mining Environmental Research (ACMER), arises out of a project developed by ACMER and conducted by ANSTO and CSIRO, two of the Centre research partners. The project arose out of a recommendation from ACMER's Managing Sulfidic Mine Wastes (Stage 1) Project completed in 2000. The major sponsor of the project was the International Network for Acid Prevention (INAP), with minor sponsors being the Queensland Department of Natural Resources and Mines and Queensland Environmental Protection Agency. ISBN: 0 9577966 8 4 (Paperback) ISBN: 0 9577966 9 2 (CD-ROM) July 2003 Copyright Copyright © 2003, Australian Centre for Mining Environmental Research Material in this publication is protected by copyright but may be used providing both the authors and the publisher are acknowledged. The opinions do not necessarily represent the views of the publisher. Enquiries Australian Centre for Mining Environmental Research PO Box 883 KENMORE QLD 4069 AUSTRALIA Telephone: 61 7 3327 4555 Facsimile: 61 7 3327 4574 Email: [email protected] Citations of this publication Taylor, G, Spain, A, Nefiodovas, A, Timms, G, Kuznetsov, V and Bennett, J (2003). Determination of the Reasons for Deterioration of the Rum Jungle Waste Rock Cover. (Australian Centre for Mining Environmental Research: Brisbane). Disclaimer Material presented in this document is the responsibility of the authors. The opinions expressed do not necessarily represent the views of the publisher. ACMER accepts no liability (including liability in negligence) and takes no responsibility for any loss or damage which a user or any third party may suffer or incur as a result of reliance on the document.

iii
Table of Contents
EXECUTIVE SUMMARY ......................................................................................................1
A. BACKGROUND.........................................................................................................3
1. INTRODUCTION .........................................................................................................................................3
2. RUM JUNGLE MINE SITE ...........................................................................................................................4
3. CHARACTERISTICS OF THE OVERBURDEN HEAPS ........................................................................................6
3.1 White�s Overburden Heap.............................................................................................................6 3.2 Intermediate White�s Overburden Heap........................................................................................7 3.3 Dyson's Overburden Heap............................................................................................................8
4. REHABILITATION ......................................................................................................................................8
4.1 Reshaping.....................................................................................................................................9 4.2 Drainage .....................................................................................................................................10 4.3 Covers ........................................................................................................................................13 4.4 Source of Cover Materials ..........................................................................................................15 4.5 Revegetation...............................................................................................................................16 4.6 Timing .........................................................................................................................................17
5. MONITORING..........................................................................................................................................17
5.1 Instrumentation ...........................................................................................................................18 5.2 Results of Monitoring ..................................................................................................................19
B. 2002 WET SEASON CHARACTERISTICS..............................................................26
6. METHODS..............................................................................................................................................26
6.1 Sites and Site Assessment .........................................................................................................26 6.2 Vegetation and Surface Properties .............................................................................................26 6.3 Trenches.....................................................................................................................................27 6.4 Field Tests ..................................................................................................................................29 6.5 Sampling.....................................................................................................................................31 6.6 Laboratory Testing/Analyses ......................................................................................................32
7. FIELD RESULTS......................................................................................................................................33
7.1 Vegetation Characteristics ..........................................................................................................33 7.2 Cover Characteristics..................................................................................................................37 7.3 Depth Distributions of Roots .......................................................................................................47 7.4 Infiltration ....................................................................................................................................51 7.5 Oxygen Flux................................................................................................................................52
8. LABORATORY TEST RESULTS..................................................................................................................53
8.1 Soil Physics.................................................................................................................................53 8.2 Particle Size Distribution .............................................................................................................55 8.3 Mineralogy ..................................................................................................................................60 8.4 Composition................................................................................................................................62 8.5 Leachate Composition ................................................................................................................63
C. 2002 DRY SEASON CHARACTERISTICS ..............................................................65
9. METHODS..............................................................................................................................................65
9.1 Sites and Site Assessment .........................................................................................................65 9.2 Vegetation and Surface Properties .............................................................................................65 9.3 Trenches.....................................................................................................................................65 9.4 Field Tests ..................................................................................................................................67 9.5 Sampling.....................................................................................................................................67 9.6 Laboratory Testing/Analyses ......................................................................................................68

iv
10. FIELD RESULTS ......................................................................................................................................68
10.1 Vegetation Characteristics ..........................................................................................................68 10.2 Cover Characteristics..................................................................................................................68 10.3 Depth Distributions of Roots .......................................................................................................76 10.4 Infiltration ....................................................................................................................................78 10.5 Oxygen Flux................................................................................................................................78
11. LABORATORY TEST RESULTS .......................................................................................................79
11.1 Soil Physics.................................................................................................................................79 11.2 Mineralogy ..................................................................................................................................83 11.3 Composition................................................................................................................................83 11.4 Leachate Composition ................................................................................................................84
D. DISCUSSION AND RECOMMENDATIONS ............................................................86
12. DISCUSSION...........................................................................................................................................86
12.1 Design.........................................................................................................................................87 12.2 Cover Construction .....................................................................................................................87 12.3 Material Characteristics/Availability.............................................................................................90 12.4 Physical/Chemical Changes .......................................................................................................90 12.5 Biological Changes .....................................................................................................................93
13. CONCLUSIONS .......................................................................................................................................95
14. FUTURE COVER DESIGN...........................................................................................................................96
15. ACKNOWLEDGEMENTS ............................................................................................................................97
16. REFERENCES .........................................................................................................................................97
APPENDICES...................................................................................................................101

v
List of Tables Table 1. Annual release of heavy metals and sulfate from each source in the
Rum Jungle area (Table 6.17 of Davy 1975, Timms and Bennett 2002) ........6
Table 2. Chemical analysis of samples from White�s overburden heap (Table 2.3A of Davy 1975 and Tables D5 and D7 of Dames and Moore 1983) .................6
Table 3. Chemical and mineralogical analysis of samples from Intermediate overburden heap (Table 2.3A of Davy 1975 and Table 2B of Butcher and Sutherland 1999) ....................................................................................8
Table 4. Selection of channel protection (reproduced from Table 6.1 of Allen and Verhoeven 1986) .........................................................................................10
Table 5. Details of lateral drains on White�s, Intermediate and Dyson�s heaps (from Tables 9.2, 11.1 and 11.2 of Allen and Verhoeven 1986)....................12
Table 6. Material properties for each layer of the three-zoned cover system employed at Rum Jungle .............................................................................14
Table 7. Grading specifications for erosion barrier material .......................................15
Table 8. Properties of material from the Rum Jungle Borrow Pits ..............................15
Table 9. Species and sowing rates for the top surface, batters and channels on White�s overburden heap (from Table 6.2 of Allen and Verhoeven 1986).....16
Table 10. Historical load data (in t) of selected pollutants sourced from the Rum Jungle rehabilitated site as measured at gauging station GS8150097 (reproduced from Lawton and Overall 2002, Table 3.1) ...............................19
Table 11. Post-rehabilitation rainfall and calculated average infiltration for White�s overburden heap. The values quoted are the arithmetic means of the data from 9-10 lysimeters.............................................................................21
Table 12. Weeds observed on site during each monitoring period...............................24
Table 13. Locations and dimensions (m) of the six major trenches dug for examination of the covers on White�s heap..................................................27
Table 14. Locations of shallow trenches dug to permit examination of the covers in bare patches ............................................................................................29
Table 15. GPS locations of lysimeter pairs on White�s heap ........................................30
Table 16. Details of samples collected from trenches ..................................................32
Table 17. Sizes of the 18 termite mounds examined together with the taxonomic category and probable ecological strategies of the termites that constructed them .........................................................................................39
Table 18. Minimum and maximum thickness of covers recorded from the trenches excavated at each site .................................................................................42

vi
Table 19. The thicknesses (m) of the individual layers in the excavated trenches........43
Table 20. Infiltration test results ...................................................................................51
Table 21. Average oxygen flux through the White�s heap cover system at the four trench locations in April 2002 .......................................................................52
Table 22. Effectiveness of the cover in reducing oxygen flux in April 2002 ..................52
Table 23. Summary of results - moisture, density and related properties.....................53
Table 24. Emerson class number of cover samples.....................................................53
Table 25. Results of liquid and plastic limits and linear shrinkage tests .......................54
Table 26. Particle size analysis and classification of the fine earth fractions ................55
Table 27. Mineralogical composition of cover samples, precipitates and waste rock....................................................................................................60
Table 28. Composition of solid samples of cover, waste rock and precipitate for White�s heap................................................................................................61
Table 29. Composition (in ppm unless otherwise stated) of leachates from cover profiles .........................................................................................................64
Table 30. Locations and dimensions (m) of the four trenches dug for examination of the covers at White�s heap in October 2002.............................................66
Table 31. Samples collected in October 2002..............................................................67
Table 32. Minimum and maximum thickness of covers recorded from the trenches excavated at each site .................................................................................72
Table 33. The thicknesses (m) of the individual layers in the excavated trenches........72
Table 34. Horizontal intervals (m) between the vertical and subvertical desiccation cracks in the pit walls of the clay-rich 1A layer together with the greatest lengths of ten polygons excavated from the 1A layer of pit B′. Sampled in October, 2002 ..........................................................................................73
Table 35. October 2002 infiltration test results.............................................................78
Table 36. Comparison of wet and dry season infiltration test results............................78
Table 37. Oxygen flux through the White�s heap cover system in October 2002, averaged over the four trench locations. The end of wet season results (April 2002) are shown for comparison.........................................................79
Table 38. Effectiveness of the cover in reducing the oxygen flux at the end of the dry season (October 2002) and the end of the wet season (April 2002).............79
Table 39. Moisture contents in cover profiles in October 2002 (end of dry)..................79
Table 40. Comparison of wet and dry season moisture profiles ...................................80

vii
Table 41. Physical properties of samples collected in October 2003............................80
Table 42. Comparison of wet and dry season physical properties................................81
Table 43(a). Textural analysis of the fine earth fraction of Site G material........................81
Table 43(b). Particle size distribution of Site G material ...................................................81
Table 44. Site G Atterberg limits and linear shrinkage results ......................................82
Table 45. Composition of white evaporite from tow drain and white inclusion from pit A�.............................................................................................................83
Table 46. Composition (in ppm unless otherwise stated) of leachates from cover profiles ...............................................................................................85
Table 47. Comparison of the design specifications for Zone 1A with those of samples from the sites investigated .............................................................88
Table 48. Comparison of the design specifications for Zone 1B with those of samples from the sites investigated .............................................................89
Table 49. Comparison of the design specifications for Zone 2A with those of samples from the sites investigated .............................................................89
Table 50. Principal components analysis of pH, EC and the water-soluble fractions of elements measured on samples taken from the different layers in the covers of White�s Heap in April 2002. Eigenvalues, the percentages of variance accounted for by each and the coefficients for each variable are presented...............................................................................................92

viii
List of Figures Figure 1. Location map for the Rum Jungle Mine Site.......................................................... 4
Figure 2. Rum Jungle mine site prior to rehabilitation .......................................................... 5
Figure 3. The drainage system on White�s overburden heap ............................................. 11
Figure 4. The drainage system on Intermediate overburden heap ..................................... 11
Figure 5. The drainage system on Dyson�s overburden heap ............................................ 12
Figure 6. Location of probe holes (▲) and lysimeter pairs (●) on White�s and Intermediate heaps ...................................................................................... 18
Figure 7. Locations of probe holes on Dyson�s heap ......................................................... 19
Figure 8. Sulfate generation rate of White�s heap as a function of time.............................. 22
Figure 9. Sulfate generation rate of Intermediate heap as a function of time...................... 22
Figure 10. Location of probe holes (▲), lysimeter pairs (●) and trenches (-) on White�s Heap ................................................................................................. 27
Figure 11. Annual rainfall and the average (over the ten lysimeters) �best�-estimate infiltration rate into White�s heap for each year as a % of annual rainfall (Kuo et al., 2003) ................................................................................................ 30
Figure 12. Schematic of the oxygen fluxmeter in use........................................................... 31
Figure 13. Depth distributions of very fine (<1 mm) and fine (1-2 mm) roots in the covers. Data are the numbers of roots recorded in 0.01 m2 areas marked on the trench faces ............................................................................................. 50
Figure 14. Ternary textural classification � SITE A .............................................................. 56
Figure 15. Ternary textural classification � SITE B .............................................................. 56
Figure 16. Ternary textural classification � SITE C .............................................................. 57
Figure 17. Ternary textural classification � SITE D .............................................................. 57
Figure 18. Particle size distribution - SITE A........................................................................ 58
Figure 19. Particle size distribution - SITE B........................................................................ 58
Figure 20. Particle size distribution - SITE C........................................................................ 59
Figure 21. Particle size distribution - SITE D........................................................................ 59
Figure 22. Depth distributions of very fine (<1 mm) and fine (1-2 mm) roots reported from the covers in the pits described in October 2002 ........................................ 77
Figure 23. Ternary textural classification diagram � Site G .................................................. 82

ix
Figure 24. Particle size distribution � Site G ........................................................................ 83
Figure 25. Principal components analysis of the pH, EC and the concentrations of 19 water-soluble elements in the covers at Rum Jungle. See Table 33 for list of elements............................................................................................... 93

x
List of Plates Plate 1. Trench excavated on bare patch to ascertain depth of cover .............................29
Plate 2. Two views of the mown pasture at Site A ..........................................................35
Plate 3. Distribution of the sparse vegetation at Site C ...................................................36
Plate 4. Two views of the vegetation cover on the batter walls, April 2002......................37
Plate 5. A cryptogam crust on the surface of the soil near Trench D; note also the incipient organic A1 horizon in the lateral view...................................................38
Plate 6. A soldier of Mastotermes darwiniensis found in the dead wood of Acacia auriculiformis .....................................................................................................40
Plate 7. Wastes outcropping at the surface at a site of limited extent. This and Site C were the only incidences of this observed on White�s heap.....................42
Plate 8. Profile characteristics of Trench B. Note the thickness of the clay layer (ca. 300 to 480 mm) at this location in the pit and the gravelly texture and friable nature of the underlying layer ..................................................................44
Plate 9. Profile characteristics of Trench E. Note the increasingly yellow colour with depth in the middle layer and the presence of roots in the upper part of the wastes .....................................................................................................46
Plate 10. Voids and galleries excavated by termites within clods in the upper layer of the cover........................................................................................................47
Plate 11. Concentration of roots above the discontinuous pan in Trench D ......................48
Plate 12. Concentrations of roots in the planar voids that occur between the structural blocks of the 1A clay layer, trench A ..................................................................48
Plate 13. Two views of the standing dead layer of herbaceous vegetation during the late dry season, October 2002...........................................................................69
Plate 14. A dried out cryptogam crust on the cover surface at the northern end of White�s heap......................................................................................................70
Plate 15. Entrance to the nest of an unidentified ant species. Note that the surface around the entrance has been decorated by the ants with small fragments of waste rock .....................................................................................................71
Plate 16. Dominantly earthen structures built over dead grass stems by termites to protect themselves during foraging ....................................................................71
Plate 17. Aspect of the lower surface of one of the polygonal blocks removed from pit B. Note the wastes embedded in the lower surface and the tracery of fine roots............................................................................................................75
Plate 18. Lateral face of one of the polygonal blocks removed from pit B .........................75

1
EXECUTIVE SUMMARY A three-stage study of 18 year-old covers on White�s waste rock heap, Rum Jungle, Northern Territory, Australia was undertaken to ascertain the factors leading to a reported deterioration in performance. Stage 1 of the study involved the collation of information about the Rum Jungle rehabilitation works, with a focus on the design and construction of the covers on the waste rock dumps. Field and laboratory measurements of the properties of the cover on White�s dump were then undertaken. Stage 2 was carried out at the end of the �wet� season in April 2002, and Stage 3 was undertaken at the end of the �dry� in late October 2002. Covers were placed on sulfidic waste rock dumps at the abandoned Rum Jungle uranium mine during 1984-85. These covers were designed to reduce the water infiltration to less than 5% of incident rainfall by both water shedding and storage-release mechanisms. Regular monitoring by the Australian Nuclear Science and Technology Organisation (ANSTO) demonstrated that the covers performed better than the design criterion for around 10 years, but infiltration rates have subsequently increased. There is a 66% probability that the infiltration rate after 18 years now exceeds 5% of incident rainfall. The cover on the largest pile, White�s heap, was sampled in pits dug at eight locations. Sampling in four pits was carried out at the end of the monsoonal wet season and in another four pits at the end of the �dry� season. The field data, together with laboratory testing, enabled cover performance to be assessed against five criteria: design, construction, cover material characteristics, physico-chemical characteristics and biological characteristics. We are of the opinion that the design of the cover was suitable to achieve the objectives of stability, water shedding, storage-release, and provision of a substrate for vegetation growth. Over most of the surface of the heap, the construction of the covers, drains and erosion prevention structures was in accordance with design specifications. However, several small and localised bare patches on the upper surface of White�s heap coincide with a reduced cover thickness, which is likely to have been due to poor construction in those patches. The construction of effective covers on mine wastes depends on the availability of an adequate source of material meeting design specifications. As part of the rehabilitation program, a detailed study was made of potential cover materials in the near-vicinity of the Rum Jungle site, and the most suitable were used in cover construction. From our limited examination, it appears that there was a shortage of material for each of the three cover layers: a low-permeability clay layer placed on the waste rock to control water infiltration; a storage-release layer to provide moisture to the vegetation throughout the long dry season and to prevent the clay layer from drying out; and an upper erosion-resistant layer supporting vegetative growth. An indication of this was that the upper layers in some areas were observed to be thinner than specified. We are of the opinion that this shortage of suitable material has been responsible for some of the observed changes in cover performance over time. Because there has been no previous monitoring of the biophysical characteristics of the covers, it is difficult to ascertain what changes have occurred. Our observations represent a snap-shot after 18 years of emplacement. There are no major changes to the mineralogy of the cover materials, but the upper levels of the waste rock have oxidized, forming minor jarosite and the expanding clay corrensite. A distinctive distribution of trace elements indicates capillary rise from the waste rock into the overlaying cover and biological pumping and evaporation have resulted in elevated near-surface concentrations.

2
Physical and geotechnical testing carried out in this study indicated that the cover materials no longer meet the original specifications. In particular, the permeability at the eight locations was found to be greater than specified, by up to several orders of magnitude. The higher permeability may explain the higher observed rainfall infiltration in recent years and the observed moisture content of the waste rock. This increased permeability appears to be due to a combination of biological and physical processes � galleries formed by termites and ants, root growth from the pasture grasses and the few volunteer trees, and an extensive system of shrinkage/desiccation cracks formed by the development of a polygonal blocky structure involving the entire lower clay layer. The desiccation cracks may fill with coarser illuviated materials and form a conduit through which roots access the underlying waste rock. Measurements were made of oxygen flux into the heap as cover layers were excavated in the pits. They indicated that the full cover currently reduces the oxygen flux to 20% - 23% of that into bare waste and that this reduction seems to be proportional to the cover thickness. It was also found that the oxygen flux into the cover is about four times higher at the end of the dry season than at the end of the wet season and that the difference is due primarily to the significantly lower moisture content of the cover at the end of the dry season. Recommendations are made for the design and construction of covers, based on the findings of this study. Similar studies of covered waste dumps in different climatic environments appear warranted.

3
A. BACKGROUND 1. INTRODUCTION Earthen covers are widely used by the mining industry throughout the world to control low-quality drainage from piles of sulfidic minewastes. The purpose of these covers is to impede the ingress of water (the transport medium for generated pollutants) and, in some circumstances, oxygen (the primary oxidant for the sulfide minerals) into the mine waste and to act as a substrate for vegetative growth and ecosystem reconstruction. Covers are also designed to reduce erosion. In recent years considerable effort has been put into designing covers, including those intended to shed water or those relying on evapotranspiration to act as storage-release covers. These designed covers, together with those emplaced earlier, are generally not of sufficient age to ascertain their long-term effectiveness in the face of root penetration and other soil forming processes, including the development of structure in any compacted layers. Few of the covered waste piles are instrumented sufficiently well to monitor any changes in performance or to allow the generation and transport of pollutants to be quantified. Because of increasing community expectations, regulatory requirements and industry concerns, it is of strategic importance that the long-term viability of covers be determined. Three waste rock heaps (White�s, Dyson�s and Intermediate) at the Rum Jungle uranium and copper mine site in the Northern Territory, Australia, were covered during 1984-85. Prior to covering, lysimeters were installed in two of the heaps and have been monitored continuously since rehabilitation was completed. For 10 years after emplacement, the covers met the specifications for water infiltration. Since then, monitoring has shown that water infiltration has increased, but there has been no effort to determine the factors leading to this increase. Being one of the first engineered covers in the world, and certainly the best monitored, it was judged important to investigate possible reasons for the deterioration of the Rum Jungle cover. Similar types of earthen covers are now widely used around the world to control the generation and/or transport of low quality drainage from sulfidic waste rock dumps. There is, however, very little field data on the performance of covers in the longer term. This lack of information has implications for the degree of confidence that can be placed on the predictions of the environmental impacts of sulfidic mine wastes, for the acceptance of close-out criteria by regulatory authorities and for the financial liability of the mining industry. The objectives of the work were to use field and laboratory techniques to determine the present physical, chemical, mineralogical, biological and hydrological characteristics at a number of locations on the engineered cover on White�s heap. The generated data were to be compared with the technical specifications used for construction of the covers and with earlier monitoring data to establish likely reasons for the deterioration in cover performance. The information will have strategic significance for the design of covers for long-term viability. The project was developed and managed by the Australian Centre for Mining Environmental Research (ACMER), with financial sponsorship by the International Network for Acid Prevention (INAP), the Queensland Department of Natural Resources and Mines and the Queensland Environmental Protection Agency.

4
2. RUM JUNGLE MINE SITE The Rum Jungle mine site is located approximately 85km south of Darwin in the Northern Territory, Australia, at 13°01'S, 130°58'E (Figure 1). Uranium mineralisation was discovered in 1949, and mine development and plant construction commenced in 1952. Uranium (as yellow-cake) and copper concentrates were produced until the mine closed in 1971. Ore was extracted from three open-cut mines (White�s, Dyson�s and Intermediate) (Figure 2). The mine site is situated in an area of relatively flat relief with a network of ephemeral streams draining east to the Joseph Bonaparte Gulf (Figure 1). It is surrounded by savanna woodlands dominated by Eucalyptus species. Soils are of lateritic origin with ferruginous lag being common throughout the area. The region is characterised by a typical monsoonal climate with an average annual rainfall of 1600mm which falls predominantly during the period October to May. High intensity rainfall events occur during thunderstorm activity in the early wet season, and steady falls occur during the latter part of the wet season (January to March). High daily maximum temperatures are experienced throughout the year (annual average 34°C) as well as high annual evaporation rates (>2600 mm at Darwin).
Figure 1. Location map for the Rum Jungle Mine Site

5
Figure 2. Rum Jungle mine site prior to rehabilitation Uranium (as uraninite) and copper (as chalcopyrite) mineralisation occurred in black-pyritic-graphitic sericitic slates of the Lower Proterozoic Whites Formation (Needham and De Ross, 1990) associated with carbonates of the Coomalie Dolomite and a hematite-quartzite breccia. Mineralisation appears to have been controlled by a shear zone at the contact between slates and dolomite. Oxidation to a depth varying from 10 to 35m resulted in the formation of a variety of secondary uranium minerals (Fraser, 1975) and malachite. The main sulfide minerals were bornite and pyrite with traces of Pb, Bi, Ni, Co and Cu sulfides and sulfosalts (Fraser, 1975). Waste rock from the three open pits was dumped in four separate locations (Figure 2), which, together with tailings from the processing plant, heap leach pile, acid dam and open cuts, had considerable impact on the local environment and ecology of the Finniss River. Natural leaching of the overburden heaps was first noticed in the mid-1960s. It was found that very acidic liquors loaded with heavy metals were running off the heaps and springs, with elevated temperatures (as high as 36.5°C) developed at the bases of the heaps midway through the wet. Following an investigation, which was carried out principally during the 1973/74 wet season, the annual release of heavy metals from each source was estimated. This information (Table 6.17 of Davy 1975) is reproduced in Table 1.

6
Table 1. Annual release of heavy metals and sulfate from each source in the Rum Jungle area (Table 6.17 of Davy 1975, Timms and Bennett 2002)
Annual release (tonnes) Source Copper Manganese Zinc Sulfate1 Dyson�s opencut 1 3
Dyson�s overburden heap 0.2 5 White�s opencut 8 30
White�s overburden heap 29-53 11-19 17-31 2500 Intermediate opencut 3 3 0.3
Intermediate overburden heap 16-30 2.5-4.5 13-25 1100 Heap leach pile 32-42
Tailings area 5 3.5 Old Acid Dam 12
TOTAL 95-142 70-80 30-56 8000
3. CHARACTERISTICS OF THE OVERBURDEN HEAPS
3.1 White�s Overburden Heap The White�s uranium/copper orebody was located under the East Branch of the Finniss River and was mined between 1954 and 1958. The orebody was sandwiched between two arms of a black slate sequence which was pyritic. The overburden heap was built on a level, well-drained portion of land to the south of the open cut. It was made up principally of slates and shales except for the top surface of the north-west corner which was composed mainly of dolomites from the base of the opencut. The total mass of the heap was 7.1 million tonnes, the area 26.4 ha and the volume (from aerial survey) was (3.9 ± 0.7) × 106 m3. Results of chemical analysis of crushed and bulked samples taken from White�s heap during the 1969 dry season (Davy 1975) are reproduced in Table 2. Further near-surface samples were taken from test pits dug to a depth of 6 metres in November/December 1982 (Dames and Moore 1983). Results of heavy metal analyses of these samples are also shown in Table 2. Table 2. Chemical analysis of samples from White�s overburden heap (Table 2.3A of
Davy 1975 and Tables D5 and D7 of Dames and Moore 1983)
Percent by mass (%) Constituent White�s (Davy) White�s (Dames & Moore) Uranium 0.003 0.002
Sulfur 3.27 3.68 Cobalt 0.013 0.005

7
Percent by mass (%) Constituent White�s (Davy) White�s (Dames & Moore) Copper 0.086 0.039
Manganese 0.099 0.013 Nickel 0.026 0.014 Lead 0.048 0.051 Zinc 0.011 0.002
Most of the sulfur was in the form of heavy metal sulfides, principally pyrite. The oxidation of these sulfides was the source of the acidic, metal-laden leachate flowing from the heap. The rate at which oxidation is occurring can be estimated from measured pore gas oxygen concentrations and temperatures in the heap, as well as pollutant loads in drainage. Timms and Bennett (2002) estimated the oxidation rate of the material within White�s heap. The oxidation rate was estimated at ten probe hole locations, with the estimates ranging from 2.2 × 10⁻⁹ to 3.7 × 10⁻⁸ kg (O2) m-3 s-1. The average oxidation rate of material in the heap near the 10 probe hole locations was estimated to be 1.3 × 10⁻⁸ kg (O2) m-3 s-1. Harries and Ritchie (1983) discussed the water balance of White�s heap. They estimated that, prior to rehabilitation, 15 % of incident rainfall left the heap as runoff, 35 % evaporated from the heap and the remaining 50 % infiltrated the heap.
3.2 Intermediate White�s Overburden Heap The Intermediate orebody was reported to be sulfide mineralisation and was mined from 1963 to 1964. The host rock was principally pyritic graphitic shale. Overburden was dumped on level ground immediately to the south of the open cut. Prior to rehabilitation, pyrite was visible all over the heap, and there was very little vegetation. The total mass of the heap was 1.2 million tonnes, the area 6.9 ha and the volume (from aerial survey) was (0.65 ± 0.10) × 106 m3. Results of chemical analysis of crushed and bulked samples taken from Intermediate heap during the 1969 dry season (Davy 1975) are reproduced in Table 3. During installation of probe holes in Intermediate heap in 1985, drill cuttings were collected. These cuttings were sealed and stored at �15 °C. Mineralogical analysis of nine of these samples was conducted in 1999 by CSIRO Minerals, and the average results are also presented in Table 3. Quartz, muscovite and clinochlore were the major constituents of all nine samples.

8
Table 3. Chemical and mineralogical analysis of samples from Intermediate overburden heap (Table 2.3A of Davy 1975 and Table 2B of Butcher and Sutherland 1999)
Percent by mass (%) Constituent Intermediate (Davy) Intermediate
(Butcher & Sutherland) Quartz - 34.3
Feldspars - 16.3 Micas - 9.9
Chlorites - 5.8 Iron sulfides - 5.8
Clays - 5.4 Uranium 0.0046 -
Sulfur 3.06 3.15 * Cobalt 0.03 - Copper 0.20 -
Manganese 0.027 - Nickel 0.2 - Lead 0.5 - Zinc 0.025 -
*assuming pyrite is the sole iron sulfide Timms and Bennett (2002) also estimated the oxidation rate of material within Intermediate heap. Estimates made at seven probe hole locations ranged from 1.2 × 10⁻⁸ to 2.7 × 10⁻⁷ kg (O2) m-3 s-1. The average oxidation rate of heap material near the 7 probe hole locations was estimated to be 1.1 × 10⁻⁷ kg (O2) m-3 s-1.
3.3 Dyson's Overburden Heap The Dyson�s orebody was sandwiched between a bed of black graphitic slate and a dome of dolomite and was mined from 1957 to 1958. Below 27 metres the black graphitic slates became strongly pyritic. Copper, lead, cobalt and nickel were reported to be absent. Overburden was dumped on a hillside immediately to the east of the mine. Close to 20% of the overburden is composed of the black pyritic shale (itself with a pyrite content of 10-15%), giving an average pyrite content for the heap of 2 � 3%. The total mass of the heap was 2.2 million tonnes, the area 8.4 ha and the volume (from aerial survey) was (1.2 ± 0.2) × 106 m3.
4. REHABILITATION An agreement was reached between the Commonwealth and Northern Territory Governments to rehabilitate the mine site with the Commonwealth providing non-repayable, non-interest bearing grants of $16.2M. Rehabilitation was staged over the period January 1983 to June 1986. The objectives of the project were:

9
• a major reduction in pollution in water courses feeding the East Branch of the Finniss River and, in particular, the reduction of the average annual releases of copper, zinc and manganese into the river by 70%, 70% and 56% respectively, as measured at the junction of the river with the Finniss River;
• a reduction in public health hazards and in particular reduction of radiation levels at the
site at least to the standards set out in the Code of Practice on Radiation Protection in the Mining and Milling of Radioactive Ores published by the Australian Government Publishing Service;
• a reduction of pollution contained in the open pits known as White�s and Intermediate;
and • aesthetic improvements including revegetation. The rehabilitation strategy for the overburden heaps was to reduce infiltration to less than 5% of incident rainwater and hence reduce the transport of pollutants from the heaps. It was suspected that measures to reduce water infiltration might also reduce the flux of oxygen into the heaps. This was seen as a possible additional benefit as a reduction in oxygen supply reduces the rate at which acid and other pollutants are produced. Another important requirement for the design of the works was the minimisation of future maintenance of the rehabilitated heaps (and other rehabilitated areas). In order to achieve this, all drainage structures were engineered and use was made where practical of naturally occurring materials. The design life of the works was one hundred years.
4.1 Reshaping The overburden heaps were originally constructed during the development of mine open cuts by end dumping of spoil material from tipheads established along a centrally placed haul road. This resulted in heaps with precipitous external slopes at the angle of friction of the dumped spoil, with the heap surface generally graded internally towards the original haul roads. Reshaping of each heap was aimed at creating a landform with more stable external slopes (batters) on which surface erosion could readily be controlled and internal slopes (top surface) graded to a formal drainage system for control of runoff. (a) The Batters Reshaping of the batters was a compromise between ensuring grades were flat enough to significantly reduce the risk of erosion damage and minimising the cost of construction. A batter slope of one vertical to three horizontal was chosen. In the case of White�s heap, a 5 metre-wide berm was constructed around the reshaped heap at mid height to enable greater control of stormwater and to reduce the length of overland flow on the batter slope. (b) The Top Surfaces The top surfaces of the heaps had to be shaped such that erosion control and drainage could be effected at minimum cost and controlled runoff assured. A minimum surface gradient of 1 % and a maximum gradient of 10 % were selected as satisfying these

10
requirements. The top surfaces of the heaps were graded inwards from the outer rim toward the drainage lines to limit overflow of the rim. (c) Intermediate Heap � Special Considerations Approximately 40 000 m3 of dolomitic rock was removed from the south-western corner of Intermediate heap and used in the construction of a rock blanket on Dyson�s open cut. The heap was reshaped by shifting material from the higher eastern side of the heap to the area from where the dolomitic material had been removed. The resulting structure was then further reshaped to meet the criteria described above.
4.2 Drainage Rapid transport of runoff away from the heap surfaces is crucial in limiting infiltration. Design of the drainage system aimed to transport water from the heap surfaces as rapidly as possible while minimising erosion of heap surfaces. Graded banks were constructed on the tops of the heaps to control overland flow velocities and hence reduce erosion. Erosion control drains beside these banks fed into more substantial drainage channels. The material chosen to line the drains and channels, and protect from erosion, depended on the maximum velocity of water in the channel as shown in Table 4. Table 4. Selection of channel protection (reproduced from Table 6.1 of Allen and
Verhoeven 1986)
Maximum velocity (m s-1) Channel protection 1.2 Vegetation 3.5 Rip rap 5.0 Reno mattress
The layout of the drainage on the three overburden heap is shown in Figures 3 to 5. The drainage system for the top surface of the heaps consisted of lateral drains which collected runoff from the erosion control banks and overland flow and directed that runoff to a main drainage line (Drain D on White�s heap, Drain 5 on Dyson�s heap and Drain 7 on Intermediate heap).

11
N
100m
DIVERSION CHANNEL
DRAI
N D
EROSION BANK
DRAIN C
DRAI
N B
DRAIN A
Figure 3. The drainage system on White�s overburden heap
DIVERSION CHANNEL
DRAIN
EROSION B
ANK
50 m
N
DRAIN 7
Figure 4. The drainage system on Intermediate overburden heap

12
DROPSTRUCTURE
N
DYSONS DRAIN
DRAIN 5
DRAIN 6
metres 50 0 50 100 metres
85 80 77 73 70
90
89
8887
86
85
84
83
82
81
80
79
78
Figure 5. The drainage system on Dyson�s overburden heap Details of the lateral drains on the heaps are presented in Table 5. Table 5. Details of lateral drains on White�s, Intermediate and Dyson�s heaps (from
Tables 9.2, 11.1 and 11.2 of Allen and Verhoeven 1986) Drain Catchment
Area (ha) Peak Discharge (m3 s-1)
Base width (m)
Batter slope
Depth of flow (m)
Flow velocity (m s-1)
A 6.4 2.3 3 3:1 0.4 3.29 B 7.4 4.0 4 3:1 0.35 2.45 C 3.3 2.1 3 3:1 0.35 2.12 D 19.0 8.3 4 2:1 0.42 4.0 5 6.0 3.0 2 2:1 0.3 4.3 6 1.3 0.8 2 3:1 0.18 2.1 7 0.8 2.0 2 3:1 & 2:1 0.25 3.4
The batters of White�s and Intermediate heaps were covered with uniformly graded rock mulch which was designed to carry water at low velocity through the voids and so reduce erosion of the underlying cover materials.

13
In the case of White�s and Intermediate heaps, there were additional elements in the drainage systems. On White�s heap, a drainage system was incorporated in the 5 metre-wide berm and another system was constructed to intercept groundwater at the interface between the original ground surface and the underside of the heap in the region in which springs were observed prior to rehabilitation. On both heaps a toe drain was constructed around the base of the heap to intercept runoff from the batter.
4.3 Covers Criteria for the design of the cover system included the following: • Possess low permeability to reduce infiltration to less than 5% of incident rainfall; • Be well drained and be free of depressions and hollows to prevent water ponding; • Should support a vegetative cover; • Be resistant to erosion at the slopes of the reshaped heaps before vegetation is fully
established; • Should be of the minimum thickness compatible with the performance objectives (to
contain costs); and • Construction should be simple and maximise use of locally available materials. The resultant cover system consisted of three zones, the construction of which differed between the upper surface of the heap and the batters. Heap Surface The top surface of the heaps, which, after reshaping, were characterised by relatively flat uniform gradients, was covered with the following three zoned system. Zone 1A � Moisture Barrier The uppermost surface of the reshaped heap was rolled to form a thin, crushed rock filter zone over which Zone 1A was placed. The Zone 1A layer of the cover system was the infiltration resistant layer and was constructed from a compacted clayey material. Zone 1B � Moisture Retention Zone The Zone 1B layer of the cover system constituted the moisture retention zone. Moisture retained in this layer supported the vegetation during the dry season and provided a moisture source to assist in the prevention of desiccation of the Zone 1A layer. This layer was designed to act as a �store and release� element within the cover system. Zone 2A � Erosion Resistant Zone The Zone 2A material formed the upper layer of the three-zoned cover system and, in addition to providing resistance to the erosive forces of rainfall and runoff, formed the seed bed for the vegetation and acted as a pore breaking zone to restrict moisture loss due to evaporation during the dry season. Material properties for each of these cover regions are presented in Table 6.

14
Table 6. Material properties for each layer of the three-zoned cover system employed at Rum Jungle
Property Zone 1A Zone 1B Zone 2A Material type lateritic clay sandy clay loam gravelly sand Minimum thickness 150 mm 150 mm - Maximum layer thickness 225 mm 250 mm 150 mm Compaction ≥ 98 % of
maximum dry density
≥ 90 % of maximum dry density
loose
Compacted density > 1.8 t/m3 - - Moisture content ≥ 97 % and ≤ 101
% of optimum ≥ 98 % and ≤ 102 % of optimum -
Permeability (after placement and compaction)
10-8 to 10-9 m/s - > 10-7 m/s
Liquid limit ≥ 40 and ≤ 65 ≥ 30 and ≤ 60 ≤ 40 Plasticity index ≥ 15 ≥ 10 ≥ 15 Maximum particle dimension
75 mm 150 mm 150 mm
Grading: Sieve size (mm) % Passing 150 100 100 100 75 100 90 � 100 90 � 100 19 90 � 100 85 � 100 65 � 95 2.36 75 � 100 45 � 80 25 � 60 0.425 50 � 90 30 � 60 18 � 40 0.075 35 � 80 20 � 45 10 � 30
The Batters The cover system for the batters on White�s and Intermediate heaps was similar to the covers applied to the tops of the heaps except for: (a) Cover Thicknesses The thicknesses of the batter cover materials were increased to take account of the higher potential for erosion on the batters and the potentially greater difficulty in placing covers on the batters. The thicknesses specified were: Zone 1A 300 mm Zone 1B 300 mm Erosion layer 150 mm (b) Erosion Barrier With the maximum batter slope of one vertical to three horizontal, the erosion protection requirements for these areas of the heaps was considerably higher than for the relatively gentle slopes on the top surface of the heaps. Consequently the material required for this protection was considerably coarser than that specified for the top surface.

15
Material characteristics of erosion barrier material Grading: uniformly graded with a low proportion of non-plastic fines. Material type: competent crushed rock. Minimum thickness: that thickness compatible with construction techniques. The grading specifications for the erosion barrier material are presented in Table 7. Note that the batters on Dysons heap were not reshaped or covered in the rehabilitation works. Table 7. Grading specifications for erosion barrier material
Sieve size (mm) % Passing 150 100 75 50 � 100 19 0 � 30 2.36 0 � 10
4.4 Source of Cover Materials The cover materials were sourced from five borrow pits, all within 10 kilometres of the Rum Jungle minesite. Average properties of materials from four of these borrow pits are presented in Table 8 (Appendix B of Dames and Moore 1983, Appendix A of Dames and Moore 1984). The Zone 1A material was sourced from Borrow Pits 1 and 3 (principally Pit 1), Zone 1B material from Borrow Pits 1,2 and 3 and Zone 2A material from Borrow Pits 2 and 3 (Appendix D of Cameron McNamara 1984). The material used in each cover zone met the design criteria for that zone shown in Table 6. Table 8. Properties of material from the Rum Jungle Borrow Pits
Property (Average Value ±±±± One St.
Dev.)
Borrow Pit 1 Borrow Pit 2
Borrow Pit 3 Borrow Pit 5
Field moisture content
(25 ± 8) %
-
(13 ± 8) %
(12 ± 5) %
Optimum moisture content (23 ± 4) %
-
(15 ± 3) %
(19 ± 5) %
Maximum dry density (t m-3) 1.63 ± 0.13
-
1.95 ± 0.06
1.67 ± 0.20
Liquid limit
61 ± 15
40 ± 6
45 ± 11
51 ± 14
Plasticity index
31 ± 15
19 ± 5
21 ± 9
27 ± 13
Permeability at 90 % (m s-1)
8 × 10⁻⁸ to 1 × 10⁻⁶
-
2 × 10⁻⁷ to 2 × 10⁻⁶
1 × 10⁻⁷ to 2 × 10⁻⁶
Permeability at 100 % (m s-1)
8 × 10⁻¹⁰ to 3 × 10⁻⁸
-
2 × 10⁻⁹ to 4 × 10⁻⁸
4 × 10⁻¹⁰ to 7 × 10⁻⁸

16
Property (Average Value ±±±± One St.
Dev.)
Borrow Pit 1 Borrow Pit 2
Borrow Pit 3 Borrow Pit 5
Grading: Sieve size (mm)
% Passing
150 100 100 100 100 75 100 100 100 100 19 97 ± 7 97 ± 6 99 ± 4 100
2.36 87 ± 18 35 ± 7 71 ± 23 87 ± 18 0.425 75 ± 19 25 ± 7 55 ± 20 78 ± 26 0.075 64 ± 17 19 ± 7 45 ± 25 61 ± 23
4.5 Revegetation The final phase of the rehabilitation of the overburden heaps was their revegetation. The prime requisite of the revegetation program on the heaps was to stabilise the heap surfaces against the long-term effects of erosion. Characteristics considered essential at the time for the selection of species for vegetating the heaps included: (i) ability to quickly establish and stabilise the heap surfaces; (ii) ability to withstand the harsh climatic conditions of the Northern Territory; (iii) ability to perenniate with little or no maintenance; (iv) ability to establish on the particular cover systems used on the heaps; (v) be readily available from commercial seed suppliers; and (vi) be shallow rooting so as not to penetrate the low permeability clay layer. Based on these criteria, an uncontrolled �shotgun� mixture of species was selected. This was comprised of �improved� pasture grasses and legumes. The requirement for shallow rooting species was considered to preclude the use of trees on covered areas. Table 9 lists the species and sowing rates for the top surface, batters and channels on White�s overburden heap. Table 9. Species and sowing rates for the top surface, batters and channels on
White�s overburden heap (from Table 6.2 of Allen and Verhoeven 1986)
Sowing rate (kg ha-1) Species name Common name Top
surface Batters Channels
Sorghum bicolor Hybrid dwarf sorghum 4 - - Chloris gayana Rhodes grass 3 6 5 Brachiaria decumbens Signal grass 4 6 - Brachiaria mutica Para grass - - 10 Cynodon dactylon Speedy green couch 1 2 - Paspalum notatum Pensacola Bahia
grass 4 - -
Paspalum plicatulum Bryan plicatulum - - 10 Styosanthes guianensis Graham stylo 6 - - Styosanthes hamata Verano stylo 4 - -

17
Sowing rate (kg ha-1) Species name Common name Top
surface Batters Channels
Stylosanthes scabra Seca stylo - 4 - Macroptilium atropurpureum
Siratro - 2 -
Calopogonium mucunoides
Calopo - 4 -
In addition Pangola grass (Digitaria decumbens) runners were placed on the top surface at 0.5 metre centres. Seeding on Dyson�s overburden heap was identical to White�s with the exception that the uncovered batters were not seeded. Seeding on Intermediate heap was as specified in Table 9 with the following changes: Sabi grass (Urochloa mozambicensis) was substituted for Pensacola Bahai grass on the top surface and Calopo was removed from the mixture applied to the batters.
4.6 Timing White�s Overburden Heap White�s overburden heap was constructed between November 1954 and November 1958. The cover was put in place between September 1983 and July 1984 with revegetation occurring from November 1984 to April 1985. Hence, the material in the heap was left exposed for between 26 and 30 years prior to covering. Intermediate Overburden Heap Intermediate overburden heap was constructed from 1963 to 1964. The heap was reshaped between June and August 1985. The cover was constructed and the heap vegetated between September 1985 and May 1986. Hence, the material in the heap was left exposed for between 21 and 23 years prior to covering. Dyson�s Overburden Heap Dyson�s overburden heap was constructed from 1957 to 1958. The top surface of the heap was reshaped between May and June 1985 but the existing batters were left unchanged and uncovered. The cover on the top surface was constructed and vegetated between June 1985 and May 1986.
5. MONITORING Monitoring of the overburden heaps commenced prior to covering and has continued to 2002. The Conservation Commission of the Northern Territory, that later became the NT Department of Lands, Planning and Environment (NT DLPE) and then the NT Department of Infrastructure, Planning and Environment (NT DIPE), was given the tasks of monitoring the condition of vegetation on the heaps and monitoring erosion of covers and drains. The Australian Atomic Energy Commission, which became ANSTO, was given the task of monitoring chemical activity and water balance within White�s and Intermediate heaps and groundwater hydrology in and around the heaps.

18
The Water Resources Division of the Northern Territory Department of Mines and Energy also undertook monitoring of pollutant loads in the Finniss River, to assess the success of the rehabilitation with respect to reduction in the copper, manganese and zinc loads from the site. In 1995 ANSTO undertook a limited study of oxygen and temperature profiles within Dyson�s heap.
5.1 Instrumentation The instrumentation of the overburden heaps is described in detail by Timms and Bennett (2002). Five pairs of lysimeters were installed in White�s heap in late 1983 to measure the rate of water infiltration through the cover. Four pairs of lysimeters were also installed in Intermediate heap following reshaping. The locations of the lysimeter pairs are shown in Figure 6. Probe holes were drilled in all three heaps to enable internal temperatures and pore gas oxygen concentrations to be measured. These data were used in estimating oxidation rates within the dumps. The probe hole locations are shown in Figures 6 and 7.
post-rehabilitation100m
10
17
A11
1218B
13
19D
14
C
16
E15
DIVERSION CHANNEL
DRA
IN
White’s overburden heap
N
Intermediate overburden heap
DIVERSION CHANNEL
DRAIN
EROSION BANK
1310
14
16
19
1720 21
18
15
121
465
2 37
89
50 m
11
12
3
4
Figure 6. Location of probe holes (▲) and lysimeter pairs (●) on White�s and
Intermediate heaps

19
DROPSTRUCTURE
N
DRAIN 5
DRAIN 6
metres 50 0 50 100 metres
D01R
D02R
D03R
D04R
D05R
D06R
D07R
D08R
D12R
D09R
D10R
D11R
85 80 77 73 70
90
89
8887
86
85
84
83
82
81
80
79
78
Figure 7. Locations of probe holes on Dyson�s heap
5.2 Results of Monitoring Water Quality in the East Branch of the Finniss River Table 10 is reproduced from Lawton and Overall (2002). It shows the measured pollutant loads in the East Branch of the Finniss River at gauging station GS8150097. This gauging station is downstream of the site and was the agreed measurement location at which the success of the rehabilitation would be assessed. Table 10. Historical load data (in t) of selected pollutants sourced from the Rum
Jungle rehabilitated site as measured at gauging station GS8150097 (reproduced from Lawton and Overall 2002, Table 3.1)
Year Flow
volume (m3 ×××× 106)
Rainfall (mm)
Cu (total)
Cu (dissolved)
Zn (total)
Zn (dissolved
) Mn
(total) Mn
(dissolved)
Sulfate
1969/70 7 896 44 n/a 46 3 300
1970/71 33 1611 77 24 110 12 000
1971/72 31 1542 77 24 84 6 600
1972/73 22 1545 67 22 77 5 500
1973/74 69 2000 106 30 87 13 000
1982/83 9.5 1121 23 5 6 1 520

20
Year Flow
volume (m3 ×××× 106)
Rainfall (mm)
Cu (total)
Cu (dissolved)
Zn (total)
Zn (dissolved
) Mn
(total) Mn
(dissolved)
Sulfate
1983/84 48 1704 28 9 21 3 600
1984/85 11.7 1136 9.1 4.1 7.2 1 600
1985/86 11.4 1185 3.7 2.7 8.2 4 400
1986/87 13.2 1222 5.6 2.7 8.6 2 870
1987/88 6.3 1064 3.2 2 5.4 1 230
1988/89 35 1600 5.4 4.4 19.2 3 940
1989/90 3.1 900 1.8 1.6 3.9 760
1990/91 40.5 1590 14.9 3 7.4 6 30.5 24.1 4 000
1991/92 7.1 1002 3.8 2.8 2.7 2.6 9.1 8.9 1 260
1992/93 29.9 1421 11.9 5 3.9 3.9 24.7 21.8 2 696
1993/94 26.1 1367 12.7 4.6 5.3 4.4 17.9 16.9 2 281
1994/95 33.3 1580 10.6 4.5 5.8 5.0 18.9 17.6 2 994
1995/96 9.0 996 2.9 1.7 3.0 2.5 8.7 8.1 1 352
1996/97 77.9 1716 11.0 5.5 7.4 6.1 25.4 20.1 4 357
1997/98 47.3 1688 12.4 4.3 6.8 5.8 28.4 24.9 4 812
1998/99 53.2 1888 8.2 1.4 5.5 3.8 13.9 9.3 3 682
1999/00 45.1 1712 8.9 1.0 4.5 0.8 15.0 6.2 3 010
2000/01 64.6 1911 12.3 1.9 6.3 3.4 20.1 5.3 3 925
Monitoring activities on the overburden heaps have been reported as part of the overall monitoring of the site (Kraatz and Applegate 1992, Kraatz 1998, Pidsley 2002). Key results are summarised here. Water Infiltration Rate The effectiveness of the lysimeters installed at Rum Jungle has been discussed by Kuo et al. (2000). Their lysimeter modelling indicated that �fluxes as measured by the field lysimeters at White�s heap are a reasonable measure of the surface infiltration when the infiltration is greater than 5% of the average yearly infiltration� and also that �the accuracy of the measurements should increase with increasing surface infiltration.� Estimates of the annual infiltration rate into White�s heap as a percentage of incident rainfall are shown in Table 11 for each year over the entire monitoring period, apart from the 1993/94 wet season when no measurements were made. The values were found by averaging the measurements made in each of the individual lysimeters over the particular wet season. Data were collected from all ten lysimeters with the exception of the 1991/92 and 1992/93 wet seasons, when only nine lysimeters were functioning. It is important to note that, in any one year, there was a wide variation in the results from different lysimeters and, as a result, the statistical error on the mean was large. For this reason, comparison of the average infiltration values presented in Table 11 must be made with caution. It is clear, however, that the infiltration rate into White�s heap has increased over the final 8 years of measurements. A statistical analysis of the data has shown that there is a 68% probability that the infiltration rate has exceeded the design specification of 5 percent of rainfall in recent times (Kuo et al. 2003).

21
Whilst the lysimeter results indicate that the cover on White�s dump has deteriorated with respect to water flux in recent years, the present infiltration rates are still around five to ten times lower than the 50 percent estimated before cover placement (Daniel et al. 1982). Table 11. Post-rehabilitation rainfall and calculated average infiltration for White�s
overburden heap. The values quoted are the arithmetic means of the data from 9-10 lysimeters
Period Rainfall
(mm) Average infiltration
(% of rainfall) Nov 84 - May 85 1072 2.2% May 85 - May 86 1087 2.2% May 86 - Jun 87 1289 2.8% Jun 87 - Jun 88 1057 1.5% Jun 88 - Aug 89 1625 3.5% Aug 89 - Oct 90 1008 2.5% Oct 90 - May 91 1587 3.9% May 91 - May 92 1008 2.6% May 92 - Jun 93 1421 2.6% Nov 94 - Jun 95 1484 6.0% Jun 95 - Jun 96 998 8.7% Jun 96 - Jun 97 1763 10.2% Jun 97 - Jun 98 1821 5.1% Jun 98 - Jun 99 1887 9.8% Jun 99 - May 00 1716 10.3% May 00 - Jun 01 1912 6.9% Jun 01 - Jun 02 1269 7.6%
Oxidation Rates The pre- and post-rehabilitation oxidation rates for White�s and Intermediate heaps were estimated by Timms and Bennett (2002) from temperature and oxygen concentration profiles. The corresponding sulfate generation rates were also estimated and are presented in Figures 8 and 9.

22
Years
1980-82 1988-90 1991-93 1994-96 1997-99
Sulfa
te G
ener
atio
n R
ate
(tonn
es (S
O4) yr
-1)
0
500
1000
1500
2000
2500
3000
3500
Rehabilitation
Figure 8. Sulfate generation rate of White�s heap as a function of time
Years
1980-82 1985-87 1988-90 1991-93 1994-96 1997-
Sulfa
te G
ener
atio
n R
ate
(tonn
es (S
O4) yr
-1)
0
200
400
600
800
1000
1200
1400Rehabilitation
Figure 9. Sulfate generation rate of Intermediate heap as a function of time Comparing the overall oxidation rates in White�s and Intermediate overburden heaps before and after rehabilitation reveals that the oxidation rates (and hence the primary pollutant generation rates) have been reduced by factors of approximately three and two respectively by rehabilitation. Whilst these figures show that the covers have reduced overall oxidation

23
rates, it should be noted that significant oxidation (and hence pollutant generation) is still occurring within White�s and Intermediate heaps. As discussed above, the covers have deteriorated with respect to limiting water flux. There is some less conclusive evidence, indicated by the positive slope on the post-rehabilitation portion of Figures 8 and 9, that the performance of the cover has also deteriorated with respect to limiting oxygen flux. It should be noted, however, that both oxygen and water fluxes still remain well below their pre-rehabilitation levels in the heaps. Vegetation In the years immediately following rehabilitation, Ryan (1985,1986,1992) reported that the pastures were dynamic, displaying seasonal shifts in species dominance coupled with the influence of colonising species. On White�s heap, Rhodes grass, Sabi grass and to a lesser extent couch grass were dominating and Acacia holosericea shrubs were slowly colonising the top surface. At that time there was no indication of salt or metal movement within the covers. The pasture on Intermediate heap was noticeably different, being dominated by Signal grass. The pasture on Dyson�s heap was dominated by Sabi, Rhodes and Bahia grasses. The presence of colonising trees was of concern, as it was perceived that roots might damage the integrity of the cover. On the basis of trials during 1985/86, and an analysis of tree removal costs/benefits versus stability/aesthetic benefits, Ryan made a number of comments. These included: (i) �Endemic trees have the ability to penetrate the 1A clay seal. Whilst the eucalypts on
trial maintained their habit to deep root, they confined many major roots to a lateral habit, following the planes of weakness created by compacted lift layers. Acacia species on trial maintained their habit to confine the great bulk of roots in the less compacted, surface layers. However rootlets were able to penetrate the 1A clay.�
(ii) �Volumetrically, the pore spaces (and therefore potential pathways) created by tree
roots in the 1A clay can only constitute a small percentage of the total amount of seal afforded by the 1A clay layer.�
(iii) �The annual removal of trees entails an annual, permanent maintenance cost
estimated to be of the order of $5,000 to $10,000, and increasing with increased tree numbers.�
(iv) �Gradually, trees and shrubs will take on some of the erosion protection role currently
undertaken by the pastures. Removal of trees will place a greater requirement for pasture maintenance works, and therefore costs.�
(v) �In terms of floral and faunal population dynamics, the available literature on
rehabilitated landforms suggests the attainment of a vegetation community incorporating grasses, shrubs and trees is a more desirable goal�
On the basis of his comments, Ryan recommended that trees not be removed and, that in the following two years, the effects of the trees on the integrity of the cover again be addressed. Several species of ants and one species of termite were identified on the rehabilitated surfaces. In the north-western sector of White�s heap, more than 20 mounds of the grass-eating termite Nasutitermes triodeae were found. Following an inspection of the mounds, Ryan concluded that given the colour of the mounds and their particle size and quartz

24
content, that it was unlikely that the 1A clay material was being used as a construction material. In the 1988-93 Monitoring Report, Kraatz (1998) commented that the pastures had generally remained healthy and vigorous up to 1993, except for a small patch of die-back on the northern end of White�s heap which was identified in 1989 and did not reduce or increase in size during the remainder of the monitoring period. Menzies and Mulligan (2000, 2002) investigated this patch of dieback by taking soil samples from auger holes and found that the depth of the soil cover in this region was only 2 to 5 cm (cf. the design criteria of more than 60 cm). They concluded that the problem was localised and was a consequence of inadequate capping in that region of White�s heap. Weeds Weeds presented a major problem and were considered to have been introduced through the importation of contaminated borrow material during rehabilitation, and through transport by vehicles, wind and birds. Table 12 lists the weeds identified during each of the monitoring periods. Table 12. Weeds observed on site during each monitoring period
Common name Scientific Name 1986-88 1988-93 1993-98 *Mimosa Mimosa pigra Isolated Isolated Isolated *Grader grass Themeda quadrivalvis - Common Common Hyptis Hyptis suaveolens Common Common Common Sida Sida acuta Common Common Common Mission grass Pennisetum
polystachion - - Common
Rattlepod Crotolaria goreensis - - Common Gamba grass Andropogon gayanus - - Common Cobblers Peg Bidens sp. - - Isolated (* Class A noxious weed which, as a requirement of legislation, must be controlled)
Grader grass was the weed of most concern on White�s heap and was repeatedly slashed and treated with herbicide. Between 1988 and 1993 some small weed infestations occurred on Intermediate heap. These were sprayed and brought under control. Small infestations of Grader grass occurred on Dyson�s heap, but were thought to be well under control by 1993. Between 1993 and 1998 weeds continued to be a major problem (Kraatz and Norrington 2002). Limited but consistent control efforts were successful in the management of some weeds, however no weed species were fully eradicated. Wildfires The maintenance of firebreaks and the annual burning of buffer zones was a high priority and was a requirement under the Bushfires Act. Despite this, numerous fires have occurred on the site since rehabilitation. White�s overburden heap was entirely burnt by fires in 1989 and 2000 and Dyson�s heap by a fire in 1997.

25
Erosion Erosion was not identified as a major issue in the three site monitoring reports. Minor erosion control work was required (approximately 2 days per year). None of the reported erosion would be expected to impact on the performance of the covers on the overburden heaps.

26
B. 2002 WET SEASON CHARACTERISTICS The wet season characteristics and general observations of the covers on White�s heap were obtained during a field trip on 7-13 April, 2002 and subsequent laboratory testing. An outline of the field trip was provided by Davidson et al., 2002.
6. METHODS
6.1 Sites and Site Assessment Four major study sites were located on the upper shallow slopes of the landform and are representative of the environments of the surfaces of the landform. These sites were chosen for their proximity to other site instrumentation. Two further sites were selected to assess the effects of two individuals of volunteer tree species on surface and subsurface properties of the covers. Observations were made at a range of supplementary locations including some where no vegetation was present. The batters were examined in a less intensive way. The surfaces of the batters were examined casually at a number of locations, and the general vegetation cover was inspected at locations on all sides of the landforms. The major species present were recorded, and photographs were taken to illustrate the general vegetation coverage. The waterways were also examined in a less intensive way. Limited observations were made of the walls and beds of the waterways at a few locations and photographs taken to record their condition. At the six major study sites, locations were determined using a �Garmin� Model 75 GPS operated in single estimation mode. Site exposures were measured using a compass and gradients were recorded using a hand-held Suunto clinometer. The properties of the individual sites were assessed using a standardised procedure of observations.
6.2 Vegetation and Surface Properties The structural formation class of the vegetation was assessed using the methods of Walker and Hopkins (1990) at the six principal sites and the major species present noted. Selected surface properties of the covers were also recorded. The surface properties recorded included characteristics and depths of the litter, the presence of surface crusts, stoniness, macropores and other surface microrelief features. Observations were also made of the surface active soil fauna where this was evident. In particular, the presence of termite-derived structures (mounds, covers constructed over grasses) was recorded at a range of locations on the upper surfaces of the landform together with the presence of termite covers constructed on the stems of trees at Sites E and F. The presence of these structures was also recorded at locations on the batters. These structures and dead and damaged wood were examined in the field for the presence of active termite colonies; the ecological strategies of the termites were inferred from the activities of the termites, the presence or absence of stored food materials and the major taxonomic groups to which the termites belonged.

27
6.3 Trenches A backhoe was used to excavate six large trenches at the principal study sites to permit examination and description of the covers and upper part of the waste rock. The locations of the six sites together with exposures, gradients and dimensions are presented in Table 13 and Figure 10.
100m
10
17
A11
1218B
13
19
D
14
C
16
E15
DIVERSION CHANNEL
White�s overburdenpost -rehabilitation
N
AA�
B�B
D�D
CE
F
G
Figure 10. Location of probe holes (▲), lysimeter pairs (●) and trenches (-) on
White�s Heap Table 13. Locations and dimensions (m) of the six major trenches dug for
examination of the covers on White�s heap
Site Location Gradient Exposure Length Breadth Depth A 52L0717926,
8562273 1-2° NNW 3.2 1.5 >1.1
B 52L0717838, 8562420
3° N 1.6 4.0 1.4
C 52L0717910, 8562603
5° NW 3.3 1.5 0.75
D 52L0717885, 8562648
7° WNW 3.3 1.6 1.5
E 52L0717914, 8562273
6° NNW 2.5 0.8 1.13
F 52L071794 7, 8562663
3 NNW 2.7 0.75 1.2
Sites A, B and D were located at three levels on the upper surfaces of the dump and are representative of the broader area of the dump surface. Site C was located in an area close to sites D and E. This site had been subjected to acid run on which had destroyed the original vegetation cover in a triangular patch ca. 50 m wide at the top and 33 m in a

28
downslope direction. This had destabilised the site surface and subsequent erosion had stripped the finer materials from the surface of the site leaving a lagged surface. Some of the stripped materials had been deposited at the downhill end of the slope. Site E was located where a self-sown individual of Acacia auriculiformis had established. The tree was approximately 8 m tall and had a stem diameter of 200 mm (dbh). Site F was located on a bund wall where a self-sown individual of Eucalyptus sp. had established. The tree was approximately 5.5 m tall; the stem was split into two leaders with diameters of 120 and 70 mm (dbh), respectively. The walls of the trenches were cut back with a spade to remove smear marks and to allow observation of cover- and upper-waste features. Photographs of the trench walls were taken to provide a pictorial record of layer thicknesses, compositions and structure. Records were made of selected soil profile properties: the thicknesses of each layer present and the predominant Munsell colours of the cover materials and wastes. Observations of stoniness, general texture and structure were made and the presence of macropores, voids, galleries and other structures built by termites and ants were noted. Samples were taken from each layer to determine selected chemical and physical properties. The depth distributions of fine (1-2 mm) and very fine (<1 mm) roots within the covers were assessed using a procedure presented by McDonald and Isbell (1990). In this procedure, the number of roots present are assessed in 100 mm by 100 mm square areas marked out on the trench face at one location. Where present (trenches E and F), the distributions of larger (>5 mm diameter) roots were assessed over all trench faces and the numbers of occurrences of roots penetrating the waste layers were also recorded. After each of the profiles exposed by the trenches had been logged, the backhoe was used to create benches at the top of each stratum within the cover sequence at Sites A, B and D. These benches were used to determine oxygen flux and water infiltration rates. Not all layers could be examined as some were too rocky to obtain seals for the infiltrometer and flux gauge. Shallow trenches were also excavated on bare patches throughout the site to ascertain the cover depths (Plate 1). Locations of these patches are given in Table 14 together with depth of cover.

29
Plate 1. Trench excavated on bare patch to ascertain depth of cover Table 14. Locations of shallow trenches dug to permit examination of the covers in
bare patches
Designation Location (AMG) Cover thickness (cm) 1 52L0717810 8562521 35
2 52L0717628 8562647 25
3 52L0717791 8562642 25
4 52L0717786 8562598 3-5
At the completion of the field trip, each trench was infilled, compacted and grass replaced on the surface. Materials were replaced in reverse order to their excavation. It should be noted that, because of the small number of study sites and the method by which the sites were selected, the results from the trenches cannot be taken to be necessarily representative of the whole cover.
6.4 Field Tests Lysimeters Each of the 10 lysimeters on White�s heap was pumped (or filled if necessary) to a reference. During the wet season, a lysimeter will generally need to be pumped to remove water that has been collected; during the dry season water will usually need to be added to set a lysimeter back to its reference level. The lysimeter locations are provided in Table 15 and are shown in Figure 6.

30
Table 16 lists the lysimeters and volumes of water pumped in April 2002. Table 15. GPS locations of lysimeter pairs on White�s heap
Lysimeter Location (AMG) A 52L0717895 8562427 B 52L0717817 8562427 C 52L0717642 8562427 D 52L0717971 8562549 E 52L0717696 8562641
The volume collected, averaged over all the lysimeters and corrected for wicking losses, has been incorporated in Figure 11. The figure shows average infiltration over the 2001/2002 wet season, together with rainfall measured the pluviometer near the base of White�s heap.
Figure 11. Annual rainfall and the average (over the ten lysimeters) �best�-estimate
infiltration rate into White�s heap for each year as a % of annual rainfall (Kuo et al., 2003)
Water Infiltration The water infiltration rate was determined using a simple falling head technique. A 500mm diameter, 200mm high steel ring was hammered into the surface and the outside sealed with bentonite. A geotextile was placed on the surface and water (approximately 20L) poured in.

31
The fall in head was measured using a graduated scale. This procedure was repeated after approximately 30 minutes to obtain a measure of saturated infiltration rate. Infiltration rates were obtained on the undisturbed grass surface, each of the exposed benches and on the upper surface of the waste rock. Cumulative infiltration was plotted against time and the infiltration rate determined from the slope of the curve where linear, indicating steady flow rate. Oxygen Flux Where diffusion is the dominant gas transport mechanism, the oxygen flux [kg(O2) m-2 s-1] provides a measure of the rate of transport of oxygen through a surface to underlying material where it is consumed. In White�s heap, oxygen is consumed predominantly by the oxidation of pyrite in the waste rock but it may also be consumed in the cover materials by biological activity. Measurements were made using the ANSTO surface oxygen fluxmeter. The instrument and the method have been described by Timms and Bennett (2000). The surface fluxmeter consists of an open-bottomed cylinder which is embedded 10 mm into the surface of a cover or waste rock dump (see Figure 12). Once it is placed on the surface, the oxygen concentration within the cylinder falls as oxygen diffuses into the underlying dump. The rate of decrease in oxygen concentration is used to determine the oxygen flux. A series of oxygen flux measurements were made were made through the cover on White�s heap at four locations, at the end of the wet season and again at the end of the dry season. At each location the oxygen flux was measured on the exposed surface prior to excavating each successive layer of the cover. A final measurement was made once the waste rock under the cover was exposed. The purpose of the measurements was to quantify the variation in oxygen flux through the cover as a function of location, season and cover layer.
Cover ordump surface
Oxygen flux
Oxidising waste rock
Fluxmeter
Air
Figure 12. Schematic of the oxygen fluxmeter in use
6.5 Sampling The most intense sampling was undertaken at Sites A-D. Undisturbed samples were collected in short cores (75mm diameter x 55mm long) at intervals down the profiles. These were immediately sealed for transport to Adelaide for geotechnical testing. In addition, approximately 1kg grab samples were taken for further analyses/testing, including mineralogy and geochemistry. Table 16 details the samples collected from the trenches.

32
Two seepage waters, and a ferruginous precipitate from a subsoil outlet on the NE side of the heap were collected for characterisation. On arrival, the rip-rap in toe drains encircling the dump was covered with a white precipitate. One sample from the toe drain on the NE side of the dump was collected for identification. Table 16. Details of samples collected from trenches
(a) Undisturbed Site Depth
(cm) Sampling notes
A 0-5 10-15 30-35 50-55 65-70
Compacted surface layer Top of uncompacted �loam� layer Top of uncompacted �loam� layer
Top of gravelly clay layer Within gravelly clay layer
Base of gravelly clay layer B 0-5
10-15 30-35 50-55 75-80
Compacted surface layer Top of uncompacted �loam� layer
Top of gravelly clay layer Within gravelly clay layer
Base of gravelly clay layer C 0-10 Clod sample D 0-5
10-15 30-35 50-55 65-70
Compacted surface layer Top of uncompacted �loam� layer
Top of gravelly clay layer Within gravelly clay layer
Base of gravelly clay layer
(b) Grab samples Site Depth
(cm) Sampling notes
A 0-12 40-50 50-60 75-85
Bag sample of surface layer Bag sample of gravelly clay Bag sample of gravelly clay
Bag sample of waste rock material B 0-12
50-60 80-90
Bag sample of surface layer Bag sample of gravelly clay
Bag sample of waste rock material C 0-15
15-25 Bag sample of gravelly clay
Bag sample of waste rock material D 0-12
30-40 70-80
Bag sample of surface layer Bag sample of gravelly clay
Bag sample of waste rock material
6.6 Laboratory Testing/Analyses XRD mineralogy of solids � The samples were ground in an agate mortar and pestle and pressed into aluminum holders. XRD patterns were recorded with a Philips PW 1800 microprocessor controlled powder diffractometer using CoK radiation, variable divergence slit and graphite monochromator. The diffraction patterns were recorded in steps of 0.02°

33
2θ/minutes with a 3 second counting time per step and logged to data files on an IBM-compatible PC for analysis. XRF composition of solids � the major elements were determined using a fused-button technique at CSIRO Exploration and Mining, Perth. Trace elements were determined using a pressed powder technique. Detailed testing was conducted in accordance with AS1289 � Australian Standard Methods of Testing Soils for Engineering Purposes. All testing was undertaken at the Adelaide laboratories of CSIRO Land & Water. The following program was undertaken: Geotechnical • moisture content AS1289.B1.1 • bulk density • particle density AS1289.C5.1 • void ratio • particle size analysis AS1289.C6.1 • dispersivity AS1289.C8.1 • liquid limit/plastic limit AS1289.3.9, AS1289.3.2.1 • plasticity index AS1289.3.3.1 • linear shrinkage AS1289.3.4.1 Each sample was separated into the fine earth fraction (< 2.4 mm) and the gravel fraction by dry sieving. The particle size distribution of the gravel fraction was determined by dry sieving in accordance with AS 1289 C6.1. The particle size distribution of the fine earth fraction was determined by sedimentation (to determine clay and silt fractions) and wet sieving to determine fine and coarse sand fractions. Mineralogy/Geochemistry • XRD mineralogy of solids • XRF composition of solids • Standard 1:5 leach test • EC, pH, composition of leachate • EC, pH, composition of seepages
7. FIELD RESULTS The results of the sampling conducted are considered under the headings of vegetation and the cover characteristics. The cover characteristics are considered under the sub-headings of surface and sub-surface features.
7.1 Vegetation Characteristics The vegetation at sites A, B and D consisted of mosaics of the sown exotic pasture species together with a number of widespread weed species such as Hyptis suaveolens, Sida acuta and Passiflora foetida. The pastures had regrown to some degree following mowing earlier in the season. Plate 2 indicates the mosaic of grass and other species present within Site A.

34
Appendix 1 presents the properties of the vegetation at each of the major study sites including heights, the dominant and other species noted and the structural formation classes as defined by Walker and Hopkins (1990). The dominant species on the upper mown surfaces of the heap were Buffel Grass (Cenchrus ciliaris), Signal Grass (Brachiaria decumbens) and Rhodes Grass (Chloris gayana), with Couch Grass (Cynodon dactlyon) and Red Natal Grass (Melinis repens) also present as common grassy elements. The major legumes of the mown surface areas were Stylosanthes hamata cv Verano with occasional Siratro (Macroptilium atropurpureum). On the surfaces of the heaps, self sown (volunteer) trees and shrubs were largely limited to slopes associated with the drainways and other unmown protected areas such as the erosion control bunds. As indicated, there were a few, widely-distributed patches of sparse vegetation in the otherwise bare area of site C, mostly occurring towards the edges of the bare area (Plate 3). Within the patches, the vegetation was also very sparse and consisted of scattered grasses. Elsewhere in the area there were a few very widely scattered living sedges and grass plants.

35
(a) Area dominated by Buffel Grass (Cenchrus ciliaris)
(b) Area dominated by Couch Grass (Cynodon dactylon)
Plate 2. Two views of the mown pasture at Site A

36
Plate 3. Distribution of the sparse vegetation at Site C The vegetation of the batter slopes consists of a mosaic of grasses and legumes with scattered tree and shrub species (including species of Eucalyptus, Melaleuca, Acacia, Pandanus and palms). The vegetation coverage differs markedly between locations on the batters and ranges from mosaics of patchy mixed vegetation, to areas of monospecific legumes (Calopogonium muconoides, Macroptilium atropurpureum), to almost continuous grasses to extensive sparsely-vegetated or unvegetated areas. Plate 4 illustrates the contrasting vegetation cover of two areas of the batter walls. (a) Batter walls on the northeastern side of White�s heap

37
(b) Batter walls on the western side White�s heap
Plate 4. Two views of the vegetation cover on the batter walls, April 2002
7.2 Cover Characteristics The covers applied over the wastes have been modified by natural soil-forming processes over the more than 17 years of their establishment. Selected properties of the covers are discussed below under the headings of surface properties and the characteristics of the cover profiles. Soil Surface Features A range of surface soil properties were recorded to provide evidence for the stability (or otherwise) of the surface and of the activities of organisms of importance to soil formation and nutrient recycling processes. Litter Layers The litter layers consisted of a diffuse layer of decomposing mown pasture plants (Plate 2). The other litter component was a layer comprising standing dead grasses and other pasture plants that occurred in the mown areas but were more obvious in those areas protected from mowing, such as the bunds and the walls of the waterways. In the mown pasture areas examined (areas associated with trenches A, B, D, E), the litter layer was semi-continuous but thickest in the windrows formed by the mower; it formed a diffuse layer approximately 80 to 150 mm thick, with standing dead grasses up to 300 mm in height. On the bunds and other protected areas (as in area F), standing dead plants regularly occurred to heights of 800 mm or more and overlay a thin layer of surface litter. Areas with trees had litters also comprising the decomposing phyllodes of the Acacia species or leaves of the Eucalyptus and other species with a fine woody litter component beneath the canopies.

38
Cryptogam Surfaces During the dry season, cryptogam crusts comprise a thin (1.0-1.5 mm), sometimes irregularly-cracked film formed of the structures of the lower plants that have colonised the surfaces during higher rainfall periods (Plate 5). The occurrence of these films implies the presence of surface water films for periods during the wet season; it is also a useful indication of surface stability. Cryptogam crusts were found on the soil surfaces at Sites A, B, D and E. They did not occur at Site C because of the continuous surface lag and were not observed at Site F where a thin raindrop impact crust was found on the sloping bund surface.
Plate 5. A cryptogam crust on the surface of the soil near Trench D; note also the
incipient organic A1 horizon in the lateral view. Surface Stoniness The upper vegetated surfaces of the heap (as in areas A, B, D and E) had stoniness values estimated at from 1 to 5% of the surface, although most estimates are at the lower end of this range. Bare areas were usually covered by a stony lag, as in area C. The bund wall (site F) had a stoniness cover of 10 to 20% and this may have resulted from previous surface erosion. Surface Macropores and Surface Micro-relief Surface macropores are formed through the burrowing activities of a range of soil animals. The groups forming such structures on White�s heap are predominantly ants and termites.

39
The pores observed during the present study ranged from 3 to 15 mm in diameter although most were in the range 3 to 5 mm. Such pores have a patchy distribution and were observed across most surface areas of the heap. Ant and termite nests were also distributed across the surfaces of the heap. Ant nests were sparsely distributed, and the nests were relatively small. Some were grass-seed feeders as indicated by the discarded husks surrounding the nest entries. The effects of termites were more widely apparent. Mounds (often truncated) and other more ephemeral structures were present on the mown surfaces, in protected locations such as the slopes of the waterways and on the bunds. Mounds and other structures were also present on the batters. Termites construct fragile earthen covers over decomposing plant materials on the surface and feed beneath the shelter that these provide. Such structures were occasional to common in the mown areas (A, B, D, E) but were not noted at areas C or F. The distributions of termites and their mounds are considered in more detail below. Little other micro-relief was apparent on the surface of the dump apart from occasional burrowing caused by small mammals or reptiles. Termites and Termite Mounds Termite mounds were examined at a range of locations on the upper surfaces of White�s heap and at several locations on the batter slopes. Table 17 presents the heights of the termite mounds together with the taxonomic group and ecological strategies of the termites present. The termites were only identified in the field and, with the exception of Mastotermes darwiniensis, were therefore only able to be determined to broad grouping - family or sub-family. Table 17. Sizes of the 18 termite mounds examined together with the taxonomic
category and probable ecological strategies of the termites that constructed them
No. Height
(mm) Taxonomic grouping
Possible ecological strategy
2 350 Mandibulate Detritus feeder 4 330 Mandibulate Detritus feeder 5 350 Mandibulate Detritus feeder 7 670 Mandibulate Detritus feeder 8 660 Mandibulate Detritus feeder 9 700 Mandibulate Detritus feeder 12 330 Mandibulate Detritus feeder 13 200 Mandibulate Detritus feeder 15 320 Mandibulate Detritus feeder 16 300 Mandibulate Detritus feeder 17 nr Mandibulate Wood feeder 1 680 Nasute Detritus feeder 3 650 Nasute Detritus feeder 6 680 Nasute Detritus feeder 10 570 Nasute Grass harvester 11 870 Nasute Grass harvester 14 450 Nasute Detritus feeder 18 nr Nasute Grass harvester

40
Of the 18 predominantly earthen mounds examined at 14 locations on the dump, 11 contained mandibulate termites, probably Microcerotermes spp. These mounds were widely distributed on the batters and small and truncated mounds were occasionally found in the mown areas. Most are probably detritus-feeding species, although some species were noted to be associated with the bases of trees and with runways extending up the trees suggesting that they may be utilising woody arboreal resources. The remaining seven mounds belonged to higher termites of the subfamily Nasutitermitinae and may have included up to four species. One species (3 mounds) had copious stored grass in its mounds and may have been the widespread species Nasutitermes triodiae reported by Ryan (see Section 5.2, above); it is possible that one of the other species of this subfamily present was the widespread and variable species Nasutitermes longipennis. This highly polyphagous species occurs commonly in disturbed environments, including mine sites in the northern Australian tropics. A few mounds were found on the batter walls. These appeared to belong to detritus-feeding species, although a mound of a grass-harvesting species (possibly Nasutitermes triodiae) was also found. The widespread, extremely polyphagous species Mastotermes darwiniensis was found in the dead wood of Acacia auriculiformis at one location on the upper batter wall (Plate 6). It is probably more widespread in woody materials on the dump than is indicated by this one record. Termites were found to a maximum depth of 0.55 m at which depth a gallery containing living termites was intersected in the clay layer in the trench at Site A. Termite species that nest underground (subterranean or non mound building species) are ubiquitous components of the termite faunas of tropical Australia (Braithwaite et al., 1988) and are common early colonisers of rehabilitated mine sites in tropical Australia (see, for example, Spain and Andersen, 1998). While these species nest underground, they often feed at least partly on surface materials. It is highly likely that several species of these termites are present (and populous) on both the batters and upper surfaces of White�s Dump.
Plate 6. A soldier of Mastotermes darwiniensis found in the dead wood of Acacia
auriculiformis

41
Erosion There was no surface erosion detectable at sites A, B, D, E or F. However, at site C, there was continuing, partly-stabilised sheet erosion. At the downhill end of the bare area, materials transported from upslope had been deposited forming an area of finer texture. This had been largely stabilised by the pasture species that had established thereon. The other bare sites examined were of considerably smaller area than Site C, and the majority occur on the western side of the landform. As with Site C, a few samples of waste rock were exposed on the surface together with a lateritic lag (Plate 7). There was little evidence of sheet wash erosion at these sites due to lesser gradients and smaller areas than Site C. Each of the major drainages on the upper surface of the landform, the berm constructed on the batter and outlets for drop down drains are lined with rip rap and have geotextile fabric basement protection. There is no evidence that the rip rap has been compromised. There are some pasture grasses and plants growing within the drains and this has the effect of slowing water flow and thus preventing erosion. However this may lead to overtopping of the drains, although there was no evidence of this noted during the field work. It was not possible to examine the integrity of the geotextile. A small volume of water was ponded in the northern berm drain and some rip rap was covered with a white precipitate. At the time of the field work, each of the berms on the upper surface was intact and covered with lush vegetation including some larger shrubs and trees. It appears that these berms are very effective in controlling surface water flow. The batter slopes are covered with rock mulch and, as noted above, there is a drainage berm parallel to the natural ground surface around the immediate base of the landform. Erosion on the batters, which are partially covered by grasses, shrubs and trees, is minimal. There has been some minor down-slope movement of the rock mulch on the NE corner of the landform. This coincides with the only evidence of seepage from the batters.

42
Plate 7. Wastes outcropping at the surface at a site of limited extent. This and Site
C were the only incidences of this observed on White�s heap Cover Profile Features Overall cover thickness The overall maximum and minimum thickness of the covers in each of the six main trenches excavated is presented in Table 18. As can be seen from the Table, the cover thickness at five of these locations generally ranged between 0.50 and 0.92 m. The cover at Trench C is a clear exception to this, and the maximum thickness remaining at this site was only 0.16 m. At four other sites examined (Table 14), the covers had either eroded off or had not been placed to the specified depths. Over these sites, the covers ranged from 0.03 to 0.35 m with no evidence of separate layers apart from a surface lag. At one small site, no cover was present, leaving stony wastes outcropping at the surface (Plate 7). Table 18. Minimum and maximum thickness of covers recorded from the trenches
excavated at each site
Site Minimum cover thickness (m)
Maximum cover thickness (m)
A 0.65 0.77 B 0.70 0.92

43
Site Minimum cover thickness (m)
Maximum cover thickness (m)
C ca. 0.10 0.16 D 0.50 0.82 E 0.60 0.67 F - 0.93 (top of bund)
Individual layer thickness There was considerable variation in the measured thickness of the three layers. It is not clear how much of this variation is due to uneven application of materials or whether this variation represents settling or compaction. It is not possible to determine how much settling and compaction has taken place, but it is assumed that this would have occurred largely in the initially less-compacted upper and middle layers. Table 19 presents the means, standard deviations and 95% confidence intervals of the thicknesses of the three layers that form the covers for trenches A, B, D and E at the points where they were measured. It should be noted that Trench C was located on an eroded area and that Trench F was located on a bund wall and thus has a very thick middle layer, similar to the material of the bund. Appendix 2 presents detailed information on the properties of the individual layers in each trench and Appendix 3 presents details of the distributions of roots in the different layers. Table 19. The thicknesses (m) of the individual layers in the excavated trenches
Site Layer 2A Upper 1B
Middle 1A
Lower All
A 0.12 0.22 0.43 0.77 B 0.14 0.17 0.52 0.83 D 0.07 0.32 0.38 0.77 E 0.12 0.28 0.21 0.61
Mean 0.11 0.25 0.39 0.75 Std dev. 0.03 0.07 0.13 0.09
95% conf. intervals
0.06-0.16 0.14-0.36 0.18-0.59 0.59-0.90
C - *0.04 0.14 0.14 F 0.15 0.52 0.21 0.88
*0.02 m lag overlying a dark brownish red gravelly layer. Individual layer properties In all trenches except C, the three layers could be largely differentiated on a combination of texture, structure, colour and biological properties (Plates 8 and 9). However, some difficulty was experienced in reliably discriminating between the upper two layers at some locations in the trench at site F. Lower layer (Layer 1A) This is the clay-rich layer that was applied immediately over the wastes. This layer was designed to have a low hydraulic conductivity, to reduce the water flux into the underlying waste. Ideally, it should have been a massive, compacted layer of uniform thickness and composition, although considerable variation in structure, texture and layer thickness was evident in the cover profiles examined in the trenches.

44
On average, the mean thickness of the lower 1A layer was more than two and a half times greater than the minimum of 0.150 m specified (Table 6). This latter value was substantially less than the lower 95% confidence interval for the thickness of this layer (Table 19, above). The texture of the fine earth fraction of this layer was a sandy clay, and it is therefore lighter in texture than indicated in Table 6. Gravel contents ranged from 7 to more than 40% by weight (see Section 8.2, below). Within this layer, lighter-textured materials formed discrete inclusions (Plate 8) that are likely to have reduced its effectiveness. This layer appeared to be basically a massive compacted clay with embedded gravels and stones. However, in some areas, the clays had contracted to form large internal blocks with a horizontal interval of ca. 0.3 m and this is consistent with the linear shrinkage properties presented in Table 24 (below). Between the faces of these blocks, there was evidence of dark staining due to organic matter and perhaps iron oxides (Plate 12, below). As indicated below, roots were using such planar voids as conduits to penetrate the clay layer.
Plate 8. Profile characteristics of Trench B. Note the thickness of the clay layer (ca.
300 to 480 mm) at this location in the pit and the gravelly texture and friable nature of the underlying layer
The predominant Munsell colour of this layer was dark red, although colours ranged from dark reddish brown to red. Inclusions within this layer included quartzite (which ranged from near white to light red), waste rock and other materials. As illustrated in Plates 8 and 9, this layer could be readily discriminated from those above and below by both colour and texture in all pits.

45
This layer was not apparent in the covers examined in pits C and F. The stony lag at the surface of the former site protects the remaining underlying materials that overlie the 1A clay-rich materials. Middle layer (Zone 1B) This layer was designed to act as a water storage during the dry season for plants growing on the surfaces of the dump. It is also variable in properties and thickness. The mean layer thickness (0.25 m, Table 19) is at the upper part of the thickness (0.15 to 0.25 m) specified in Table 6. It is a gravel-rich layer (laterite fragments, nodules, etc.), and total gravel content ranged between 39 and 50% by weight (see section 8.2). The fine earth fraction is a clayey sand in texture with up to 26% clay by weight: it is therefore heavier in texture than indicated in Table 6. This layer is massive and unstructured. The upper part of this layer had a similar colour to that of the surface layer, although the materials as a whole tended to more yellow hues. The lower part of this layer had a more pronounced yellow colour than the upper (Plate 8); this was variably developed but was present in all pits. It is considered to result from the reduced redox state of the cover materials in the lower part of this layer consequent on regular extended flooding of this section of the profile during the wet season. In Trench D, a thin and discontinuous black pan of ca. 5 mm thick had formed at the base of this layer (Plate 11, below.) The pan material was predominantly oxides; no jarosites or organic matter were included. This middle layer appears to have been absent or largely eroded off in the area of Pit C leaving a thin (0.04 m) layer underlying the 0.02 m lag. In this location the layer of finer materials remaining between the lag and the 1A clay layer may comprise part of the 1B layer, possibly mixed with gravel remaining from the upper 2A layer. Upper layer (Zone 2A) This is a gravel-rich layer placed to inhibit erosion and has the highest gravel content of the three layers: 50 to 70% by weight (see Section 8.2, below). At an average thickness of 0.11 m (Table 19), the upper layer was notably thinner than the minimum thickness of 0.15 m specified in Table 6. The fine earth was a clayey sand with a clay content of 15 to 20% by weight. It is therefore of much finer texture than indicated in Table 6. At some locations the surface of the soil has started to differentiate into an organic layer 0.02- 0.03 m thick, and this may represent the initial development of an A horizon. This is illustrated in Plate 5 above and underlies the cryptogam crust. This incipient A horizon comprises a near-surface concentration of organic materials with densely distributed very fine and fine roots. Below this layer, the soil material was compacted and cloddy and, on disturbance, it characteristically breaks up into irregular clods with greater dimensions in the horizontal than the vertical. This may be a consequence of compaction and is likely to have been caused by traffic associated with materials placement and with subsequent mowing and fertilising. This layer was apparent in Trenches A, B, D and E but had been completely eroded from the surface of the bare area surrounding Trench C. In Trench F, this layer was difficult to differentiate from the underlying layer and may have been partly eroded off, or never placed.

46
Plate 9. Profile characteristics of Trench E. Note the increasingly yellow colour with depth in the middle layer and the presence of roots in the upper part of the wastes
This layer is traversed by a network of voids and largely sub-horizontal galleries produced almost entirely by termites. These voids are illustrated in Plate 10. Such networks are apparent in the absence of surface termite mounds and are probably created by the many subterranean species that nest cryptically in the soil.

47
Plate 10. Voids and galleries excavated by termites within clods in the upper layer of
the cover
7.3 Depth Distributions of Roots The depth distributions of very fine (<0.01 m) and fine (0.01 to 0.02 m) root distributions down the cover profile and in the upper wastes are presented in Fig. 13 below for one profile location in all trenches, except C. Detailed tabulations of these data are presented in Appendix 3. In the three trenches A, B and D, only very fine and fine roots were present, and this is likely to be representative of the situation over most of the upper surface of the dump. However, the distributions of the coarser tree roots (>0.05 m) was examined in the walls of Trenches E and F. The upper 2A layer is heavily infiltrated with roots, especially in the top 0.03 m. At a smaller scale than the clods, some combination of fine roots, mycorrhizal fungi and root exudates is responsible for the root-associated aggregate structure present. As indicated above, the structure of the upper layer is cloddy, although voids (macropores >300 µm diameter) formed by social insects form a substantial network through the upper layers. The middle 1B layer has little structure even though roots ramify throughout it. Root density is reduced in comparison with the layer above and declines with increasing depth in the layer. In trench D, fine and very fine roots are concentrated just above the discontinuous pan that occurs at 0.38 m (Plate 11).

48
Plate 11. Concentration of roots above the discontinuous pan in Trench D In order to reduce its permeability, the lower clay layer was heavily compacted when the covers were constructed. Nevertheless, fine roots have now penetrated this layer extensively, albeit at a much lower density than in the layers above. In some trenches, fine and very fine roots are highly concentrated in the upper part of this layer with root density diminishing progressively with increasing depth within the layer. Roots also penetrate this layer through the planar voids that separate the structural blocks that occur in this layer (Plate 12).
Plate 12. Concentrations of roots in the planar voids that occur between the
structural blocks of the 1A clay layer, trench A

49
Fine and very fine roots were observed within the waste materials at many locations in all the trenches, excluding Trench C. They were noted to extend to depths of at least 0.24 m below the waste:cover interface. Trench E Acacia auriculiformis is a highly acid-tolerant species. It is known to form a dense root mat close to the surface and is therefore a highly effective species for erosion control (Pinyopusarerk, 1990). As illustrated, the larger roots of this species (Plate 9) were mostly confined to the upper two layers, although some larger roots were also present in the clay layer (Zone 1A). Smaller roots were also evident in the clay layer and in the upper section of the wastes. It is clear that, while forming a predominantly-shallow root mass, some roots of this species do extend to greater depths (see also Ryan, 1992). This is seen as necessary to access water during the drier periods of the year. Trench F While a dense network of small and large lateral roots ramified throughout the upper two layers, major roots extended well into the lower clay layer. Immediately below the stem, the tap and major lateral roots of the Eucalyptus sp. extended at least 0.10 m into the clay layer, and roots were observed at least 0.05 m below the cover:waste Interface. Based on work conducted at Rum Jungle South and Rum Jungle Mines (Milnes et al., 1990; Ryan, 1992), it was considered that a range of tree species (including the common local species Eucalyptus tetrodonta) would be capable of breaching engineered covers of the type used.

50
Figure 13. Depth distributions of very fine (<1 mm) and fine (1-2 mm) roots in the
covers. Data are the numbers of roots recorded in 0.01 m2 areas marked on the trench faces

51
Figure 13. (cont.)
7.4 Infiltration Infiltration rates of the various cover layers and upper surface of the waste rock measured in the field are detailed in Table 20. These show that both unsaturated and saturated infiltration rates lie within the range 5.7 x 10⁻⁵ to 1.4 x 10⁻⁶ m/s, which is 1-3 orders of greater than the original specifications (Table 6). Table 20. Infiltration test results
Infiltration Rate (m/s) Site Depth (cm) Unsaturated Saturated
Comment
A 0 12 40 75
3.7 x 10⁻⁵ 5.7 x 10⁻⁵ 4.9 x 10⁻⁶ 1.4 x 10⁻⁵
2.2 x 10⁻⁵ 1.7 x 10⁻⁵ no test
1.4 x 10⁻⁵
Compacted surface layer (grassed) Top of gravelly loam layer Top of gravelly clay layer Top of waste rock
B 0 12 50
2.3 x 10⁻⁵ 4.9 x 10⁻⁶ 2.5 x 10⁻⁵
1.9 x 10⁻⁵ 1.4 x 10⁻⁶ 2.2 x 10⁻⁵
Compacted surface layer (grassed) Top of clayey loam layer Within gravelly clay layer
C 0 15
1.5 x 10⁻⁵ 9.2 x 10⁻⁶
1.0 x 10⁻⁵ 8.6 x 10⁻⁶
Compacted surface layer (bare) Top of waste rock
D 0 12 30
2.7 x 10⁻⁵ 5.8 x 10⁻⁵ 1.9 x 10⁻⁶
1.9 x 10⁻⁵ 3.7 x 10⁻⁵ no test
Compacted surface layer (grassed) Gravelly loam layer Within gravelly clay above �organic pan� layer

52
When excavating the trenches, it was noted that all layers, including the uppermost portions of waste rock, were moist. This was confirmed during laboratory determinations of moisture content (Table 23). There is increasing moisture content with depth in the cover material with the clay layer having the highest content. The underlying waste rock has significantly lower moisture content than the overlying cover (except at Site B), but values are sufficiently high to suggest that infiltration into the waste rock is ongoing.
7.5 Oxygen Flux A series of oxygen flux measurements were made through the cover on White�s dump at four locations (A, B, C and D) at the end of the wet season. At each location the oxygen flux was measured on the exposed surface prior to excavating each successive layer of the cover. A final measurement was made once the waste rock under the cover was exposed. Table 21 presents the oxygen fluxes through the exposed surface as the cover layers were removed successively. The values have been averaged over the four measurement locations. Very conservative estimates of the uncertainty in the results have been made. Table 21. Average oxygen flux through the White�s heap cover system at the four
trench locations in April 2002
Layer Oxygen flux (kg m-2 s-1) end of wet season
Zone 2A �gravelly sand (all 3 layers present) (0.44 ± 0.30) ×10-7
Zone 1A � clay (one layer present) (1.6 ± 0.8) ×10-7
Waste rock (cover removed) (2.2 ± 0.9) ×10-7
Table 22 shows the ratio between the oxygen flux into the exposed waste rock and the flux into the surface of the intact cover, using the values presented in Table 21. This ratio provides a measure of the effectiveness of the cover in reducing the oxygen flux and hence gives an indication of the amount by which the cover may reduce the overall oxidation rate in White�s dump. Table 22. Effectiveness of the cover in reducing oxygen flux in April 2002
Oxygen flux (kgm-2s-1) Season
No cover Cover
Ratio (no cover/cover
Wet season 2.2×10⁻⁷ 0.44×10⁻⁷ 5.0 By using the moisture content of the cover materials presented in Table 23, taking the porosity and bulk density of all the materials as 0.3 and 1.8 t m-3 (Table 6, zone 1A material) respectively, the degree of water saturation was estimated. From these estimates the
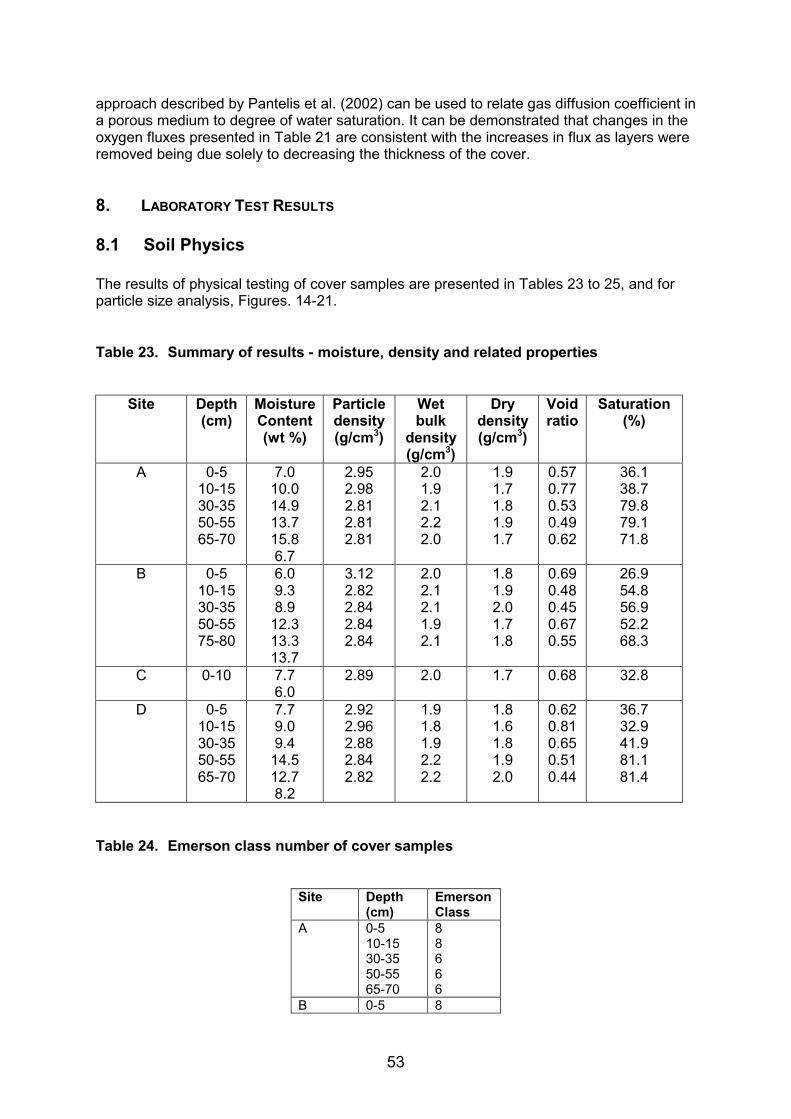
53
approach described by Pantelis et al. (2002) can be used to relate gas diffusion coefficient in a porous medium to degree of water saturation. It can be demonstrated that changes in the oxygen fluxes presented in Table 21 are consistent with the increases in flux as layers were removed being due solely to decreasing the thickness of the cover.
8. LABORATORY TEST RESULTS
8.1 Soil Physics The results of physical testing of cover samples are presented in Tables 23 to 25, and for particle size analysis, Figures. 14-21. Table 23. Summary of results - moisture, density and related properties
Site Depth (cm)
Moisture Content (wt %)
Particle density (g/cm3)
Wet bulk
density (g/cm3)
Dry density (g/cm3)
Void ratio
Saturation (%)
A 0-5 10-15 30-35 50-55 65-70
7.0 10.0 14.9 13.7 15.8 6.7
2.95 2.98 2.81 2.81 2.81
2.0 1.9 2.1 2.2 2.0
1.9 1.7 1.8 1.9 1.7
0.57 0.77 0.53 0.49 0.62
36.1 38.7 79.8 79.1 71.8
B 0-5 10-15 30-35 50-55 75-80
6.0 9.3 8.9
12.3 13.3 13.7
3.12 2.82 2.84 2.84 2.84
2.0 2.1 2.1 1.9 2.1
1.8 1.9 2.0 1.7 1.8
0.69 0.48 0.45 0.67 0.55
26.9 54.8 56.9 52.2 68.3
C 0-10
7.7 6.0
2.89 2.0 1.7 0.68 32.8
D 0-5 10-15 30-35 50-55 65-70
7.7 9.0 9.4
14.5 12.7 8.2
2.92 2.96 2.88 2.84 2.82
1.9 1.8 1.9 2.2 2.2
1.8 1.6 1.8 1.9 2.0
0.62 0.81 0.65 0.51 0.44
36.7 32.9 41.9 81.1 81.4
Table 24. Emerson class number of cover samples
Site Depth (cm)
Emerson Class
A 0-5 10-15 30-35 50-55 65-70
8 8 6 6 6
B 0-5 8

54
Site Depth (cm)
Emerson Class
10-15 30-35 50-55 75-80
8 6 6 6
C 0-10 6 D 0-5
10-15 30-35 50-55 65-70
8 8 6 6 6
These data indicate that the cover materials are unlikely to disperse under normal conditions. The other properties, liquid and plastic limit and linear shrinkage, indicate that some desiccation cracking is to be expected. It was difficult to distinguish between desiccation cracks and root channels as both are infilled with coarser material. Table 25. Results of liquid and plastic limits and linear shrinkage tests
Site Depth (cm)
Liquid limit (%)
Plastic limit (%)
Plasticity Index
Linear Shrinkag
e (%) A 0-5
10-15 30-35 50-55 65-70
34 31 39 56 42
23 20 18 28 18
11 11 21 28 23
5.9 6.7 9.2 15.8 10.7
B 0-5 10-15 30-35 50-55 75-80
34 29 29 33 42
21 20 19 17 18
13 9 9 15 24
4.7 7.1 7.3 8.4 10.0
C 0-10 26 21 4 8.3 D 0-5
10-15 30-35 50-55 65-70
32 35 37 40 27
22 24 21 18 18
10 11 16 22 9
7.3 7.1 7.5 8.0 9.3
The significant data in Table 23 are moisture content (described in Section 7.4, above), dry density and saturation. Dry density is variable throughout the three profiles sampled, with a slightly higher value being obtained for near-surface samples which have been completed by vehicular movement. All values are greater than 1.6 t/m3 with several exceeding 2.0 t/m3. There is an increasing percentage saturation with depth in each of the three profiles, with the cover material immediately above the waste rock (impermeable clay layer) having the highest percentage saturation. All samples tested have a dispersivity in Emerson class 6 or 8 (Table 24). All samples are non-dispersive with those in class 8 also being non-slaking and non-swelling.

55
8.2 Particle Size Distribution Results of the fine earth determinations are presented in Table 26. Quantities of clay, silt, fine sand and coarse sand are reported as a percentage of the fine earth fraction (i.e. that portion passing a 2.4 mm sieve), whereas gravel is expressed as a percentage of the whole sample. The fine earth fraction was classified by plotting the clay, silt and sand on the ternary textural classification charts (Figs. 14 to 17) below. Table 26. Particle size analysis and classification of the fine earth fractions
Percent of fine earth fraction Site Depth (cm) Clay
(%) Silt (%)
Fine sand (%)
Coarse sand (%)
Gravel (% of
whole)
Classification of fine earth fraction
A 0-5 10-15 30-35 50-55 65-70 70-80*
15.6 19.7 33.0 31.6 34.1 10.4
7.3 8.4 10.9 7.4 4.6 9.2
34.1 32.3 36.1 41.7 46.1 29.4
40.0 37.3 18.2 18.3 13.4 49.1
53.3 50.7 22.8 7.2
10.6 69.3
Clayey sand Clayey sand Sandy clay with silt Sandy clay with silt Sandy clay Clayey sand
B 0-5 10-15 30-35 50-55 75-80 80-90*
19.0 26.1 26.0 26.1 34.6 11.2
7.1 6.9 5.4 7.3 6.0 22.1
27.8 28.4 44.6 33.1 34.3 35.0
43.7 36.8 21.3 31.5 23.5 29.6
71.5 38.9 34.3 40.6 34.6 45.1
Clayey sand Sandy clay with silt Sandy clay with silt Sandy clay with silt Sandy clay Clayey sand
C 0-10 15-25*
32.4 5.0
4.7 11.3
28.1 31.1
31.5 51.6
31.2 75.0
Sandy clay Slightly clayey sand
D 0-5 10-15 30-35 50-55 65-70 70-80*
15.5 20.1 23.2 29.7 34.2 6.0
6.6 8.4 6.0 6.0 3.6 15.4
35.2 35.9 32.0 35.0 35.7 27.7
39.7 33.7 36.8 26.9 24.6 50.5
53.7 47.1 42.4 35.2 17.6 69.1
Clayey sand Clayey sand Sandy clay with silt Sandy clay with silt Sandy clay Slightly clayey sand
* waste rock material Results of the fine earth analyses were combined with the gravel sieve analysis and presented as particle size distribution curves for the whole sample in Figs. 18 to 21 below.

56
0 10 20 30 40 50 60 70 80 90 100
Silt (%)
Sand
(%) Clay (%
)
100
90
80
70
60
50
40
30
20
10
0
0
10
20
30
40
50
60
70
80
90
100
Sand Silty sand
Slightly clayey sand Sandy silt Silt
Clayey sand Clayey &sandy silt
Clayey silt
Sandy claywith silt
Sandy &silty clay
Silty claywith sand
Sandyclay
Clay
Siltyclay
A1A2
A3A4A5
Figure 14. Ternary textural classification � SITE A
0 10 20 30 40 50 60 70 80 90 100
Silt (%)
Sand
(%) Clay (%
)
100
90
80
70
60
50
40
30
20
10
0
0
10
20
30
40
50
60
70
80
90
100
Sand Silty sand
Slightly clayey sand Sandy silt Silt
Clayey sand Clayey &sandy silt
Clayey silt
Sandy claywith silt
Sandy &silty clay
Silty claywith sand
Sandyclay
Clay
Siltyclay
B1
B2B3B4
B5
Figure 15. Ternary textural classification � SITE B

57
0 10 20 30 40 50 60 70 80 90 100
Silt (%)
Sand
(%) Clay (%
)
100
90
80
70
60
50
40
30
20
10
0
0
10
20
30
40
50
60
70
80
90
100
Sand Silty sand
Slightly clayey sand Sandy silt Silt
Clayey sand Clayey &sandy silt
Clayey silt
Sandy claywith silt
Sandy &silty clay
Silty claywith sand
Sandyclay
Clay
SiltyclayC1
Figure 16. Ternary textural classification � SITE C
0 10 20 30 40 50 60 70 80 90 100
Silt (%)
Sand
(%) Clay (%
)
100
90
80
70
60
50
40
30
20
10
0
0
10
20
30
40
50
60
70
80
90
100
Sand Silty sand
Slightly clayey sand Sandy silt Silt
Clayey sand Clayey &sandy silt
Clayey silt
Sandy claywith silt
Sandy &silty clay
Silty claywith sand
Sandyclay
Clay
Siltyclay
D1
D2D3
D4
D5
Figure 17. Ternary textural classification � SITE D

58
Figure 18. Particle size distribution - SITE A
Figure 19. Particle size distribution - SITE B
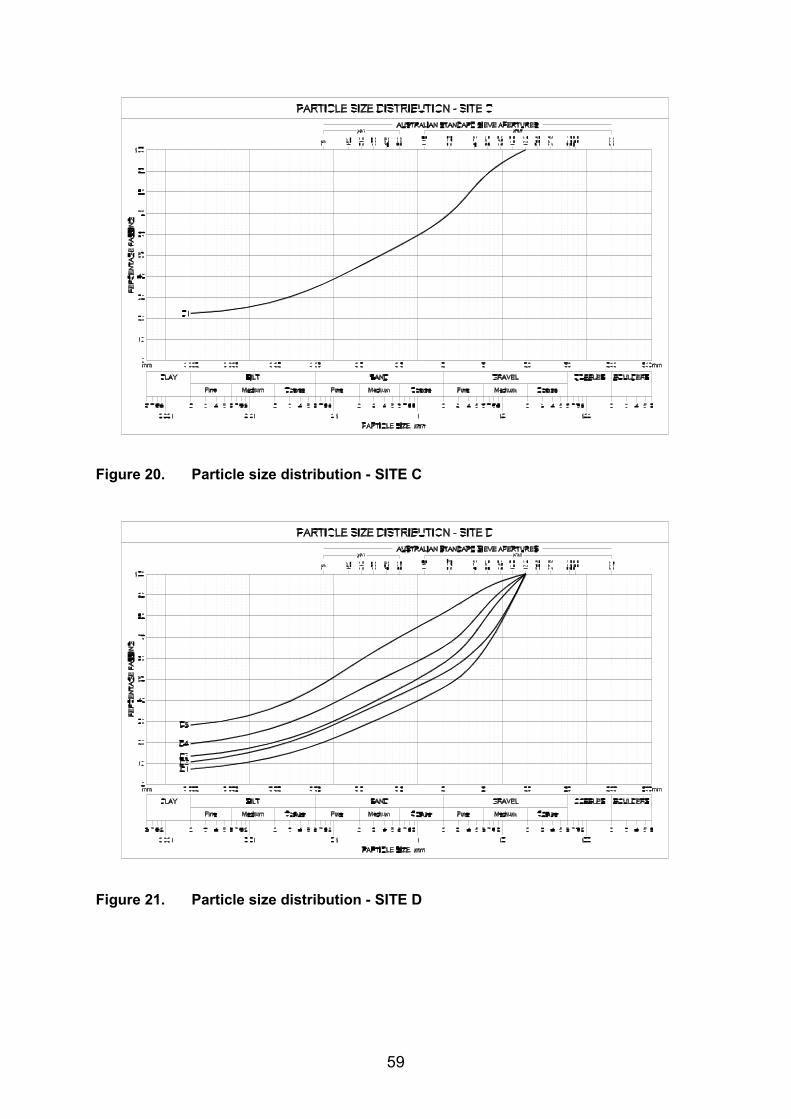
59
Figure 20. Particle size distribution - SITE C
Figure 21. Particle size distribution - SITE D

60
8.3 Mineralogy The mineralogy of grouped samples is presented in Table 27 with a qualitative estimation of contents. White precipitate on rip-tap in drains and other sites is gypsum, evidence of reaction between sulfate-rich pore waters and calcium-bearing minerals in the waste rock. The orange-red-brown precipitate formed at a sub-soil drain on the NE side of the heap was composed almost entirely of goethite with minor detrital quartz, orthoclase and mica from the waste rock. Samples of waste rock from immediately below cover, as well as from the surface and in the cover profile were analysed to determine the degree of oxidation/weathering and nature of the products. The original mineralogy (Table 3 � Intermediate) was quartz, feldspars, mica, chlorite, iron sulfides and clays. In only one sample (from the surface at Site C) is any pyrite present. In all other waste rock samples, oxidation products jarosite or iron oxides are present. Evidence of weathering is provided by the presence of corrensite, an interstratified clay formed by weathering of chlorite. Three samples of the clay (impervious) layer were analysed to characterise the clay. In each case, the dominant clay was kaolinite with traces of chlorite. These samples contain hematite and goethite suggesting that this material is of lateritic origin. There was no evidence of corrensite or other expanding clays. Analysis of �light� or �yellow� coloured layers within the cover profile, indicated that they are composed of kaolin with minor talc and titanium oxides. There was no detectable jarosite in these samples. Finally, a sample of pan/cement from 40cm depth in Trench D was little different from other cover samples despite the presence of a black layer within it. No organic matter was indicated by the XRD trace, suggesting the presence of manganese (see below) or well developed iron oxide crystals. Table 27. Mineralogical composition of cover samples, precipitates and waste rock Sample Mineralogical Composition PRECIPITATES Surface PPT Gypsum Drain PPT Dominant goethite, minor quartz, trace orthoclase and mica WASTE ROCK A 70cm+
Co-dominant chlorite, mica and quartz, minor hematite and goethite, trace orthoclase and possible corrensite (regular chlorite-vermiculite or chlorite-smectite interstratified clay)
B 80cm+ Co-dominant mica and quartz, sub-dominant jarosite, minor probable smectite, trace orthoclase and hematite
Site C Surface Co-dominant kaolin and quartz, sub-dominant mica, trace pyrite and orthoclase
Site C Ox. Waste Co-dominant corrensite and mica, minor quartz, trace orthoclase and hematite D 70cm+ Co-dominant mica, quartz and chlorite (with corrensite), minor jarosite, trace
hematite and orthoclase CLAY BARRIER Site A 50-55cm
Dominant quartz, sub-dominant kaolin, minor hematite and goethite, trace talc, orthoclase and anatase
Site B 50-55cm Co-dominant quartz and kaolin, sub-dominant hematite and goethite, minor mica, trace orthoclase and anatase
Site D 40cm Dominant goethite, minor hematite and quartz, trace kaolin OXIDIZED Site A 25cm
Dominant kaolin, sub-dominant quartz, minor goethite, trace anatase and orthoclase
Site D 50-55cm Dominant quartz, sub-dominant kaolin, minor hematite and goethite, trace chlorite, orthoclase and anatase

61
Sample Mineralogical Composition Site E Yellow Co-dominant quartz and kaolin, minor goethite and hematite, trace talc and
anatase Site F 70cm Co-dominant goethite, hematite and quartz, sub-dominant kaolin, trace talc,
gibbsite and anatase Site C 15cm+ Co-dominant corrensite and mica, minor quartz, trace orthoclase and hematite PAN Site D 40cm
Co-dominant quartz and kaolin, sub-dominant hematite and goethite, minor mica and chlorite, trace gibbsite, orthoclase and anatase
Table 28. Composition of solid samples of cover, waste rock and precipitate for
White�s heap
Sample SiO2 Al2O3 Fe2O3 CaO MgO Na2O K2O TiO2 MnO P2O5 SO3 Total PRECIPITATE
Surface Not analysed Drain 7.11 2.25 61.9 0.05 0.26 0.01 0.18 0.05 0.01 0.02 6.14 78.0
WASTE ROCK A 70+ cm 48.9 18.1 12.2 0.16 5.47 0.11 3.27 0.82 0.35 0.79 0.79 90.4 B 80+ cm 49.1 17.7 8.14 0.12 3.19 0.05 4.98 0.90 0.05 2.38 2.38 86.8 C Surface 65.3 19.6 1.93 0.01 0.18 0.03 1.33 0.86 0.01 0.09 0.90 90.2 C Oxidised 48.4 20.5 7.11 0.09 7.76 0.15 4.64 0.96 0.02 0.65 0.65 90.3 C 15+ cm 44.8 19.0 9.29 0.23 8.92 0.08 3.63 1.40 0.05 0.76 0.76 88.5 D 70+ cm 43.2 19.4 11.0 0.21 6.69 0.09 4.39 1.29 0.03 1.27 1.27 87.8
CLAY BARRIER A 50-55 cm 68.8 13.6 8.81 0.10 0.57 0.01 0.23 0.48 0.29 0.08 0.08 93.0 B 50-55 cm 64.7 15.0 10.0 0.16 0.68 0.01 0.55 0.64 0.26 0.15 0.15 92.3 D 40 cm 9.14 4.04 70.2 0.01 0.19 0.01 0.01 0.14 0.45 0.06 0.06 85.0
OXIDISED COVER A 25 cm 54.6 22.2 9.67 0.05 0.10 <0.01 0.02 0.67 0.04 0.03 0.03 87.4 D 50-55 cm 64.4 15.6 9.89 0.05 0.39 0.01 0.27 0.76 0.28 0.12 0.12 91.8 E yellow 56.0 15.7 13.6 0.02 0.38 0.01 0.27 0.76 0.54 0.11 0.11 87.4 F 70 cm 51.1 16.3 19.5 0.04 0.34 0.06 0.31 0.68 0.64 0.16 0.16 89.2
PAN D 40 cm 48.5 13.7 22.5 0.05 0.52 0.03 0.47 0.71 0.37 0.14 0.14 87.1

62
Sample As Ba Bi Co Cu Hg Mo Ni Pb Th U Zn
PRECIPITATE Surface Not analysed Drain 4.7 14 <1.5 7.9 2.3 <1.5 <0.5 57.6 27.1 26.9 <0.9 21.5
WASTE ROCK A 70+ cm 19.9 355 <1.5 <2 39 <105 <0.5 61.9 13.7 16.6 32 35.4 B 80+ cm 19.4 255 22.9 102 780 5.8 10.2 116 220 31.9 33 42.5 C Surface 26.7 115 <1.5 <2 130 3.3 <0.5 62.7 145 28.7 34 44.4 C Oxidised 91.2 320 25.9 95 192 3.7 35 50.2 365 39.1 13 16.4 C 15+ cm <0.5 345 185 39 88 <1.5 30 73 360 28.1 40 1.3 D 70+ cm 17.7 385 5.3 28 260 <1.5 6.1 73.4 190 28.7 13 105
CLAY BARRIER A 50-55 cm 61.2 240 18 35 785 8.8 14.5 191 945 80 <0.9 195 B 50-55 cm 67.9 190 2.1 <2 82 1.7 0.6 53.1 187 32.9 11 45.6 D 40 cm 36.1 15 <1.5 ,2 10 <1.5 <0.5 45.6 <1.5 <1 <0.9 27.7
OXIDISED COVER A 25 cm 21.6 37 <1.5 <2 81 <1.5 ,0.5 88.3 64 24.9 <0.9 72.1 D 50-55 cm 61.3 175 21.3 150 830 10.6 16 210 2280 75 4.8 207 E yellow 30.6 345 <1.5 <2 67 2.6 <0.5 70.5 125 34 7.4 25 F 70 cm 51.3 225 1.8 <2 69 <1.5 <0.5 98 127 28.5 4.7 29
PAN D 40 cm 57.9 220 <1.5 <2 3560 <1.5 <0.5 <1.0 <1.5 <1.0 12 185
The same samples were analysed for major and trace elements by X-ray fluorescence spectroscopy (XRF) to determine composition of the waste rock and whether any of these elements have been incorporated in the overlying covers during evapotranspiration. The data presented in Table 28 are used in conjunction with those in Table 29 of the water extractable elements in cover material to determine chemical changes in the cover materials.
8.4 Composition Major and trace element composition of the solid samples are shown in Table 28. These data not only confirm the mineralogical data but also provide some insight to their interpretation. Of the six samples listed under waste rock, the surface sample at site C had considerably less Fe2O3 MgO and K2O than the other samples suggesting that is of different origin or that it is more highly weathered. The low CaO composition of these and all other samples suggests that there is no dolomite (or calcite) present. Relatively high MgO values for the five waste rock samples suggest that the chlorite is a Mg-rich variety, as is its weathering product corrensite. The TiO2 levels confirm the presence of anatase which together with the iron oxides will account for the trace element Cr, Nb, V, Ta, Y, Zr (not reported) each of which is significant in the tens of ppm range. The black pan sample from 40cm depth at Site D differed substantially from all other samples having much lower major element levels except for MnO and P2O5 . This suggests an organic-rich layer in which manganese from weathered rock together with phosphorus from fertiliser has been accumulated. (Note that no Loss of Ignition (LoI) analyses were undertaken to determine organic and carbonate content, and although the black colour of this pan suggests organic matter, none was detected by XRD).

63
8.5 Leachate Composition The pH, EC and composition of leachates from profile samples are given in Table 29. In each of the profiles, the sample lowest in the profile is more acidic than those above with the lowest pH being in the thin cover material at Site C. The trend of EC (and the majority of the elements) is high values in the near-surface samples, an immediate decrease followed by higher values in the cover immediately above the waste rock. Of those elements presumed to be associated with mineralisation, all are in the ppb range except that zinc has noticeably higher concentrations. Values for thorium, uranium and lead are significantly lower than copper, cobalt and nickel. Other elements analysed by ICP-AES and ICP-MS techniques are at or below their limit of detection.

64
Table 29. Composition (in ppm unless otherwise stated) of leachates from cover profiles
SITE A pH EC Al Bi* Ca Co* Cu* Fe K Mg Mn Na Ni* Pb* S Si Th* U* Zn* 0 � 5 5.2 228 0.14 0.04 12 13 12 0.14 3 11 8 17 12 0.6 9 3.1 <0.1 0.7 61 10-15 4.9 96 0.01 <0.01 301 0.5 27 <0.01 1 107 0.72 12 1 0.3 1.5 1.2 <0.1 0.3 69 30-35 4.8 82 <0.01 0.02 105 1 3 <0.01 0.5 201 0.8 9 0.4 <0.1 3 2.2 <0.1 <0.1 11 50-55 4.7 104 <0.01 0.05 306 0.7 17 <0.01 0.7 4.3 0.77 10 4 0.3 8 2.7 <0.1 <0.1 87 65-70 4.1 106 0.05 305 6 50 <0.01 0.4 4.7 0.79 10 16 <0.1 11 3.3 <0.1 0.3 150
SITE B
0-5 4.8 183 0.92 0.05 6 17 84 0.73 3 5.0 9 12 8 0.3 7 2.9 0.1 <0.1 86 10-15 4.4 108 0.01 0.02 2.2 9 41 <0.01 0.7 1.7 1.3 11 1 0.3 1 3.3 <0.1 <0.1 32 30-35 5.1 58 <0.01 <0.01 1.4 0.5 11 <0.01 0.6 0.84 0.32 9 0.4 <0.1 0.8 2.0 <0.1 <0.1 15 50-55 5.2 83 <0.01 0.03 6 3 14 <0.01 0.4 3.7 0.74 10 1 0.1 4.3 2.7 <0.1 <0.1 28 75-80 4.3 118 <0.01 0.04 4.6 10 21 <0.01 0.5 6 0.87 10 9 0.5 14 5 <0.1 7 130
SITE C
0-10 3.7 99 0.74 0.07 2.5 47 66 <0.01 0.4 2.3 2.1 10 74 2 11 1.8 <0.1 4 350
SITE D 0-5 4.7 222 3.7 0.14 6 60 23 3.1 4 7 19 13 54 6 14 6 0.4 0.1 130
10-15 4.7 101 <0.01 0.06 2.3 5 15 <0.01 0.6 2.3 2.6 10 3 <0.1 6 1.5 <0.1 0.2 19 30-35 4.8 74 <0.01 <0.01 1.1 1 14 <0.01 0.7 1.3 0.94 9 0.7 <0.1 3.5 1.6 <0.1 <0.1 13 50-55 4.4 123 <0.01 0.04 4.1 25 28 <0.01 0.5 4.8 2 10 38 <0.1 14 4.4 <0.1 6 130 65-70 3.5 170 0.18 0.08 8 45 45 <0.01 0.5 6 1.5 11 53 4 20 7 <0.1 8 1400
* values in ppb
65
C. 2002 DRY SEASON CHARACTERISTICS The late dry season characteristics and general observations of the covers on White�s heap were obtained during a field trip on 21-24 October, 2002 and subsequent laboratory testing. This visit followed 6 months of close to no precipitation, high temperatures and evaporation. During the visit, day-time maxima exceeded 35°C with temperatures on the exposed waste heap approaching 50°C.
9. METHODS The methods used during the October 2002 studies were similar to those employed during the April 2002 field work. Only the differences are emphasized here.
9.1 Sites and Site Assessment Four further study sites were located on the upper shallow slopes of the landform and are representative of the environments of the surfaces of the landform. Three of these were chosen to be close to the sites studied during the field work conducted in April, 2002; they are named A�, B� and D� to indicate their proximity to the previous sites. An additional site (Site G) was located on the upper surface of White�s heap at a similar elevation to Sites A and A� but some 300 m to the west. The batters were examined in a less intensive way. The surfaces of the batters were again examined casually at a number of locations, and the general vegetation cover was inspected at locations on all sides of the landforms. The major species present were recorded and photographs were taken to illustrate the general vegetation coverage. Examination of the waterways during the visit of October 2002 was only cursory.
9.2 Vegetation and Surface Properties The structural formation class of the herbaceous vegetation was again assessed using the methods of Walker and Hopkins (1990) at the four sites. Due to the extended dry season, all the grasses and sedges had �hayed off� and the foliage of almost all herbaceous plants was dead or leaves had abcissed. In the absence of floral structures, no attempt was made to record the herbaceous species present. Observations of selected surface properties of the covers were again recorded. The surface properties recorded included litter characteristics and depths, the presence of surface crusts, stoniness, macropores and other surface microrelief features. Observations were again made of the surface active soil fauna where this was evident. No systematic observations were made of termite mounds during the October visit.
9.3 Trenches A backhoe was again used to excavate four large trenches at the principal study sites to permit examination and description of the cover profiles and the upper part of the wastes.
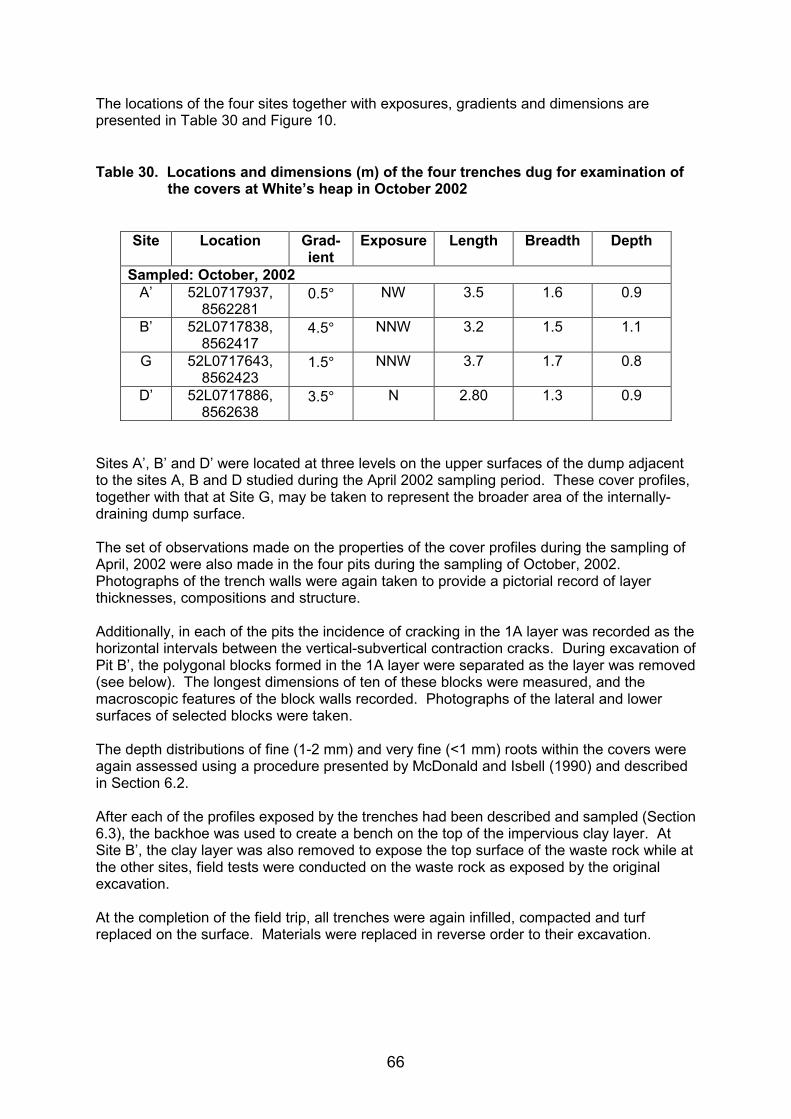
66
The locations of the four sites together with exposures, gradients and dimensions are presented in Table 30 and Figure 10. Table 30. Locations and dimensions (m) of the four trenches dug for examination of
the covers at White�s heap in October 2002
Site Location Grad-ient
Exposure Length Breadth Depth
Sampled: October, 2002 A� 52L0717937,
8562281 0.5° NW 3.5 1.6 0.9
B� 52L0717838, 8562417
4.5° NNW 3.2 1.5 1.1
G 52L0717643, 8562423
1.5° NNW 3.7 1.7 0.8
D� 52L0717886, 8562638
3.5° N 2.80 1.3 0.9
Sites A�, B� and D� were located at three levels on the upper surfaces of the dump adjacent to the sites A, B and D studied during the April 2002 sampling period. These cover profiles, together with that at Site G, may be taken to represent the broader area of the internally-draining dump surface. The set of observations made on the properties of the cover profiles during the sampling of April, 2002 were also made in the four pits during the sampling of October, 2002. Photographs of the trench walls were again taken to provide a pictorial record of layer thicknesses, compositions and structure. Additionally, in each of the pits the incidence of cracking in the 1A layer was recorded as the horizontal intervals between the vertical-subvertical contraction cracks. During excavation of Pit B�, the polygonal blocks formed in the 1A layer were separated as the layer was removed (see below). The longest dimensions of ten of these blocks were measured, and the macroscopic features of the block walls recorded. Photographs of the lateral and lower surfaces of selected blocks were taken. The depth distributions of fine (1-2 mm) and very fine (<1 mm) roots within the covers were again assessed using a procedure presented by McDonald and Isbell (1990) and described in Section 6.2. After each of the profiles exposed by the trenches had been described and sampled (Section 6.3), the backhoe was used to create a bench on the top of the impervious clay layer. At Site B�, the clay layer was also removed to expose the top surface of the waste rock while at the other sites, field tests were conducted on the waste rock as exposed by the original excavation. At the completion of the field trip, all trenches were again infilled, compacted and turf replaced on the surface. Materials were replaced in reverse order to their excavation.

67
Table 31. Samples collected in October 2002
Site Core Sample Bag Sample A� 0 � 5 cm 0 � 10 cm 20 � 25 cm 10 � 40 cm 45 � 50 cm 40 � 70 cm waste rock
B� 0 � 5 cm 0 � 10 cm 40 � 45 cm 20 � 30 cm 40 � 60 cm waste rock
D� 0 � 5 cm 0 � 10 cm 25 � 30 cm 30 � 50 cm waste rock
G 0 � 5 cm 0 - 10 cm 25 � 30 cm 20 � 40 cm 40 � 60 cm waste rock
9.4 Field Tests Lysimeters Each of the lysimeters on White�s heap was returned to its reference water level in October 2002. Because there was less than 50 mm of rainfall at Rum Jungle between the April and October field trips, all the lysimeters required water to be added to bring them to their reference levels. Water Infiltration Experience gained during the April field trip indicated that infiltration rate at two levels in the profile are of significance: on the grassed surface and the top of the impervious lay layer. Infiltration tests were untaken at these two levels at each of the four sites and, in addition, on the exposed waste rock at Site B�. Oxygen Flux Oxygen flux was determined on the grassed surface, impervious clay layer and waste rock at each of the four sites.
9.5 Sampling Sampling was undertaken at each of the four sites. Undisturbed samples were collected at intervals down the profile as indicated in Table 31. Grab samples of approximately 3 kg were taken for further analyses and testing. These were immediately sealed in a plastic bag and then placed within another plastic bag and sealed for transport to Adelaide. Core samples used for bulk density testing were treated similarly. White precipitates were observed in many parts of the toe drain and in surrounding water courses. One sample from the NE side of the heap was collected for characterisation.

68
9.6 Laboratory Testing/Analyses The majority of samples were subjected to a limited range of test and analyses to determine changes in properties related to the prolonged dry season. These included moisture content, bulk density and void ratio. As the characteristics of cover material at Site G had not previously been determined, all geotechnical tests listed under Section 6.6 were performed on samples from this site. The mineralogy and geochemistry of two samples (white precipitate form NE toe drain and a white inclusion from 30 cm depth in A) were determined by XRD techniques respectively. All profile samples were subjected to the standard 1:5 leach with distilled water, and the leachate analysed for pH, EC and composition (by ICP-AES and ICP-MS). The purpose of these leachates tests was to determine changes to soluble salt contact within the cover due to high evaporation during the dry season.
10. FIELD RESULTS The results of the sampling conducted are again considered under the headings of vegetation and the cover characteristics.
10.1 Vegetation Characteristics Virtually all the foliage of the herbaceous vegetation at all sites had died off due to the very low water potentials normal for this later part of the extended dry season. Observations of the vegetation were limited to recording the structural formation classes of the herbaceous vegetation (Walker and Hopkins 1990) at the four new sites. These are presented in Appendix Table 1.
10.2 Cover Characteristics Selected properties of the covers are discussed below under the headings of surface properties and the characteristics of the cover profiles. Soil surface features As for the sampling conducted during April 2002, a range of cover surface properties were recorded to provide evidence for its stability (or otherwise) and indications of the activities of organisms of importance to soil formation and nutrient recycling processes. Litter layers Since they were examined in the late dry season, the litter layers consisted of a diffuse layer of dried-out, standing-dead foliage and stems of mown pasture plants. These overlay a thin layer of fallen dead leaves. In the mown pasture areas examined (areas associated with trenches A�, B�, D�, G), the standing litter layer was sparsely distributed (Plate 13 (a)) and was mostly evenly distributed with some patchy areas. Bare soil was exposed between the plants (Plate 13 (b)). Remains of the windrows of dead foliage formed earlier in the year during mowing were apparent in some locations.

69
(a) A general view of the area at Site G. Note the bund wall in the background
(b) Close up of the surface vegetation to show the exposed surface soils Plate 13. Two views of the standing dead layer of herbaceous vegetation during the
late dry season, October 2002 Cryptogam surfaces Remnants of thin, irregularly-distributed cryptogam crusts were found at most locations. These were thickest where water had ponded but were highly desiccated and broken up at this late dry season stage (Plate 14).

70
Plate 14. A dried out cryptogam crust on the cover surface at the northern end of White�s heap
Surface stoniness The stoniness values of the upper vegetated surfaces of the heap (as in areas A�, B�, D� and G) were estimated at from 2 to 3% of the total surface area. At one location, an unknown ant species had transported small fragments of the wastes to the surface and these were concentrated around the nest entrance hole (Plate 15). Surface macropores and surface micro-relief As in the April 2002 visit, surface macropores formed through the burrowing activities of ants and termites were again noted in most areas. The most common form of these were the nest entrances of ants, as indicated in Plate 15. Ant and termite nests were again noted to be sparsely distributed across the surfaces of the heap. Termites were actively constructing fragile earthen covers on the soil surface and on decomposing plant materials to protect themselves during foraging (Plate 16). These were patchily distributed on the soil surface at most locations.

71
Plate 15. Entrance to the nest of an unidentified ant species. Note that the surface
around the entrance has been decorated by the ants with small fragments of waste rock
Plate 16. Dominantly earthen structures built over dead grass stems by termites to
protect themselves during foraging Little other micro-relief was apparent on the surface apart from that observed during the April 2002 field work. Erosion There was no surface erosion detectable at sites A�, B�, or G. However, at Site D�, there was continuing, partly-stabilised sheet erosion as noted previously in this area. This was associated with materials deposited as a consequence of erosional activity at Site C, which
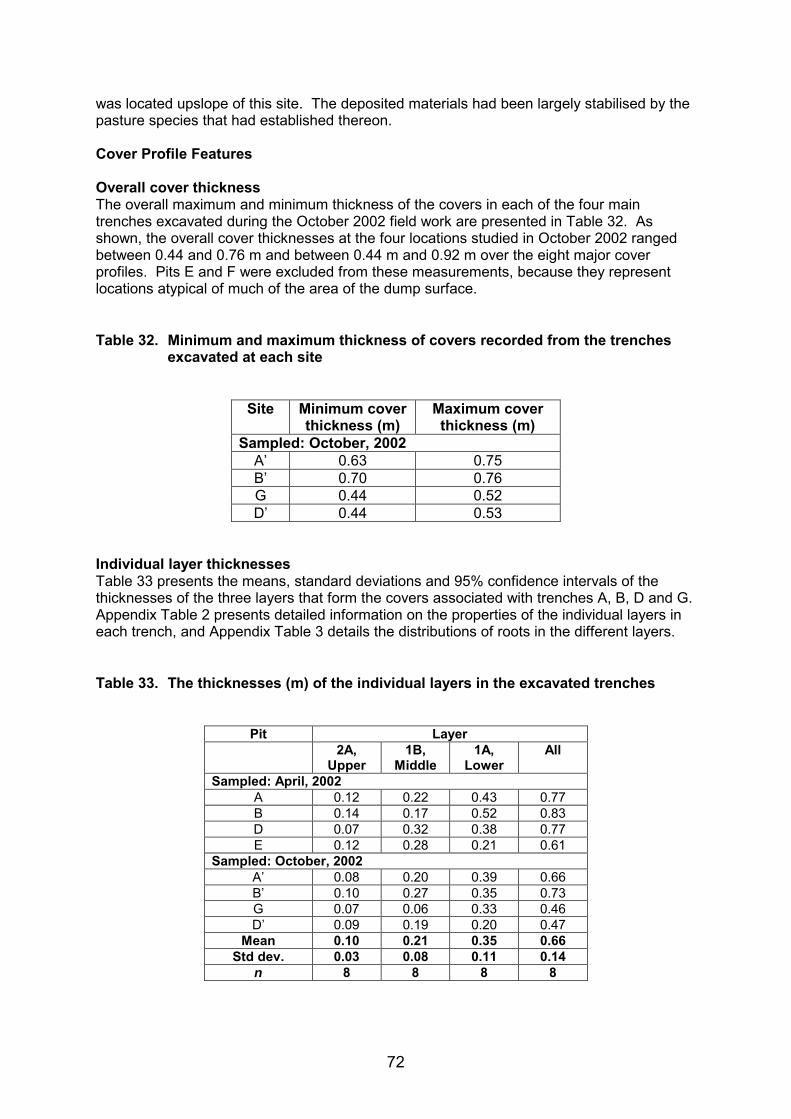
72
was located upslope of this site. The deposited materials had been largely stabilised by the pasture species that had established thereon. Cover Profile Features Overall cover thickness The overall maximum and minimum thickness of the covers in each of the four main trenches excavated during the October 2002 field work are presented in Table 32. As shown, the overall cover thicknesses at the four locations studied in October 2002 ranged between 0.44 and 0.76 m and between 0.44 m and 0.92 m over the eight major cover profiles. Pits E and F were excluded from these measurements, because they represent locations atypical of much of the area of the dump surface. Table 32. Minimum and maximum thickness of covers recorded from the trenches
excavated at each site
Site Minimum cover thickness (m)
Maximum cover thickness (m)
Sampled: October, 2002 A� 0.63 0.75 B� 0.70 0.76 G 0.44 0.52 D� 0.44 0.53
Individual layer thicknesses Table 33 presents the means, standard deviations and 95% confidence intervals of the thicknesses of the three layers that form the covers associated with trenches A, B, D and G. Appendix Table 2 presents detailed information on the properties of the individual layers in each trench, and Appendix Table 3 details the distributions of roots in the different layers. Table 33. The thicknesses (m) of the individual layers in the excavated trenches
Pit Layer 2A,
Upper 1B,
Middle 1A,
Lower All
Sampled: April, 2002 A 0.12 0.22 0.43 0.77 B 0.14 0.17 0.52 0.83 D 0.07 0.32 0.38 0.77 E 0.12 0.28 0.21 0.61
Sampled: October, 2002 A� 0.08 0.20 0.39 0.66 B� 0.10 0.27 0.35 0.73 G 0.07 0.06 0.33 0.46 D� 0.09 0.19 0.20 0.47
Mean 0.10 0.21 0.35 0.66 Std dev. 0.03 0.08 0.11 0.14
n 8 8 8 8

73
Pit Layer 2A,
Upper 1B,
Middle 1A,
Lower All
95% confidence
intervals
0.08-0.12
0.15-0.28
0.26-0.44
0.55-0.78
C - *0.04 0.14 0.14 F 0.15 0.52 0.21 0.88
*0.02 m lag overlying a dark-brownish-red gravelly layer. Individual layer properties In the four trenches examined, the three layers could again be largely differentiated on a combination of texture, structure, colour and biological properties (Plates 8 and 9). However, some difficulty was again experienced in reliably discriminating between the upper two layers at some locations in some pits. Lowest layer (Layer 1A) Over the eight major pits (excluding pits C and F), the mean thickness of the 1A layer (Table 33) was more than twice the minimum of 0.150 m specified in Table 6. Over all eight pits studied, the 95% confidence limits lie above the maximum specified thickness of 0.225 m (Table 33). The minimum thickness of this layer was 0.15 m, measured in pit D. The field texture of the fine earth fraction of this layer ranged from a light clay (pits B� and D�) to a clay loam (pit G) to a sandy clay loam (pit A�) (Appendix Table 2) and is therefore lighter in texture than indicated in Table 6. Field observations indicated that the 1A layer in Pit G had a substantially higher proportion of pisolitic gravels than the other three pits examined at this time and, as a clay loam, was substantially lighter in field texture The predominant colour of this layer again ranged from dark red to reddish brown (Appendix Table 2). Inclusions within this layer included quartzite (which ranged from near white to light red), waste rock and other materials. Desiccation cracking and polygon formation: In most pits, the 1A layer was a massive compacted clay with embedded gravels and stones. However, with increased drying, the vertical cracking observed during the April 2002 field work had become substantially more marked and exceeded 3 mm in some locations. Table 34 presents the horizontal intervals between the vertical and subvertical cracks that were noted to traverse the 1A layer in pits A�, B� and D�. Because of the intensive vertical and horizontal cracking noted in the different materials of pit G, horizontal cracking intervals were not recorded in this pit. Table 34. Horizontal intervals (m) between the vertical and subvertical desiccation
cracks in the pit walls of the clay-rich 1A layer together with the greatest lengths of ten polygons excavated from the 1A layer of pit B′′′′. Sampled in October, 2002
Pit Polygon greatest
length (pit B) A� B� D� 0.16 0.50 0.15 0.43

74
Pit Polygon greatest length (pit B)
0.24 0.40 0.10 0.38 0.10 0.37 0.14 0.38 0.17 0.29 0.17 0.34 0.08 0.26 0.25 0.30 0.17 0.29 0.16 0.33 0.20 0.41 0.12 0.22 0.29 0.13 0.18 0.38 0.25 0.55 0.21 0.26 - 0.23 - 0.21 - 0.32 - - - 0.41 - - - 0.07 - - - 0.49 - - Mean 0.18 0.34 0.16 0.32 Std dev. 0.07 0.14 0.05 0.07
The clays in the 1A layers of the three pits examined had clearly contracted to form large polygonal blocks, and this is consistent with the linear shrinkage properties presented in Table 25. The median horizontal intervals between the vertical and subvertical cracks differed significantly between pits A�, B� and D� (Kruskal-Wallis test, H = 11.43, df 2, P<0.005). As judged by Mann-Whitney tests, pit B� had a larger median inter-crack interval than pit A� (P<0.009) or D� (P<0.005); pits A� and D� were not significantly different (P>0.05). During excavation of the 1A layer in pit B�, a number of the polygonal blocks became separated and were examined individually. Table 34 presents the greatest lengths of the blocks studied in pit B: the median polygon length was not significantly different (Mann-Whitney test, P>0.05) from the median horizontal distances between the vertical-subvertical cracks recorded in this pit. Plate 17 illustrates the underside of one of the blocks excavated from Pit B. Waste materials were embedded within the lower 1A materials, and this demonstrates the close association between the 1A clays and the underlying wastes. Further desiccation cracking within the individual blocks is also evident. However, in terms of metal uptake, one of the most important features is the tracery of very fine roots apparent on the lower surface of the 1A layer and in intimate contact with the upper layer of wastes. Plate 18 illustrates the lateral aspect of one of these blocks. The illuviated materials deposited on the lateral faces of the block clearly differ from those comprising the block and form a layer c. 0.5 mm thick. Such deposits differ between pits and between locations within pits, and there was evidence of dark staining in some, due perhaps to organic matter or iron oxides (Plate 11).

75
Plate 17. Aspect of the lower surface of one of the polygonal blocks removed from
pit B. Note the wastes embedded in the lower surface and the tracery of fine roots
Plate 18. Lateral face of one of the polygonal blocks removed from pit B

76
Middle layer (Zone 1B) This layer is again variable in properties and thickness. The layer thickness in the four pits studied during the October 2002 sampling ranged from 0.06 m in pit G to 0.27 m in pit B� (Table 33). The 95% confidence limits for the thickness of this layer over all eight major pits only slightly exceeded the 0.15 to 0.25 m specified in Table 6. This is a gravel-rich layer (laterite fragments, nodules, etc.). The fine earth is a sandy clay loam to a fine sand loam in field texture. This layer is unstructured and massive. The upper part of this layer had a slightly lighter colour than that of the surface layer. In most pits, excluding G, the lower part of this layer had a more pronounced but variably developed yellow colour than the upper (Plate 9). Upper layer (Zone 2A) This layer has the highest gravel content of the three layers, (Table 43a). The thickness of this layer ranged from 0.07 to 0.14 m over all eight major pits (Table 33) and was therefore slightly thinner than the maximum thickness of 0.15 m specified in Table 6. In field texture, the fine earth ranged from a loam to a sandy clay loam to a sandy loam. As noted during the April 2002 sampling, the upper surface of the cover has started to differentiate into an organic-rich layer beneath the cryptogam crust. This incipient A horizon comprises a near-surface concentration of organic materials with densely-distributed fine roots. As observed during the April 2002 sampling, the materials underlying this fine-textured, organic-matter-rich surface were massive, compacted and cloddy. This layer is traversed by an extended network of voids and largely sub-horizontal galleries produced almost entirely by termites. Such networks are densest close to the surface and, because they occur in the absence of termite mounds, are probably created by the termite species that nest cryptically in the soil.
10.3 Depth Distributions of Roots The distributions of roots through the cover profiles and in the upper wastes are presented in Figure 22 and are detailed in Appendix Table 3 for each of the four trenches excavated during October 2002. There were few differences noted in root distributions between the April 2002 and October 2002 sampling times (cf. Figure 13). Note that the data presented exclude the dense mat of fine roots that concentrate at the immediate surface since the method is not appropriate for assessing the distributions of masses of very fine roots. Only very fine (<1 mm) roots were noted in pits B� and G, and fine (1-2 mm) roots were present at low densities in pits A� and D�. This was representative of the situation over most of the upper surface of the heap where trees and shrubs are largely absent. Only one medium diameter (2-5 mm) root was found in the surface horizon of pit G. The middle layer is poorly structured although roots ramify throughout it at only slightly lower densities then in the lower part of the upper 2A layer. Root density declines with increasing depth in the layer. Fine roots have penetrated the 1A layer extensively, albeit at a much lower density than in the layers above. In some trenches, fine and very fine roots are highly concentrated in the upper part of this layer with root density diminishing progressively with increasing depth in

77
the profile. Additionally, roots were noted to have extensively penetrated this layer through the planar voids that form between the polygonal structural blocks that develop within this layer. As considered above, the roots that penetrate the 1A layer are in intimate contact with the upper waste materials.
Figure 22. Depth distributions of very fine (<1 mm) and fine (1-2 mm) roots
reported from the covers in the pits described in October 2002

78
10.4 Infiltration Infiltration rates measured in October 2002 are detailed in Table 35. These rates are indicative of the unsaturated and saturated infiltration rate and averages are compared with these measured in April 2002 (Table 36). In general, both unsaturated and saturated rates at the end of the dry are an order magnitude greater than at the end of the wet. Table 35. October 2002 infiltration test results
Infiltration Rate (m/s) Site Depth (cm) Unsaturated Saturated
Comment
A� 0 35
1.3x10⁻⁴ 3.2x10⁻⁴
8.1x10⁻⁵ 1.1x10⁻⁴
Grassed surface. Top of gravely clay layer.
B� 0 35 80
4.8x10⁻⁴ 1.7x10⁻⁴ 3.8x10⁻⁴
2.3x10⁻⁴ 4.6x10⁻⁵ 2.0x10⁻⁴
Grassed surface. Top gravely clay layer. Top of waste rock
D� 0 50
3.7x10⁻⁴ 9.2x10⁻⁴
1.7x10⁻⁴ 1.3x10⁻⁵
Grassed surface. Top of gravely clay layer.
G 0 50
5.4x10⁻⁴ 1.6x10⁻⁴
2.0x10⁻⁴ 1.6x10⁻⁴
Gassed surface. Top of gravely clay layer.
Table 36. Comparison of wet and dry season infiltration test results
Mean Infiltration Rate (m/s)
Unsaturated Saturated Layer
April 2002 October 2002 April 2002 October 2002 Upper 2.9x10⁻⁵ 3.8x10⁻⁴ 2.0x10⁻⁵ 1.7x10⁻⁴ Middle 4.0x10⁻⁵ Not tested 1.8x10⁻⁵ Not tested Lower 1.2x10⁻⁵ 1.8x10⁻⁴ 1.6x10⁻⁵ 5.7x10⁻⁵
Waste Rock 1.1x10⁻⁵ 3.8x10⁻⁴ 1.1x10⁻⁵ 2.0x10⁻⁴
10.5 Oxygen Flux Measurements were made in the four new pits using the same method as in April 2002. Table 37 presents the oxygen flux results obtained at the different levels in the pits in October 2002, at the end of the dry season, averaged over the four measurement locations. The table also includes the end of wet season results (Table 21) and shows the ratio between the dry season and wet season fluxes.

79
Table 37. Oxygen flux through the White�s heap cover system in October 2002, averaged over the four trench locations. The end of wet season results (April 2002) are shown for comparison
Layer Oxygen flux (kg m-2 s-1)
end of wet season (April 2002)
Oxygen flux (kg m-2 s-1) end of dry season (October 2002)
Ratio (dry/wet)
Zone 2A �gravelly sand (all 3 layers present)
(0.44 ± 0.30) ×10-7 (1.9 ± 0.9) ×10-7 4.3
Zone 1A � clay (one layer present)
(1.6 ± 0.8) ×10-7 (6.0 ± 2.9) ×10-7 3.7
Waste rock (cover removed)
(2.2 ± 0.9) ×10-7 (8.4 ± 6.3) ×10-7 3.8
The oxygen flux into the cover is about four times higher at the end of the dry season than at the end of the wet season. The ratio is nearly the same for uncovered waste rock. Table 38 shows the ratio between the oxygen flux into the exposed waste rock and the flux into the surface of the intact cover, for both the dry season and wet season values presented in Table 37. This ratio provides a measure of the effectiveness of the cover in reducing the oxygen flux and hence gives an indication of the amount by which the cover may reduce the overall oxidation rate in White�s dump. It can be seen that the entire cover reduces the oxygen flux to 20% - 23% of that into the bare waste. Table 38. Effectiveness of the cover in reducing the oxygen flux at the end of the dry
season (October 2002) and the end of the wet season (April 2002)
Oxygen flux (kg m-2 s-1) Season
No cover Cover
Ratio (no cover/cover)
Wet season 2.2 × 10⁻⁷ 0.44 × 10⁻⁷ 5.0
Dry season 8.4 × 10⁻⁷ 1.9 × 10⁻⁷ 4.4
11. LABORATORY TEST RESULTS
11.1 Soil Physics The moisture contents of the four cover profiles are presented in Table 39, and a comparison between the end of the wet and dry seasons in Table 40 Table 39. Moisture contents in cover profiles in October 2002 (end of dry)
Grab samples Core samples Site Depth (cm) Moisture wt % Depth (cm) Moisture %
A� 0 � 10 2.6 0 � 5 1.1

80
Grab samples Core samples Site Depth (cm) Moisture wt % Depth (cm) Moisture %
10 � 40 40 � 70
Waste Rock
4.9 11.7 5.2
20 � 25 45 � 50
3.9 11.3
B� 0 � 10 20 � 30 40 � 60
Waste Rock
2.0 5.1
11.5 4.3
0 �5
40 � 45
2.0
12.8
D� 0 � 10 30 � 50
Waste Rock
4.5 6.9 6.8
0 � 5 25 � 30
4.0 12.9
G 0 � 10 20 � 40 40 � 60
Waste Rock
4.4 9.3
10.4 5.4
0 �5 25 � 30
2.6 9.3
Table 40. Comparison of wet and dry season moisture profiles
Mean moisture content (wt %) Layer April 2002 October 2002
Upper 6.9 2.7 Middle 9.4 4.6 Lower 12.3 10.7
Waste Rock 8.7 5.4 These data again show a distinct increase in moisture down through the cover profile and then a substantial decrease in the upper layers of the waste rock. These values are all much lower than at the end of the wet (Table 40), but also show that the clay layer is retaining over 10% moisture. Although collected over different intervals within the profiles, the grab and core sample moisture contents are similar (Table 37). Using these data and those for density, void ratios and percentage saturation have been calculated (Table 41) and are compared with average values at the end of the wet (Table 42) Table 41. Physical properties of samples collected in October 2003
Site Depth (cm)
Moisture Content
(%)
Particle density (g/cm3)
Wet bulk density (g/cm3)
Dry density (g/cm3)
Void ration
Saturation (%)
A 0-5 20-25 45-50
1.1 3.9 11.3
2.90 2.82 2.81
2.07 2.17 1.96
2.04 2.08 1.76
0.42 0.35 0.60
7.9 31.3 53.3
B 0-5 40-45
2.0 12.8
2.92 2.84
1.74 1.82
1.71 1.61
0.71 0.76
8.2 47.7
D 0-5 25-30
4.0 12.9
2.94 2.82
1.80 1.90
1.73 1.68
0.70 0.68
16.8 53.6
G 0-5 25-30
2.6 9.3
2.92 2.85
1.81 1.88
1.76 1.72
0.66 0.65
11.5 40.8

81
Table 42. Comparison of wet and dry season physical properties
Dry Density (g.cm3) Void Ratio Saturation Layer Apr 2002 Oct 2002 Apr 2002 Oct 2002 Apr 2002 Oct 2002 Upper 1.83 1.81 0.63 0.62 33.2 14.8 Middle 1.73 NA 0.69 NA 42.1 NA Lower 1.83 1.69 0.56 0.67 64.5 48.9
Of significance is the marked decrease in percentage saturation at the end of the dry season, and the increase in void ratio of the clay-rich 1A Zone which supports the observations that desiccation during the dry season has led to shrinkage and the formation of void structures (cracks). Site G was chosen to be close to the pair of lysimeters Ce and Cw. These lysimeters have measured relatively high infiltration rates since about 1989. The particle size distribution, Atterberg limits and linear shrinkage were determined on profile samples from the site and are presented in Tables 43 and 44 and Figures 23 and 24. Table 43(a). Textural analysis of the fine earth fraction of Site G material
Precent of fine earth fraction Site Depth
(cm) Clay (%)
Silt (%)
Fine sand (%)
Coarse sand (%)
Gravel (% of whole
sample)
Classification of fine earth faction
G 0-10 20-40 40-60 WR
31.2 38.9 41.0 7.5
7.9 6.5
11.8 7.1
32.7 38.3 27.4 33.4
28.2 16.3 19.8 52.0
53.6 15.5 13.2 72.7
Sandy clay Sandy clay
Clay Slightly clayey sand
Table 43(b). Particle size distribution of Site G material
Percent finer Particle size (mm) 0 � 10 cm 20 � 40 cm 40 � 60 cm Waste rock 63.0 37.5 19.0 9.50 4.75 2.36 1.18 0.600 0.425 0.212 0.075
100.0 93.3 82.6 71.3 57.3 46.4 40.8 38.4 37.1 33.3 27.8
- -
100.0 98.5 93.6 84.5 78.2 75.8 74.2 70.7 61.7
- -
100.0 98.0 94.4 86.8 80.2 77.0 75.2 69.6 58.9
100.0 88.5 67.4 52.8 39.1 27.3 22.6 18.7 16.2 13.1 10.1

82
Percent finer Particle size (mm) 0 � 10 cm 20 � 40 cm 40 � 60 cm Waste rock 0.020 0.002
18.1 14.5
38.3 32.9
45.9 35.6
4.0 2.0
Table 44. Site G Atterberg limits and linear shrinkage results
Sample Plastic limit (%) Liquid limit Plasticity
index Linear
shrinkage (%) 0-10
20-40 40-60
22 21 21
36 44 46
14 23 25
10.1 15.3 14.7
Figure 23. Ternary textural classification diagram � Site G

83
Figure 24. Particle size distribution � Site G Table 45. Composition of white evaporite from tow drain and white inclusion from
pit A� Sample SiO2 Al2O3 Fe2O3 CaO MgO Na2O K2O TiO2 MnO P2O5 SO3 White ppt 2.86 0.54 2.07 9.30 18.3 0.10 0.04 0.00 0.15 0.04 51.2 Inclusion 63.5 14.9 13.3 0.11 0.11 0.04 0.16 0.63 0.54 0.21 0.04 Sample As Ba Bi Co Cu Hg Mo Ni Pb Th U Zn White ppt 10 35 n.d. 550 1760 n.d. n.d. 470 <10 11 115 770 Inclusion 15 190 n.d. 20 25 n.d. n.d. 70 14 18 12 8
11.2 Mineralogy The mineralogy of two additional samples was determined by a powder XRD technique. A white inclusion from 30 cm depth in the A� trench is composed of quartz and kaolinite with minor hematite and goethite and is thus a deeply weathered sample of waste rock. Unlike the white precipitate analyses in April 2002, the mineralogy of that sampled at the end of the dry consisted mainly of gypsum and hexahydrite (MgSO4.6H2O) and minor epsomite (MgSO4.7H2O). These two magnesium sulfates are much more soluble than gypsum and their presence reflects the impact of the dry. It is assumed that both calcium and magnesium are derived from dolomite in the waste rock, although none was detected in previously analysed waste rock.
11.3 Composition The composition the two samples was determined by XRF with major and trace element contents presented in Table 45. Of particular interest are the elevated levels of Co, Cu, Ni, U and Zn in the drainage precipitate indicating that there is leaching of the waste rock.

84
11.4 Leachate Composition The composition of leachates presented in Table 46 includes those for waste rock which was not part of Table 29. Comparison of data indicates that the pH of the leachate at the end of the dry was slightly higher and exhibits less profile variation. Both the EC and elemental composition of the dry season leachates were lower than at the end of the wet and do not exhibit the same profile variation. This suggests that there has been no significant evaporative precipitation in the cover materials during the dry as might be expected. Leachate from the waste rock (except at Site D�) had compositions which were reflected by that of the white precipitate in the toe drain (Table 45).
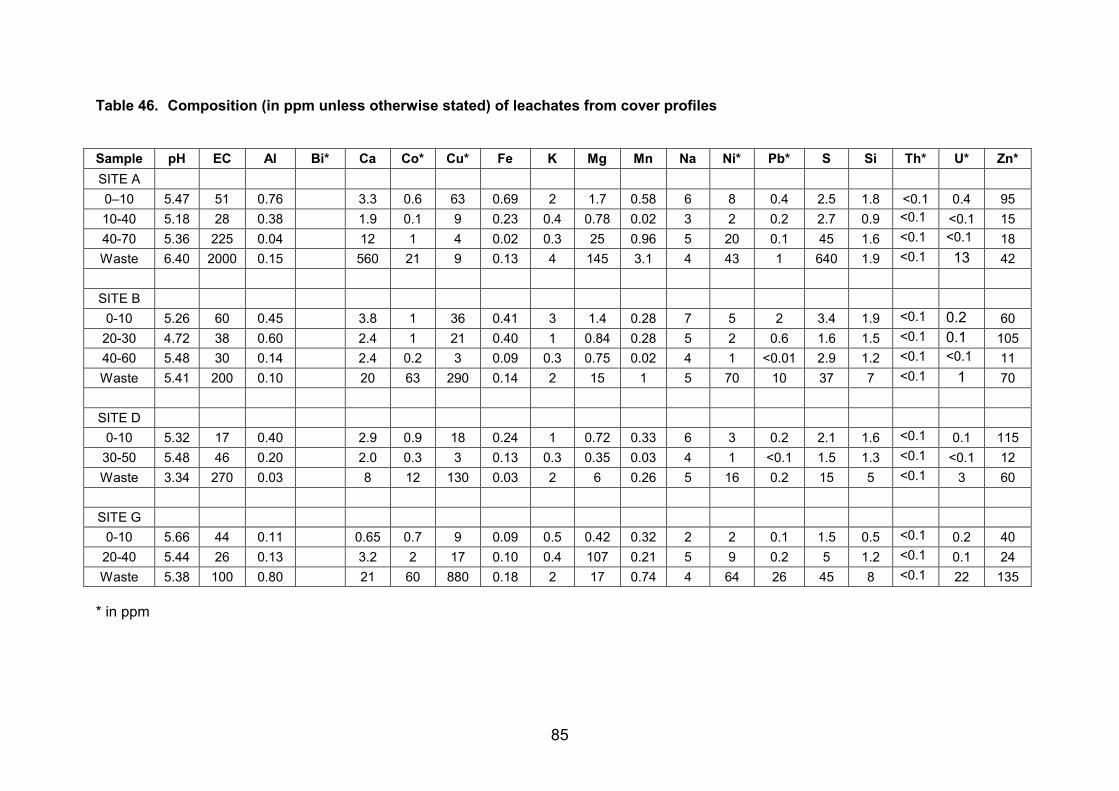
85
Table 46. Composition (in ppm unless otherwise stated) of leachates from cover profiles
Sample pH EC Al Bi* Ca Co* Cu* Fe K Mg Mn Na Ni* Pb* S Si Th* U* Zn* SITE A 0�10 5.47 51 0.76 3.3 0.6 63 0.69 2 1.7 0.58 6 8 0.4 2.5 1.8 <0.1 0.4 95 10-40 5.18 28 0.38 1.9 0.1 9 0.23 0.4 0.78 0.02 3 2 0.2 2.7 0.9 <0.1 <0.1 15 40-70 5.36 225 0.04 12 1 4 0.02 0.3 25 0.96 5 20 0.1 45 1.6 <0.1 <0.1 18 Waste 6.40 2000 0.15 560 21 9 0.13 4 145 3.1 4 43 1 640 1.9 <0.1 13 42
SITE B
0-10 5.26 60 0.45 3.8 1 36 0.41 3 1.4 0.28 7 5 2 3.4 1.9 <0.1 0.2 60 20-30 4.72 38 0.60 2.4 1 21 0.40 1 0.84 0.28 5 2 0.6 1.6 1.5 <0.1 0.1 105 40-60 5.48 30 0.14 2.4 0.2 3 0.09 0.3 0.75 0.02 4 1 <0.01 2.9 1.2 <0.1 <0.1 11 Waste 5.41 200 0.10 20 63 290 0.14 2 15 1 5 70 10 37 7 <0.1 1 70
SITE D
0-10 5.32 17 0.40 2.9 0.9 18 0.24 1 0.72 0.33 6 3 0.2 2.1 1.6 <0.1 0.1 115 30-50 5.48 46 0.20 2.0 0.3 3 0.13 0.3 0.35 0.03 4 1 <0.1 1.5 1.3 <0.1 <0.1 12 Waste 3.34 270 0.03 8 12 130 0.03 2 6 0.26 5 16 0.2 15 5 <0.1 3 60
SITE G
0-10 5.66 44 0.11 0.65 0.7 9 0.09 0.5 0.42 0.32 2 2 0.1 1.5 0.5 <0.1 0.2 40 20-40 5.44 26 0.13 3.2 2 17 0.10 0.4 107 0.21 5 9 0.2 5 1.2 <0.1 0.1 24 Waste 5.38 100 0.80 21 60 880 0.18 2 17 0.74 4 64 26 45 8 <0.1 22 135
* in ppm

86
D. DISCUSSION AND RECOMMENDATIONS 12. DISCUSSION The purpose of the study was to establish likely reasons for the observed deterioration in cover performance. Although it has been possible to collate the design characteristics of the covers for comparison with measurements made in this study, there has been no systematic gathering of changes in cover properties, vegetation and soil fauna over time. The discussion therefore relates to a �snap-shot� of conditions taken 18 years after cover emplacement. The present sampling has revealed significant physical, chemical and biological differences from the cover design and possibly emplacement. Some of these changes can be attributed to the establishment of a plant community on the surfaces. These modify the structure and microenvironment of the surface and near-surface profile and instigate a series of on going processes that represent the earliest stage of soil development. Natural biological soil-forming processes start to act on the covers virtually from the moment that they are placed. A community of largely agricultural plants was initially established to control erosion, although the new landform has since been colonized by a range of other plants and diverse soil organisms from the surrounding landscape. Such organisms represent a subset of the local species capable of dispersing to the site and withstanding the conditions of the new environment. Over the period that the plant community and soil has developed from its original condition, an increasingly wide range of organisms has colonised- and will continue to colonise- the landform as part of ongoing ecosystem and soil development. In the northern Australian environment, some of the most important and earliest-invading groups are termites and ants, two groups that are well adapted to the rigorous climatic conditions encountered on the constructed landforms. Both are known to have substantial biological and soil-forming roles in environments where they are populous (Paton et al., 1995; Lavelle and Spain, 2001). Early colonisation of post-mining tropical Australian landforms by ants has been demonstrated in a range of mining environments by, inter alia, Andersen (Ranger uranium mine, Weipa bauxite mine), Major (Gove bauxite mine), Andersen and Spain (Bowen Basin coal mines). In fact, it is considered by Andersen and others that the sequence and variety of ant species colonising rehabilitated sites may be used as an indication of the success of rehabilitation procedures (see, for example, Andersen, 1994). Termites are the other major group of colonising arthropods and are of particular importance in soil development and in the breakdown of dead plant materials in tropical environments. They were reported to have colonised White�s heap within two years of vegetation establishment (Ryan, 1987), although it is likely that colonisation occurred earlier than this. Termite colonisation has been studied in rehabilitated tropical Australian mine site environments at Gove bauxite mine, Ranger Uranium Mine and at Weipa bauxite mine (Spain unpublished). In parallel with the effects of biological colonisation, considerable and on-going physical and chemical modifications to the cover materials occur through such influences associated with fertilization, slashing (mowing) and possibly fire. A further on-going influence is that of the acidification of materials at the base of the covers.

87
12.1 Design The cover was designed to reduce infiltration to less than 5% of incident rainfall whilst supporting vegetation and being erosion resistant. Design criteria also specified the use of locally-available materials and that the cover be of simple construction and of minimum thickness to minimize construction cost (Allen and Verhoeven, 1986). In order to meet the design objectives, the cover was designed as a three-layer system. Zone 1A was designed as a clay-rich low-permeability layer. Zone 1A was placed on a thin crushed rock layer formed by rolling the dump surface. The zone above (1B) was designed as a �store and release� layer, protecting the Zone 1A material from moisture loss due to evaporation as well as providing moisture to support vegetation through the long annual dry season. Zone 2A was designed to provide erosion resistance prior to the establishment of vegetation, and to act in the long term as a pore break to limit evaporation. Each zone was specified to be of minimum thickness. The authors could not ascertain the specific design approach taken or the particular tools used to determine these thicknesses and the engineering specifications. Further design characteristics aimed to promote rapid water-shedding from the surface of the heaps during periods of intense rainfall. These characteristics included shaping the upper surface with slopes of 1-10% for inward drainage to well-constructed drains. Erosion control was achieved through a system of contour banks on the upper surfaces, rock mulch on the batter slopes and rip-rap in the drains. Given the coarse nature of the waste rock surface following reshaping and rolling, the design did not incorporate an additional �capillary break� layer. Menzies and Mulligan (2000) considered that capillary rise has modified (and continues to acidify) the lower clay-rich 1A zone. This has been confirmed by the present study. Recognising that this was one to the first cover systems designed for sulfidic waste management in Australia, the cover design has been shown to have been adequate to meet its performance criteria in the decade following construction. Subsequent deterioration in performance seems to have been the result of changes in the properties of the cover materials from those specified in the design. The evidence found in the present study suggests that these changes have been brought about by biological and weathering processes.
12.2 Cover Construction Our evaluation of construction of the cover and associated drainage systems is based on limited data � observation from walking over and around the waste rock heap and from a limited number of trenches. Our observations indicated that the landform is intact with minimal evidence of erosion or slumping. All drains are intact and, although some are choked with vegetation, there is little evidence of pooling. We were not able to ascertain the condition of geotextile at the base of the drains, but their integrity does not appear compromised. Thus construction of the water-shedding and erosion prevention landforms was satisfactory. From the trenches excavated during this study, we have been able to compare observed characteristics with the specifications outlined in Allen and Verhoeven (1986). It has been found that the low permeability Zone (1A) exceeds the specified minimum thickness except at Site C (Table 47); at all other sites it exceeds the specified maximum thickness of 225

88
mm. The moisture retention layer (Zone 1B) is absent at Site C and is only 60 mm thick at Site G) but elsewhere exceeds the specified minimum thickness of 150mm (Table 48). Although no minimum thickness is specified for the erosion resistant layer (Zone 2A), the observed thicknesses are considerably less than specified (Table 49). Each of the non-vegetated sites inspected (including Site C) appears to have only the infiltration-resistant zone present, with some waste rock occurring on the surface. There are several possible explanations:
- The two upper zones have been removed by erosion � this is most unlikely as there is little evidence of surface erosion, except at sites below the bare area associated with site C.
- During the construction phase, the upper zones were omitted as a result of inadequate supervision � unlikely, or
- That material removed during drain construction was dumped in piles and not adequately covered � this explanation is supported by the relative closeness of most bare patches to drains and the presence of waste rock at or near the surface.
It should be noted, however, that the bare areas represent a very small fraction of the total area of the heap and do not indicate a systematic lapse in quality control during construction of the covers. It has been concluded that the construction of the covers and drains did not contribute to subsequent changes in cover performance. Table 47. Comparison of the design specifications for Zone 1A with those of samples
from the sites investigated ZONE 1A � Infiltration
resistant zone DESIGN
SPECIFICATIONS SITE A SITE B SITE C SITE D
DESCRIPTION Compacted lateritic clay
Gravelly and sandy
clay
Gravelly and sandy
clay
Gravelly and sandy
clay
Sandy clay
PERMEABILITY (m/s) 10-8 to 10-9 10-6 10-5 10-5 10-6 DRY DENSITY (t/m3) 1.8 1.8 1.8 1.7 1.9 THICKNESS (mm) > 150 430 520 140 385
GRADING (% passing sieve size)
75 mm 19 mm
2.36 mm 0.425 mm 0.075 mm
100% 90-100 75-100 50-90 35-80
100% 100
78-93 65-82 50-60
100% 100
62-66 45-55 30-40
100% 100 70 53 36
100% 100
68-84 43-68 28-48
LIQUID LIMIT (%) 40 to 65 46 35 26 35 PLASTICITY INDEX >15 24 16 4 16 EMERSON CLASS Not specified 6 6 6 6
LINEAR SHRINKAGE (%) Not specified 12 9 8 8 MOISTURE CONTENT NA 15 12 8 12

89
Table 48. Comparison of the design specifications for Zone 1B with those of samples from the sites investigated
ZONE 1B � Moisture
retention zone DESIGN
SPECIFICATIONS SITE A SITE B SITE C SITE D
DESCRIPTION Loosely compacted sandy clay loam
Clayey and
gravelly sand
Clayey and gravelly
sand
Not present
Clayey and gravelly
sand
PERMEABILITY (m/s) Not specified 10-5 10-6 - 10-5 DRY DENSITY (t/m3) Not specified 1.7 1.9 - 1.6 THICKNESS (mm) > 150 220 170 0 325 GRADING (% passing sieve size)
150 mm75 mm19 mm
2.36 mm0.425 mm0.075 mm
100% 90-100 85-100 45-80 30-60 20-45
100% 100 100 52 36 23
100% 100 100 65 45 32
- 100% 100 100 55 39 25
LIQUID LIMIT (%) 30 to 60 31 29 - 35 PLASTICITY INDEX >10 11 9 - 11 EMERSON CLASS Not specified 8 8 - 8 LINEAR SHRINKAGE (%)
Not specified 7 7 - 7
MOISTURE CONTENT na 10 9 - 9 Table 49. Comparison of the design specifications for Zone 2A with those of samples
from the sites investigated ZONE 2A � Erosion resistant zone
DESIGN SPECIFICATIONS
SITE A SITE B SITE C SITE D
DESCRIPTION Loosely placed gravelly sand
Gravelly sand
Gravelly sand
Not present
Gravelly sand
PERMEABILITY (m/s) > 10-7 10-5 10-5 - 10-5 DRY DENSITY (t/m3) Not specified 1.9 1.8 - 1.8 THICKNESS (mm) > 150 120 140 0 70 GRADING (% passing sieve size)
150 mm 75 mm 19 mm
2.36 mm 0.425
mm 0.075
mm
100% 90-100 65-95 25-60 18-40 10-30
100% 100 100 47 33 18
100% 100 100 35 21 12
- 100% 100 100 48 33 20
LIQUID LIMIT (%) <40 34 34 - 32 PLASTICITY INDEX >15 11 13 - 10 EMERSON CLASS Not specified 8 8 - 8 LINEAR SHRINKAGE (%)
Not specified 6 5 - 7
MOISTURE CONTENT (%)
na 7 6 - 8

90
12.3 Material Characteristics/Availability At many mine sites, the availability of an adequate supply of cover material with suitable characteristics is a major concern. In addition, removal of soil over large areas may have a profound environmental impact that is not readily remediated. At Rum Jungle, cover materials were sourced from five nearby borrow-pits (Table 8). Although preliminary testing indicated that the materials met with the design specifications, this research has shown that some cover characteristics fall outside the specified parameters. The majority of the material appears to be of lateritic origin and may be residual or transported. As is indicated in Table 27, the dominant clay is kaolinite which is stable. However, in Fe-rich environments such as the Rum Jungle areas, substitution of Fe in the kaolin structure produces smaller, more active crystallites (Cornell and Schwertmann, 1996) with a high cation exchange capacity (Ma and Eggleton, 1999). The composition of Zone 1A which was specified to be a lateritic clay is in fact a gravelly and sandy clay with the fine earth fraction being of lighter texture (Table 30). In the eight trenches analysed in detail, up to an estimated 7% of the volume was of quartzitic and other rock up to 50 mm in diameter. The materials in Zones 1B and 2A are generally of heavier texture than specified (Tables 31, 32), and again contain significant volumes of large waste and country rock. Although only a very small area of the cover was examined, there is evidence that there was an insufficient supply of material meeting the specifications for each of the three zones of the cover. Despite the use of some sub-standard materials, monitoring showed that the cover initially performed according to specification. Analysis of the liquid limit and plasticity index of the material in the infilitration resistant zone (1A) shows that it was close to or below its plastic limit. Although the activity of the material is low (linear shrinkage is ≤10%; Table 30), this implies that any reduction in moisture content from the present level would result in shrinkage cracks. The anisotropy of soil in situ can have a marked effect on permeability. Head (1982) states that discontinuities such as cracks and fissures, lenses or intrusions of silt or sand, or production of organic material can cause the permeability measured in the field to be several orders of magnitude greater than the permeability measured in the laboratory. The cracks produced in the 1A layer are exploited by plant roots and /or filled with coarse material so that layer permeability increases over time. The implications are discussed further below.
12.4 Physical/Chemical Changes As previously noted, there is minimal apparent erosion on either the upper vegetated surfaces or the batter slopes of White�s heap, and the current plant community has generally been successful in protecting the surface from erosion despite occasional fires (Kraatz and Norrington, 2002). Although not apparent during this project, Ryan (1992) and Kraatz and Norrington (2002) have reported erosion damage to the drainways which requires on-going maintenance (Richards et al., 1996). They recommended that annual inspections and repair work be continued until a review suggested for 2009 (Kraatz and Norrington, 2002). The absence of damage to drainways during our two visits may be a result of relatively low rainfall during the 2001-02 wet season. A very few number of patches on the upper surface coincide with much thinner covers. Menzies and Mulligan (2000) considered that at Site C, the cover material had been acidified by upward capillary movement of acid waters. This is supported by the low pH (3.7) of the

91
leachate from the Site C cover material (Table 29), which is probably responsible for the death of vegetation in this and other areas. A consequence of this has been the formation of a surface lag through the near-complete loss of finer materials through sheet wash and deposition in vegetated areas downslope. Considerable pedological and other changes have occurred throughout the cover during the approximately 18-year period of development, although the clearest visible changes are those that have taken place close to the surface. One is the development of a thin, near-surface organic layer (also with a high density of fine roots) in the more stable areas; this layer is richer in organic matter than the underlying materials and may represent the development of an incipient A horizon. It is also clear that the texture of the surface will become finer over time due to extensive surface and near-surface casting of fines by soil animals, mainly termites. Compaction of the upper part of the 2A layer has produced a cloddy structure, although this is extensively penetrated by both plant roots and the galleries and chambers (voids) excavated by termites and ants. It is not clear whether this compaction occurred as the layer was being applied or whether traffic associated with establishment and maintenance of the plant cover has been responsible for this. Less physical change has occurred in the 1B layer beyond its regular penetration by roots. However, water appears to be regularly ponded in the lower part of this layer just above the clay-rich 1A sealing layer. This has led to a yellowing of the lower part of this layer and, in trench D, the formation of a discontinuous pan. The formation of this pan has caused the deflection of fine roots in parts, but not their exclusion from the underlying materials. Considerable changes to the structure of the clay-rich 1A layer have occurred. Of particular importance is the formation of a polygonal blocky structure; the voids between the blocks are likely to have been of major importance in providing bypass flow channels for water to enter the underlying wastes during periods of saturated flow resulting from intense rainfall. These voids are clearly a major conduit for roots, and their formation offers a credible pathway for the increased water infiltration observed. The inclusion of coarser-textured materials within this layer may also aid the process. The presence of plant roots implies the formation of root channels. This and other biological influences are considered below. The yellowing of the lower part of the 1B layer (e.g. Plate 8) was to some extent present in all pits. Mineralogical and chemical analyses (Tables 28 and 29) indicate an absence of jarosite or other sulfates. The yellowing probably reflects the ponding of low redox infiltrating waters during and immediately after the wet season. The black discontinuous pan in Trench D (lower in the profile than the other trenches) may also be evidence of water ponding above the barrier layer. There is no evidence from the excavated trenches for illuviation of fine particles from Zone 1A into the underlying waste rock. Compaction of the upper surface of the waste rock prior to covering has resulted in the formation of a clay-textured surface which appears to have covered any voids within the heap. The most significant chemical changes are those which are expressed in the water soluble leachate. A �Principal Components Analysis� (PCA) was conducted to provide an integrated summary of the relationships between pH, EC and the concentrations of the water-soluble fractions of the 19 elements listed in Table 29. The PCA was carried out on the correlation matrix between the variables; eigenvalues and coefficients are also presented in Table 50. The scores for all samples are plotted on the first two principal components (Figure 25).
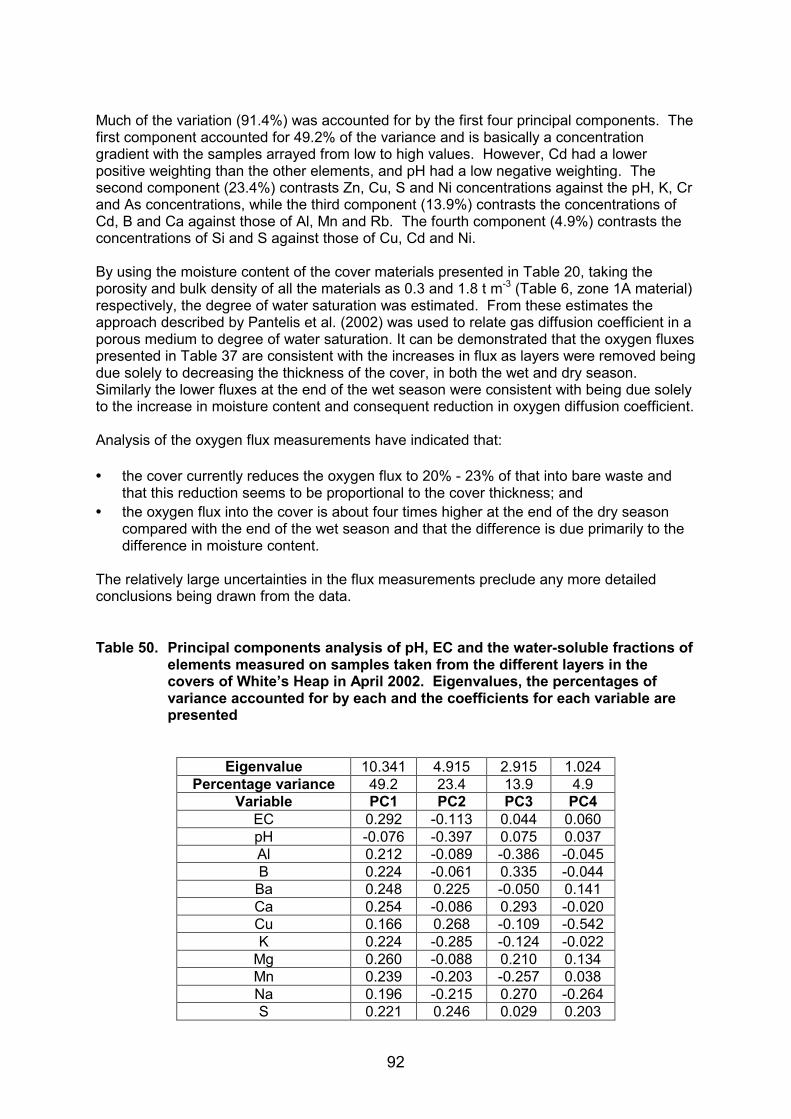
92
Much of the variation (91.4%) was accounted for by the first four principal components. The first component accounted for 49.2% of the variance and is basically a concentration gradient with the samples arrayed from low to high values. However, Cd had a lower positive weighting than the other elements, and pH had a low negative weighting. The second component (23.4%) contrasts Zn, Cu, S and Ni concentrations against the pH, K, Cr and As concentrations, while the third component (13.9%) contrasts the concentrations of Cd, B and Ca against those of Al, Mn and Rb. The fourth component (4.9%) contrasts the concentrations of Si and S against those of Cu, Cd and Ni. By using the moisture content of the cover materials presented in Table 20, taking the porosity and bulk density of all the materials as 0.3 and 1.8 t m-3 (Table 6, zone 1A material) respectively, the degree of water saturation was estimated. From these estimates the approach described by Pantelis et al. (2002) was used to relate gas diffusion coefficient in a porous medium to degree of water saturation. It can be demonstrated that the oxygen fluxes presented in Table 37 are consistent with the increases in flux as layers were removed being due solely to decreasing the thickness of the cover, in both the wet and dry season. Similarly the lower fluxes at the end of the wet season were consistent with being due solely to the increase in moisture content and consequent reduction in oxygen diffusion coefficient. Analysis of the oxygen flux measurements have indicated that: • the cover currently reduces the oxygen flux to 20% - 23% of that into bare waste and
that this reduction seems to be proportional to the cover thickness; and • the oxygen flux into the cover is about four times higher at the end of the dry season
compared with the end of the wet season and that the difference is due primarily to the difference in moisture content.
The relatively large uncertainties in the flux measurements preclude any more detailed conclusions being drawn from the data. Table 50. Principal components analysis of pH, EC and the water-soluble fractions of
elements measured on samples taken from the different layers in the covers of White�s Heap in April 2002. Eigenvalues, the percentages of variance accounted for by each and the coefficients for each variable are presented
Eigenvalue 10.341 4.915 2.915 1.024
Percentage variance 49.2 23.4 13.9 4.9 Variable PC1 PC2 PC3 PC4
EC 0.292 -0.113 0.044 0.060 pH -0.076 -0.397 0.075 0.037 Al 0.212 -0.089 -0.386 -0.045 B 0.224 -0.061 0.335 -0.044 Ba 0.248 0.225 -0.050 0.141 Ca 0.254 -0.086 0.293 -0.020 Cu 0.166 0.268 -0.109 -0.542 K 0.224 -0.285 -0.124 -0.022
Mg 0.260 -0.088 0.210 0.134 Mn 0.239 -0.203 -0.257 0.038 Na 0.196 -0.215 0.270 -0.264 S 0.221 0.246 0.029 0.203
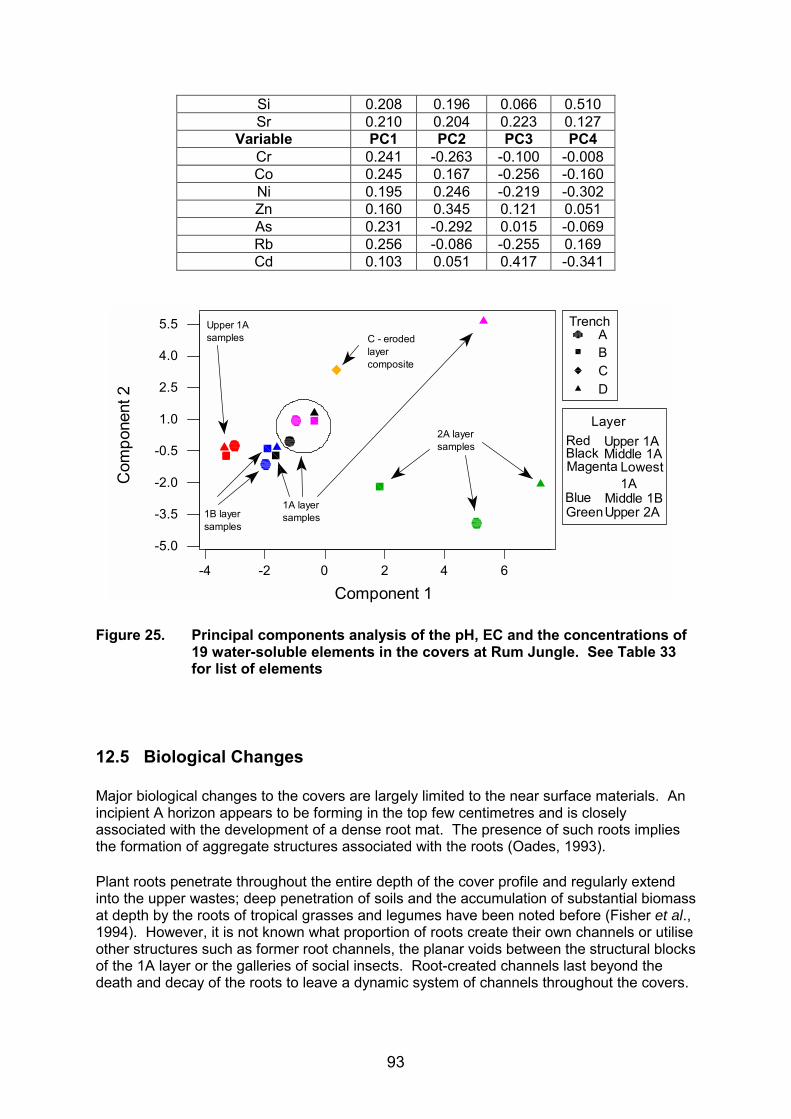
93
Si 0.208 0.196 0.066 0.510 Sr 0.210 0.204 0.223 0.127
Variable PC1 PC2 PC3 PC4 Cr 0.241 -0.263 -0.100 -0.008 Co 0.245 0.167 -0.256 -0.160 Ni 0.195 0.246 -0.219 -0.302 Zn 0.160 0.345 0.121 0.051 As 0.231 -0.292 0.015 -0.069 Rb 0.256 -0.086 -0.255 0.169 Cd 0.103 0.051 0.417 -0.341
Figure 25. Principal components analysis of the pH, EC and the concentrations of
19 water-soluble elements in the covers at Rum Jungle. See Table 33 for list of elements
12.5 Biological Changes Major biological changes to the covers are largely limited to the near surface materials. An incipient A horizon appears to be forming in the top few centimetres and is closely associated with the development of a dense root mat. The presence of such roots implies the formation of aggregate structures associated with the roots (Oades, 1993). Plant roots penetrate throughout the entire depth of the cover profile and regularly extend into the upper wastes; deep penetration of soils and the accumulation of substantial biomass at depth by the roots of tropical grasses and legumes have been noted before (Fisher et al., 1994). However, it is not known what proportion of roots create their own channels or utilise other structures such as former root channels, the planar voids between the structural blocks of the 1A layer or the galleries of social insects. Root-created channels last beyond the death and decay of the roots to leave a dynamic system of channels throughout the covers.
ABCD
-4 -2 0 2 4 6
-5.0
-3.5
-2.0
-0.5
1.0
2.5
4.0
5.5
Component 1
Com
pone
nt 2
Trench
LayerRed Upper 1ABlack Middle 1AMagenta
1ALowest
Blue Middle 1BGreenUpper 2A
compositelayerC - eroded
samples2A layer
samplesUpper 1A
samples1B layer samples
1A layer

94
Similarly, succeeding generations of termites and ants will continually create further galleries and voids and maintain those already existing. Elevated concentrations of a number of metals have been reported from the tissues of plants in this (Menzies and Mulligan, 2000) and similar environments (Milnes et al., 1990). Root penetration into the upper layer of wastes is likely to result in the uptake of metals from these acid waste materials and, in the long term, will lead to deposition on and close to the surface through fine root turnover, leaf shedding and plant death. That this process has commenced is suggested by the higher concentrations of the water-soluble fractions of a number of metals in the upper part (and the lower part of the 1A clay layer) of the covers. Termites and, to a lesser extent ants, are populous on the site. They belong to the �ecosystem engineers� (Jones et al., 1994), soil faunal organisms that � together with plant roots - are sufficiently large and strong to physically alter the structure of the cover profile. The major changes attributable to their activities are also clearest in the 2A layer materials, although their effects may also be apparent deeper in the cover profile. As indicated in this study, termites are active within the 1A layer where they may be gathering clays for lining their galleries and nests and for building into above-ground mounds. This must cast some doubt on the accuracy of Ryan�s (1992) comment that they were not �targeting� the 1A layer. The effects of these animals on the infiltration and gas exchange properties of the covers are unknown. However, it is known from natural soils elsewhere that their presence can influence the pore volume of the soil and infiltration rates (Eldridge, 1994). It is probable that the sub-vertical galleries (and former root channels) act as conduits for the bypass flow of water into the profile under saturated conditions. In the same way, they may also act as conduits for the advective flow of gas through the cover. The future biological development of the covers is closely dependent on the types of plant communities that are maintained on their surfaces. Clearly different scenarios can be envisaged depending whether the status quo is continued with its regular energy and fertiliser subsidies or whether some form of woody vegetation is permitted to colonise the area. Over long time periods, continuing sequestration of P and low chemical fertility in the acid, somewhat saline, Fe-rich materials of the covers is likely to put many agricultural species at a competitive disadvantage for nutrient resources. Withdrawal of continuing fertiliser and energy subsidies may be expected to lead to opening of the pasture sward creating opportunities for species to invade that are better adapted to the stresses imposed by low pH, salinity and a poor nutrient status (Chapin 1980). This is already happening to a degree as evidenced by colonisation of a range of weed and other species (Kraatz and Norrington, 2002). If woody species are allowed to colonise the site, it is likely that these will initially be predominantly Acacia species, because their arillate seeds are attractive to birds and other seed-spreading groups such as ants. The Eucalyptus and Corymbia species, and those without specific spreading adaptations, may be expected to colonise much more slowly. Root growth strategies will also influence cover development: shallow rooting species (such as Acacia auriculiformis) may be expected to be less disruptive to the covers in the long term than such deeper rooting plants as the major Eucalyptus and Corymbia species (Ryan, 1987; Milnes et al. 1990). However, it is clear that, whatever strategy is employed, plant roots will continue to penetrate the upper waste materials.

95
13. CONCLUSIONS Examinations of the 18 year-old covers on White�s heap at Rum Jungle has highlighted the following points:
• A storage-release, water-shedding design appears to have been appropriate for this monsoonal climate;
• A cover design based on material available in the immediate vicinity and cost is not necessarily appropriate;
• Adequate supervision and quality control is essential during the construction phase;
• Adequate instrumentation should be installed at the time of construction to enable the performance of a cover to be quantified with respect to water infiltration rates (lysimeters) and oxidation (oxygen concentration profiles and temperature profiles);
• Instrumentation should be monitored periodically for many years;
• Colonisation of constructed landforms by termites (and ants) is an intrinsic and inevitable part of ecosystem and soil development in the Australian tropics (and elsewhere) and cover designs must accommodate their impact on soil hydraulic properties;
• Penetration of covers by plant roots, whether from pasture grasses, weeds or native vegetation is probably unavoidable and the impact is presently unquantified;
• Well-designed drainage systems and erosion prevention structures have been shown to be effective, even when subjected to high intensity rainfall events;
• Although oxygen flux can be limited by covers and can reduce the overall oxidation rate in the waste rock, the reduction may be less than an order of magnitude; and
• Deterioration in cover performance with respect to water infiltration appears to be due to increased permeability related to the formation of shrinkage cracks in the clay-rich layer combined with illuviation of coarse materials into the cracks, and to the effect of root penetration and the formation of termite galleries.
There are many mines producing sulfidic wastes in tropical Australia that are subject to high intensity monsoonal rainfall events. Covers are widely used in that environment to limit AMD generation and/or transport. In addition to a clear requirement for detailed modelling using the characteristics of available materials and incorporating the effects of the prevailing climatic conditions, the study of the Rum Jungle covers indicates that:
• Allowance must be made for changes in permeability resulting from root penetration and voids due to termite and ant galleries;
• Comprehensive physical and geochemical testing of potential cover materials is required to ensure that they meet specifications, particularly with respect to desiccation shrinkage. It is important to either find material that matches the design specifications or to determine the properties of materials that are available and to include those measured properties in design modelling; and

96
• To reduce potentially high cost, long-term maintenance requirements, future covers should be planted with native grasses, shrubs and trees which may also increase evapotranspiration.
14. FUTURE COVER DESIGN The waste rock covers at Rum Jungle were designed over 20 years ago to reduce rainfall infiltration by both water-shedding and storage-release. Although the designers did not have the benefit of the various software packages presently available for cover modelling, the Rum Jungle covers performed according to specifications for at least a decade. Deterioration at Rum Jungle seems to have been due to changes in the properties of the cover layers, resulting from the penetration of roots, termites and ants. There is also evidence of cracking of the 1A layer, suggesting that the water storage-release layer 1B should have been thicker. Modelling cover performance is an essential stage of the design process. However any modelling must incorporate rigorous checks of the assumptions made about materials properties and reactivities, especially those to be used in the low-permeability layers. Any design approach for a long-term cover needs to take into account the probable changes in material properties over time, including the unavoidable pedological and biological processes that will occur in the covers. Finally, future designs should include consideration of assumptions made of the resistance to change of the materials used when exposed to acid, saline and other extreme solutes. The thickness of any storage-release layer must be carefully considered using available models. However, as illustrated in the present study, the deep-rooting habit of many tropical herbaceous plants indicates that it may be unrealistic to design a layer that would maintain a sufficiently high moisture content in an underlying clay layer to prevent its hydraulic conductivity and gas diffusion coefficient from changing significantly throughout a year. The low-permeability clay layer at Rum Jungle served the purpose of controlling water infiltration, protecting the upper cover layers from chemical contamination and reducing oxygen flux into the underlying wastes. As indicated in the present study, this clay-rich layer may self-organise into a series of polygonal blocks and develop substantial continuous vertical and subvertical inter-block voids that may traverse the entire layer. As shown above, plant roots readily penetrate such voids to gain access to the underlying wastes. Careful selection of appropriate unreactive materials is clearly required to avoid deterioration of a cover over time. As noted in this study and in previous examinations, the selection of appropriate vegetation is of prime importance in stabilising cover surfaces. The cover at Rum Jungle was planted with pasture species as it was believed that tree roots would invade the waste rock thus increasing the permeability. Indeed, the roots of the few volunteer tree species examined penetrated the cover and may well contribute to increased permeability. The improved pasture-grass-based communities are unlikely to be remain effective in stabilising the cover surfaces for long periods without fertilization; this suggests that promotion of communities dominated by native grasses and shrubs would lead to greater sustainability over longer periods. As considered above, it is probably unrealistic to expect to be able to completely prevent roots from penetrating the covers unless very deep, impervious covers are constructed.

97
It is impossible to prevent colonization of the covers by termites and ants, and these are normally considered as a positive influence in terms of ecosystem reconstruction. A thicker storage-release layer may reduce invasion of the underlying low-permeability layer by these animals. Construction of a sustainable drainage system to facilitate water-shedding, although expensive, appears to be cost-effective in this monsoonal environment. Such a design must incorporate techniques to minimise erosion of the waterways; those used at Rum Jungle appear to have been effective but have required some maintenance. The distributions of water-soluble elements throughout the profile appear to be in accordance with known processes. The high concentrations of most elements (including U and Pb) in the upper part of the 2A surface layer are consistent with biological �pumping�. That is, metals and other elements from the wastes are taken up and translocated to the above-ground plant parts; these are later shed on the surface as dead leaves and other litter. In the very upper part of the profile they are also shed through the decomposition of fine root materials. Milnes et al. (1990) also reported significant uptake of metals (including U and Pb) into the foliage of a number of plant materials growing on wastes at the Rum Jungle South Mine. A further possible contributing factor is that the materials deposited on the surface by termites - and ants to a lesser extent � may be metal-rich materials derived from lower in the cover profile. This is consistent with the presence of active termites in galleries in the 1A layer at 0.55 m. Given the coarse textures of the upper 2A and 1B layers and their lower elemental concentrations, capillary rise seems an improbable explanation for the higher concentrations of elements in the upper 2A layer. However, it is likely that the higher concentrations of elements in the lower part of the 1A layer are due to this cause.
15. ACKNOWLEDGEMENTS The financial support of the International Network for Acid Prevention (INAP), as the major sponsor, and the Queensland Department of Natural Resources and Mines and Queensland Environmental Protection Agency, as minor sponsors, is gratefully acknowledged. Compass Resources NL and the Northern Territory Department of Infrastructure, Planning and Environment are acknowledged for permitting access to the Rum Jungle mine site. The contribution by Gene Davidson (ANSTO Environment) to the field measurement program, Mark Raven (CSIRO Land and Water) for XRD analyses, Mike Hart (CSIRO Exploration and Mining) for XRF analyses and Lesley Dotter (CSIRO Exploration and Mining) for analyses of the leachates is also gratefully acknowledged. Finally, Nick Currey (Placer Dome Asia Pacific) is thanked for his critical review of the document on behalf of INAP.
16. REFERENCES Allen, C.G. and Verhoeven, T.J. (Eds) (1986). Rum Jungle Rehabilitation Project, Final Project Report. Technical Report Number 7245 1013 3. (NT Department of Mines and Energy: Darwin).

98
Andersen, A.N. (1994). Ants as indicators of restoration success following mining in northern Australia, in Hallenstein, C.P. (Ed) Australian Mining Looks North: The Challenges and Choices, AusIMM Annual Conference (Darwin, NT: August 5-9, 1994). (Australasian Institute of Mining and Metallurgy: Parkville, Vic.), pp. 465-467. Braithwaite, R.W., Miller, L. and Wood, J.T. (1988). The structure of termite communities in the Australian tropics. Australian Journal of Ecology, 13, 375-91. Butcher, A.R. and Sutherland, D. (1999). Mineralogical Investigation of Mine Waste Samples by XRD and QEMSCAN. CSIRO Minerals Report DMR-1111, July 1999. Cameron McNamara (1984). Rum Jungle Rehabilitation Stage 4.1: Intermediate and Dyson’s Overburden Heaps and Other Works – Design Report. Chapin, F.S. III (1980). The mineral nutrition of wild plants. Annual Review of Ecology and Systematics, 11, 233-260. Cornell, R.M. and Schwertmann, U. (1996). The Iron Oxides, VCH, Weinheim. Dames and Moore, (1983). Site Investigations. Rehabilitation of Whites and Whites North Heaps, Rum Jungle, Northern Territory. Dames and Moore (1984). Miscellaneous Site Investigations. Rum Jungle Rehabilitation Stage 3. Daniel, J.A., Harries, J.R. and Ritchie, A.I.M. (1982). Runoff and seepage from waste rock dumps containing pyritic material. Hydrology and Water Resources Symposium, Melbourne 1982. Davidson G., Nefiodovas, A., Spain, A. and Taylor, G.F. (2002) Determination of the Reasons for Deterioration of the Rum Jungle Waste Rock Cover. Progress Report to ACMER, CSIRO/ANSTO. Davy, D.R. (Ed) (1975). Rum Jungle Environmental Studies. Australian Atomic Energy Commission, September 1975. (AAEC/E365). Eldridge, D.J. (1994). Nests of ants and termites influence infiltration in a semi-arid woodland. Pedobiologia, 38 (6), 481-92. Fisher, M.J., Rao, I.M., Ayarza, M.A. (1994) Carbon storage by introduced deep-rooted grasses in South American savannas. Nature, 371, 236-8. Fraser, W.J. (1975) The embayment line of mineralization, Rum Jungle. In Economic Geology of Australia and Papua New Guinea. Vol. 1 Metals. (AusIMM: Melbourne) pp. 271-277. Head, K.H. (1982). Manual of Soil Laboratory Testing. Vol. 2: Permeability, Shear Strength and Compressibility Tests. (Pentech Press: London). Jepson, W.B. (1988) Structural iron in kaolinites and associated ancillary minerals, in Iron in Soils and Clay Minerals, (Eds J.W. Stucki et al.). (D. Reidel Publishing Co.) pp. 467-536. Jones, C.G., Lawton, J.H. and Shachak, M. (1994). Organisms as ecosystem engineers. Oikos, 69 (3), 373-86.

99
Kraatz, M. and Applegate, R.J.A. (Eds) (1992). Rum Jungle Rehabilitation Project Monitoring Report 1986-1988. Technical Report Number 51. (Conservation Commission of the Northern Territory:Darwin). Kraatz, M. (Ed) (1998). Rum Jungle Rehabilitation Project Monitoring Report 1988-1993. Technical Report Number R97/2. (NT Department of Lands, Planning and Environment: Darwin), March 1998. Kraatz, M. and Norrington, A. (2002). Site integrity, Chapter 8 of Pidsley 2002. Kuo, E.Y., Ritchie, A.I.M., Timms, G.P. and Bennett, J.W. (2003). Infiltration through covers at the Rum Jungle mine site: results from an eighteen-year study. Submitted to Water, Air and Soil Pollution. Kuo, E.Y., Garvie, A.M. and Plotnikoff, W.W. (2002). Modeling the response of lysimeters, in Proceedings of the Fifth International Conference on Acid Rock Drainage, Denver, USA, May 2000, 1, pp. 225-234. Lavelle, P.M. and Spain, A.V. (2001). Soil Ecology. (Kluwer Academic,:Dordrecht). Lawton, M.D. and Overall R. (2002). Surface water monitoring, Chapter 3 of Pidsley 2002. Ma, Chi and Eggleton, R.A. (1999). Cation exchange capacity of kaolinite. Clays and Clay Minerals, 47, 174-180. Majer, J.D. (1984). Decolonisation of ants in rehabilitated open-cut mines in northern Australia. Reclamation and Revegetation Research, 2, 279-298. Milnes, A.R., Reddell, P., Playfair, L.A., and Fazey, P.G. (1990). Elemental composition of rock samples, minerals and plant species colonising the waste rock dump (Area 6) Rum Jungle Creek South. CSIRO MRRP Report, 8pp. Oades, J.M. (1993). The role of biology in the formation, stabilization and degradation of soil structure. Geoderma, 56, 377-400. Menzies, N.W. and Mulligan, D.R. (2000). Vegetation dieback on clay-capped pyritic mine waste, J. Environmental Quality, 29, 437-442 (2000). Menzies, N.W. and Mulligan, D.R. (2002). Vegetation dieback on Dyson�s open cut, Chapter 5 of Pidsley 2002. Paton, T.R., Humphreys, G.S. and Mitchell, P.B. (1995). Soils-A New Global View. (Yale University Press: New Haven). Pidsley, S.M. (Ed) (2002). Rum Jungle Rehabilitation Project Monitoring Report 1993-1998. Technical Report Number 01/2002. (NT Department of Infrastructure, Planning and Environment:Darwin), May 2002. Richards, R.J., Applegate, R.J., Ritchie, A.I.M. (1996) The Rum Jungle Rehabilitation Project, in Mulligan, D.R. (Ed) Environmental Management in the Australian Minerals and Energy Industries. (UNSW Press: Sydney), pp. 530-553.

100
Ryan P. (1985). Rum Jungle Rehabilitation Project, Review of Revegetation Operations and Monitoring. October 1984-August 1985. (Conservation Commission of the Northern Territory:Darwin), September 1985. Ryan P. (1986). Rum Jungle Rehabilitation Project. Summary of Revegetation Monitoring and Recommendations. (Conservation Commission of the Northern Territory:Darwin), November 1986. Ryan, P. (1987). Rum Jungle Revisited � A Rum Jungle rehabilitation project update. Landline, 14, 2-4. Ryan, P. (1992). Revegetation, erosion control and cover stability, Chapter 8 in Kraatz and Applegate 1992. Spain, A.V. and Andersen, A.N. (1998). Investigations of soil animal communities in rehabilitated and other lands at Weipa Bauxite Mine. Unpublished CSIRO Minesite Rehabilitation Research Program report to Comalco Pty Ltd, 207pp. Timms, G.P. and Bennett, J.W. (2000). The design and use of a novel device for measuring oxygen flux through covers on sulfidic water rock, in Proceedings of the Fifth International Conference on Acid Rock Drainage, ICARD 2000. 21-24 May 2000. Denver, Colorado. Vol. 2 pp. 841-849. Timms, G.P. and Bennett, J.W. (2002). Effectiveness of covers on the overburden heaps, Chapter 6 of Pidsley 2002. Walker, J. and Hopkins, M.S, (1990) Vegetation, in Australian Soil and Land Survey Field Handbook, 2nd edition. (Inkata Press: Melbourne).
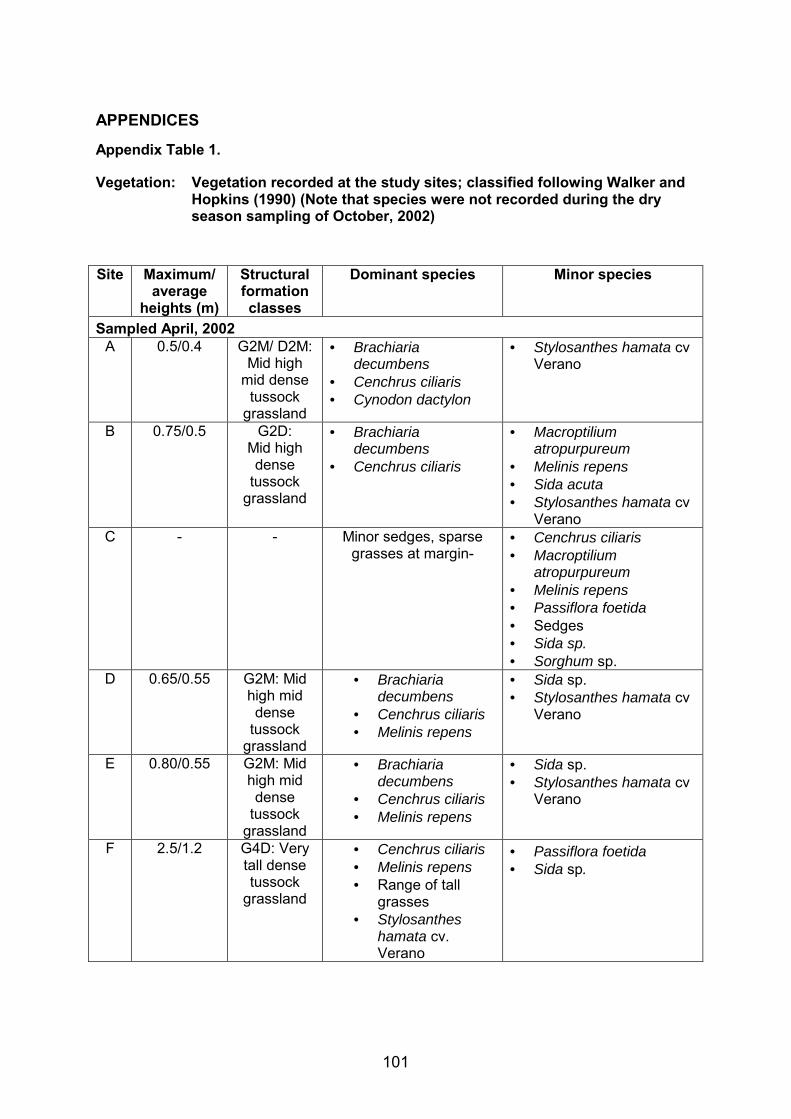
101
APPENDICES
Appendix Table 1.
Vegetation: Vegetation recorded at the study sites; classified following Walker and Hopkins (1990) (Note that species were not recorded during the dry season sampling of October, 2002)
Site Maximum/
average heights (m)
Structural formation classes
Dominant species Minor species
Sampled April, 2002 A 0.5/0.4 G2M/ D2M:
Mid high mid dense
tussock grassland
• Brachiaria decumbens
• Cenchrus ciliaris • Cynodon dactylon
• Stylosanthes hamata cv Verano
B 0.75/0.5 G2D: Mid high dense
tussock grassland
• Brachiaria decumbens
• Cenchrus ciliaris
• Macroptilium atropurpureum
• Melinis repens • Sida acuta • Stylosanthes hamata cv
Verano C - - Minor sedges, sparse
grasses at margin- • Cenchrus ciliaris • Macroptilium
atropurpureum • Melinis repens • Passiflora foetida • Sedges • Sida sp. • Sorghum sp.
D 0.65/0.55 G2M: Mid high mid dense
tussock grassland
• Brachiaria decumbens
• Cenchrus ciliaris • Melinis repens
• Sida sp. • Stylosanthes hamata cv
Verano
E 0.80/0.55 G2M: Mid high mid dense
tussock grassland
• Brachiaria decumbens
• Cenchrus ciliaris • Melinis repens
• Sida sp. • Stylosanthes hamata cv
Verano
F 2.5/1.2 G4D: Very tall dense tussock
grassland
• Cenchrus ciliaris • Melinis repens • Range of tall
grasses • Stylosanthes
hamata cv. Verano
• Passiflora foetida • Sida sp.

102
Appendix Table 1. (cont) Site Maximum/
average heights (m)
Structural formation classes
Dominant species Minor species
Sampled October, 2002 A 0.70/0.25 G1D - - B 0.75/0.27 G2D - - G 0.70/0.25 G1M - D 0.70/0.37 G2D - - - -

103
Appendix Table 2. Cover characteristics: Predominant Munsell colour classes (wet) and comments on
the texture and structure of the different layers recorded at each site
Site Layer
No. Layer Depth
range (mm)
Munsell colour (wet)
Comments
Sampled April, 2002. A 1 2A 0-0.12 5YR 4/6
(yellowish red)
Cloddy, compacted, gravelly layer but less gravelly than layer 2; many voids (galleries and chambers) excavated by social insects; many fine roots.
2 1B 0.12-0.24
10R 3/3 (dusky
red)
Gravelly, largely unstructured layer; many fine roots.
2 1B 0.29-0.34
5YR 4/6 (yellowish
red)
Some yellowing in this layer; thickness variable: 0.05-0.10 m.
3 1A 0.34-0.72
2.5YR 3/6 (dark red)
Massive stony clay; stones ca. 7% of trench face at this depth; occasional fine roots.
Wastes - 0.72+ 5Y 3/2 (dark olive
grey)
Variation to black (5Y 2.5/1) in some areas.
B 1 2A 0-0.14 2.5 YR 3/3
(dark reddish brown)
Cloddy, compacted, Medium gravelly layer (modal 10 mm, max. to 80 mm). Has a thin incipient organic A1 (ca. 10 mm) at surface.
2 1B 0.14-0.31
5YR 3/6 (dark
reddish brown)
A largely unstructured, gravelly (modal, 5 mm) layer with some clay-rich inclusions. Dark nodules. Layer increasingly yellow at base (10YR 7/8).
3 1A 0.31-0.55
2.5YR 3/6 (dark red)
A massive, dark red, clay-rich layer with quartz rocks embedded.
4 1A 0.55-0.78
5YR 4/4 (reddish brown)
Rocky (max. 0.15 m), friable, mixed materials with yellow and grey weathering rinds on rocks.
5 1A 0.78-0.83
2.5YR 3/4 (dark
reddish brown)
Similar to layer 3 but less coherent. Range in thickness: 0.02 to >0.5 m but with inclusions of other materials.
Wastes - 0.83+ 2.5Y 2.5/1(black)
Black wastes.
C 1 - 0-0.02 - A continuous gravelly surface lag. 2 1B? 0.02-
0.06 2.5YR 3/4
(dark reddish brown)
Dark reddish brown gravelly layer.
3 1A 0.06-0.140
10R 4/6 (red)
Red, clay-rich layer with some quartz inclusions; cracked extensively; dead roots from previous vegetation apparent.

104
Appendix Table 2 (cont.) Site Layer
No. Layer Depth
range (mm)
Munsell colour (wet)
Comments
Wastes - 0.14+ 5Y 4/1 (dark grey)
Oxidising olive-yellow (2.5Y 6/6) wastes.
D 1 2A 0-07 2.5YR 3/4 (dark
reddish brown)
Cloddy, compacted dark reddish brown layer.
2 1B 0.07-0.39
2.5YR 4/4 (reddish brown)
A largely unstructured, gravelly layer with soft oxidised rock fragments, yellow colours. Light red (10YR 6/8) rocky inclusions. Darker included layer to 0.11 m.
3 - 0.390-0.395
- Thin discontinuous pan, 3-5 mm thick.
4 1A 0.395-0.68
2.5YR 4/8 (olive
brown)
Massive red clay layer with light red (10R 6/8) rocky inclusions and quartz fragments.
5 1A 0.68-0.78
2.5YR 3/6 (dark red)
Massive layer of dark red coherent clay with embedded ore fragments.
Wastes - 0.78+ 5Y 4/2 (olive grey)
E 1 2A 0-0.12 2.5YR 4/4 Cloddy compacted layer with dense mass of grass and tree roots.
2 1B 0.12-0.25
2.5YR 4/4 Medium gravelly layer: modal size 5-10 mm, maximum to 0.10 m. A few blocks of brownish yellow (10YR 6/8). weathering ore
3 1B 0.25-0.40
7.5YR 5/8 (strong brown)
As for layer 2 at the top but increasingly yellow with depth: (7.5YR 5/8 at 0.39 m); black pisolites present.
4 1A 0.40-0.69
2.5YR 3/6 (dark red)
A red, clay-rich layer with embedded quartz gravel (modal 5-10 mm, maximum to 40 mm).
Wastes - 0.69+ 5Y 4/1 (dark grey)
Stony wastes embedded in a finer matrix. No yellow colours noted.
F 1 2A? 0-0.15 2.5YR 2.5/4
(dark red)
Compacted cloddy layer, finer textured than layer 2.
2 1B 0.15-0.67
5YR 4/4 (yellowish
red)
Stony layer
2 1B 0.67-0.72
7.5YR 4/6 (strong brown)
Strong brown layer, increasingly yellow at base of layer (0.70 m: 7.5YR 4/6) with
3 1A 0.72-0.93
2.5YR 3/4 (dark red)
Massive dark red clay layer with embedded stones.
Wastes - 0.93+ - -

105
Appendix Table 2. (cont.) Site Layer
No. Layer Depth
range (m)
Munsell colour (wet)
Comments
Sampled October, 2002. A� 1 2A 0-0.10 2.5YR 3/4
(dark reddish brown)
Cloddy, compacted, dark-reddish-brown layer with many termite galleries. Fine earth: sandy clay loam.
2 1B 0.10-0.29
2.5YR 4/6 (red)
A largely unstructured, gravelly, brownish-yellow (10YR 6/8) layer with yellow (10YR 7/6) rocky inclusions. Some white powdery inclusions. Fine earth: sandy clay loam.
3 1A 0.29-0.65
2.5YR 3/4 (dark
reddish brown)
Massive, compacted, dark reddish brown clay layer with light red (10R 6/8) rocky inclusions and lighter quartz fragments. Has desiccation cracks to 3 mm wide extending throughout the whole depth of the layer. Many with roots following cracks. Many dark ferric segregations. Fine earth: sandy clay loam
B 1 2A 0-0.08 2.5YR 3/4 (dark
reddish brown)
Massive, compacted, dark reddish brown cloddy layer with dense mass of very fine roots. Fine earth: sandy loam.
2 1B 0.08-0.18
5YR 3/4 (dark
reddish brown)
Medium gravelly layer. Embedded rocks to 0.15 m in longest dimension. Fine earth: sandy clay loam
3 1A 0.18-0.43
2.5YR 3/6 (dark red)
A massive, dark red, clay-rich layer with embedded quartz stones to 0.06 m. Showing irregular vertical/subvertical cracking with a mean interval of 0.34 m. Fine earth: light clay.
G 1 2A 0-05 2.5YR 4/4 (reddish brown)
Compacted cloddy layer with dense system of very fine roots and termite galleries. Fine earth: loam.
2 1B 0.05-0.10
2.5YR 4/6 (red)
Loose, gravelly layer with more angular gravels than layer 1. Fine earth: fine sandy loam.
3 1A 0.10-0.43
2.5YR 3/4 (dark
reddish brown)
Clay layer but much less massive than in pit A2 and with extensive vertical and subvertical cracking extending throughout layer. This layer has a high proportion of gravels of modal size 6 mm as loose gravelly segregations. Fine earth: clay loam.

106
Appendix Table 2. (cont.) Site Layer
No. Layer Depth
range (mm)
Munsell colour (wet)
Comments
D 1 2A 0-09 2.5YR 3/4 (dark
reddish brown)
Cloddy, compacted dark reddish brown layer with many termite galleries. Gravelly (rounded, sub-rounded), very fine roots throughout. Fine earth: sandy loam.
2 1B 0.09-0.27
2.5YR 3/6 (dark red), lower 0.05 m of this
layer 7.5YR 5/6
(strong brown)
An unstructured, gravelly layer with iron segregations and more angular gravels than layer 2A, very fine roots common. Soft oxidised rock fragments, yellow colours developed in the lower part of this layer. Fine earth: sandy clay loam.
3 1A 0.27-0.45
2.5YR 3/6 (dark red)
Massive, dark red compacted clay layer with rocky inclusions. Vertical and subvertical cracking throughout layer, roots following cracks between blocks. Fine earth: light clay.
Wastes - 0.45+ 2.5Y 4/1 (dark grey)

107
Appendix Table 3. Root characteristics: Distributions of very fine (<1 mm diameter) and fine (1-2 mm
diameter) roots in the different layers recorded at each site. Data are numbers of roots counted in 0.01 m2 areas demarcated on trench face
Site Layer
No. Depth range
(mm) Very fine
roots
Fine roots
Comments
Sampled April, 2002 A 2A 0-0.10 25-200 0 1B 0.10-0.20 25-200 0 1B 0.20-0.30 10-25 0 1A 0.30-0.40 1-10 0 1A 0.40-0.50 1-10 0 1A 0.50-0.60 25-200 0 Root concentration 1A 0.60-0.70 10-25 0 Wastes 0.70-0.80 1-10 0 Roots found in wastes at >10 locations,
extended to 0.20 m below waste:cover interface
B 2A 0-0.01 25-200 0 1B 0.14-0.24 10-25 0 1A 0.31-0.41 1-10 0 1A 0.41-0.51 1-10 0 1A 0.55-0.65 1-10 0 Wastes 0.78-0.88 0 0 Roots found in wastes at >16 locations,
extended to 0.24 m below waste:cover interface C 1B 0.01-0.07 10-25 0 Largely dead roots Wastes 0.07-0.16 0 0 No roots observed
D 2A 0-0.10 25-200 1-10 1B 0.10-0.20 25-200 0 1B 0.20-0.30 25-200 0 1A 0.38-0.39 - - Concentrations of very fine roots above pan 1A 0.39-0.49 1-10 0 Occasional roots noted Wastes 0.78+ Roots extended into wastes at 4 locations
E 2A 0-0.10 25-200 1-10 1B 0.12-0.22 10-25 1-10 1B 0.30-0.40 1-10 1-10 Many coarse roots above interface with clay
layer below 1A 0.40-0.50 10-25 1-10 1A 0.50-0.60 1-10 0 1A 0.60-0.70 1-10 0 Wastes 0.70-0.80 1-10 1-10 Roots found in wastes at 5 locations;
considerable localised concentrations of very fine and fine roots in upper 0.01 m of wastes
Wastes 0.80-0.90 0 0 Roots found in wastes at 5 locations, extended to 0.18 m below waste:cover interface

108
Appendix Table 3 (cont.) Site Layer
No. Depth range
(mm) Very fine
roots
Fine roots
Comments
Sampled April, 2002 F 2A? 0-0.10 25-200 1-10 1B 0.25-0.35 25-200 0 Few coarse (>5 mm) diameter roots 1B 0.50-0.60 25-200 1-10 1B 0.63-0.73 1-10 0 1A 0.80-0.90 1-10 0 Tap root extends to >0.83 m; laterals not
observable 1A 0.90-1.00 1-10 0 Very fine and fine roots extend regularly at least
to cover:waste interface Wastes 1.00+ 0 0 Fine roots found in wastes at >6 locations
Sampled October, 2002 A� 2A 0-0.11 25-200 1-10 1B 0.19-0.29 25-200 1-10 1A 0.34-0.44 10-25 0 Many very fine roots concentrated on block
faces 1A 0.44-0.54 1-10 0 Many very fine roots concentrated on block 1A 0.54-0.64 1-10 0 Many very fine roots concentrated on block
faces 1A 0.64-0.71 1-10 0 Wastes 0.71-0.81 1-10 0 Maximum root depth observed 0.83 m
B� 2A 0-0.01 25-200 0 1B 0.10-0.20 25-200 0 1B 0.20-0.30 10-25 0 1A 0.44-0.54 25-200 0
1A 0.54-0.64 1-10 0 1A 0.64-0.73 1-10 0 Wastes 0.73+ 0 0 Roots observed to penetrate wastes at several
places, to depths of 0.10 m below interface with cover.
G 2A+1B 0-0.01 >200 0 1A 0.12-0.22 25-200 0 Roots mainly confined to horizontal inter-block
faces. 1A 0.22-0.32 25-200 0 1A 0.34-0.44 25-200 0
Wastes 0.44+ 1-10 0 Very fine roots noted to extend into wastes at several locations.
D� 2A 0-0.10 25-200 0 1B 0.10-0.20 25-200 1-10 1B 0.20-0.30 25-200 0 1A 0.30-0.40 1-10 0 Preferential root growth in vertical/subvertical
cracks between polygon faces. 1A 0.40-0.50 1-10 0 Preferential root growth in vertical/subvertical
cracks between polygon faces. Wastes 0.50+ 1-10 0