Determination of the Design Load for Structural Safety...
10
Probabilistic Safety Assessment and Management PSAM 12, June 2014, Honolulu, Hawaii Determination of the Design Load for Structural Safety Assessment against Gas Explosion in Offshore Topside Migyeong Kim a , Gyusung Kim a, *, Jongjin Jung a and Wooseung Sim a a Advanced Technology Institute, Hyundai Heavy Industries, Ulsan, Republic of Korea Abstract: The possibility of gas explosion accidents always exists at offshore facilities of the oil and gas industry. In the design of those structures, the structural safety assessment against explosion loads is necessary to prevent loss of lives or catastrophic failure of structures. One of the essential parts in the structural assessment is to determine design explosion loads. Nowadays, the explosion loads are calculated by probabilistic approach rather than deterministic approach. In the recommended probabilistic load calculation procedure of the offshore explosion accidents, for instance, the NORSOK standard, the design load shall be established based on the relation between the predicted overpressure and its duration from numerous scenarios, and also, the exceedance frequency of the loads to the risk acceptance criteria. In most offshore projects, however, the conservative approach has been used, which derives only the design overpressure from the probabilistic load scenarios, or considers overpressure and duration independently because there is no efficient application method for the suggested procedure. In this paper, the practical method to determine the design explosion load, especially considering both overpressure and duration, are presented by using the response surface model with the joint probability distribution and compared with the present industrial practices. Keywords: Explosion, Design load, Risk, Probabilistic approach 1. INTRODUCTION Explosion accidents always exist at offshore drilling or production facilities in the oil and gas industry due to the characteristics of containing hydrocarbons, and they result in serious impact on personnel, environmental and property. Therefore, the safety assessment of offshore facilities against explosion should be performed on design phase to prevent loss of lives or catastrophic failure of structures and it is preceded by defining design accidental load. The state of the art in determining design explosion loads is the probabilistic approach rather than the deterministic approach usually based on the worst-case scenario because the explosion accident is a complex phenomenon derived by a number of random variables which act along a chain of events connecting the potential hazards to consequence of possible explosion accidents [1]. The design variables considered on calculating explosion loads are sizes and directions of oil or gas leakage, locations of ignition, congestion and confinement in a layout, geometrical shapes of the impacted structures, and so on. The distribution of explosion load is defined based on numerous explosion scenarios using sophisticated analysis method, like CFD(Computational Fluid Dynamics). However, simulating all of possible scenario is very expensive for both man power and computer time. Moreover, the transient characteristic of explosion load leads another difficulty of determining explosion loads being expressed by not a singular item but two components; overpressure and duration. Each value of these load components has a great impact on structural safety because the response of a structure under explosion loads has inconsistent tendency showing some hollows and humps in dynamic region when one component of explosion load is changed as shown in Figure 1 [2]. Therefore, the selection of adequate duration corresponding to the defined overpressure is an important matter on determination of the design explosion load. In the present probabilistic methods of offshore explosion analyses, however, overpressure and duration(or impulse) are usually not treated as a combined term because of the missing probabilistic relation ignored when design explosion loads are determined with given criteria. In this paper, a practical method to determine the design explosion load, especially, considering both of overpressure and impulse(or duration), is suggested using the response surface model with the joint probability distribution of them. So, the design explosion loads are determined as a set of overpressure * Corresponding author: [email protected], [email protected]
Transcript of Determination of the Design Load for Structural Safety...
Probabilistic Safety Assessment and Management PSAM 12, June 2014, Honolulu, Hawaii
Determination of the Design Load for Structural Safety Assessment against Gas Explosion in Offshore Topside
Migyeong Kima, Gyusung Kima,*, Jongjin Junga and Wooseung Sima
a Advanced Technology Institute, Hyundai Heavy Industries, Ulsan, Republic of Korea Abstract: The possibility of gas explosion accidents always exists at offshore facilities of the oil and gas industry. In the design of those structures, the structural safety assessment against explosion loads is necessary to prevent loss of lives or catastrophic failure of structures. One of the essential parts in the structural assessment is to determine design explosion loads. Nowadays, the explosion loads are calculated by probabilistic approach rather than deterministic approach. In the recommended probabilistic load calculation procedure of the offshore explosion accidents, for instance, the NORSOK standard, the design load shall be established based on the relation between the predicted overpressure and its duration from numerous scenarios, and also, the exceedance frequency of the loads to the risk acceptance criteria. In most offshore projects, however, the conservative approach has been used, which derives only the design overpressure from the probabilistic load scenarios, or considers overpressure and duration independently because there is no efficient application method for the suggested procedure. In this paper, the practical method to determine the design explosion load, especially considering both overpressure and duration, are presented by using the response surface model with the joint probability distribution and compared with the present industrial practices.
Keywords: Explosion, Design load, Risk, Probabilistic approach
1. INTRODUCTION
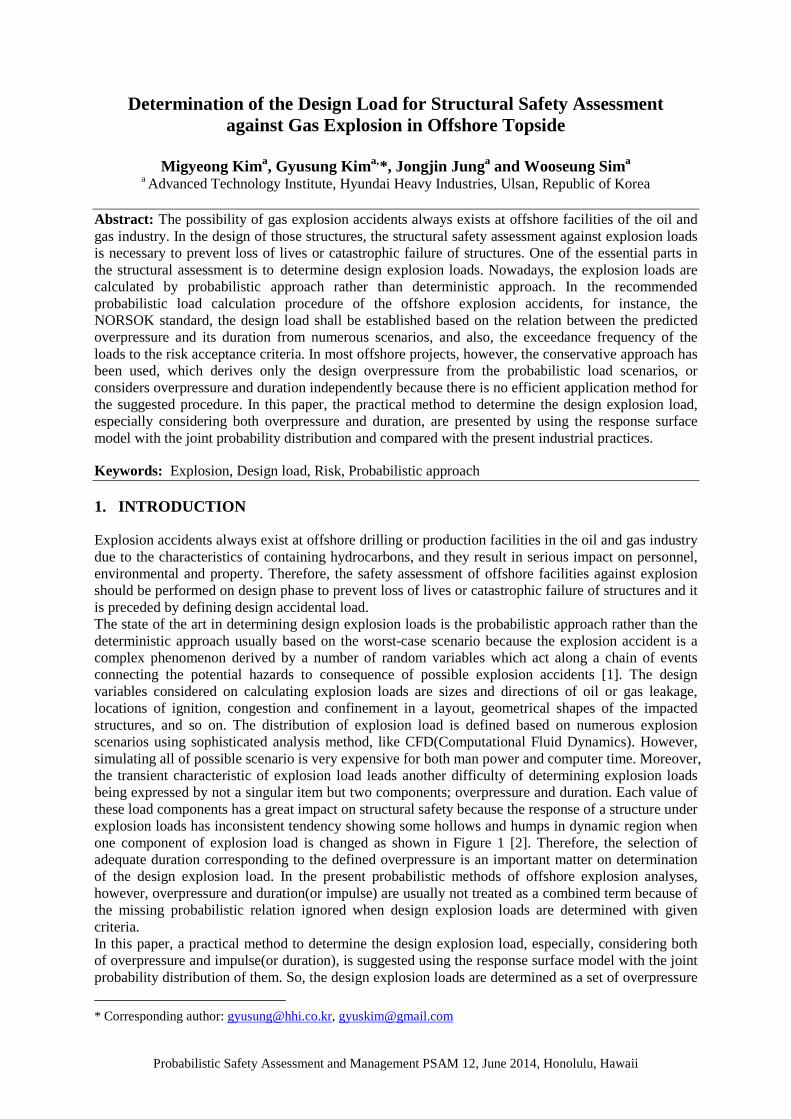
Explosion accidents always exist at offshore drilling or production facilities in the oil and gas industry due to the characteristics of containing hydrocarbons, and they result in serious impact on personnel, environmental and property. Therefore, the safety assessment of offshore facilities against explosion should be performed on design phase to prevent loss of lives or catastrophic failure of structures and it is preceded by defining design accidental load. The state of the art in determining design explosion loads is the probabilistic approach rather than the deterministic approach usually based on the worst-case scenario because the explosion accident is a complex phenomenon derived by a number of random variables which act along a chain of events connecting the potential hazards to consequence of possible explosion accidents [1]. The design variables considered on calculating explosion loads are sizes and directions of oil or gas leakage, locations of ignition, congestion and confinement in a layout, geometrical shapes of the impacted structures, and so on. The distribution of explosion load is defined based on numerous explosion scenarios using sophisticated analysis method, like CFD(Computational Fluid Dynamics). However, simulating all of possible scenario is very expensive for both man power and computer time. Moreover, the transient characteristic of explosion load leads another difficulty of determining explosion loads being expressed by not a singular item but two components; overpressure and duration. Each value of these load components has a great impact on structural safety because the response of a structure under explosion loads has inconsistent tendency showing some hollows and humps in dynamic region when one component of explosion load is changed as shown in Figure 1 [2]. Therefore, the selection of adequate duration corresponding to the defined overpressure is an important matter on determination of the design explosion load. In the present probabilistic methods of offshore explosion analyses, however, overpressure and duration(or impulse) are usually not treated as a combined term because of the missing probabilistic relation ignored when design explosion loads are determined with given criteria. In this paper, a practical method to determine the design explosion load, especially, considering both of overpressure and impulse(or duration), is suggested using the response surface model with the joint probability distribution of them. So, the design explosion loads are determined as a set of overpressure * Corresponding author: [email protected], [email protected]
Probabilistic Safety Assessment and Management PSAM 12, June 2014, Honolulu, Hawaii
and impulse. In this new method, exceedance surface method, the structural response is considered in load determination procedure and acceptance criterion is selected as the load exceedance frequency. For these studies, the explosion scenario data from CFD simulations for the topside structure were used.
Figure 1: Dynamic response of a system under explosion load [2]
2. PROBABILISTIC ANALYSIS OF EXPLOSION LOAD
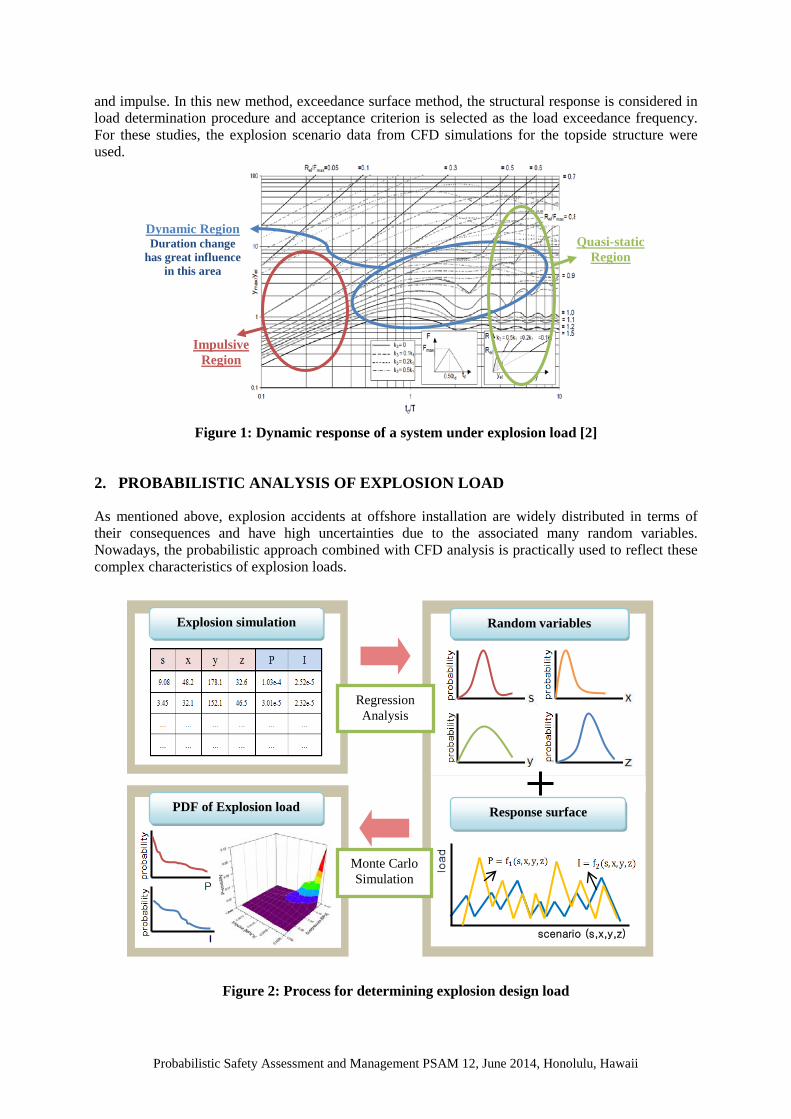
As mentioned above, explosion accidents at offshore installation are widely distributed in terms of their consequences and have high uncertainties due to the associated many random variables. Nowadays, the probabilistic approach combined with CFD analysis is practically used to reflect these complex characteristics of explosion loads.
Figure 2: Process for determining explosion design load
Impulsive Region
Dynamic Region Duration change
has great influence in this area
Quasi-static Region
Random variables
scenario (s,x,y,z)
Response surface
Explosion simulation
PDF of Explosion load
Regression Analysis
Monte Carlo Simulation
Probabilistic Safety Assessment and Management PSAM 12, June 2014, Honolulu, Hawaii
In this paper, existing probabilistic approach is improved in following aspects. For each analysis step, all of the factors which affect the explosion loads are treated as random variables and final results are given as the joint probability distribution of explosion loads which can be applied for the risk based determination of design explosion loads. The modified method for the probabilistic definition of explosion loads is shown schematically in Figure 2. 2.1 Analysis model
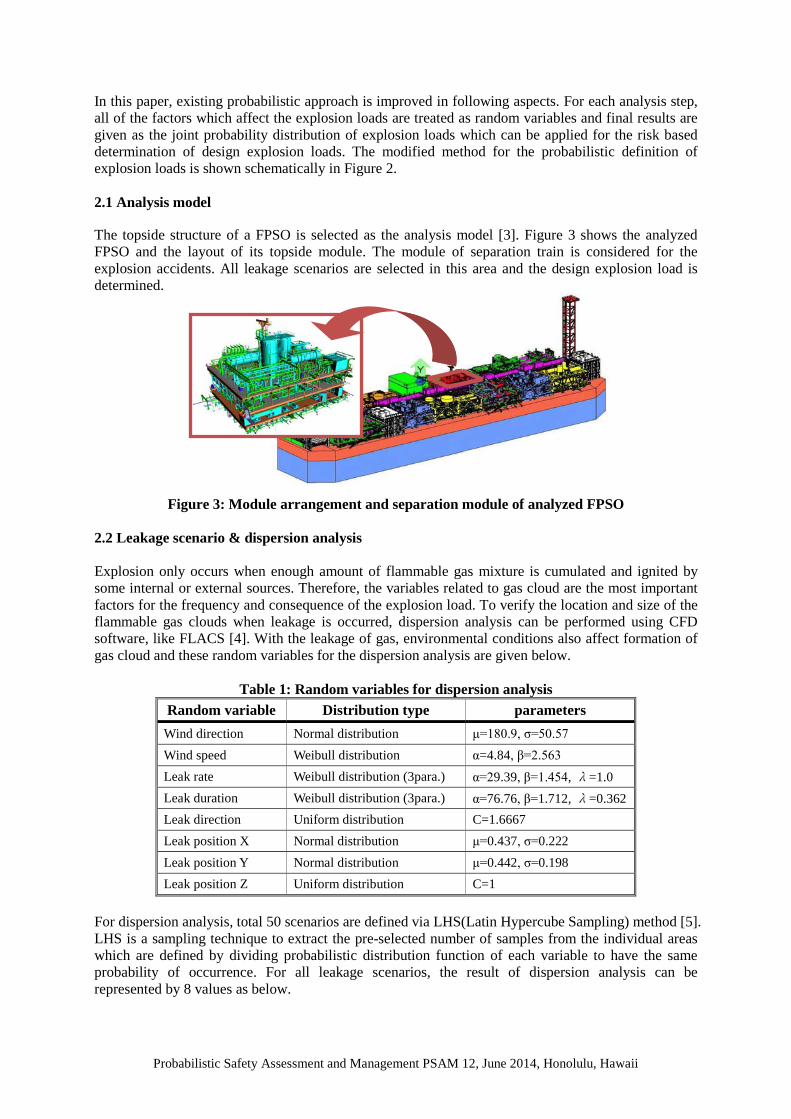
The topside structure of a FPSO is selected as the analysis model [3]. Figure 3 shows the analyzed FPSO and the layout of its topside module. The module of separation train is considered for the explosion accidents. All leakage scenarios are selected in this area and the design explosion load is determined.
Figure 3: Module arrangement and separation module of analyzed FPSO
2.2 Leakage scenario & dispersion analysis Explosion only occurs when enough amount of flammable gas mixture is cumulated and ignited by some internal or external sources. Therefore, the variables related to gas cloud are the most important factors for the frequency and consequence of the explosion load. To verify the location and size of the flammable gas clouds when leakage is occurred, dispersion analysis can be performed using CFD software, like FLACS [4]. With the leakage of gas, environmental conditions also affect formation of gas cloud and these random variables for the dispersion analysis are given below.
Table 1: Random variables for dispersion analysis Random variable Distribution type parameters
Wind direction Normal distribution μ=180.9, σ=50.57 Wind speed Weibull distribution α=4.84, β=2.563 Leak rate Weibull distribution (3para.) α=29.39, β=1.454, λ=1.0 Leak duration Weibull distribution (3para.) α=76.76, β=1.712, λ=0.362 Leak direction Uniform distribution C=1.6667 Leak position X Normal distribution μ=0.437, σ=0.222 Leak position Y Normal distribution μ=0.442, σ=0.198 Leak position Z Uniform distribution C=1
For dispersion analysis, total 50 scenarios are defined via LHS(Latin Hypercube Sampling) method [5]. LHS is a sampling technique to extract the pre-selected number of samples from the individual areas which are defined by dividing probabilistic distribution function of each variable to have the same probability of occurrence. For all leakage scenarios, the result of dispersion analysis can be represented by 8 values as below.
Probabilistic Safety Assessment and Management PSAM 12, June 2014, Honolulu, Hawaii
Gas cloud volume Gas concentration. Gas cloud position in the X dir. Gas cloud position in the Y dir. Gas cloud position in the Z dir. Gas cloud size in the X dir. Gas cloud size in the Y dir. Gas cloud size in the Z dir
2.3 Explosion analysis
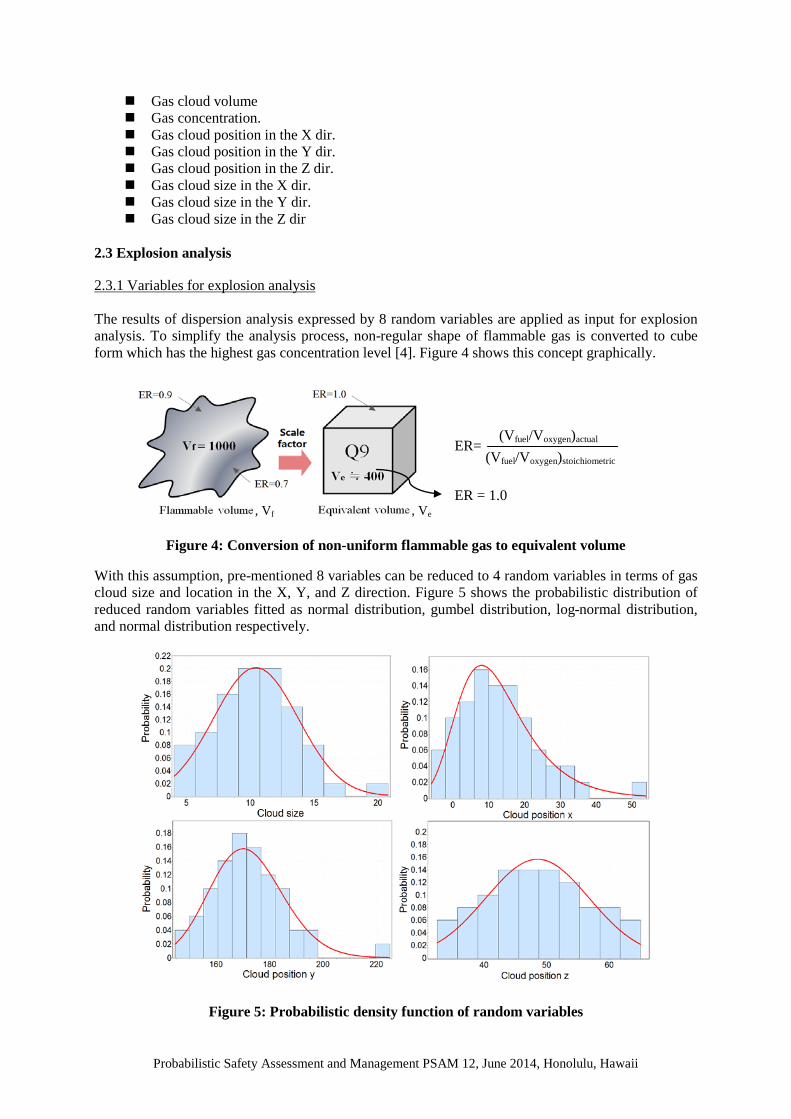
2.3.1 Variables for explosion analysis The results of dispersion analysis expressed by 8 random variables are applied as input for explosion analysis. To simplify the analysis process, non-regular shape of flammable gas is converted to cube form which has the highest gas concentration level [4]. Figure 4 shows this concept graphically.
Figure 4: Conversion of non-uniform flammable gas to equivalent volume
With this assumption, pre-mentioned 8 variables can be reduced to 4 random variables in terms of gas cloud size and location in the X, Y, and Z direction. Figure 5 shows the probabilistic distribution of reduced random variables fitted as normal distribution, gumbel distribution, log-normal distribution, and normal distribution respectively.
Figure 5: Probabilistic density function of random variables
(Vfuel/Voxygen)actual (Vfuel/Voxygen)stoichiometric
ER=
ER = 1.0 , Vf , Ve
,Vf ,Ve
Probabilistic Safety Assessment and Management PSAM 12, June 2014, Honolulu, Hawaii
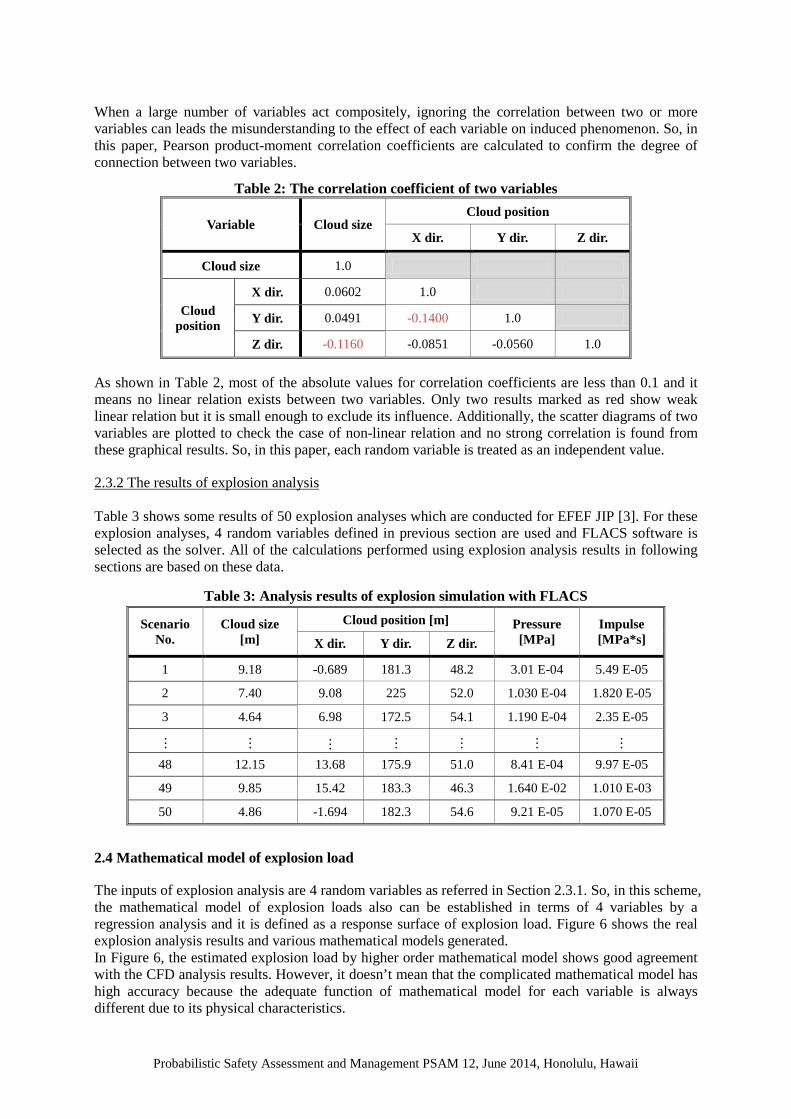
When a large number of variables act compositely, ignoring the correlation between two or more variables can leads the misunderstanding to the effect of each variable on induced phenomenon. So, in this paper, Pearson product-moment correlation coefficients are calculated to confirm the degree of connection between two variables.
Table 2: The correlation coefficient of two variables
Variable Cloud size Cloud position
X dir. Y dir. Z dir.
Cloud size 1.0
Cloud position
X dir. 0.0602 1.0
Y dir. 0.0491 -0.1400 1.0
Z dir. -0.1160 -0.0851 -0.0560 1.0
As shown in Table 2, most of the absolute values for correlation coefficients are less than 0.1 and it means no linear relation exists between two variables. Only two results marked as red show weak linear relation but it is small enough to exclude its influence. Additionally, the scatter diagrams of two variables are plotted to check the case of non-linear relation and no strong correlation is found from these graphical results. So, in this paper, each random variable is treated as an independent value.
2.3.2 The results of explosion analysis Table 3 shows some results of 50 explosion analyses which are conducted for EFEF JIP [3]. For these explosion analyses, 4 random variables defined in previous section are used and FLACS software is selected as the solver. All of the calculations performed using explosion analysis results in following sections are based on these data.
Table 3: Analysis results of explosion simulation with FLACS
2.4 Mathematical model of explosion load
The inputs of explosion analysis are 4 random variables as referred in Section 2.3.1. So, in this scheme, the mathematical model of explosion loads also can be established in terms of 4 variables by a regression analysis and it is defined as a response surface of explosion load. Figure 6 shows the real explosion analysis results and various mathematical models generated. In Figure 6, the estimated explosion load by higher order mathematical model shows good agreement with the CFD analysis results. However, it doesn’t mean that the complicated mathematical model has high accuracy because the adequate function of mathematical model for each variable is always different due to its physical characteristics.
Scenario No.
Cloud size [m]
Cloud position [m] Pressure [MPa]
Impulse [MPa*s] X dir. Y dir. Z dir.
1 9.18 -0.689 181.3 48.2 3.01 E-04 5.49 E-05
2 7.40 9.08 225 52.0 1.030 E-04 1.820 E-05
3 4.64 6.98 172.5 54.1 1.190 E-04 2.35 E-05
… … … … … … …
48 12.15 13.68 175.9 51.0 8.41 E-04 9.97 E-05
49 9.85 15.42 183.3 46.3 1.640 E-02 1.010 E-03
50 4.86 -1.694 182.3 54.6 9.21 E-05 1.070 E-05
Probabilistic Safety Assessment and Management PSAM 12, June 2014, Honolulu, Hawaii
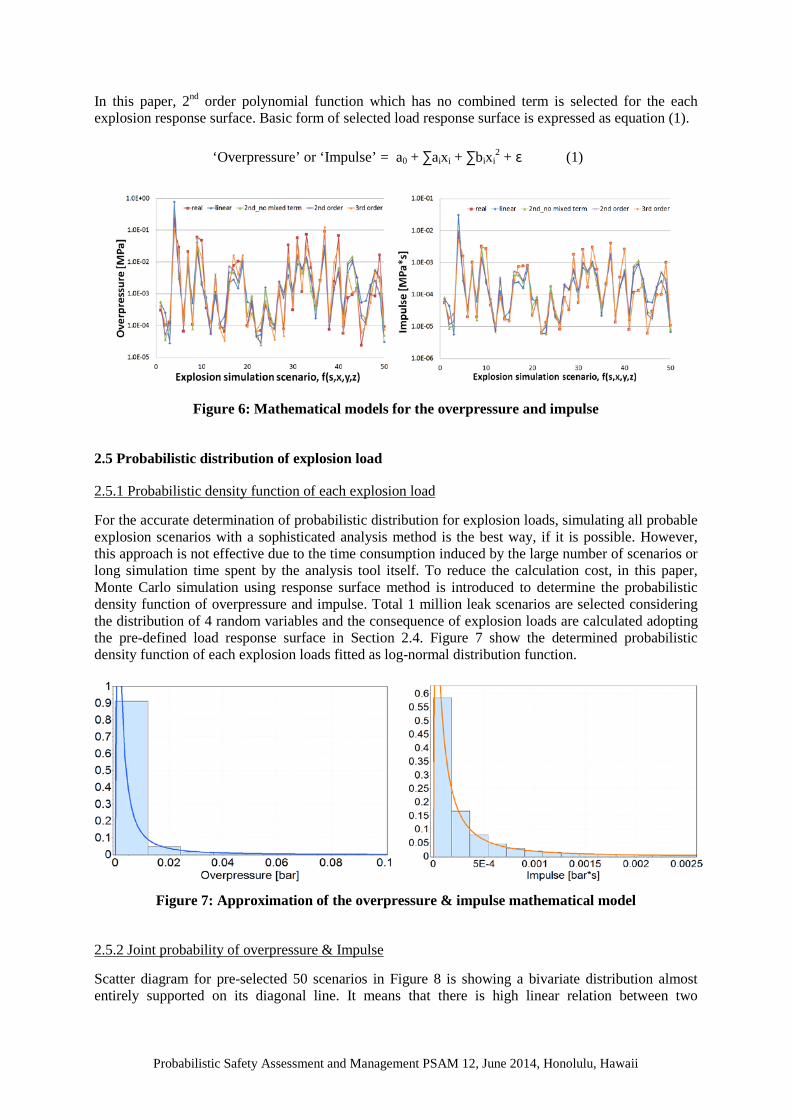
In this paper, 2nd order polynomial function which has no combined term is selected for the each explosion response surface. Basic form of selected load response surface is expressed as equation (1).
‘Overpressure’ or ‘Impulse’ = a0 + ∑aixi + ∑bixi2 + ε (1)
Figure 6: Mathematical models for the overpressure and impulse
2.5 Probabilistic distribution of explosion load
2.5.1 Probabilistic density function of each explosion load For the accurate determination of probabilistic distribution for explosion loads, simulating all probable explosion scenarios with a sophisticated analysis method is the best way, if it is possible. However, this approach is not effective due to the time consumption induced by the large number of scenarios or long simulation time spent by the analysis tool itself. To reduce the calculation cost, in this paper, Monte Carlo simulation using response surface method is introduced to determine the probabilistic density function of overpressure and impulse. Total 1 million leak scenarios are selected considering the distribution of 4 random variables and the consequence of explosion loads are calculated adopting the pre-defined load response surface in Section 2.4. Figure 7 show the determined probabilistic density function of each explosion loads fitted as log-normal distribution function.
Figure 7: Approximation of the overpressure & impulse mathematical model
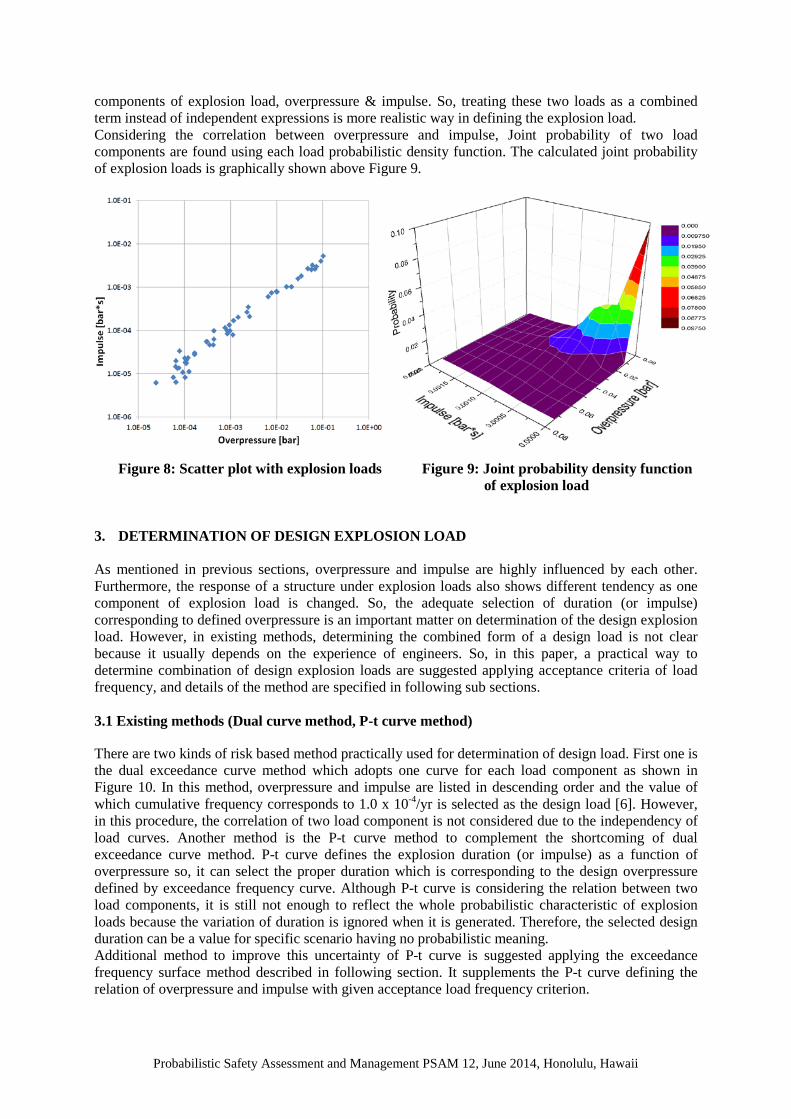
2.5.2 Joint probability of overpressure & Impulse Scatter diagram for pre-selected 50 scenarios in Figure 8 is showing a bivariate distribution almost entirely supported on its diagonal line. It means that there is high linear relation between two
Probabilistic Safety Assessment and Management PSAM 12, June 2014, Honolulu, Hawaii
components of explosion load, overpressure & impulse. So, treating these two loads as a combined term instead of independent expressions is more realistic way in defining the explosion load. Considering the correlation between overpressure and impulse, Joint probability of two load components are found using each load probabilistic density function. The calculated joint probability of explosion loads is graphically shown above Figure 9.
Figure 8: Scatter plot with explosion loads Figure 9: Joint probability density function
of explosion load 3. DETERMINATION OF DESIGN EXPLOSION LOAD As mentioned in previous sections, overpressure and impulse are highly influenced by each other. Furthermore, the response of a structure under explosion loads also shows different tendency as one component of explosion load is changed. So, the adequate selection of duration (or impulse) corresponding to defined overpressure is an important matter on determination of the design explosion load. However, in existing methods, determining the combined form of a design load is not clear because it usually depends on the experience of engineers. So, in this paper, a practical way to determine combination of design explosion loads are suggested applying acceptance criteria of load frequency, and details of the method are specified in following sub sections. 3.1 Existing methods (Dual curve method, P-t curve method)
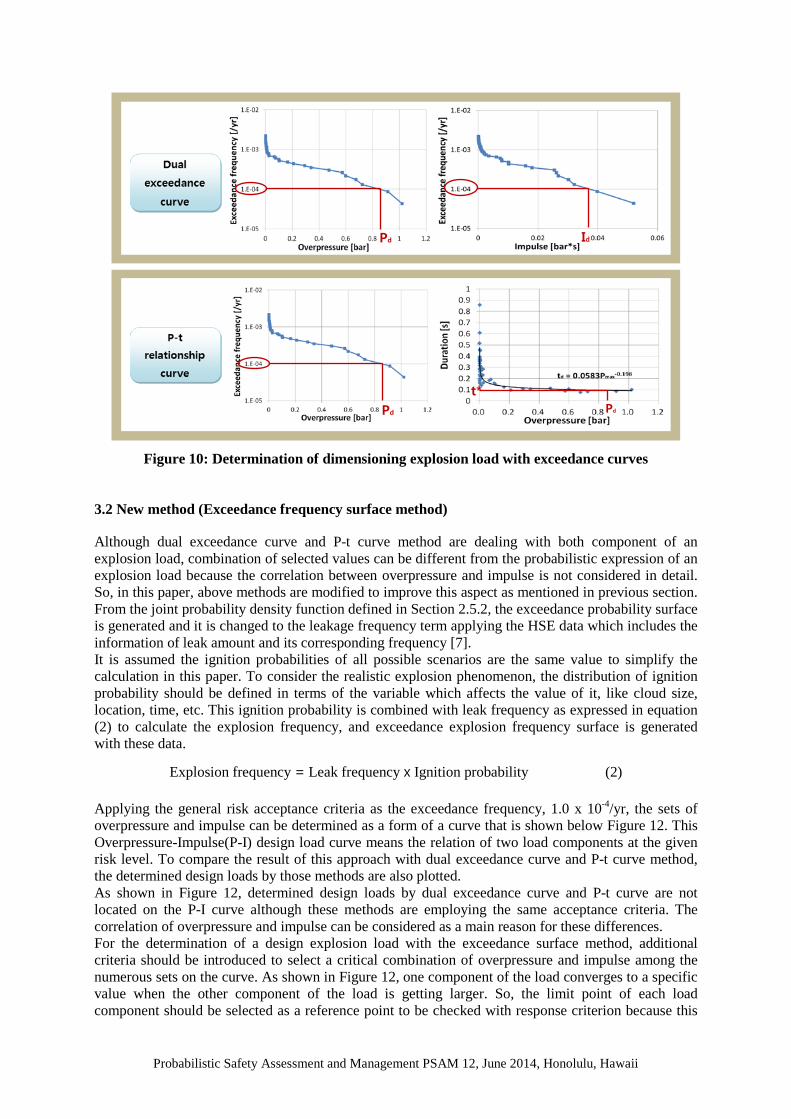
There are two kinds of risk based method practically used for determination of design load. First one is the dual exceedance curve method which adopts one curve for each load component as shown in Figure 10. In this method, overpressure and impulse are listed in descending order and the value of which cumulative frequency corresponds to 1.0 x 10⁻⁴/yr is selected as the design load [6]. However, in this procedure, the correlation of two load component is not considered due to the independency of load curves. Another method is the P-t curve method to complement the shortcoming of dual exceedance curve method. P-t curve defines the explosion duration (or impulse) as a function of overpressure so, it can select the proper duration which is corresponding to the design overpressure defined by exceedance frequency curve. Although P-t curve is considering the relation between two load components, it is still not enough to reflect the whole probabilistic characteristic of explosion loads because the variation of duration is ignored when it is generated. Therefore, the selected design duration can be a value for specific scenario having no probabilistic meaning. Additional method to improve this uncertainty of P-t curve is suggested applying the exceedance frequency surface method described in following section. It supplements the P-t curve defining the relation of overpressure and impulse with given acceptance load frequency criterion.
Probabilistic Safety Assessment and Management PSAM 12, June 2014, Honolulu, Hawaii
Figure 10: Determination of dimensioning explosion load with exceedance curves
3.2 New method (Exceedance frequency surface method)
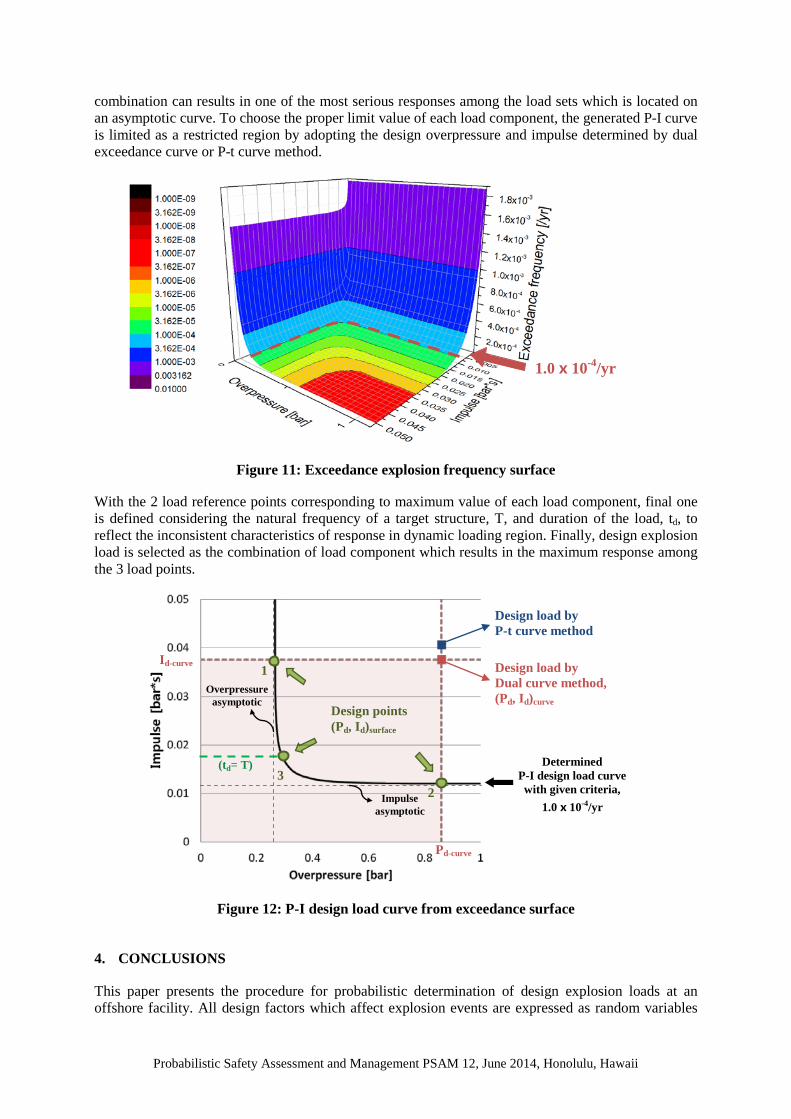
Although dual exceedance curve and P-t curve method are dealing with both component of an explosion load, combination of selected values can be different from the probabilistic expression of an explosion load because the correlation between overpressure and impulse is not considered in detail. So, in this paper, above methods are modified to improve this aspect as mentioned in previous section. From the joint probability density function defined in Section 2.5.2, the exceedance probability surface is generated and it is changed to the leakage frequency term applying the HSE data which includes the information of leak amount and its corresponding frequency [7]. It is assumed the ignition probabilities of all possible scenarios are the same value to simplify the calculation in this paper. To consider the realistic explosion phenomenon, the distribution of ignition probability should be defined in terms of the variable which affects the value of it, like cloud size, location, time, etc. This ignition probability is combined with leak frequency as expressed in equation (2) to calculate the explosion frequency, and exceedance explosion frequency surface is generated with these data.
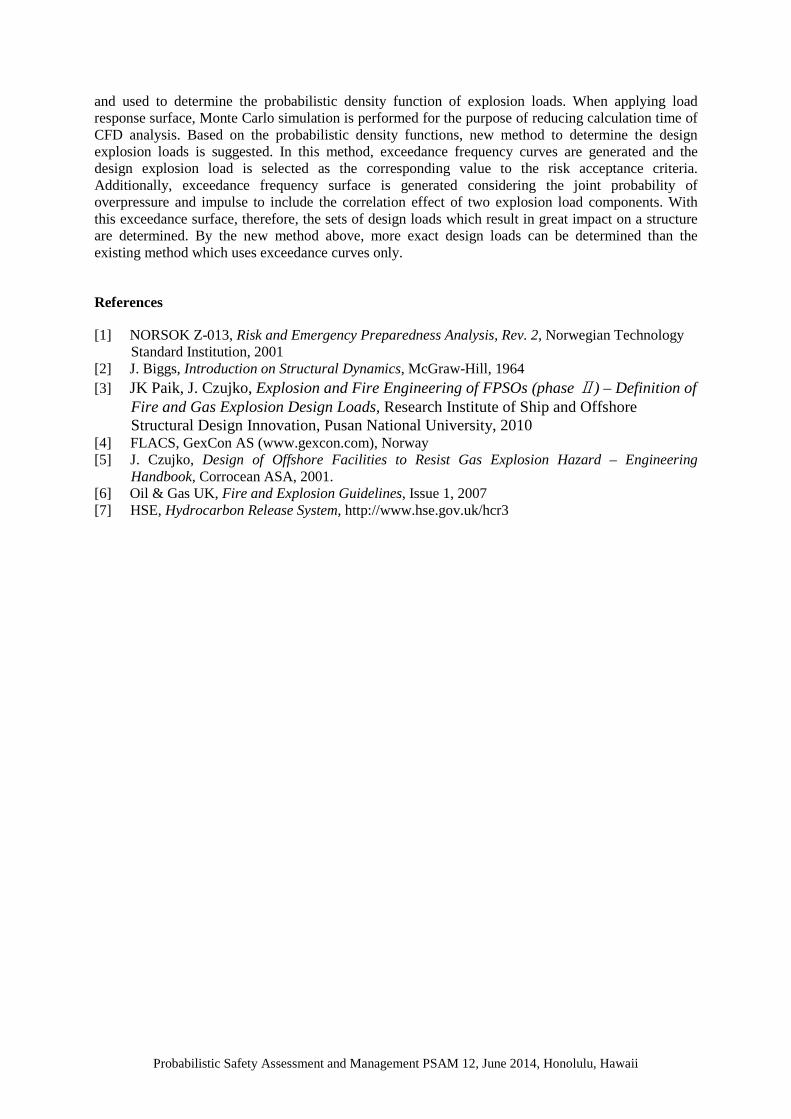
Explosion frequency = Leak frequency x Ignition probability (2) Applying the general risk acceptance criteria as the exceedance frequency, 1.0 x 10⁻⁴/yr, the sets of overpressure and impulse can be determined as a form of a curve that is shown below Figure 12. This Overpressure-Impulse(P-I) design load curve means the relation of two load components at the given risk level. To compare the result of this approach with dual exceedance curve and P-t curve method, the determined design loads by those methods are also plotted. As shown in Figure 12, determined design loads by dual exceedance curve and P-t curve are not located on the P-I curve although these methods are employing the same acceptance criteria. The correlation of overpressure and impulse can be considered as a main reason for these differences. For the determination of a design explosion load with the exceedance surface method, additional criteria should be introduced to select a critical combination of overpressure and impulse among the numerous sets on the curve. As shown in Figure 12, one component of the load converges to a specific value when the other component of the load is getting larger. So, the limit point of each load component should be selected as a reference point to be checked with response criterion because this
Pd Id
Pd t*
Pd
Probabilistic Safety Assessment and Management PSAM 12, June 2014, Honolulu, Hawaii
combination can results in one of the most serious responses among the load sets which is located on an asymptotic curve. To choose the proper limit value of each load component, the generated P-I curve is limited as a restricted region by adopting the design overpressure and impulse determined by dual exceedance curve or P-t curve method.
Figure 11: Exceedance explosion frequency surface With the 2 load reference points corresponding to maximum value of each load component, final one is defined considering the natural frequency of a target structure, T, and duration of the load, td, to reflect the inconsistent characteristics of response in dynamic loading region. Finally, design explosion load is selected as the combination of load component which results in the maximum response among the 3 load points.
Figure 12: P-I design load curve from exceedance surface
4. CONCLUSIONS
This paper presents the procedure for probabilistic determination of design explosion loads at an offshore facility. All design factors which affect explosion events are expressed as random variables
1.0 x 10⁻⁴/yr
Pd-curve
Id-curve
2
Design points (Pd, Id)surface
Design load by P-t curve method
Design load by Dual curve method, (Pd, Id)curve
1
3 (td= T)
Impulse asymptotic
Overpressure asymptotic
Determined P-I design load curve with given criteria,
1.0 x 10⁻⁴/yr
Probabilistic Safety Assessment and Management PSAM 12, June 2014, Honolulu, Hawaii
and used to determine the probabilistic density function of explosion loads. When applying load response surface, Monte Carlo simulation is performed for the purpose of reducing calculation time of CFD analysis. Based on the probabilistic density functions, new method to determine the design explosion loads is suggested. In this method, exceedance frequency curves are generated and the design explosion load is selected as the corresponding value to the risk acceptance criteria. Additionally, exceedance frequency surface is generated considering the joint probability of overpressure and impulse to include the correlation effect of two explosion load components. With this exceedance surface, therefore, the sets of design loads which result in great impact on a structure are determined. By the new method above, more exact design loads can be determined than the existing method which uses exceedance curves only.
References
[1] NORSOK Z-013, Risk and Emergency Preparedness Analysis, Rev. 2, Norwegian Technology Standard Institution, 2001
[2] J. Biggs, Introduction on Structural Dynamics, McGraw-Hill, 1964 [3] JK Paik, J. Czujko, Explosion and Fire Engineering of FPSOs (phase Ⅱ) – Definition of
Fire and Gas Explosion Design Loads, Research Institute of Ship and Offshore Structural Design Innovation, Pusan National University, 2010
[4] FLACS, GexCon AS (www.gexcon.com), Norway [5] J. Czujko, Design of Offshore Facilities to Resist Gas Explosion Hazard – Engineering
Handbook, Corrocean ASA, 2001. [6] Oil & Gas UK, Fire and Explosion Guidelines, Issue 1, 2007 [7] HSE, Hydrocarbon Release System, http://www.hse.gov.uk/hcr3