DETERMINATION OF THE CO EFFICIENT OF ... · Web viewDetermination of the coefficient of discharge...
57
RAJALAKSHMI ENGINEERING COLLEGE THANDALAM DEPARTMENT OF AUTOMOBILE ENGINEERING 112352 FLUID MECHANICS AND MACHINERY
Transcript of DETERMINATION OF THE CO EFFICIENT OF ... · Web viewDetermination of the coefficient of discharge...
RAJALAKSHMI ENGINEERING COLLEGETHANDALAM
DEPARTMENT OF AUTOMOBILE ENGINEERING
112352 FLUID MECHANICS AND MACHINERY
LABORATORY MANUAL

RAJALAKSHMI ENGINEERING
COLLEGETHANDALAM
LABORATORY RECORD
200 - 200
Name of lab:
Department :
Certify that this is a bonafide record of work done by …………… of
…………………………… class in the ………………….. Laboratory during the year
200 -200 .
Signature of Lab in Charge Head of The Dept
Submitted for the practical examination held on …………………………..

INTERNAL EXAMINER EXTERNAL EXAMINER
INDEX
S.NO. DATE NAME OF THE EXPERIMENT REMARKS
1 DETERMINATION OF THE CO EFFICIENT OF DISCHARGE OF GIVEN ORIFICE METER
2 DETERMINATION OF THE CO EFFICIENT OF DISCHARGE OF GIVEN VENTURI METER
3 CALCULATION OF THE RATE OF FLOW USING ROTO METER
4 DETERMINATION OF FRICTION FACTOR OF GIVEN SET OF PIPES
5 CHARACTERISTICS CURVES OF CENTRIFUGAL PUMP
6 CHARACTERISTICS CURVES OF SUBMERGIBLE PUMP
7 CHARACTERISTICS CURVES OF RECIPROCATING PUMP
8 CHARACTERISTICS CURVES OF GEAR PUMP
9 CHARACTERISTICS CURVES OF PELTON WHEEL
10 CHARACTERISTICS CURVES OF FRANCIS TURBINE
11 CHARACTERISTICS CURVES OF TRIANGULAR NOTCH
12 KAPLAN TURBINE TEST RING
FLUID MECHANICS AND MACHINERY LAB

1. Determination of the coefficient of discharge of given Orifice meter.
2. Determination of the coefficient of discharge of given Venturi meter.
3. Calculation of the rate of flow using Roto meter.
4. Determination of friction factor of given set of pipes.
5. Conducting experiments and drawing the characteristics curves of centrifugal pump/ submergible pump.
6. Conducting experiments and drawing the characteristics curves of reciprocating pump.
7. Conducting experiments and drawing the characteristics curves of Gear pump.
8. Conducting experiments and drawing the characteristics curves of Pelton wheel.
9. Conducting experiments and drawing the characteristics curves of Francis turbine.
10.Conducting experiments and drawing the characteristics curves of Kaplan turbine.
DETERMINATION OF THE CO-EFFICIENT OFDISCHARGE OF GIVEN ORIFICE METER
Exp No : 1Date :
AIM:To determine the co-efficient discharge through orifice meter
APPARATUS REQUIRED:
1. Orifice meter
2. Differential U tube
3. Collecting tank
4. Stop watch
5. Scale
FORMULAE :
1. ACTUAL DISCHARGE:
Q act = A x h / t (m3 / s)
2. THEORTICAL DISCHARGE:
Q th = a 1 x a 2 x 2 g h / a 12 – a 2
2 (m3 / s)
Where:
A = Area of collecting tank in m2
h = Height of collected water in tank = 10 cm
a 1 = Area of inlet pipe in, m2
a 2 = Area of the throat in m2
g = Specify gravity in m / s2
t = Time taken for h cm rise of water
H = Orifice head in terms of flowing liquid = (H1 ~ H2) (s m / s 1 - 1)

Where:
H1 = Manometric head in first limb
H2 = Manometric head in second limb
s m = Specific gravity of Manometric liquid
(i.e.) Liquid mercury Hg = 13.6
s1 = Specific gravity of flowing liquid water = 1
3. CO EFFICENT OF DISCHARGE:
Co- efficient of discharge = Q act / Q th (no units)
DESCRIPTION:
Orifice meter has two sections. First one is of area a1, and second one of area a2, it does not
have throat like venturimeter but a small holes on a plate fixed along the diameter of pipe. The
mercury level should not fluctuate because it would come out of manometer.
PROCEDURE:
1. The pipe is selected for doing experiments
2. The motor is switched on, as a result water will flow
3. According to the flow, the mercury level fluctuates in the U-tube manometer
4. The reading of H1 and H2 are noted
5. The time taken for 10 cm rise of water in the collecting tank is noted
6. The experiment is repeated for various flow in the same pipe
7. The co-efficient of discharge is calculated
RESULT:
The co efficient of discharge through orifice meter is ……… (no unit)

Co-
effic
ient
of
disc
harg
e C
d (n
o un
it)
The
oret
ical
di
scha
rge
Qth
x
10-3
m3 /
s
M
ean
Cd
=
Act
ual
disc
harg
e Q
act
x 1
0-3
m3 /
s
Tim
e ta
ken
for
h
cm r
ise
of w
ater
t
Se
c
Man
omet
ric
head
H
=(H
1~H
2) x
12.
6 x
10-2
Man
omet
ric
read
ing
H2
cm
of
Hg
H1
cm
of
Hg
Dia
met
er in
m
mS.
no

DETERMINATION OF THE CO EFFICIENT OFDISCHARGE OF GIVEN VENTURIMETER
Exp No: 2
Date:
AIM:
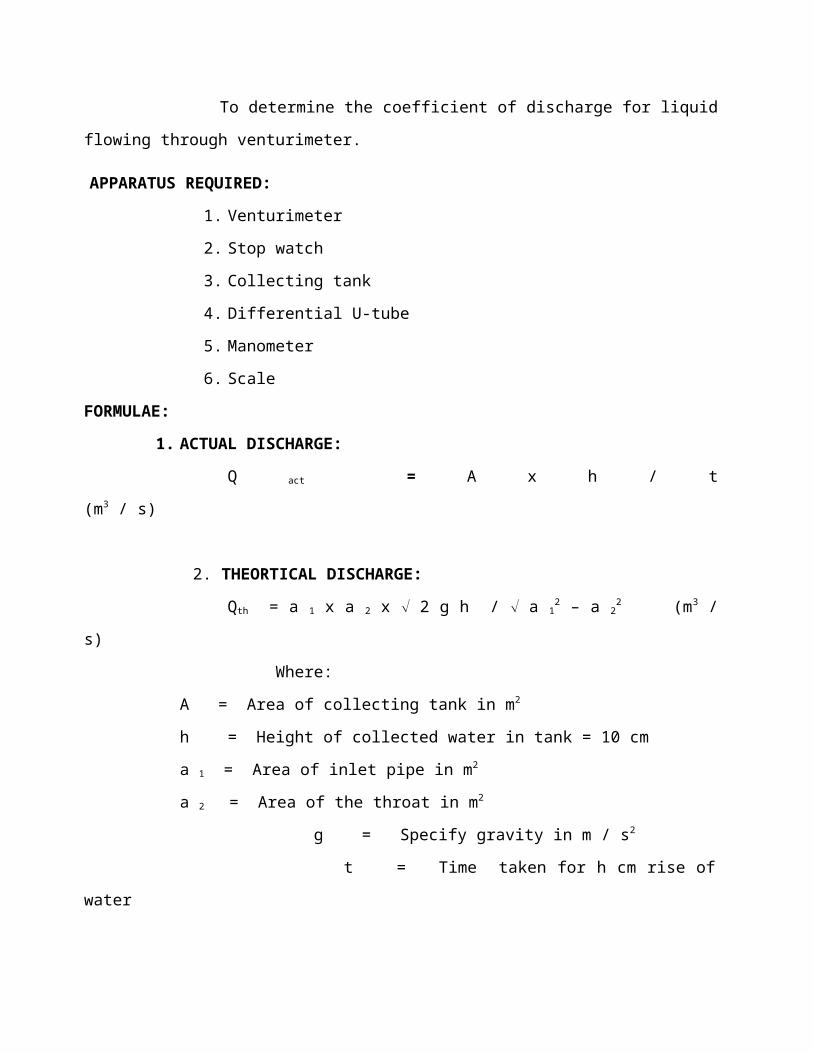
To determine the coefficient of discharge for liquid flowing through venturimeter.
APPARATUS REQUIRED:
1. Venturimeter
2. Stop watch
3. Collecting tank
4. Differential U-tube
5. Manometer
6. Scale
FORMULAE:
1. ACTUAL DISCHARGE:
Q act = A x h / t (m3 / s)
2. THEORTICAL DISCHARGE:
Qth = a 1 x a 2 x 2 g h / a 12 – a 2
2 (m3 / s)
Where:
A = Area of collecting tank in m2
h = Height of collected water in tank = 10 cm
a 1 = Area of inlet pipe in m2
a 2 = Area of the throat in m2
g = Specify gravity in m / s2
t = Time taken for h cm rise of water
H = Orifice head in terms of flowing liquid = (H1 ~ H2) (s m /s 1 - 1)
Where:

H1 = Manometric head in first limb
H2 = Manometric head in second limb
s m = Specific gravity of Manometric liquid
(i.e.) Liquid mercury Hg = 13.6
s1 = Specific gravity of flowing liquid water = 1
3. CO EFFICENT OF DISCHARGE:
Co- efficient of discharge = Q act / Q th (no units)
DESCRIPTION:
Venturi meter has two sections. One divergent area and the other throat area. The former is
represented as a 1 and the later is a 2 water or any other liquid flows through the Venturi meter
and it passes to the throat area the value of discharge is same at a 1 and a 2 .
PROCEDURE:
1. The pipe is selected for doing experiments
2. The motor is switched on, as a result water will flow
3. According to the flow, the mercury level fluctuates in the U-tube manometer
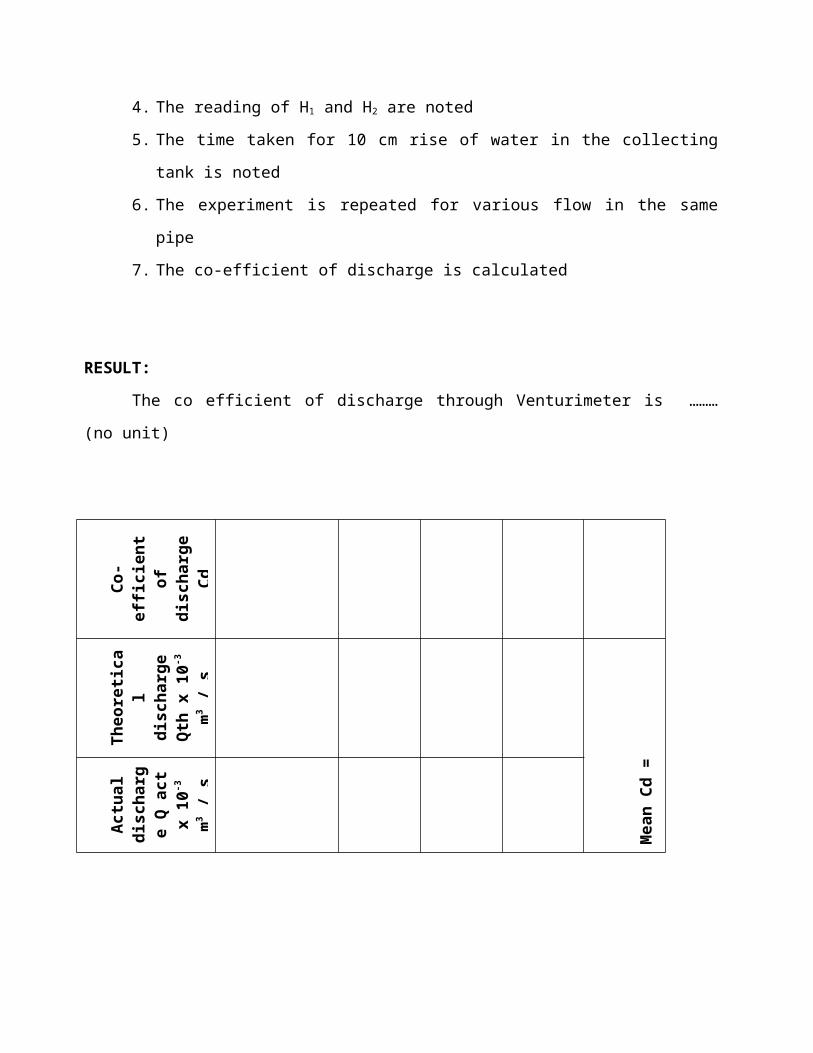
4. The reading of H1 and H2 are noted
5. The time taken for 10 cm rise of water in the collecting tank is noted
6. The experiment is repeated for various flow in the same pipe
7. The co-efficient of discharge is calculated
RESULT:
The co efficient of discharge through Venturimeter is ……… (no unit)
Co-
effic
ient
of
disc
harg
e C
d
(no
unit)
The
oret
ical
di
scha
rge
Qth
x
10-3
m3 /
s
M
ean
Cd
=
Act
ual
disc
harg
e Q
act
x 1
0-3
m3 /
s
Tim
e ta
ken
for
h
cm r
ise
of w
ater
t
sec
Man
omet
ric
head
H
=(H
1~H
2) x
12.
6 x
10-2
Man
omet
ric
read
ing
H2
cm
of
Hg
H1
cm
of
Hg
Dia
met
er in
m
mS.
no

CALCULATION OF THE RATE OF FLOW USING ROTOMETER
Exp No: 3
Date:
AIM:
To determine the percentage error in Rotometer with the actual flow rate.
APPARATUS REQUIRED:
1. Rotometer setup
2. Measuring scale
3. Stopwatch.
FORMULAE:
1. ACTUAL DISCHARGE:
Q act = A x h/ t (m3 / s)
Where:
A = Area of the collecting tank (m2)
h= 10 cm rise of water level in the collecting tank (10-2 m).
t = Time taken for 10 cm rise of water level in collecting tank.
CONVERSION:
Actual flow rate (lit / min), Qact = Qact x 1000 x 60 lit /min
Rotometer reading ~ Actual x 100 % Percentage error of Rotometer =
Rotometer reading
= R ~ Qact / R x 100 %
PROCEDURE:
1. Switch on the motor and the delivery valve is opened
2. Adjust the delivery valve to control the rate in the pipe
3. Set the flow rate in the Rotometer, for example say 50 litres per minute
4. Note down the time taken for 10 cm rise in collecting tank
5. Repeat the experiment for different set of Rotometer readings
6. Tabular column is drawn and readings are noted
7. Graph is drawn by ploting Rotometer reading Vs percentage error of the Rotometer
RESULT :
The percentage error of the Rotometer was found to be……. %

Perc
enta
geE
rror
of
Rot
omet
er (%
)
Act
ual d
isch
arge
Qac
t (lp
m)
Tim
e ta
ken
for
10cm
ri
se o
f wat
erIn
tank
(t se
c)
Act
ual
Dis
char
geQ
act (
m3 /s
ec)
Rot
omet
erR
eadi
ng(lp
m)
S.no

DETERMINATION OF FRICTION FACTOR OFGIVEN SET OF PIPES
Exp No: 4
Date:
AIM:
To find the friction ‘f ’ for the given pipe.
APPARATUS REQUIRED:
1. A pipe provided with inlet and outlet and pressure tapping
2. Differential u-tube manometer
3. Collecting tank with piezometer
4. Stopwatch
5. Scale
FORMULAE:
1. FRICTION FACTOR ( F ):
f = 2 x g x d x h f / l x v2 (no unit)
Where,
g = Acceleration due to gravity (m / sec2)
d = Diameter of the pipe (m)
l = Length of the pipe (m)
v = Velocity of liquid following in the pipe (m / s)
h f = Loss of head due to friction (m)
= h1 ~ h2
Where
h1 = Manometric head in the first limbs
h2 = Manometric head in the second limbs

2. ACTUAL DISCHARGE:
Q = A x h / t (m3 / sec)
Where
A = Area of the collecting tank (m2)
h = Rise of water for 5 cm (m)
t = Time taken for 5 cm rise (sec)
3. VELOCITY:
V = Q / a (m / sec)
Where
Q = Actual discharge (m3/ sec)
A = Area of the pipe (m2)
DESCRIPTION:
When liquid flows through a pipeline it is subjected to frictional resistance. The frictional
resistance depends upon the roughness of the pipe. More the roughness of the pipe will be more
the frictional resistance. The loss of head between selected lengths of the pipe is observed.
PROCEDURE :
1. The diameter of the pipe is measured and the internal dimensions of the collecting tank
and the length of the pipe line is measured
2. Keeping the outlet valve closed and the inlet valve opened
3. The outlet valve is slightly opened and the manometer head on the limbs h1 and h2 are
noted
4. The above procedure is repeated by gradually increasing the flow rate and then the
corresponding readings are noted.
RESULT :
1.The frictional factor ‘f ‘ for given pipe = x 10-2 (no unit)
2. The friction factor for given pipe by graphical method = …… x 10-2 ( no unit )

Fric
tion
fact
orf x
10-2
V2
m2 /
s 2
M
ean
f =Vel
ocity
V m/s
Act
ual d
isch
arge
Qac
t x 1
0-3
m3 /
s
Tim
e fo
r 5c
m
ris
e of
wat
ert s
ec
Man
omet
er r
eadi
ngs
hf =
(h1-
h2)
x 10
-2h2
x
10-2
h1 x
10
-2
Dia
met
er
of
pipe
mm
S.no
CHARACTERISTICS TEST ON CENTRIFUGAL PUMP
Exp No: 5
Date:
AIM :To study the performance characteristics of a centrifugal pump and to determine the
characteristic with maximum efficiency.
APPARATUS REQUIRED :
1. Centrifugal pump setup
2. Meter scale
3. Stop watch
FORMULAE :
1. ACTUAL DISCHARGE:
Q act = A x y / t (m3 / s)
Where:
A = Area of the collecting tank (m2)
y = 10 cm rise of water level in the collecting tank
t = Time taken for 10 cm rise of water level in collecting tank.
2. TOTAL HEAD:
H = Hd + Hs + Z
Where:
Hd = Discharge head, meter
Hs = Suction head, meter
Z = Datum head, meter

3.INPUT POWER:
I/P = (3600 ´ N ´ 1000) / (E ´ T) (watts)
Where,N = Number of revolutions of energy meter disc
E = Energy meter constant (rev / Kw hr)
T = time taken for ‘Nr’ revolutions (seconds)
4. OUTPUT POWER:
Po = ρ x g x Q x H / 1000 (watts) Where,
ρ = Density of water (kg / m³)
g = Acceleration due to gravity (m / s2)
H = Total head of water (m)
5.EFFICIENCY: ho = (Output power o/p / input power I/p) ´ 100 %
Where,O/p = Output power kW
I/ p = Input power kW
DESCRIPTION: PRIMING:
The operation of filling water in the suction pipe casing and a portion delivery pipe for
the removal of air before starting is called priming.
After priming the impeller is rotated by a prime mover. The rotating vane gives a
centrifugal head to the pump. When the pump attains a constant speed, the delivery valve is
gradually opened. The water flows in a radially outward direction. Then, it leaves the vanes at the
outer circumference with a high velocity and pressure. Now kinetic energy is gradually converted
in to pressure energy. The high-pressure water is through the delivery pipe to the required height.

PROCEDURE:
1. Prime the pump close the delivery valve and switch on the unit
2. Open the delivery valve and maintain the required delivery head
3. Note down the reading and note the corresponding suction head reading
4. Close the drain valve and note down the time taken for 10 cm rise of water level in
collecting tank
5. Measure the area of collecting tank
6. For different delivery tubes, repeat the experiment
7. For every set reading note down the time taken for 5 revolutions of energy meter disc.
GRAPHS:
1. Actual discharge Vs Total head
2. Actual discharge Vs Efficiency
3. Actual discharge Vs Input power
4. Actual discharge Vs Output power
RESULT:
Thus the performance characteristics of centrifugal pump was studied and the
maximum efficiency was found to be _____________

% h
Out
put
Pow
er(P
o)
wat
t
Inpu
tPo
we
r (P
i )
wat
t
Act
ual
Dis
char
ge
(Qac
t) x
10-3
m3 \s
ec
Tim
e ta
ken
for
Nr
revo
lutio
n t S
Tim
e ta
ken
for
‘h’ r
ise
of w
ater
(t)
S
Tot
alH
ead
(H) m
of
wat
er
Del
iver
yH
ead
(Hd)
m o
f w
ater
Del
iver
yG
auge
Rea
ding
(hd)
m o
f w
ater
Suct
ion
head
Hs
m o
f w
ater
Suct
ion
gaug
e H
s m
of w
ater
S. no
CHARACTERISTICS CURVES OF SUBMERSIBLE PUMP
Exp No: 6
Date:
AIM :
To study the performance characteristics of a submersible pump.
APPARATUS REQUIRED :
1. Submersible pump
2. Meter scale
3. Stop watch
FORMULAE :
1. ACTUAL DISCHARGE: Qact = A x h / t (m³ / sec)
Where, A = Area of the collecting tank (m²)
h = Height of the water level collected (cm)
t = Time taken for ‘h’ rise of water (seconds)
x = Distance between the suction and delivery gauge
2. INPUT POWER:
Pi = (3600 ´ Nr ´ 1000) / (Ne ´ te) (watts) Where, Nr = number of revolutions of energy meter disc
Ne = energy meter constant (rev / Kw hr)
te = time taken for ‘Nr’ revolutions (seconds)

3. OUTPUT POWER:
Po = W ´ Qact ´ H (watts)
Where, W = specific weight of water (N / m³)
Qact = actual discharge (m³ / s)
H = total head of water (m)
4. EFFICIENCY:
%h = (Output power Po / input power Pi) ´ 100
DESCRIPTION:
In submergible pump electric motor and pump are coupled together and both are
submerged in the water. The electric current is conducted through a waterproof cable. This is multi
stage centrifugal pump with radial or mixed flow impellers.
The suction housing of the pump is fitted between the pump and motors are provided with
a perforated strainer. The windings of the motor are insulated well and cooled by water. A gate
valve, which is a non-return valve, is provided at the top of the pump to discharge water.
PROCEDURE:
1.The submersible pump is started
2. The delivery gauge reading is set to the required value by means of
Adjusting the gate-valve
3.The time taken for Nr revolutions in the energy meter disc is
Noted with the help of stop watch
4.The time taken for ‘h’ rise in water level in the collecting tank is
Found carefully. If the water flow is heavy reduce the ‘h’ value
5.The experiment is repeated for different delivery gauge readings
6.Finally the readings are tabulated and calculated
GRAPHS:
1. Actual discharge Vs Total head
2. Actual discharge Vs Input power
3. Actual discharge Vs Efficiency
RESULT: The performance characteristic of the submersible pump is studied and the efficiency is
calculated …………… %

Eff
icie
ncy
h %
Out
put
Pow
er[P
o]
wat
ts
M
ean
=
Inpu
tPo
wer
[P
i]
Wat
ts
Act
ual
Dis
char
ge
[Qac
t]
m3 /s
ec
Tim
e ta
ken
for
Nr
revo
lutio
n
Sec
Tim
e ta
ken
for
‘h’ r
ise
Of w
ater
[t]
Sec
Tot
alH
ead
[Hd
+2]
m o
f wat
er
Del
iver
yH
ead
[Hd]
x10
m o
f w
ater
Del
iver
yG
auge
Rea
ding
[Hd]
Kg/
cm2
S.no

CHARACTERISTICS CURVES OF RECIPROCATING PUMP
Exp No: 7
Date:
AIM:To study the performance characteristics of a reciprocating pump and to determine the
characteristic with maximum efficiency.
APPARATUS REQUIRED:
1. Reciprocating pump
2. Meter scale
3. Stop watch
FORMULAE:
1. ACTUAL DISCHARGE:
Q act = A x y / t (m3 / s)
Where: A = Area of the collecting tank (m2)
y = 10 cm rise of water level in the collecting tank
t = Time taken for 10 cm rise of water level in collecting tank
2.TOTAL HEAD:
H = Hd + Hs + Z
Where:
Hd = Discharge head; Hd = Pd x 10, m
Hs = Suction head; Pd = Ps x 0.0136, m
Z = Datum head, m
Pd = Pressure gauge reading, kg / cm2
Ps = Suction pressure gauge reading, mm of Hg
3.INPUT POWER:
Pi = (3600 ´ N) / (E ´ T) (Kw)
Where, N = Number of revolutions of energy meter disc
E = Energy meter constant (rev / Kw hr)
T = time taken for ‘N’ revolutions (seconds)
4. OUTPUT POWER:
Po = ρ x g x Q x H / 1000 (Kw) Where,
ρ = Density of water (kg / m³)
g = Acceleration due to gravity (m / s2)
H = Total head of water (m)
Q = Discharge (m3 / sec)
5.EFFICIENCY: ho = (Output power po / input power pi) ´ 100 %
Where,Po = Output power KW
Pi = Input power KW
PROCEDURE:
1. Close the delivery valve and switch on the unit
2. Open the delivery valve and maintain the required delivery head
3. Note down the reading and note the corresponding suction head reading
4. Close the drain valve and note down the time taken for 10 cm rise of water level in
collecting tank
5. Measure the area of collecting tank
6. For different delivery tubes, repeat the experiment
7. For every set reading note down the time taken for 5 revolutions of energy meter disc.
GRAPHS:
1. Actual discharge Vs Total head
2. Actual discharge Vs Efficiency
3. Actual discharge Vs Input power
4. Actual discharge Vs Output power
RESULT: The performance characteristic of the reciprocating pump is studied and the efficiency is
calculated …………… %

h %
Out
put
pow
er
Po k
w
Mea
n =
Inpu
t po
wer
Pi
kw
Tim
e ta
ken
for
N r
ev o
f en
ergy
met
er
disc
t
sec
Act
ual
disc
harg
e Q
act
m³/s
Tim
e ta
ken
for
10 c
m o
f ris
e of
wat
er in
ta
nk t
sec
Tot
al
head
H
Dat
um
head
Z
m
Suct
ion
head
Hs
= Ps
x
0.01
36
Del
iver
y he
ad
Hd=
Pdx1
0.0
Suct
ion
pres
sure
re
adin
g Ps
mm
of
Hg
Del
iver
y pr
essu
re
read
ing
Pd
kg /
cm2
S . n o
CHARACTERISTICS CURVES OF GEAR OIL PUMP
Exp No: 8
Date:
AIM:
To draw the characteristics curves of gear oil pump and also to determine efficiency of
given gear oil pump.
APPARATUS REQUIRED:
1. Gear oil pump setup
2. Meter scale
3. Stop watch
FORMULAE: 1. ACTUAL DISCHARGE:
Qact = A x y / t (m³ / sec)
Where,A = Area of the collecting tank (m²)
y = Rise of oil level in collecting tank (cm)
t = Time taken for ‘h’ rise of oil in collecting tank (s)
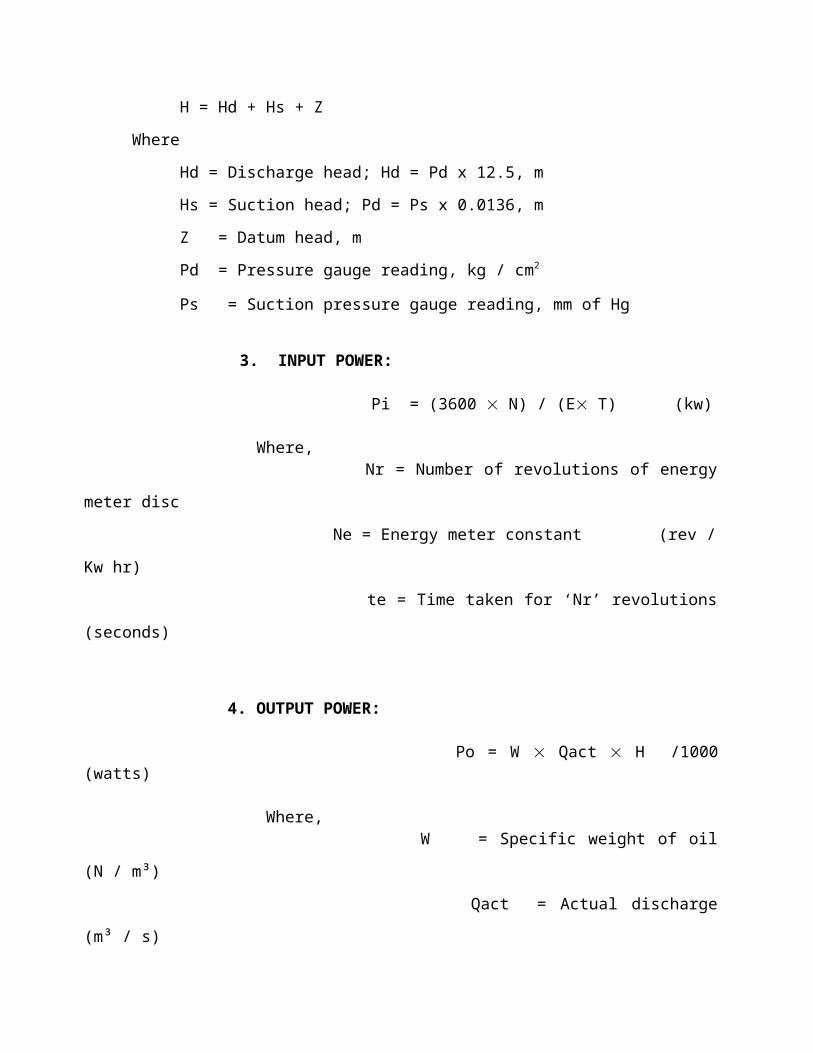
2. TOTAL HEAD:
H = Hd + Hs + Z
Where
Hd = Discharge head; Hd = Pd x 12.5, m
Hs = Suction head; Pd = Ps x 0.0136, m
Z = Datum head, m
Pd = Pressure gauge reading, kg / cm2
Ps = Suction pressure gauge reading, mm of Hg

3. INPUT POWER:
Pi = (3600 ´ N) / (E´ T) (kw)
Where, Nr = Number of revolutions of energy meter disc
Ne = Energy meter constant (rev / Kw hr)
te = Time taken for ‘Nr’ revolutions (seconds)
4. OUTPUT POWER:
Po = W ´ Qact ´ H /1000 (watts)
Where, W = Specific weight of oil (N / m³)
Qact = Actual discharge (m³ / s)
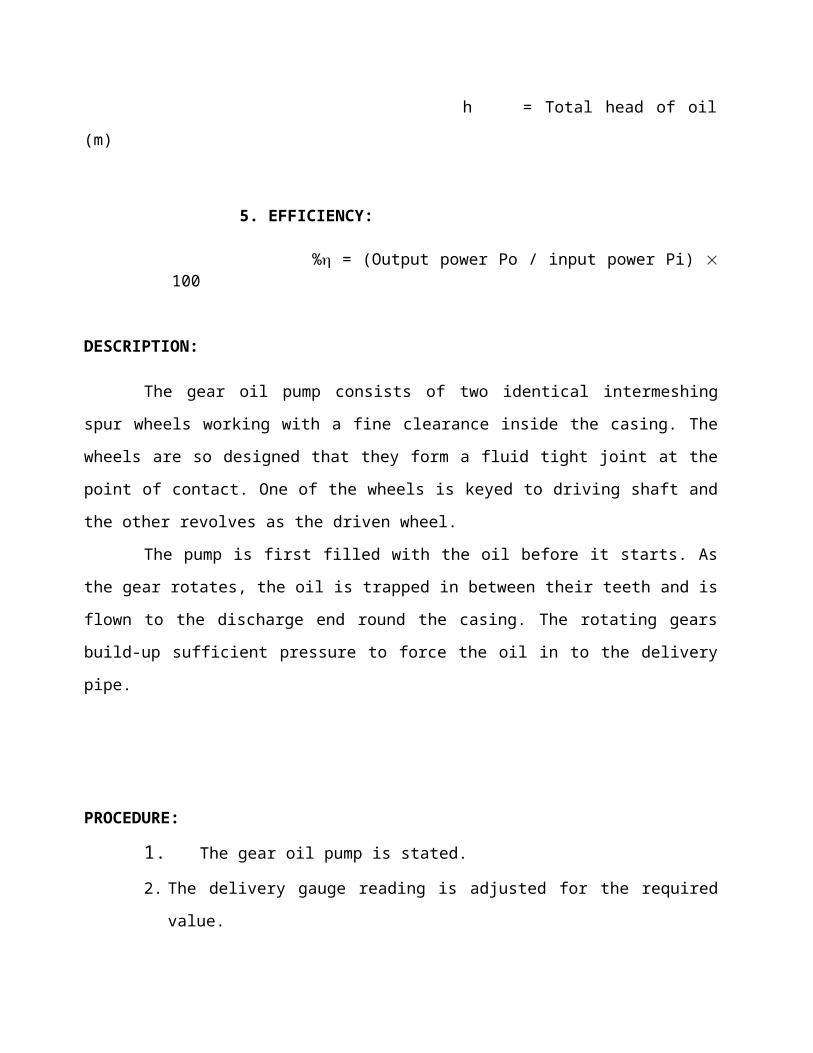
h = Total head of oil (m)
5. EFFICIENCY:
%h = (Output power Po / input power Pi) ´ 100
DESCRIPTION:
The gear oil pump consists of two identical intermeshing spur wheels working with a fine
clearance inside the casing. The wheels are so designed that they form a fluid tight joint at the
point of contact. One of the wheels is keyed to driving shaft and the other revolves as the driven
wheel.
The pump is first filled with the oil before it starts. As the gear rotates, the oil is trapped
in between their teeth and is flown to the discharge end round the casing. The rotating gears build-
up sufficient pressure to force the oil in to the delivery pipe.

PROCEDURE:
1. The gear oil pump is stated.
2. The delivery gauge reading is adjusted for the required value.
3. The corresponding suction gauge reading is noted.
4. The time taken for ‘N’ revolutions in the energy meter is noted with the help of a
stopwatch.
5. The time taken for ‘h’ rise in oil level is also noted down after closing the gate valve.
6. With the help of the meter scale the distance between the suction and delivery gauge
is noted.
7. For calculating the area of the collecting tank its dimensions are noted down.
8. The experiment is repeated for different delivery gauge readings.
9. Finally the readings are tabulated.
GRAPH:
1. Actual discharge Vs Total head
2. Actual discharge Vs Efficiency
3. Actual discharge Vs Input power
4. Actual discharge Vs Output power
RESULT:
Thus the performance characteristics of gear oil pump was studied and maximum
efficiency was found to be. ………%.
h %
Out
put
pow
er
Po k
w
Mea
n =
Inpu
t po
wer
Pi
kw
Tim
e ta
ken
for
N r
ev o
f en
ergy
met
er
disc
t
sec
Act
ual
disc
harg
e Q
act
m³/s
Tim
e ta
ken
for
10 c
m o
f ris
e of
w
ater
in ta
nk t
sec
Tot
al
head
H
m
Dat
um
head
Z
m
Suct
ion
head
Hs
= Ps
x
0.01
36
m
Del
iver
y he
ad
Hd=
Pdx1
2.5
m
Suct
ion
pres
sure
re
adin
g Ps
mm
of
Hg
Del
iver
y pr
essu
re
read
ing
Pd
kgf /
cm
2
S. no

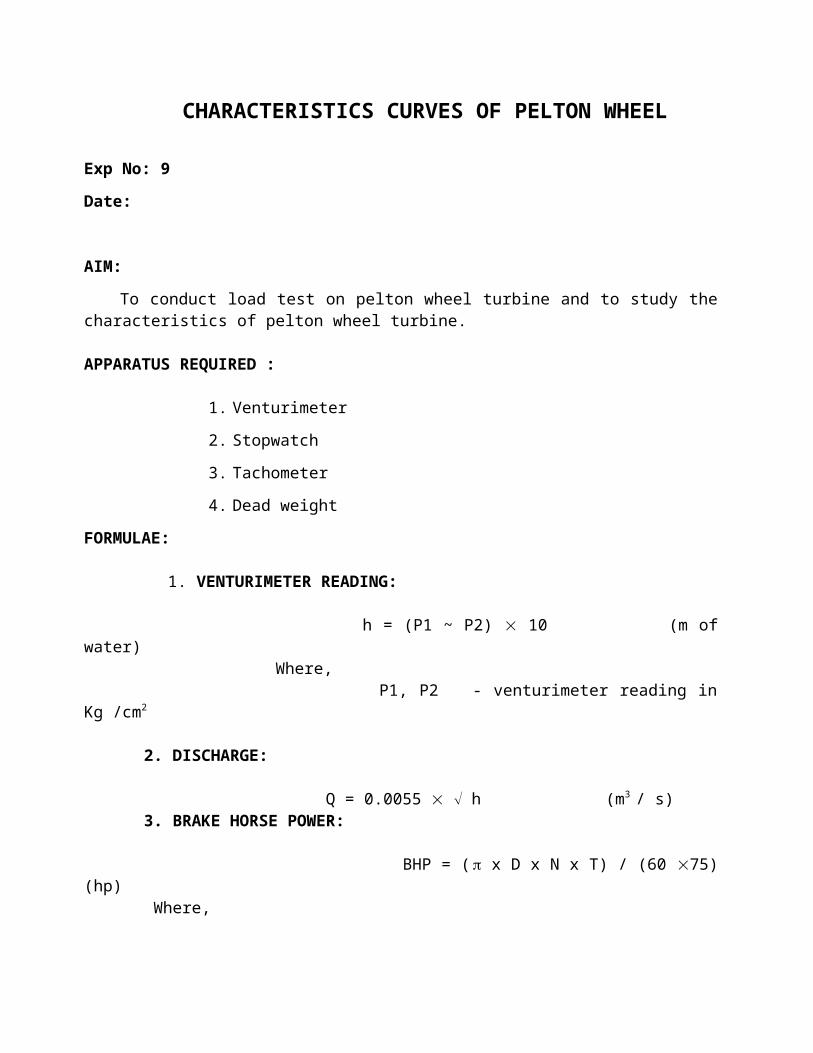
CHARACTERISTICS CURVES OF PELTON WHEEL
Exp No: 9
Date:
AIM:
To conduct load test on pelton wheel turbine and to study the characteristics of pelton wheel turbine.
APPARATUS REQUIRED :
1. Venturimeter
2. Stopwatch
3. Tachometer
4. Dead weight
FORMULAE:
1. VENTURIMETER READING:
h = (P1 ~ P2) ´ 10 (m of water) Where, P1, P2 - venturimeter reading in Kg /cm2
2. DISCHARGE: Q = 0.0055 ´ h (m3 / s)
3. BRAKE HORSE POWER:
BHP = (p x D x N x T) / (60 ´75) (hp) Where,
N = Speed of the turbine in (rpm)
D = Effective diameter of brake drum = 0.315 m
T = Torsion in To + T1 – T2 (Kg)
4. INDICATED HORSE POWER: IHP = (1000 ´ Q ´ H) / 75 (hp) Where,
H = Total head (m)

5. PERCENTAGE EFFICIENCY:
%h = (B.H.P / I.H.P x 100) (%)
DESCRIPTION:
Pelton wheel turbine is an impulse turbine, which is used to act on high loads and for
generating electricity. All the available heads are classified in to velocity energy by means of spear
and nozzle arrangement. Position of the jet strikes the knife-edge of the buckets with least relative
resistances and shocks. While passing along the buckets the velocity of the water is reduced and
hence an impulse force is supplied to the cups which in turn are moved and hence shaft is rotated.
PROCEDURE:
1. The Pelton wheel turbine is started.
2. All the weight in the hanger is removed.
3. The pressure gauge reading is noted down and it is to be maintained constant for
different loads.
4. The venturimeter readings are noted down.
5. The spring balance reading and speed of the turbine are also noted down.
6. A 5Kg load is put on the hanger, similarly all the corresponding readings are
noted down.
7. The experiment is repeated for different loads and the readings are tabulated.
GRAPHS:The following graphs are drawn.
1. BHP Vs IHP
2. BHP Vs speed
3. BHP Vs Efficiency
RESULT:
Thus the performance characteristics of the Pelton Wheel Turbine is done and the
maximum efficiency of the turbine is ………. %

h
%
I.H.P
hp
Mea
n =
B.H
.P
hpD
isch
arge
Q x
10-3
m3 \s
ec
Ten
sion
[T]
Kg
Spri
ngB
alan
ceT
2K
g
Wei
gh
of
hang
er[T
1] kg
Spee
d of
tu
rbin
eN
Rpm
Wei
ght
of
hang
er
To
Kg
H=
(P1-
P2) x
10
m o
f w
ater
Ven
turi
me
ter
read
ing
Kg\
cm2
P2
P1
Tot
al
Hea
d[H
]m
of
wat
er
Pres
sur
e Gau
geR
eadi
ng[H
p]K
g\cm
2
S.no

CHARACTERISTICS CURVES OF FRANCIS TURBINE
Exp No: 10
Date:
AIM:
To conduct load test on franchis turbine and to study the characteristics of francis turbine.
APPARATUS REQUIRED:
1. Stop watch
2. Tachometer
FORMULAE:
1. VENTURIMETER READING:
h = (p1 - p2) x 10 (m)
Where
P1, p2- venturimeter readings in kg / cm2
2. DISCHARGE:
Q = 0.011 x h (m3 / s)
3. BRAKE HORSEPOWER:
BHP = p x D x N x T / 60 x 75 (h p)
Where
N = Speed of turbine in (rpm)
D = Effective diameter of brake drum = 0.315m
T = torsion in [kg]
4. INDICATED HORSEPOWER:
HP = 1000 x Q x H / 75 (hp)
Where
H – total head in (m)
5. PERCENTAGE EFFICIENCY:
%h = B.H.P x 100 / I.H.P ( %)

DESCRIPTION:
Modern Francis turbine in an inward mixed flow reaction turbine it is a medium head
turbine. Hence it required medium quantity of water. The water under pressure from the penstock
enters the squirrel casing. The casing completely surrounds the series of fixed vanes. The guides’
vanes direct the water on to the runner. The water enters the runner of the turbine in the dial
direction at outlet and leaves in the axial direction at the inlet of the runner. Thus it is a mixed flow
turbine.
PROCEDURE:
1.The Francis turbine is started
2. All the weights in the hanger are removed
3.The pressure gauge reading is noted down and this is to be
maintained constant for different loads
4. Pressure gauge reading is assended down
5. The venturimeter reading and speed of turbine are noted down
6.The experiment is repeated for different loads and the reading are tabulated.
GRAPHS :
The following graphs are drawn
1. BHP (vs.) IHP
2. BHP (vs.) speed
3. BHP (vs.) % efficiency
RESULT :
Thus the performance charactertics of the Francis wheel turbine are done and the maximum
efficiency of the turbine is …………. %
h %
I.H.P
hp
M
ean
B.H
.P
hp
Dis
cha
rge
Q x
10-
3
m3 \s
ec
Ten
sio
n [T]
Kg
Spri
ngB
alan
ce T2
Kg
Wei
gh
of
hang
er
[T1] kg
Spee
d of
tu
rbin
e NR
pm
Wei
ght
of
hang
er
To
Kg
H=
(P1-
P2) x
10
m o
f wat
er
Ven
turi
met
er r
eadi
ngK
g\cm
2 P2P1
Tot
al
Hea
d[H
]m
of
wat
er
Pres
sure
Gau
geR
eadi
ng[H
p]K
g\cm
2
H2
H1
S.n o
CHARACTERISTICS CURVES OF TRIANGULAR NOTCH
Exp No: 11
Date:
AIM:
To determine the co-efficient of discharge of flow through triangular notch.
APPARATUS REQUIRED:
1. Notch tank
2. Triangular notch
3. Hook gauge
4. Collecting tank
5. Stop watch
6. Piezo meter
7. Meter scale
FORMULAE:
1. ACTUAL DISCHARGE: Qact = A x h / t (m³ / sec)
Where,
A = Area of the collecting tank (m²) h = Rise of water level in collecting tank (cm)
t = Time taken for ‘h’ rise of oil in collecting tank (s)
2. THEORETICAL DISCHARGE:
Qthe = (8 / 15) x (tan θ / 2) √ 2 x g x H 5/2 (m 3 / s)
WhereH = Manometer height in m
g = Gravity in m / s
3. CO-EFFICIENT OF DISCHARGE:
Cd = Qact / Q the (no unit)
DESCRIPTION:
1. The inlet valve is opened and water is allowed to rise up to the level of the triangular
notch
2. The pointer of the manometer gauge is adjusted so that it coincides the water surface
and note down reading
3. The inlet valve is opened so that the water flows over the notch at the same rate
4. The water level is noted by means of point gauge
5. The readings for H2 is noted
6. The time required for10 cm rise of water level is noted
7. The above procedure is repeated for different discharge
RESULT:
The co-efficient of discharge of triangular notch is Cd = ……(no unit)

Co
effic
ient
of
disc
harg
e
Cd
(no
unit)
The
oret
ical
di
scha
rge
Qth
e x1
0-3
m3 \ s
ec
Mea
n =
Act
ual
disc
harg
e Q
act
x10-3
m3 \s
ec
Tim
e ta
ken
for
10 c
m o
f ri
se o
f wat
er t
sec
Man
omet
ric
read
ing
H=
H1~
H2
cmH
2cm
H1
cm
S.no

KAPLAN TURBINE TEST RIGExp No: 12
Date:
AIM:
To study the characteristics of a Kaplan turbine
DESCRIPTION:
Kaplan turbine is an axial flow reaction turbine used in dams and reservoirs of low height
to convert hydraulic energy into mechanical and electrical energy. They are best suited for low
heads say from 10m to 5 m. the specific speed ranges from 200 to 1000
The turbine test rig consists of a 3.72 KW (5 Hp) turbine supplied with water from a
suitable 20 Hp mixed flow pump through pipelines, sluice valve, and a flow measuring orifice
meter. The turbine consists of a cast-iron body with a volute casing, and axial flow gunmetal
runner with adjustable pitch vanes, a ring of adjustable guide vanes and draft tube. The runner
consists of four numbers of adjustable vanes of aerofoil section. These vanes can be adjusted by
means of a regulator, which changes the inlet and outlet angles of the runner vanes to suit the
operating conditions. The marking at the outer end of the shaft indicates the amount of opening the
vanes. The guide van can be rotated about their axis by means of hand wheel and the position
indicated by a pair of dummy guide vanes fixed outside the turbine casing. A rope brake drum is
mounted on the turbine shaft to absorb the power developed. Suitable dead weights and a hanger
arrangement, a spring balance and cooling water arrangement is provided for the brake drum.
Water under pressure from pump enters through the volute casing and the guiding vanes
into the runner while passing through the spiral casing and guide vanes a part of the pressure
energy(potential energy) is converted into velocity energy(kinetic energy). Water thus enters the
runner at a high velocity and as it passes through the runner vanes, the remaining potential energy
is converted into kinetic energy due to curvature of the vanes the kinetic energy is transformed in
to mechanical energy, i.e., the water head is converted into mechanical energy and hence the
number rotates. The water from the runner is then discharged into the tailrace. Operating guide
vane also can regulate the discharge through the runner.
The flow through the pipelines into the turbine is measured with the office meter fitted in
the pipeline. A mercury manometer is used to measure the pressure difference across the orifice
meter. The net pressure difference across the turbine output torque is measured with a pressure
gauge and vacum gauge. The turbine output torque is determined with the rope brake drum. A
tachometer is used to measure the rpm.
EXPERIMENTAL PROCEDURE:
1. Keep the runner vane at require opening
2. Keep the guide vanes at required opening
3. Prime the pump if necessary
4. Close the main sluice valve and them start the pump.
5. Open the sluice valve for the required discharge when the pump motor switches from
star to delta mode.
6. Load the turbine by adding weights in the weight hanger. Open the brake drum cooling
water gate valve for cooling the brake drum.
7. Measure the turbine rpm with tachometer
8. Note the pressure gauge and vacum gauge readings
9. Note the orifice meter pressure readings.
Repeat the experiments for other loads