Determination of Taxanes in Taxus sp. with the Agilent ... · analysis of taxanes with the Agilent...
10
Abstract Taxane standard solutions and Taxus sp. extracts were analyzed with comprehensive two-dimensional liquid chromatography (LC×LC) using the Agilent 1290 Infinity 2D-LC solution with DAD and MS detection. Reversed-phase liquid chromatography was applied in both the first and second dimension. Orthogonality was achieved by using different column chemistries and mobile phases. Qualitative and quantitative aspects of the method were investigated and tested with real samples. Determination of Taxanes in Taxus sp. with the Agilent 1290 Infinity 2D-LC Solution Application Note Authors Gerd Vanhoenacker, Frank David, Koen Sandra, and Pat Sandra Research Institute for Chromatography Kennedypark 26 B-8500 Kortrijk Belgium Metablys Kennedypark 26 B-8500 Kortrijk Belgium Udo Huber Agilent Technologies, Inc. Stephen E. Reichenbach University of Nebraska Lincoln, NE, USA Small Molecule Pharmaceuticals & Genetics HO OH OH O O O O O O O O O O N O H H Veri fied for Agilent 1290 Infinit y II LC
Transcript of Determination of Taxanes in Taxus sp. with the Agilent ... · analysis of taxanes with the Agilent...

AbstractTaxane standard solutions and Taxus sp. extracts were analyzed with comprehensive two-dimensional liquid chromatography (LC×LC) using the Agilent 1290 Infinity 2D-LC solution with DAD and MS detection. Reversed-phase liquid chromatography was applied in both the first and second dimension. Orthogonality was achieved by using different column chemistries and mobile phases. Qualitative and quantitative aspects of the method were investigated and tested with real samples.
Determination of Taxanes in Taxus sp. with the Agilent 1290 Infinity 2D-LC Solution
Application Note
AuthorsGerd Vanhoenacker, Frank David, Koen Sandra, and Pat Sandra Research Institute for Chromatography Kennedypark 26 B-8500 Kortrijk Belgium
Metablys Kennedypark 26 B-8500 Kortrijk Belgium
Udo Huber
Agilent Technologies, Inc.
Stephen E. Reichenbach University of Nebraska Lincoln, NE, USA
Small Molecule Pharmaceuticals & Genetics
HOOH
OH
O O
O
OO
O OO
O O
N
O
H
H
Verified for Agilent 1290 Infinity II LC
2
ExperimentalSolutions and chemicals All solvents were HPLC gradient grade from Biosolve B.V. (Valkenswaard, the Netherlands). A standard solution of 14 taxanes consisting of paclitaxel, precursors, and analogues (20 µg/mL each) was purchased from Chromadex (Irvine, CA, USA). The composition of this mixture is shown in Table 1. This solution was further diluted in methanol with 0.1 % acetic acid to the appropriate concentration.
IntroductionTaxanes are a group of diterpenes useful in cancer treatments because of their mitotic inhibitory activity1. Taxol (Paclitaxel) shows good antitumor activity and is used in the treatment of breast and lung cancers. It is one of the best chemotherapeutics developed from plant sources2. It was first isolated from the bark of Taxus brevifolia (Pacific yew tree) in 19711.
The paclitaxel content of the bark is low; therefore, attempts have been made to synthesize the product. The synthesis proved to be possible, but difficult, and not commercially interesting3. At present, semisynthesis from more abundant precursors (10-Deacetylbaccatin-III, Baccatin-III, and Cephalomannine) and plant cell fermentation are the main sources of therapeutic paclitaxel4.
The analysis of the taxane content of various species of yew trees is important for selection of the correct type and growing conditions. Taxanes are generally analyzed by (U)HPLC and LC/MS, and their separation is challenging. Analyzing these compounds in a complex matrix such as Taxus sp. extracts is even more difficult due to the lack of peak capacity in a one dimensional system. The matrix constituents interfere with detection and quantitation of the target compounds.
An efficient way to increase peak capacity significantly is to perform comprehensive two-dimensional liquid chromatography (LC×LC). This Application Note presents data on the analysis of taxanes with the Agilent 1290 Infinity 2D-LC solution. On-line mass spectroscopic detection was additionally employed with 2D-LC to confirmation of the identity of detected taxanes in Taxus sp. extracts.
Table 1. Composition of the standard solution.
Peak Name Molecular weight1 10-Deacetylbaccatin-III 5442 Taxol side chain methyl ester 2993 Baccatin-III 5864 7-Xylosyl-10-deacetyltaxol B 9215 Taxinine M 7036 7-Xylosyl-10-deacetyltaxol 9437 7-Xylosyl-10-deacetyltaxol C 9378 10-Deacetyltaxol 8119 7-Xylosyltaxol 98510 Cephalomannine (Taxol B) 83111 7-epi-10-Deacetyltaxol 81112 Paclitaxel (Taxol) 85313 Taxol C 84714 7-Epitaxol 853
InstrumentationAn Agilent 1290 Infinity 2D-LC solution was used. The configuration is shown below:
Instrument Part numberAgilent 1290 Infinity binary pump (1st dimension) G4220AAgilent 1290 Infinity binary pump (2nd dimension) G4220AAgilent 1290 Infinity autosampler G4226AAgilent 1290 Infinity autosampler thermostat G1330AAgilent 1290 Infinity thermostatted column compartment G1316CAgilent 1290 Infinity diode array detector with standard flow cell G4212AAgilent 1290 Infinity valve drive G1170A2-position/4-port duo valve for 2D-LC G4236AAgilent Single Quadrupole LC/MS with APCI source G6130B
Software• Agilent OpenLAB CDS Chemstation
revision C.01.04 with 2D-LC add-on software
• GC Image LC/LC Edition Software for 2D-LC data analysis (GC Image, LLC., Lincoln, NE, USA)
Samples and extractionSamples of two different yew tree species were taken and extracted according to the procedure below (based on the procedure by Wang, et al.4).
3
Extraction1. 5 g chopped cuttings
2. Add 15 mL hexane, vortex, and sonicate for 10 minutes.
3. Discard hexane and repeat once.
4. Dry needles at room temperature overnight.
5. Add 35 mL methanol and mix using Ultra-Turrax, then allow to stand for at least 10 hours.
6. Collect methanol.
7. Add 25 methanol to the needles, vortex, then allow to stand for 30 minutes.
8. Collect methanol and repeat once.
9. Dry the combined methanol phases under nitrogen at 45 °C.
10. Redissolve in 10 mL methanol.
Purification of extract1. 1 mL of extract + 5 mL water
2. Solid-phase cartridge: AccuBond II ODS-C18, 500 mg, 6 cc• Condition cartridge.
• Methanol, 5 mL• Water, 2.5 mL
• Load diluted extract.• Wash cartridge.
• Water, 5 mL• Water/methanol 75/25,
5 mL• Dry cartridge for 5 minutes.• Elute cartridge.
• Methanol, 5 mL• Methanol/ethylacetate
50/50, 5 mL3. Combine elution phases.
4. Take 4 mL aliquot and dry under nitrogen at 45 °C.
5. Redissolve in 4 mL methanol/acetonitrile and filter.
1st dimensionColumn Agilent ZORBAX Eclipse Plus C18, 2.1 × 100 mm, 3.5 µm
(p/n 959793-902)Solvent A WaterSolvent B MethanolFlow rate 60 µL/minGradient 30 % B at 0 minutes
55 % B at 1.5 minutes85 % B at 36 minutes100 % B at 37 minutes100 % B at 45 minutes
Post time 5 minutes at 30 % BColumn temperature 30 °C2nd dimensionColumn Agilent ZORBAX Plus Phenyl-Hexyl RRHT, 4.6 × 50 mm, 1.8 µm
(p/n 959941-912)Solvent A Water with 0.008 % formic acidSolvent B Acetonitrile with 0.004 % formic acidFlow rate 4 mL/minIdle flow rate 0.4 mL/minInitial gradient 20 % B at 0 minutes
33 % B at 0.3 minutes20 % B at 0.31 minutes
Gradient modulation 20 % B at 0 minutes to 55 % B at 37 minutes to 85 % B at 42 minutes33 % B at 0.3 minutes to 85 % B at 37 minutes
Column temperature 40 °CModulationModulation on 9 to 37 minutesLoops Two 40 µL loops, co-current configurationModulation time 0.40 minutesLoop filling 60 %InjectionVolume 5 µL (injection program, mixed with 10 µL water plug )Sample temperature 12 °CNeedle wash 5 seconds flush port (methanol)Detection DADWavelength Signal 228/8 nm, Reference 370/60 nmData rate 80 HzDetection MSDIonization mode APCISource settings Drying gas flow 5 L/min
Drying gas temperature 320 °CNebulizer pressure 50 psiVaporizer temperature 380 °CCapillary voltage 3,000 V (pos and neg mode)Corona current 4 µA (pos mode) and 15 µA (neg mode)
Detection mode FastScanScan 250–1,000 m/z Fragmentor 120 V
Method

4
The effluent from the second-dimension column was split by a T-piece. The DAD was connected to the T-piece by a 70 mm × 0.12 mm id stainless steel capillary, and the inlet of the APCI source was connected to the other outlet of the T-piece by a 340 mm × 75 µm id stainless steel capillary. The 75 µm capillary acts as a restriction and routes the largest part of the flow towards the DAD.
The Agilent OpenLAB CDS Chemstation with 2D-LC add-on software allows complete control of the multidimensional method settings in one panel. Figure 1 shows the setup of this control panel. The system allows the use of idle flow settings to save solvents whenever multidimensional separation is not performed. In this method, LC×LC was only activated from 9 to 37 minutes, that is, 28 minutes out of 45 minutes analysis time (50 minutes with re-equilibration time included). Before and after this window, and between injections, an idle flow of 0.4 mL/min was used, resulting in a reduction of solvent usage in the second dimension of 40 % (120 mL instead of 200 mL/analysis).
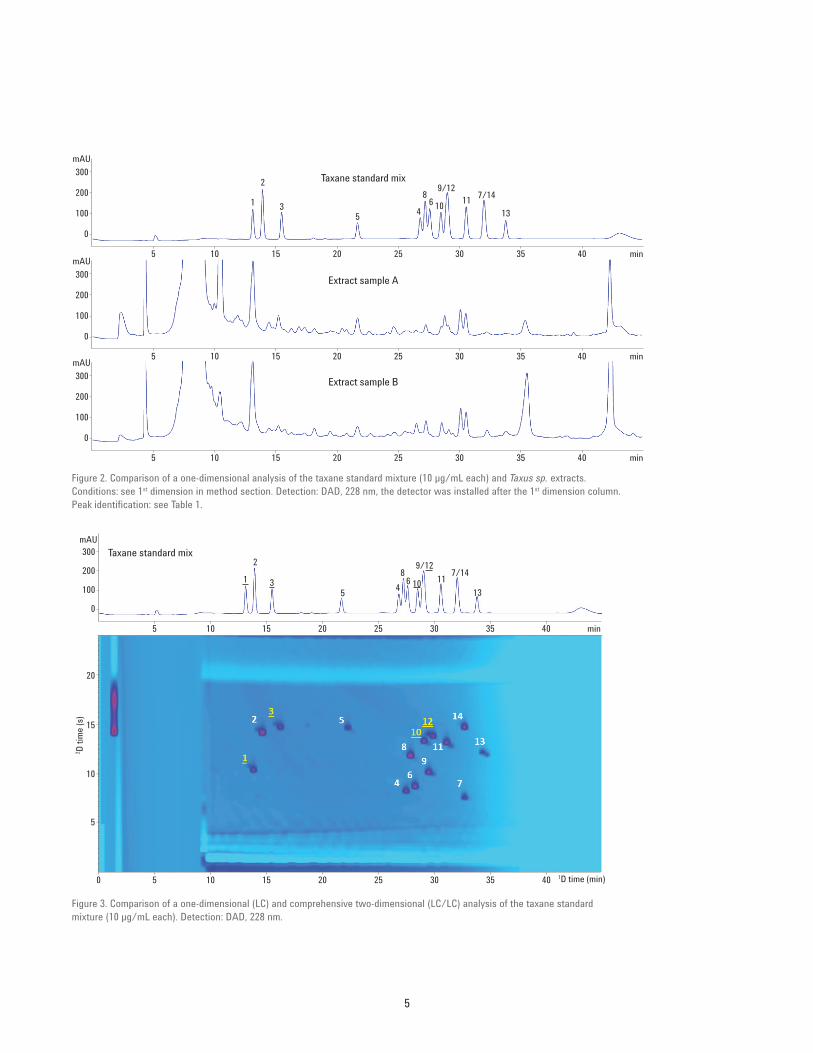
Results and DiscussionA commercially available set of 14 taxanes consisting of paclitaxel, precursors, and analogues was used as a test sample. Paclitaxel, its precursors, and its analogues are very similar in structure but can be separated under optimized conditions. A previous Application Note describes the complete separation of these compounds using an Agilent Zorbax Eclipse Plus Phenyl-Hexyl column and a water/acetonitrile mobile phase5. The analysis becomes more challenging when these compounds have to be determined in real samples, for example Taxus sp. extracts. Figure 2 illustrates the problems associated with interfering matrix constituents when extracts are analyzed with one-dimensional LC and DAD. The separation shown was carried out on a
Figure 1. Screenshot of the 2D-LC method (OpenLAB CDS Chemstation).
ZORBAX Eclipse Plus C18 column (first dimension column), and the separation for the standard mix was not complete. This would have been the case if a Phenyl-Hexyl stationary had been used. The peak capacity (calculated by dividing the gradient time with the average peak width) in this separation was approximately 70. It is clear, however, that the analysis of extracts is significantly more complex and identification and quantitation of the standards in real samples is difficult.
One way to overcome this problem would be to perform a high resolution method with a longer column or smaller particles. This would increase the resolution based on efficiency and consequently the separation probability. For example, using a 2.1 × 150 mm column packed with 1.8 µm particles should give a peak capacity of approximately 120. The gain in
resolution and peak capacity is not high enough to ensure complete separation of the taxanes from each other and from matrix constituents in every sample that is analyzed. Based on theory, the probability to separate, for example, 150 compounds with this high-resolution configuration would be less than 10 %. To obtain a significant increase in peak capacity, and consequently separation probability, comprehensive two-dimensional liquid chromatography (LC×LC) can be applied. Figure 3 shows the analysis of the same standard mixture with the Agilent 1290 Infinity 2D-LC solution using a Phenyl-Hexyl column in the second dimension. All compounds were separated and satisfactory orthogonality was achieved with the applied combination of stationary phase chemistries and mobile phases.
5
0
5
1
2
35 4
86 10
9/1211
7/14
13
10 15 20 25 30 35 40 min
100
200
300Taxane standard mix
mAU
0
5 10 15 20 25 30 35 40 min
100
200
300Extract sample A
mAU
0
5 10 15 20 25 30 35 40 min
100
200
300Extract sample B
mAU
Figure 2. Comparison of a one-dimensional analysis of the taxane standard mixture (10 µg/mL each) and Taxus sp. extracts. Conditions: see 1st dimension in method section. Detection: DAD, 228 nm, the detector was installed after the 1st dimension column. Peak identification: see Table 1.
0
5
1
2
35
4
86 10
9/12
117/14
13
10 15 20 25 30 35 40 min
100
200
300 Taxane standard mixmAU
5 10 15 20 25 30 35 40
5
10
15
2 D ti
me
(s)
1D time (min)0
20
Figure 3. Comparison of a one-dimensional (LC) and comprehensive two-dimensional (LC/LC) analysis of the taxane standard mixture (10 µg/mL each). Detection: DAD, 228 nm.

6
The precision of the method was determined by six consecutive injections of the 10 µg/mL standard mixture and a calibration was performed by single injections of standard solutions containing 0.4 to 30 µg/mL of the taxanes. The data are summarized in Table 2.
The method was applied to the analysis of extracts of two Taxus sp. samples. The composition of both samples was different, but in both samples a number of taxanes were detected. The most interesting taxanes, 10-Deacetylbaccatin-III (1), Cephalomannine (10), and Paclitaxel (12) were detected, whereas Baccatin-III (3) was absent in both samples. A comparison of the standard solution and the samples is shown in Figure 4. The calibration data was applied on both samples to calculate the taxane content in the extracts. Additionally, both samples spiked with 4 µg/mL taxane standards were analyzed to calculate the recovery. Acceptable recovery was obtained for both samples with values approximating 100 % for most compounds. The quantitative data are shown in Table 3.
Table 2. Precision and calibration data of the method.
Peak Name R² Peak volume precision (RSD %)1 10-Deacetylbaccatin-III 0.99999 0.352 Taxol side chain methyl ester 0.99997 0.343 Baccatin-III 0.99995 0.414 7-Xylosyl-10-deacetyltaxol B 0.99992 0.495 Taxinine M 0.99996 0.296 7-Xylosyl-10-deacetyltaxol 0.99997 0.207 7-Xylosyl-10-deacetyltaxol C 0.99999 0.338 10-Deacetyltaxol 1.00000 0.159 7-Xylosyltaxol 0.99999 0.1710 Cephalomannine (Taxol B) 0.99994 0.8011 7-epi-10-Deacetyltaxol 0.99997 0.3412 Paclitaxel (Taxol) 0.99995 0.5413 Taxol C 0.99999 0.4714 7-Epitaxol 0.99998 0.32
5 10 15 20 25
Extract B
30 35
5
10
15
2 D ti
me
(s)
1D time (min)
20
Extract A
5
10
15
2 D ti
me
(s)
20
Taxane standard mix
5
10
15
2 D ti
me
(s)
20
Figure 4. Comparison of comprehensive two-dimensional (LC×LC) analysis of the taxane standard mixture (4 µg/mL each) and extracts. Detection: DAD, 228 nm. Peak identification: see Table 1. (Paclitaxel and the most important precursors have bold/underlined labels).
7
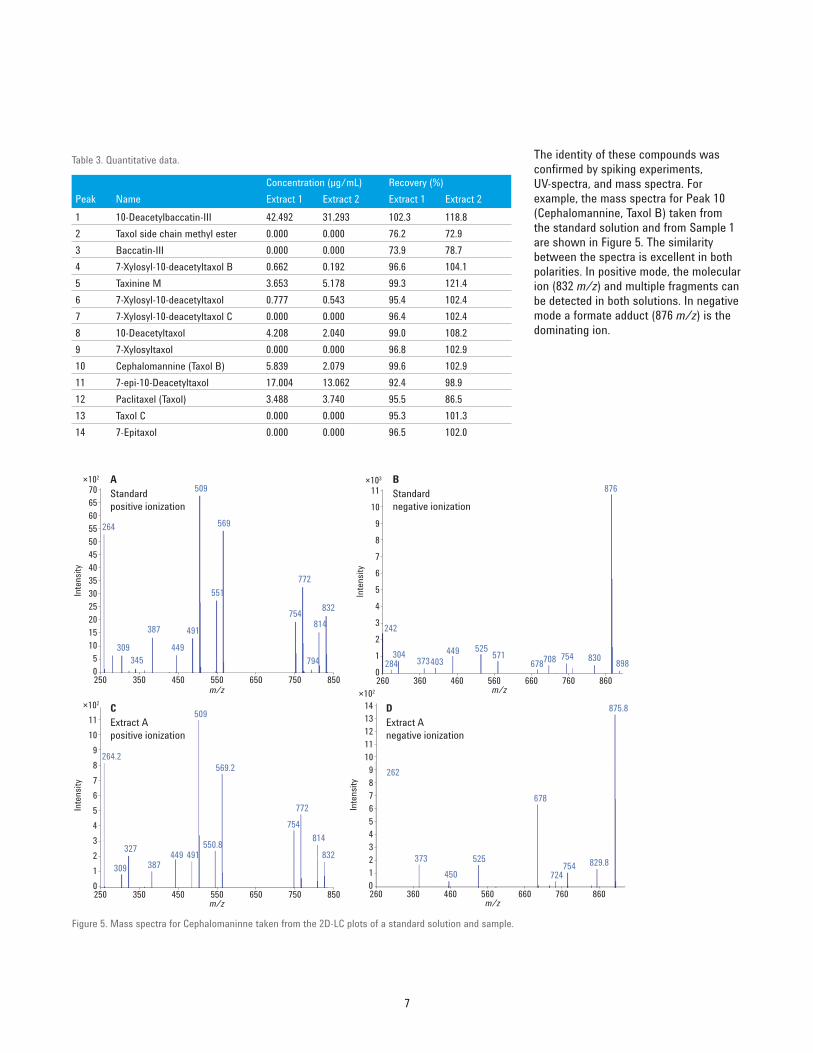
The identity of these compounds was confirmed by spiking experiments, UV-spectra, and mass spectra. For example, the mass spectra for Peak 10 (Cephalomannine, Taxol B) taken from the standard solution and from Sample 1 are shown in Figure 5. The similarity between the spectra is excellent in both polarities. In positive mode, the molecular ion (832 m/z) and multiple fragments can be detected in both solutions. In negative mode a formate adduct (876 m/z) is the dominating ion.
Table 3. Quantitative data.
Concentration (µg/mL) Recovery (%)Peak Name Extract 1 Extract 2 Extract 1 Extract 21 10-Deacetylbaccatin-III 42.492 31.293 102.3 118.82 Taxol side chain methyl ester 0.000 0.000 76.2 72.93 Baccatin-III 0.000 0.000 73.9 78.74 7-Xylosyl-10-deacetyltaxol B 0.662 0.192 96.6 104.15 Taxinine M 3.653 5.178 99.3 121.46 7-Xylosyl-10-deacetyltaxol 0.777 0.543 95.4 102.47 7-Xylosyl-10-deacetyltaxol C 0.000 0.000 96.4 102.48 10-Deacetyltaxol 4.208 2.040 99.0 108.29 7-Xylosyltaxol 0.000 0.000 96.8 102.910 Cephalomannine (Taxol B) 5.839 2.079 99.6 102.911 7-epi-10-Deacetyltaxol 17.004 13.062 92.4 98.912 Paclitaxel (Taxol) 3.488 3.740 95.5 86.513 Taxol C 0.000 0.000 95.3 101.314 7-Epitaxol 0.000 0.000 96.5 102.0
0250
5
×102
10
15
Standard positive ionization
A
Inte
nsity
350
309
264
345
387
449
491
509
569
551
754
772
794
814
832
450 550m/z
650 750 850
20
25
30
35
40
45
50
55
60
65
70
0260
1
×103
2
Standard negative ionization
B
Inte
nsity
360
304284
242
373403449 525
678571 754708 830
876
898
460 560m/z
660 760 860
3
4
5
6
7
8
9
10
11
0250
1
×102
2
3
Extract Apositive ionization
C
Inte
nsity
350
309
264.2
327
387449 491
509
569.2
550.8
754
772
814
832
450 550m/z
650 750 850
4
5
6
7
8
9
10
11
1
2
3
4
5
6
7
8
9
10
11
12
13
14
0260
×102
Extract Anegative ionization
D
Inte
nsity
360
262
373
450
525
678
724754 829.8
875.8
460 560m/z
660 760 860
Figure 5. Mass spectra for Cephalomaninne taken from the 2D-LC plots of a standard solution and sample.
8
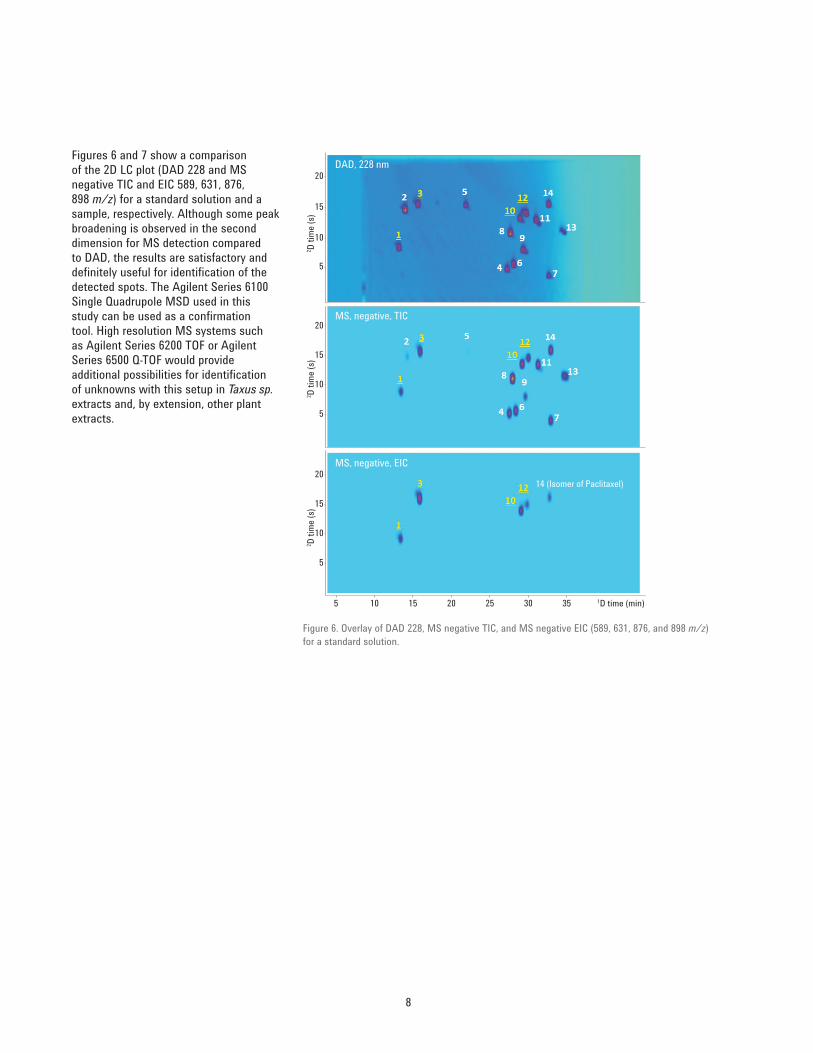
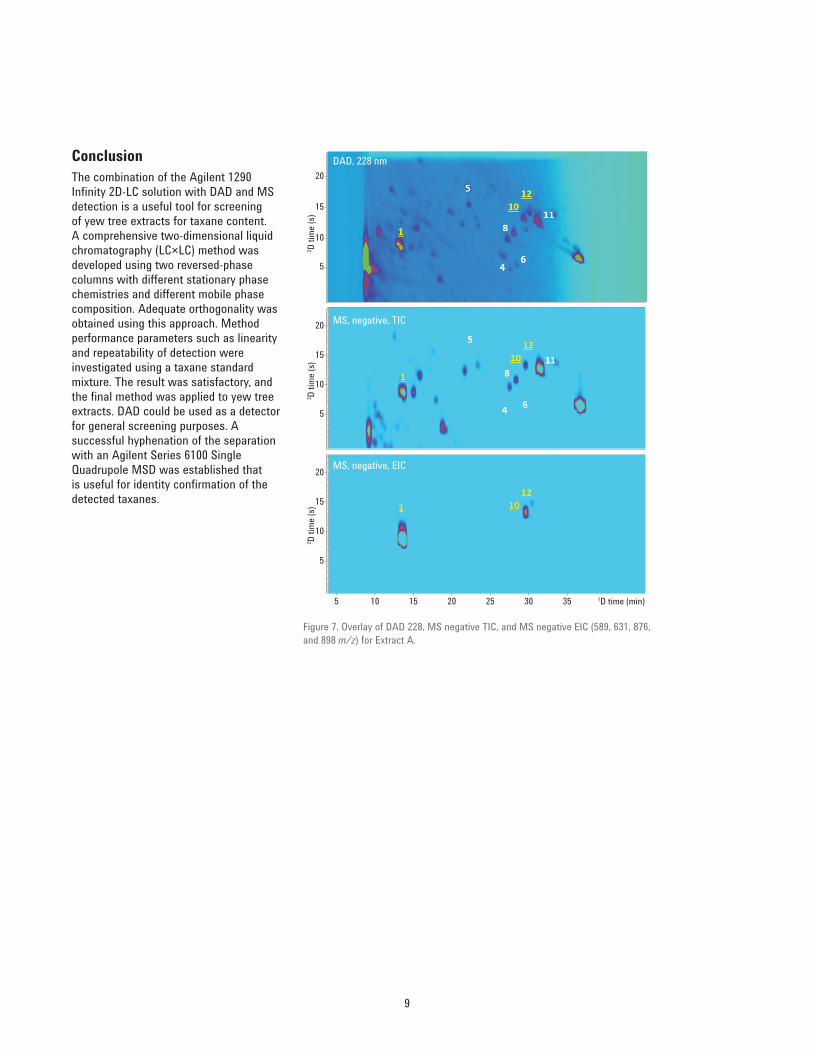
Figures 6 and 7 show a comparison of the 2D LC plot (DAD 228 and MS negative TIC and EIC 589, 631, 876, 898 m/z) for a standard solution and a sample, respectively. Although some peak broadening is observed in the second dimension for MS detection compared to DAD, the results are satisfactory and definitely useful for identification of the detected spots. The Agilent Series 6100 Single Quadrupole MSD used in this study can be used as a confirmation tool. High resolution MS systems such as Agilent Series 6200 TOF or Agilent Series 6500 Q-TOF would provide additional possibilities for identification of unknowns with this setup in Taxus sp. extracts and, by extension, other plant extracts.
5 10 15 20 25
MS, negative, EIC
14 (Isomer of Paclitaxel)
MS, negative, TIC
30 35
5
10
15
2 D ti
me
(s)
1D time (min)
20
5
10
15
2 D ti
me
(s)
20
DAD, 228 nm
5
10
15
2 D ti
me
(s)
20
Figure 6. Overlay of DAD 228, MS negative TIC, and MS negative EIC (589, 631, 876, and 898 m/z) for a standard solution.
9
ConclusionThe combination of the Agilent 1290 Infinity 2D-LC solution with DAD and MS detection is a useful tool for screening of yew tree extracts for taxane content. A comprehensive two-dimensional liquid chromatography (LC×LC) method was developed using two reversed-phase columns with different stationary phase chemistries and different mobile phase composition. Adequate orthogonality was obtained using this approach. Method performance parameters such as linearity and repeatability of detection were investigated using a taxane standard mixture. The result was satisfactory, and the final method was applied to yew tree extracts. DAD could be used as a detector for general screening purposes. A successful hyphenation of the separation with an Agilent Series 6100 Single Quadrupole MSD was established that is useful for identity confirmation of the detected taxanes.
Figure 7. Overlay of DAD 228, MS negative TIC, and MS negative EIC (589, 631, 876, and 898 m/z) for Extract A.
5 10 15 20 25
MS, negative, EIC
MS, negative, TIC
30 35
5
10
15
2 D ti
me
(s)
1D time (min)
20
5
10
15
2 D ti
me
(s)
20
DAD, 228 nm
5
10
15
2 D ti
me
(s)
20

www.agilent.com/chem/1290-2dlc
This information is subject to change without notice.
© Agilent Technologies, Inc., 2013-2014 Published in the USA, September 15, 2014 5991-3576EN
References1. M.C. Wani, et al., J. Am. Chem. Soc.
93, 2325-2327 (1971).
2. S.G. Arbuck, B.A. Blaylock, “Taxol: Science and Applications” CRC-Press, 379-415 (1995).
3. S. Borman, Chem. Eng. News 72, 32-34 (1994).
4. X. Wang, et al., Z. Naturforsch. 61c 619-624 (2006).
5. W.J. Long, J.W. Henderson Jr., Agilent Technologies Application Note, Publication Number 5989-9340EN (2008).
![f6publishing.blob.core.windows.net€¦ · Web viewOn the other hand, widely used taxanes, originally identified from plant of genus Taxus, are docetaxel and paclitaxel[3]. Neoadjuvant](https://static.fdocuments.in/doc/165x107/5f0785a47e708231d41d65f9/web-view-on-the-other-hand-widely-used-taxanes-originally-identified-from-plant.jpg)