Determination of Substantial Chemical Compounds of ...
10
JOURNAL OF ELECTRICAL AND ELECTRONIC SYSTEMS RESEARCH 50 Abstract - Agarwood is a resin saturated heartwood producing its ownessential oil. This oil comprises of a complex mixture of chromone derivatives, oxygenated sesquiterpenes and sesquiterpene hydrocarbons. This mixture has a heavy woody scentand is one of the contributors to the Agarwood oil quality. In this paper, a study that focuses on the approach to select the substantial chemical compounds for Agarwood quality grading was carried out. GC-MS analysis was used to extract the chemical compounds from the Agarwood oil. The data were then pre- processed using techniques such as missing values ratio, natural logarithm and min. max. normalization. Next, synthetic data were generated using MUNGE to fulfil the passing condition of sampling adequacy test. To determine the substantial compounds, PCA and Pearson’s correlation were used. This approach was successful in determining three substantial compounds namely β-agarofuran, α- agarofuran and 10-epi-γ-eudesmol. These substantial chemical compounds will be used later to predict the quality of Agarwood oil. Index Terms—Correlation, Principle Components Analysis, Statistical Analysis, Statistical Learning I. INTRODUCTION GARWOOD is a fragrant wood and known by many names in different cultures such as Chen Xiang, Gaharu, Agarwood tree is a beneficial tree because every part is valuable as example, tree trunks (stem) and branches can be changed into chips, flakes of uniform quality powder or essential oils (Agarwood oil) which is also known as concentrated volatile aromatic compounds [1, 3, 5, 7, 8]. The price of Agarwood oil depends on its quality. Their relationship is proportional to each other. The quality is defined based on colour, odour, high fixative properties and consumer perception [7, 9]. In terms of grades, some countries use high and low [3, 9-11] and some use A, B, C and D [3, 10, 12, 13]. In terms of application, Agarwood and its oil are used in perfume, medicine and religious ceremony [2, 3, 5, 7, 9]. The quality of Agarwood oil is decided by its resin content [3, 5-7]. It inhibits tree extractives with aromatic terpenes [1, 7] and carries a high complex mixture of volatile organic compound sand gives particular strong woody scent. The combination of these fragrant compounds produces a special characteristic odour to the plant and often used by human in a form of Agarwood essential oil[14].This oil consists of a complex mixture of sesquiterpene hydrocarbons, oxygenated sesquiterpenes and chromone derivatives which are significant and active compounds in Agarwood[1-3, 5, 9, 15]. These compounds are substantial in determining the quality of Agarwood oil. The names of these compounds are various guaienes exampleα-guaiene, β-agarofuran, α-agarofuran, 10- epi-ɤ-eudesmol and valerianol. In addition, they are the major compounds present in high quality oil [1, 3, 5, 9, 10, 15].There are many techniques to extract the essential oil from Agarwood such as supercritical fluid extraction, solvent extraction, hydro- distillation and etc. Before the extraction, a pre-treatment needs to be performed on Agarwood samples such as chemical treatment, soaking in water and sonication [16]. In some research, the extracted oil is further analysed using Gas Chromatography–Mass Spectrometer (GC-MS) [1, 3, 7, 9, 10, 15]and Solid-Phase Microextraction (SPME) [3, 10, 15]. Boxplot is one of the graphical technique used to display distributional shapes and to detect unusual observations[17]. It is made up of inter quartile range (IQR), sample median, outliers and whiskers. A box consisting of the first quartile (Q1) to the third quartile (Q3) represents the IQR. This box's area represents 50% of the distribution. A sample median is defined as a line at the height of second quartile (Q2). Outliers are defined as extreme points outside the observations. They are represented by points outside the interval (Q1 – 1.5 IQR; Q3 + Determination of Substantial Chemical Compounds of Agarwood Oil for Quality Grading Mohamad Hushnie Haron, Mohd Nasir Taib, Nurlaila Ismail, Nor Azah Mohd Nor, and Saiful Nizam Tajuddin A https://doi.org/10.24191/jeesr.v17i1.007 Eaglewood, Jinkoh, Kanankoh, Kyara and Qi-Nan[1]. It is aresin-saturated heartwood and this resin is materialized by injuring the plant using physical cuts, insects, chemical stimulationor bacterial infections [2-5]. Agarwood comprises of many families such as Leguminosae, Euphorbiaceae and Thymelaeaceae. The Thymelaeaceae family consists of two genera: Aquilaria and Gyrinops [3, 6, 7]. In Southeast Asia, nineteen species has been recognized in the taxonomical classification of genus Thymelaeaceae [3, 4]. One of the essential species from this family is Aquilaria Malaccensis and it is common species in Malaysia [2, 5]. This manuscript is submitted on 8 th January 2020 and accepted on 21 th May 2020. Mohamad Hushnie Haron, Mohd Nasir Taib and Nurlaila are with the Faculty of Electrical Engineering, Universiti Teknologi MARA, 40450 Shah Alam, Selangor (e-mail: [email protected]). Nor Azah Mohd Nor is with Forest Research Institute Malaysia, Kepong and Saiful Nizam Tajuddin is from Universiti Malaysia Pahang, Pekan, Pahang. 1985-5389/© 2021 The Authors. Published by UiTM Press. This is an open access article under the CC BY-NC-ND license (http://creativecommons.org/ licenses/by-nc-nd/4.0/).
Transcript of Determination of Substantial Chemical Compounds of ...

JOURNAL OF ELECTRICAL AND ELECTRONIC SYSTEMS RESEARCH
50
Abstract - Agarwood is a resin saturated heartwood producing its ownessential oil. This oil comprises of a complex mixture of chromone derivatives, oxygenated sesquiterpenes and sesquiterpene hydrocarbons. This mixture has a heavy woody scentand is one of the contributors to the Agarwood oil quality. In this paper, a study that focuses on the approach to select the substantial chemical compounds for Agarwood quality grading was carried out. GC-MS analysis was used to extract the chemical compounds from the Agarwood oil. The data were then pre-processed using techniques such as missing values ratio, natural logarithm and min. max. normalization. Next, synthetic data were generated using MUNGE to fulfil the passing condition of sampling adequacy test. To determine the substantial compounds, PCA and Pearson’s correlation were used. This approach was successful in determining three substantial compounds namely β-agarofuran, α-agarofuran and 10-epi-γ-eudesmol. These substantial chemical compounds will be used later to predict the quality of Agarwood oil.
Index Terms—Correlation, Principle Components Analysis, Statistical Analysis, Statistical Learning
I. INTRODUCTION
GARWOOD is a fragrant wood and known by many names in different cultures such as Chen Xiang, Gaharu,
Agarwood tree is a beneficial tree because every part is valuable as example, tree trunks (stem) and branches can be changed into chips, flakes of uniform quality powder or essential oils (Agarwood oil) which is also known as concentrated volatile aromatic compounds [1, 3, 5, 7, 8]. The price of Agarwood oil depends on its quality. Their relationship is proportional to each other. The quality is defined based on colour, odour, high fixative properties and consumer perception [7, 9]. In terms of grades, some countries use high and low [3, 9-11] and some use A, B, C and D [3, 10, 12, 13]. In terms ofapplication, Agarwood and its oil are used in perfume, medicine and religious ceremony [2, 3, 5, 7, 9].
The quality of Agarwood oil is decided by its resin content [3, 5-7]. It inhibits tree extractives with aromatic terpenes [1, 7] and carries a high complex mixture of volatile organic compound sand gives particular strong woody scent. The combination of these fragrant compounds produces a special characteristic odour to the plant and often used by human in a form of Agarwood essential oil[14].This oil consists of a complex mixture of sesquiterpene hydrocarbons, oxygenated sesquiterpenes and chromone derivatives which are significant and active compounds in Agarwood[1-3, 5, 9, 15]. These compounds are substantial in determining the quality of Agarwood oil. The names of these compounds are various guaienes exampleα-guaiene, β-agarofuran, α-agarofuran, 10-epi-ɤ-eudesmol and valerianol. In addition, they are the major compounds present in high quality oil [1, 3, 5, 9, 10, 15].There are many techniques to extract the essential oil from Agarwood such as supercritical fluid extraction, solvent extraction, hydro-distillation and etc. Before the extraction, a pre-treatment needs to be performed on Agarwood samples such as chemical treatment, soaking in water and sonication [16]. In some research, the extracted oil is further analysed using Gas Chromatography–Mass Spectrometer (GC-MS) [1, 3, 7, 9, 10, 15]and Solid-Phase Microextraction (SPME) [3, 10, 15].
Boxplot is one of the graphical technique used to displaydistributional shapes and to detect unusual observations[17]. It is made up of inter quartile range (IQR), sample median, outliers and whiskers. A box consisting of the first quartile (Q1) to the third quartile (Q3) represents the IQR. This box's area represents 50% of the distribution. A sample median is defined as a line at the height of second quartile (Q2). Outliers are defined as extreme points outside the observations. They are represented by points outside the interval (Q1 – 1.5 IQR; Q3 +
Determination of Substantial Chemical Compounds of Agarwood Oil for Quality
Grading Mohamad Hushnie Haron, Mohd Nasir Taib, Nurlaila Ismail, Nor Azah Mohd Nor, and Saiful Nizam
Tajuddin
A
https://doi.org/10.24191/jeesr.v17i1.007
Eaglewood, Jinkoh, Kanankoh, Kyara and Qi-Nan[1]. It is aresin-saturated heartwood and this resin is materialized by injuring the plant using physical cuts, insects, chemical stimulationor bacterial infections [2-5]. Agarwood comprises of many families such as Leguminosae, Euphorbiaceae and Thymelaeaceae. The Thymelaeaceae family consists of two genera: Aquilaria and Gyrinops [3, 6, 7]. In Southeast Asia, nineteen species has been recognized in the taxonomical classification of genus Thymelaeaceae [3, 4]. One of the essential species from this family is Aquilaria Malaccensis and it is common species in Malaysia [2, 5].
This manuscript is submitted on 8th January 2020 and accepted on 21th May 2020. Mohamad Hushnie Haron, Mohd Nasir Taib and Nurlaila are with the Faculty of Electrical Engineering, Universiti Teknologi MARA, 40450 Shah Alam, Selangor (e-mail: [email protected]).
Nor Azah Mohd Nor is with Forest Research Institute Malaysia, Kepong and Saiful Nizam Tajuddin is from Universiti Malaysia Pahang, Pekan, Pahang.
1985-5389/© 2021 The Authors. Published by UiTM Press. This is an open access article under the CC BY-NC-ND license (http://creativecommons.org/licenses/by-nc-nd/4.0/).

JOURNAL OF ELECTRICAL AND ELECTRONIC SYSTEMS RESEARCH. VOL. 17 DEC 2020
51
1.5 IQR where IQR = Q3 – Q1). Whiskers are lines that reach the maximum or minimum points from the ends of the box. Box plot shows the location and distribution of data using median and inter quartile range. It also shows the skewness of data using the whiskers length and median position [7, 17-19].
In statistical analysis, missing values have a direct impact on the quality of the data. Within a dataset, if the missing values are less than 1% of its total data, they are considered negligible and manageable if they are between 1 and 5%. However, if the missing values are between 5 and 15%, a sophisticated method is required to handle them. Missing values can have severe impact on the interpretation of the data if they are greater than 15%.There are a number of approaches to manage missing values. The first approach is the case elimination. This approach consists of determination and elimination of the attributes with high level of missing values. Second is mean imputation. It replaces the missing values of an attribute using mean. Third is the imputation of median. It replaces the missing values of an attribute using median. Fourth is the imputation of k-NN. It replaces the missing values of an instance with the most similar instance using nearest neighbour [7, 20, 21].
In order to have a normal distributed data, logarithmic transformation can be applied. One common alternative for logarithmic transformation is the natural logarithm, where the constant e (e≈2.7183) is used as the base. Mathematically, logarithm for any number less than zero is undefined, and between 0 and 1 and above than 1 need to be handled differently. Therefore, the data should be anchored at 1 [7, 22, 23]. To deal with zero values, a constant is often added, such as “ln(x + 1)” [24].
Shapiro Wilk test is applied for samples size less than 50. This test can distinguish the different in normality due to skewness, kurtosis or both. It has become a favourable test due to its good power properties [7, 25].
Synthetic data generation is a common practice in many research areas especially in situation where the real data may be difficult to obtain due to budget, time, etc. Synthetic data is a substitute for real data and can be employed to provide a controlled testing environment which meets specific condition. In terms of applications, the data can be used in the process of verification, simulation or proof of concepts [26].
Kaiser-Meyer-Olkin (KMO) and Bartlett’s tests are the two test that need to be computed before running the Factor Analysis or Principle Components Analysis (PCA). KMO test measures the sampling adequacy of data. It produces KMO index which range from 0 to 1. To shows that the data are suitable for Factor Analysis or PCA, the minimum acceptable KMO index is 0.5 [27].
Principle Component Analysis (PCA) is a quantitative method to lower the dimension of data with a lot of variables to a new set of variable called Principle Component (PC) without losing much information. Each PC in PCA is a linear combination of the original variables and orthogonal to one another [8, 28, 29]. Basically, PCA is where principal components are obtained based on eigen value (value >1) and then rotated for orthogonal plotting[30]. The steps to do PCA are [28, 29]:
i. Compute covariance matrix, C. ii. Calculate eigen values and eigenvectors of matrix C.
iii. Arrange the eigen values in descending order. iv. Form a transformation matrix that consists of eigenvectors associated with eigen values. v. Project the data onto transformation matrix.
To select significant principle components, Scree Plot has been applied. The Scree Plot is a heuristic graphic method that consists of: eigenvalues in y-axis against the principle components in x-axis. The method used in Scree Plot is by inspecting the shape of the resulting curve in order to detect the point at which the curve changes drastically (elbow). This point on the curve indicates the maximum number of components or factors to retain[31]. The original or unrotated factors are hard to interpret and not meaningful. To solve these problems, factor rotation techniques such as Varimax and Quartimax are used. Varimax is a rotation method used in statistical analysis. It rotates orthogonally by minimizing the number of variables with high loadings which can be either positive or negative and by maximizing the variance of each factor loading by making high loadings higher and low loadings lower. This method simplifies factor interpretation. Mathematically, it redistributes the total variance among variables between smaller numbers of factors with relatively equal variances. The amount of variations among the major unrotated factors will be redistributed among the other smaller factors[32]. To select the significant compounds, interpretation of correlation coefficient can be applied after factors rotation. Table I shows a few interpretation of Pearson’s correlation coefficient.
TABLE I
INTERPRETATION OF PEARSON’S CORRELATION COEFFICIENTS Correlation Coefficient
Dancey and Reidy[33]
Quinnipiac University[33] Chan Y. H.[33]
1.00 -1.00 Perfect Perfect Perfect
0.90 -0.90 Strong Very Strong Very Strong
0.80 -0.80 Strong Very Strong Very Strong
0.70 -0.70 Strong Very Strong Moderate
0.60 -0.60 Moderate Strong Moderate
0.50 -0.50 Moderate Strong Fair
0.40 -0.40 Moderate Strong Fair
0.30 -0.30 Weak Moderate Fair
0.20 -0.20 Weak Weak Poor
0.10 -0.10 Weak Negligible Poor
0.00 0.00 None None None
This study focuses on determining the substantial chemical
compounds of Agarwood oil and can be divided into 3 parts in general: pre-processing, generation of synthetic data and determination of substantial chemical compounds. It comprises of 4 sections namely introduction, method, results and discussion, and conclusion. Introduction represents the literature review of Agarwood oil, box plot, missing values ratio, natural logarithm transformation, normalization, MUNGE, PCA and Pearson’s correlation. Method consists of two parts specifically data acquisition and data analysis. In data

Abdullah et.al.: Designation of Thorax and Non-Thorax Regions for Lung Cancer Detection in CT Scan Images using Deep Learning
52
analysis, the method of pre-processing, generation of synthetic data and determination of substantial chemical compounds were explained. The findings of this study were shown and discussed in results and discussion. The accomplishment of this study was described in conclusion.
II. METHOD Method consists of two subsections: Data Acquisition and
Data Analysis. Data acquisition is the process of obtaining the chemical compounds of Agarwood oil. Data analysis involves all the techniques used in this analysis specifically missing values ratio, natural logarithm, min.max. normalization MUNGE, principal components analysis and correlation coefficient.
A. Data Acquisition In this paper, all 22 Agarwood oil samples come from
Aqualaria species. They are acquired from Forest Research Institute Malaysia (FRIM) and Universiti Malaysia Pahang (UMP). These chemical compounds were extracted and analysed using GC-MS. The temperature of GC-MS apparatus was initially set for 10 min. at 60º C. The temperature then was increased at3º C per minute and stopped at 230º C.The flow rate of the gas carrier namelyhelium was set at 1ml per min. The temperature of ion source was set at 280º C. By matching them with the mass spectral library (HPCH2205.L; Wiley7Nist05a.L; NIST05a.L), 104 chemical compounds were recognized with the aid of a chemist.
B. Data Analysis This subsection includes dimension reduction, data
transformation, data rescaling, normality test, generation of synthetic data and determination of substantial chemical compounds. The general process flow of data analysis is represented by Fig. 1.
GC-MS analysis
Dimension reduction using missing values ratio technique
Data transformation using natural logarithm technique
Statistical analysis using exploratory analysis and normality
test
Generation of synthetic data using MUNGE
Determination of substantial chemical compounds using
PCA and Pearson’s correlation
Fig. 1: General process flow of data analysis
Figure 2 shows the flow diagram of dimension reduction, data transformation and data rescaling. GC-MS data consists of 22 samples of Agarwood oil with 104 chemical compounds. First, the number of chemical compounds was reduced using
missing values ratio technique. In order to select competent data, the eigen values of correlation matrix were calculated with a decrease of 1% missing values and it stops when the correlation matrix has no negative eigen values. Samples with equal or more than 72% of missing values were removed at the end. Only 20 were left out of 106 chemical compounds.
Fig. 2: Flow diagram of dimension reduction, data transformation and data rescaling
The data with20 compounds were then transformed using natural logarithm. The formula used is expressed by (1) [24]. This technique is useful for data with positive skewness [7, 22, 23].
𝑎𝑎′ = 𝑙𝑙𝑙𝑙(𝑎𝑎 + 1) (1)
Each attribute was subsequently rescaled using min. max.
normalization from 0.01 to 0.99 as indicated in (2) [34]. This rescaling was applied to raw data, data after missing values ratio and data after natural logarithm for comparison.
𝑥𝑥′ =𝑥𝑥 − 𝑥𝑥𝑚𝑚𝑚𝑚𝑚𝑚
𝑥𝑥𝑚𝑚𝑚𝑚𝑚𝑚 − 𝑥𝑥𝑚𝑚𝑚𝑚𝑚𝑚∗ (𝑥𝑥𝑚𝑚𝑛𝑛𝑛𝑛𝑚𝑚𝑚𝑚𝑚𝑚 − 𝑥𝑥𝑚𝑚𝑛𝑛𝑛𝑛𝑚𝑚𝑚𝑚𝑚𝑚) + 𝑥𝑥𝑚𝑚𝑛𝑛𝑛𝑛𝑚𝑚𝑚𝑚𝑚𝑚 (2)
Then using the box plot and the normality test, the rescaled
data were analysed. Box plot provides relevant information such as quartiles, maximum and minimum value, median and outliers. It has certain advantages such as simplicity of design, quick expression of critical information of dataset and data

JOURNAL OF ELECTRICAL AND ELECTRONIC SYSTEMS RESEARCH. VOL. 17 DEC 2020
53
Yes
distribution[35]. Due to its ability to detect non-normality for a wide variety of statistical, Shapiro Wilk was selected for normality test. It is an efficient omnibus test of normality, regardless of sample size and distribution [36, 37]. If the p-value is less than the level of significance chosen, the null hypothesis can be rejected and thus, it supports the non-Gaussian distribution[38]. Shapiro’s Wilk test is defined by (3) and (4)[36].
𝑤𝑤 =(∑ 𝑎𝑎𝑚𝑚𝑦𝑦𝑚𝑚𝑁𝑁
𝑚𝑚=1 )∑ 𝑦𝑦𝑚𝑚 − 𝑚𝑚1𝑁𝑁𝑚𝑚=1
(3)
where
𝑤𝑤 =(∑ 𝑎𝑎𝑚𝑚𝑦𝑦𝑚𝑚𝑁𝑁
𝑚𝑚=1 )∑ 𝑦𝑦𝑚𝑚 − 𝑚𝑚1𝑁𝑁𝑚𝑚=1
(4)
It is necessary to generate synthetic data before selecting the
significant compounds using PCA. A technique called MUNGE was applied here. This technique is based on closest neighbour. First, the closest neighbours for each element were determined from the original dataset. Here, Euclidean distance was used to calculate the distance. Next, the element e from original dataset was exchanged with its nearest neighbour e' with probability p and remains unchanged with probability 1-p [39, 40].The synthetic data that were generated should pass the test of KMO and Bartlett. The value of KMO and p-value of Bartlett should be greater than or equal to 0.5 and smaller than 0.05 respectively [27].
Computationof KMO and Bartlett’s test
Correlation between compounds
Computation of eigenvectors and eigenvalues
Sorting eigenvalues in descending order and forming
transformation matrix
Determination of significant principal components using
Scree Plot
Rotation of loadings using Varimax
Selection of significant compounds
Fig. 3: Flow chart of KMO and Bartlett’s test, and PCA
PCA and Pearson’s correlation were then used to identify
substantial chemical compounds. The data with 19 chemical compounds were first computed using Pearson’s Correlation.
These correlated data were used as PCA input. Figure 3 displays the flow chart of KMO and Bartlett’s test, and PCA. Then from the correlation matrix, the eigen values and eigenvectors were determined. Next in descending order, the eigen values were sorted. After that, a transformation matrix was computed which consists of eigenvectors associated with eigenvalues. Significant principal components were then determined using Scree Plot. Y-axis represents the eigen values and x-axis principle components. The first elbow and the large gap of the Scree Plot were observed and the principal components until the first elbow and before the gap are known as the significant principal components [31]. Finally, the principal components were rotated using Varimax and significant chemical compounds were extracted by selecting a chemical compound with a correlation coefficient greater than or equal to 0.60[33].
The significant chemical compounds obtained from PCA were again reduced by Pearson’s correlation. The substantial chemical compounds were determined by selecting a chemical compound with correlation coefficients greater than or equal to 0.60. The Pearson’s correlation coefficient is calculated using (5)[41].
𝑟𝑟 =(∑ (𝑥𝑥𝑚𝑚 − �̅�𝑥)(𝑦𝑦𝑚𝑚 − 𝑦𝑦�)𝑚𝑚
𝑚𝑚=1 )
�(∑ (𝑥𝑥𝑚𝑚 − �̅�𝑥)2𝑚𝑚𝑚𝑚=1 )�(∑ (𝑦𝑦𝑚𝑚 − 𝑦𝑦�)2𝑚𝑚
𝑚𝑚=1 ) (5)
III. RESULTS AND DISCUSSION This section is divided into two sub-sections: pre-processing
and determination of substantial compounds. Pre-processing consists of results and discussion after missing values ratio technique, natural logarithm technique and Shapiro-Wilks test. Meanwhile, under the determination of substantial compounds, the results of PCA and Pearson's correlation were shown and discussed.
A. Pre-Processing The raw data were obtained from GC-MS analysis. 22
samples of Agarwood oil were analysed and each sample consists of 104 chemical compounds. The compound were measured as percentage of compound abundance. The abundance patterns of chemical compounds for each sample are displayed in Fig. 4(a), 4(b) and 4(c). The names of 104 chemical compounds can be found in Table II. It can be observed that a number of chemical compounds have a value of 0% abundance for nearly every sample as examples 2-phenyl propanal, nonanoic acid, decanoic acid, α-funebrene, β-maaliene, β-copaene and etc. The value of 0% indicates that the compound does not exist in a sample. These missing values need to be managed by a certain approach such as missing values ratio technique. Other chemical compounds such as 4-phenyl-2-butanone, β-agarofuran, α-agarofuran, 10-epi-γ-eudesmol, ɤ-eudesmol and dihydrocollumellarin are present in nearly all samples.
No KMO value ≥ 0.5 Bartlett’s p-value < 0.05
Abdullah et.al.: Designation of Thorax and Non-Thorax Regions for Lung Cancer Detection in CT Scan Images using Deep Learning
54
(a)
(b)
(c)
Fig. 4: (a) GC-MS raw data for CKE, CM, EO2, EO3, EO4, HD and HG; (b) GC-MS raw data for JBD, KB, LA, LG, M, MA and MA1; (c) GC-MS raw
data for MA2, MN, MNS, MPE, MS, R5, RG and T
TABLE II
NAMES OF CHEMICAL COMPOUNDS OF AGARWOOD OIL ACQUIRED FROM THE GC-MS ANALYSIS.
No. Chemical Compounds No. Chemical Compounds
1 2-phenyl propanal 53 1,5-epoxy-nor-ketoguaiene 2 Benzaldehyde 54 10-epi-ɤ-eudesmol 3 Benzeneacetonitrile 55 Agarospirol 4 4-phenyl-2-butanone 56 ɤ-eudesmol 5 nonanoic acid 57 alloaromadendrene epoxide 6 decanoic acid 58 selina 3,11-dien-6α-ol 7 α-funebrene 59 jinkoh-eremol 8 α-gurjunene 60 guaia-3,9-dien-11-ol 9 a-cedrene 61 β-eudesmol
10 β-maaliene 62 Kusunol 11 β-copaene 63 α-eudesmol 12 β-Gurjunene 64 Valerianol 13 ϒ-elemene 65 selina 11-en-4α-ol 14 β-humulene 66 Bulnesol 15 α-guaiene 67 dehydrojinkoh-eremol 16 aromadendrane 68 β-bisabolol 17 amorpha-4,11-diene 69 Cadalene 18 drima-7,9(11)-diene 70 α-bisabolol 19 valencene 71 Selina-3,11-dien-9-one 20 ϒ-gurjunene 72 Cyperotundone 21 β-agarofuran 73 10-nor-calamenen-10-one 22 ϒ-muurolene 74 Rotundone 23 ar-curcumene 75 Longifolol 24 β-selinene 76 selina-4,11-dien-14-oic acid 25 cis-β-guaiene 77 selina-3,11-dien-14-al 26 α-muurolene 78 9,11-eremophiladiene 27 ϒ-guaiene 79 selina-3,11-dien-14-ol 28 β-dihydro agarofuran 80 selina-4,11-dien-14-al 29 α-bulnesene 81 Aristolone 30 ϒ-cadinene 82 β-costol 31 δ-cadinene 83 guaia-1(10),11-dien-15-ol 32 cis-calamenene 84 selina-3,11-dien-14-oic acid 33 α-elemol 85 Sinenofuranol 34 (Z)-nerolidol 86 14-hydroxy-α-muurolene 35 α-cadinene 87 2-hexadecanone 36 selina-3, 7(11)-diene 88 Dihyrokaranone 37 hedycaryol 89 guaia-1(10),11-dien-15-al 38 α-agarofuran 90 Karanone 39 elemol 91 oxo-agarospirol 40 dodecanoic acid 92 pentadecanoic acid 41 β-vetivene 93 Hexadecanol 42 ϒ-vetivenene 94 hexadecanoic acid 43 nor-keto-agarofuran 95 Eudesmol 44 β-calacorene 96 Thujopsenal 45 dodecanoic acid 97 palmitic acid
46 epoxy-bulnesene 98 2-hydroxyquaia-1(10),11,15-oic acid
47 spathulenol 99 Cyclohexadecanolide
48 viridiflorol 100 9-hydroxyselina-4,11-dien-14-oic acid
49 tetradecanal 101 Dihydrocollumellarin 50 β-Gurjunene 102 1,5-diphenyl-2-pentene
51 guaiol 103 guaia-1(10),11-dien-15,2-olide
52 hinesol 104 oleic acid
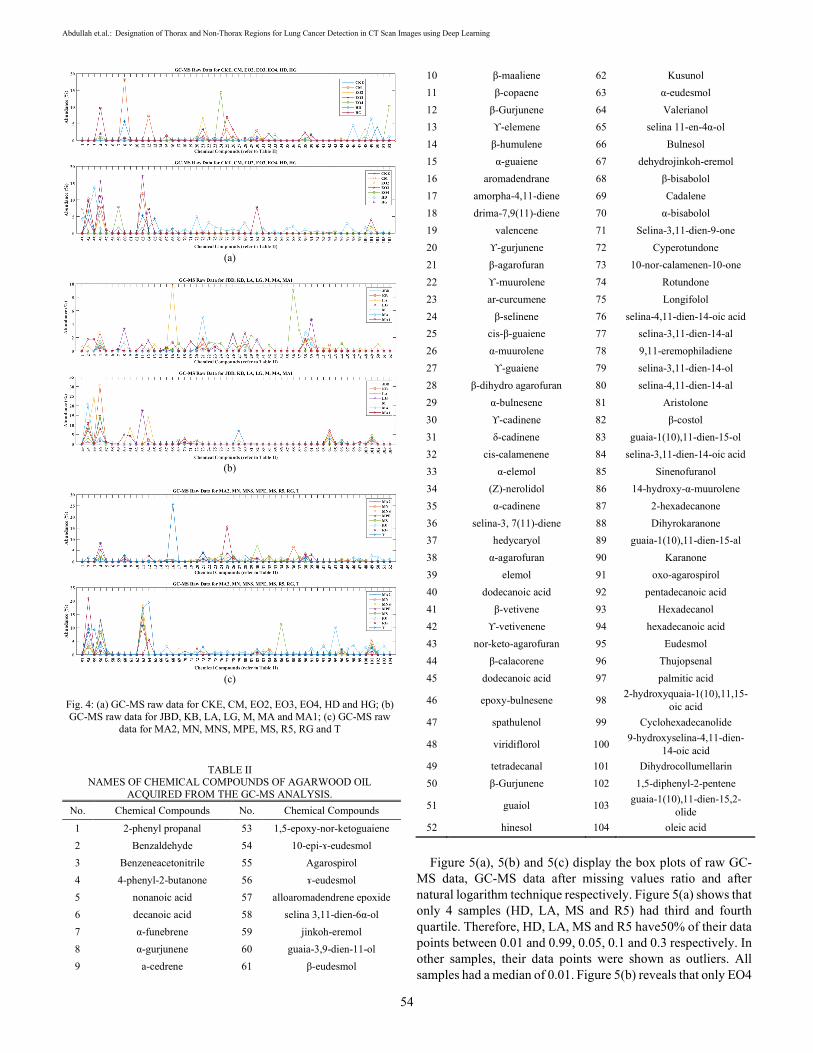
Figure 5(a), 5(b) and 5(c) display the box plots of raw GC-
MS data, GC-MS data after missing values ratio and after natural logarithm technique respectively. Figure 5(a) shows that only 4 samples (HD, LA, MS and R5) had third and fourth quartile. Therefore, HD, LA, MS and R5 have50% of their data points between 0.01 and 0.99, 0.05, 0.1 and 0.3 respectively. In other samples, their data points were shown as outliers. All samples had a median of 0.01. Figure 5(b) reveals that only EO4

JOURNAL OF ELECTRICAL AND ELECTRONIC SYSTEMS RESEARCH. VOL. 17 DEC 2020
55
had no inter quartile range (IQR) after eliminating the compounds that have missing values equal to or greater than 72%.The medians of CKE, EO2, EO3, HD, R5, RG and T were equivalent to 0.01. Therefore, about 50% of the data points are above 0.01. The medians of other samples ranged from 0.05 to 0.3. It means that between this range lie 50% of the data points. The samples with outliers were CKE, CM, EO2, EO3, EO4, HD, LG, M and R5. Compared to the raw GC-MS data, the number of outliers decreases significantly. The range of second and third quartile, and the maximum value increased after the computing of the natural logarithm technique. In comparison to the Fig. 5(c) (data after the missing values ratio), only EO4, HD and R5 had outliers and the samples with a median of approximately 0.01 were still the same. All samples, except EO4, are right skewed. EO4 is the only sample that has not greatly improved in term of normal distribution.
(a)
(b)
(c)
Fig. 5: (d) Box plot of GC-MS raw data; (e) Box plot after the missing values ratio technique; (f) Box plot after natural logarithm transformation
Table III displays the p-values of Shapiro-Wilk normality test for each samples of Agarwood oil from raw GC-MS data, data after missing values ratio and after natural logarithm. The p-values of all samples were smaller than the selected alpha level (0.05) for raw GC-MS data. Therefore with 95% confidence, these data are not normally distributed. There was some improvement in p-values for HG, JBD, KB, MA, MA1, MA2, MN, MNS, MPE and MS after missing values ratio. JBD was the sample with the highest p-value (0.008). Even with some improvement in p-values, data are still not normal distributed. After natural logarithm transformation, the p-values increased for all samples except CKE, EO2, EO4, HD, LG, R5, RG and T. MN had the highest p-value which is 0.015. The p-values of JBD, MA, MA2, MN and MNS were between 0.012 and 0.015. Even with the improvement of p-value, the data are still not normal distributed. It was found that using the technique of z-score and the Artificial Neural Network, JBD and MA1 belong to high quality oil and CKE, HD and R5 belong to low quality oil[10, 42]. In this study, CKE, HD and R5 have smaller p-value than JBD and MA1.
TABLE III
P-VALUES OF SHAPIRO-WILK NORMALITY TEST FOR AGARWOOD OIL SAMPLES
Sample
p-Value
Raw GC-MS
Data
Data after
Missing Values Ratio
Data after Natural
Logarithm Transformation
CKE 0.000 0.000 0.000
CM 0.000 0.000 0.001
EO2 0.000 0.000 0.000
EO3 0.000 0.000 0.001
EO4 0.000 0.000 0.000
HD 0.000 0.000 0.000
HG 0.000 0.002 0.001
JBD 0.000 0.008 0.012
KB 0.000 0.003 0.005
LA 0.000 0.000 0.001
LG 0.000 0.000 0.000
M 0.000 0.000 0.001
MA 0.000 0.001 0.012
MA1 0.000 0.004 0.006
MA2 0.000 0.004 0.012
MN 0.000 0.004 0.015
MNS 0.000 0.006 0.013
MPE 0.000 0.002 0.006
MS 0.000 0.002 0.008
R5 0.000 0.000 0.000
RG 0.000 0.000 0.000
T 0.000 0.000 0.000

Abdullah et.al.: Designation of Thorax and Non-Thorax Regions for Lung Cancer Detection in CT Scan Images using Deep Learning
56
B. Determination of Substantial Compounds Table IV shows the values of KMO and Bartlett’s test before
performing the PCA. The KMO value for original samples (22 samples) was only 0.248. The KMO value increased to 0.358 with 220 samples (original + synthetic) but was still below the accepted value (0.50). With 440 samples (original + synthetic), the KMO value increased to 0.442 but was still below the accepted value. The KMO value was greater than 0.50 (accepted value) when the total number of original and synthetic samples was 660. The 660 samples are therefore sufficient to run the PCA. In Bartlett’s Test, the p-value for all numbers of samples is less than 0.05 and thus, suggests that PCA may be useful with this data.
TABLE IV
INDEX OF KMO AND SIGNIFICANT VALUE OF BARTLETT’S TEST KMO and Bartlett’s Test for 22 Samples (Original Samples)
KMO Test (Measure of Sampling Adequacy) 0.248
Bartlett’s Test (Significant Value) 0.000
KMO and Bartlett’s Test for 220 Samples
KMO Test (Measure of Sampling Adequacy) 0.358
Bartlett’s Test (Significant Value) 0.000
KMO and Bartlett’s Test for 440 Samples
KMO Test (Measure of Sampling Adequacy) 0.442
Bartlett’s Test (Significant Value) 0.000
KMO and Bartlett’s Test for 660 Samples
KMO Test (Measure of Sampling Adequacy) 0.510
Bartlett’s Test (Significant Value) 0.000
Table V shows the eigen values of 20 principle components.
PC1 until PC6 has eigen values greater than 1. In term of proportion, Both PC1 and PC2 have proportion of variance greater than 20%. These 2 PCs account for almost 42% of the variance explained.
TABLE V
EIGENVALUES OF PRINCIPLE COMPONENTS
PC Eigenvalues Variance (%) Cumulative of Variance (%)
1 4.10 21.59 21.59
2 3.81 20.06 41.65
3 2.55 13.43 55.08
4 1.57 8.27 63.35
5 1.49 7.86 71.21
6 1.39 7.34 78.55
7 0.87 4.59 83.14
8 0.65 3.43 86.57
9 0.55 2.88 89.45
10 0.50 2.63 92.08
11 0.37 1.94 94.02
12 0.26 1.34 95.36
13 0.23 1.19 96.56
14 0.20 1.06 97.62
15 0.17 0.92 98.54
16 0.12 0.61 99.14
17 0.07 0.36 99.51
18 0.05 0.29 99.79
19 0.04 0.21 100.00
20 4.10 21.59 21.59
Figure 6 shows the Scree plot. There is a sharp decline (see
first elbow) and a large gap between PC2 and PC3in eigen values [31]. Because of this, only two main components (PC1 and PC2) are considered to be significant.
Fig. 6: Scree Plot using Eigenvalues
Table VI shows the correlation coefficients of chemical compounds for PC1 and PC2. There are 11 out of 20 chemical compounds listed in either PC1 or PC2 that have a moderate and very strong correlation (r ≥ 0.6)[33]. Their correlation coefficient varies from 0.61 to 0.81. The names of the 11 compounds are α-guaiene, β-agarofuran, ar-curcumene, β-dihydroagarofuran, φ-cadinene, α-agarofuran, 10-epi-φ-eudesmol, φ-eudesmol, alloaromadendrene epoxide, valerianol and dihydrocollumellarin.
TABLE VI
CORRELATION COEFFICIENT OF CHEMICAL COMPOUNDS IN PC1 AND PC2 AFTER ROTATION USING VARIMAX Compounds r-PC1 r-PC2
4-phenyl-2-butanone -0.0667 -0.4514
α-gurjunene 0.2045 0.2059
α -guaiene -0.0586 -0.6130
aromadendrane -0.3897 0.1299
φ -gurjunene -0.0107 -0.0444
β-agarofuran -0.6725 -0.0295
ar-curcumene 0.3074 -0.6180
α -muurolene 0.5167 -0.5856
β -dihydro agarofuran -0.3028 -0.6708
φ -cadinene 0.7981 -0.0880
α –agarofuran -0.8137 -0.1860
Elemol 0.3899 0.2867
10-epi- φ –eudesmol -0.6667 -0.1581
φ –eudesmol 0.2144 -0.7562
alloaromadendrene epoxide 0.2465 -0.6406
first elbow

JOURNAL OF ELECTRICAL AND ELECTRONIC SYSTEMS RESEARCH. VOL. 17 DEC 2020
57
α –eudesmol 0.5776 0.1675
Valerianol -0.7311 0.1317
hexadecanoic acid -0.2335 -0.3337
Thujopsenal -0.0634 -0.1809
Dihydrocollumellarin -0.0534 -0.7604
Table VII shows the Pearson’s correlation coefficients for the
11 significant chemical compounds after PCA. There were 3 pairs of compounds with a correlation coefficient greater than or equal to 0.60 and the pairs are β-agarofuran and α-agarofuran, β-agarofuran and 10-epi-γ-eudesmol, andα-agarofuran and 10-epi-γ-eudesmol. All of these pairs had apositive correlation and are therefore proportional to each other. These compounds are consistent with the significant compounds mentionedin the literature [1, 3, 5, 9, 10, 15].Some pairs such as α-guaiene and γ-cadinene, α-guaiene and valerianol, γ-cadinene and dihydrocollumellarin, and valerianol and dihydrocollumellarin have a correlation coefficient less than 0.1. It indicates that they are not correlated to each other. From these pairs, only valerianol and dihydrocollumellarin have a negative correlation. These two compounds are inversely proportional to each other.
TABLE VII
PEARSON’S CORRELATION COEFFICIENTS OF SIGNIFICANT CHEMICAL COMPOUNDS
α-guaiene β-agarofuran ar-curcumene
α-guaiene 1.0000 0.0041 0.2520
β-agarofuran 0.0041 1.0000 -0.3000
ar-curcumene 0.2520 -0.3000 1.0000
β -dihydro agarofuran 0.4705 0.0527 0.3261
γ-cadinene 0.0613 -0.4262 0.3769
α –agarofuran 0.0445 0.6767 -0.1474
10-epi- φ –eudesmol 0.2319 0.6263 0.0380
φ –eudesmol 0.4921 0.0095 0.4743
alloaromadendrene epoxide 0.4442 -0.1230 0.3100
Valerianol 0.0740 0.5088 -0.3213
Dihydrocollumellarin 0.2972 0.1177 0.5155
β -dihydro agarofuran γ-cadinene α –
agarofuran
α-guaiene 0.4705 0.0613 0.044
β-agarofuran 0.0527 -0.4262 0.677
ar-curcumene 0.3261 0.3769 -0.147
β -dihydro agarofuran 1.0000 -0.2215 0.290
γ-cadinene -0.2215 1.0000 -0.573
α –agarofuran 0.2899 -0.5725 1.000
10-epi- φ –eudesmol 0.2042 -0.2661 0.741
φ –eudesmol 0.4326 0.1720 0.017
alloaromadendrene epoxide 0.4604 0.1807 -0.062
Valerianol 0.0350 -0.4130 0.592
Dihydrocollumellarin 0.3287 0.0248 0.172
10-epi- φ -eudesmol
φ -eudesmol
alloaromadendrene epoxide
α-guaiene 0.232 0.492 0.444
β-agarofuran 0.626 0.009 -0.123
ar-curcumene 0.038 0.474 0.310
β -dihydro agarofuran 0.204 0.433 0.460
γ-cadinene -0.266 0.172 0.181
α -agarofuran 0.741 0.017 -0.062
10-epi- φ -eudesmol 1.000 0.052 -0.128
φ -eudesmol 0.052 1.000 0.339 alloaromadendrene
epoxide -0.128 0.339 1.000
Valerianol 0.484 -0.395 -0.206
dihydrocollumellarin 0.039 0.389 0.435
valerianol dihydrocollumellarin
α-guaiene 0.074 0.297
β-agarofuran 0.509 0.118
ar-curcumene -0.321 0.515
β -dihydro agarofuran 0.035 0.329
γ-cadinene -0.413 0.025
α -agarofuran 0.592 0.172
10-epi- φ -eudesmol 0.484 0.039
φ -eudesmol -0.395 0.389
alloaromadendrene epoxide -0.206 0.435
valerianol 1.000 -0.021
dihydrocollumellarin -0.021 1.000
IV. CONCLUSION
In conclusion, the approach combining missing values ratio, PCA and Pearson’s correlation is capable of determining the substantial chemical compounds. Three moderate and strong correlated compounds have been identified from 104 compounds and they are β-agarofuran, α-agarofuran and 10-epi-γ-eudesmol. These compounds are consistent with the list of major compounds described in the literature [1, 3, 5, 9, 10, 15]. They are substantial in determining the quality of Agarwood oil [1, 3, 5, 9, 10, 15]. For future work, these compounds can be used in identifying the grades of Agarwood oil using artificial intelligence technique due to the facts that β-agarofuran, α-agarofuran and 10-epi-γ-eudesmol can be found in high quality oil [1, 3, 5, 9, 10, 15]. In the case of none correlated compounds, a further analysis should be carried out to determine if they can be significant in the determination of Agarwood oil grades.
ACKNOWLEDGMENT The author would like to thank the division of Natural
Product of Forest Research Institute Malaysia (FRIM) and Industries Centre of Excellent (Biotechnology) ofUniversiti Malaysia Pahang (UMP) in providing the data used in this study.

Abdullah et.al.: Designation of Thorax and Non-Thorax Regions for Lung Cancer Detection in CT Scan Images using Deep Learning
58
REFERENCES [1] M. N. Azah, N. Ismail, J. Mailina, M. Taib, M. Rahiman, and Z. M.
Hafizi, "Chemometric Study of Selected Agarwood Oils by Gas Chromatography-Mass Spectrometry," Journal of Tropical Forest Science, pp. 382-388, 2014.
[2] R. Mohamed, P. L. Jong, and A. K. Kamziah, "Fungal Inoculation Induces Agarwood in Young Aquilaria Malaccensis Trees in the Nursery," Journal of forestry research, vol. 25, no. 1, pp. 201-204, 2014.
[3] N. Ismail, N. A. M. Ali, M. Jamil, M. H. F. Rahiman, S. N. Tajuddin, and M. N. Taib, "A Review Study of Agarwood Oil and Its Quality Analysis," Jurnal Teknologi, vol. 68, no. 1, 2014.
[4] D. T. Ahmaed, A. M. M. Masaad, and S. N. T. Tajuddin, "Identification of Agarwood (Aquilaria Malaccensis) Chips Incense Smoke and Headspace Volatile Compounds by GC-MS. EI. Q. TOF, SPME," Malaysian Journal of Chemistry (MJChem), vol. 20, no. 2, pp. 154-162, 2018.
[5] S. N. Ismail et al., "Discriminative Analysis of Different Grades of Gaharu (Aquilaria malaccensis Lamk.) via 1H-NMR-Based Metabolomics Using PLS-DA and Random Forests Classification Models," Molecules, vol. 22, no. 10, p. 1612, 2017.
[6] G. T. Pasaribu, T. K. Waluyo, and G. Pari, "Analysis of Chemical Compounds Distinguisher for Agarwood Qualities," Indonesian Journal of Forestry Research, vol. 2, no. 1, pp. 1-7, 2016.
[7] M. H. Haron, M. N. Taib, N. Ismail, N. A. M. Ali, and S. N. Tajuddin, "Statistical Analysis of Agarwood Oil Compounds based on GC-MS Data," in 2018 9th IEEE Control and System Graduate Research Colloquium (ICSGRC), 2018, pp. 27-30: IEEE.
[8] M. N. Azah, N. Ismail, J. Mailina, M. Taib, M. Rahiman, and Z. M. Hafizi, "Chemometric Study of Selected Agarwood Oils by Gas Chromatography—Mass Spectrometry," Journal of Tropical Forest Science, pp. 382-388, 2014.
[9] N. Ismail, N. A. M. Ali, M. Jamil, M. H. F. Rahiman, S. N. Tajuddin, and M. N. Taib, "Differentiating Agarwood Oil Quality Using Artificial Neural Network," Malaysian Journal of Analytical Sciences,, vol. 17, no. 3, pp. 490-498, 2013.
[10] N. Ismail, M. A. N. Azah, M. Jamil, M. H. F. Rahiman, S. N. Tajuddin, and M. N. Taib, "Analysis of High Quality Agarwood Oil Chemical Compounds by Means of SPME/GC-MS and Z-Score Technique," Malaysian Journal of Analytical Sciences, vol. 17, no. 3, pp. 403-413, 2013.
[11] M. Ishihara, T. Tsuneya, and K. Uneyama, "Components of the Agarwood Smoke on Heating," Journal of Essential Oil Research, vol. 5, no. 4, pp. 419-423, 1993.
[12] M. Nor Azah, Y. Chang, J. Mailina, S. Saidatul Husni, H. Nor Hasnida, and Y. Nik Yasmin, "Comparison of Chemical Profiles of Selected Gaharu Oils from Peninsular Malaysia," Malaysian Journal of Analytical Sciences, vol. 12, no. 2, pp. 338-340, 2008.
[13] R. Naef, "The Volatile and Semi-Volatile Constituents of Agarwood, the Infected Heartwood of Aquilaria Species: A Review," Flavour and Fragrance Journal, vol. 26, no. 2, pp. 73-87, 2011.
[14] E. H. A. Latib, M. S. Najib, C. M. A. C. Mohd, and S. N. Tajuddin, "Analysis of Different Quality Agarwood Oil (Aquilaria Malaccensis) and Sensory Study," Journal of Telecommunication, Electronic and Computer Engineering (JTEC), vol. 10, no. 1-3, pp. 57-61, 2018.
[15] N. Ismail, N. A. M. Ali, M. Jamil, M. H. F. Rahiman, M. N. Taib, and S. N. Tajuddin, "Major Volatile Chemical Compounds of Agarwood Oils from Malaysia Based on Z-Score Technique," Chemistry of Natural Compounds, vol. 51, no. 4, pp. 776-779, 2015.
[16] N. C. Radzi et al., "Analysis of Sesquiterpenes in Agarwood Essential Oil from Hhydrodistillation Process," Malaysian Journal of Analytical Sciences, vol. 22, no. 2, pp. 353-357, 2018.
[17] P. D. Asanka and A. S. Perera, "Defining Fuzzy Membership Function using Box Plot," International Journal of Research in Computer Applications and Robotics, vol. 5, no. 11, pp. 1-10, 2017.
[18] M. Hubert and E. Vandervieren, "An Adjusted Boxplot for Skewed Distributions," Computational Statistics and Data Analysis, vol. 52, no. 12, pp. 5186-5201, 2008.
[19] J. E. V. Ferreira, M. T. S. Pinheiro, W. R. S. dos Santos, and R. d. S. Maia, "Graphical Representation of Chemical Periodicity of Main Elements through Boxplot," Educación química, vol. 27, no. 3, pp. 209-216, 2016.
[20] E. Acuna and C. Rodriguez, "The Treatment of Missing Values and its Effect on Classifier Accuracy," in Classification, Clustering, and Data Mining ApplicationsBerlin: Springer, 2004, pp. 639-647.
[21] S. Rawal, D. S. Gupta, and M. S. Singh, "Predicting Missing Values in a Dataset: Challenges and Approaches," International Journal of Recent Research Aspects, vol. 4, no. 3, pp. 34-38, 2017.
[22] J. W. Osborne, "Improving Your Data Transformations: Applying the Box-Cox Transformation," Practical Assessment, Research & Evaluation, vol. 15, no. 12, pp. 1-9, 2010.
[23] J. Osborne, "Notes on the use of Data Transformations," Practical Assessment, Research and Evaluation, vol. 9, no. 1, pp. 42-50, 2005.
[24] F. Zhang, I. Keivanloo, and Y. Zou, "Data Transformation in Cross-Project Defect Prediction," Empirical Software Engineering, vol. 22, no. 6, pp. 3186-3218, 2017.
[25] K. R. Das and A. Imon, "A Brief Review of Tests for Normality," American Journal of Theoretical and Applied Statistics, vol. 5, no. 1, pp. 5-12, 2016.
[26] G. Albuquerque, T. Lowe, and M. Magnor, "Synthetic Generation of High-Dimensional Datasets," IEEE Transactions on Visualization and Computer Graphics, vol. 17, no. 12, pp. 2317-2324, 2011.
[27] B. Williams, A. Onsman, and T. Brown, "Exploratory factor analysis: A five-step guide for novices," Australasian Journal of Paramedicine, vol. 8, no. 3, 2010.
[28] B. Xia et al., "Using Self Organizing Maps to Achieve Lithium-Ion Battery Cells Multi-Parameter Sorting Based on Principle Components Analysis," Energies, vol. 12, no. 15, p. 2980, 2019.
[29] G. R. Naik, S. E. Selvan, M. Gobbo, A. Acharyya, and H. T. Nguyen, "Principal Component Analysis Applied to Surface Electromyography: A Comprehensive Review," IEEE Access, vol. 4, pp. 4025-4037, 2016.
[30] S. Sen, N. C. Talukdar, and M. Khan, "A Simple Metabolite Profiling Approach Reveals Critical Biomolecular Linkages in Fragrant Agarwood Oil Production from Aquilaria Malaccensis–A Traditional Agro-Based Industry in Northeast India," Curr. Sci, vol. 108, no. 1, pp. 63-71, 2015.
[31] R. D. Ledesma, P. Valero-Mora, and G. Macbeth, "The Scree Test and The Number of Factors: A Dynamic Graphics Approach," The Spanish journal of psychology, vol. 18, 2015.
[32] N. Akhtar-Danesh, "A Comparison between Major Factor Extraction and Factor Rotation Techniques in Q-Methodology," Open Journal of Applied Sciences, vol. 7, no. 04, p. 147, 2017.
[33] H. Akoglu, "User's Guide to Correlation Coefficients," Turkish journal of emergency medicine, vol. 18, no. 3, pp. 91-93, 2018.
[34] Y. K. Jain and S. K. Bhandare, "Min Max Normalization based Data Perturbation Method for Privacy Protection," International Journal of Computer & Communication Technology, vol. 2, no. 8, pp. 45-50, 2011.
[35] K. Potter, H. Hagen, A. Kerren, and P. Dannenmann, "Methods For Presenting Statistical Information: The Box Plot," Visualization of Large and Unstructured Data Sets, s, vol. 4, pp. 97-106, 2006.
[36] B. Guner, M. T. Frankford, and J. T. Johnson, "A Study of The Shapiro–Wilk Test for The Detection of Pulsed Sinusoidal Radio Frequency Interference," Geoscience and Remote Sensing, IEEE Transactions on, vol. 47, no. 6, pp. 1745-1751, 2009.
[37] M. Mendes and A. Pala, "Type I Error Rate and Power of Three Normality Tests," Pakistan Journal of Information and Technology, vol. 2, no. 2, pp. 135-139, 2003.
[38] M. Üzümcü, A. F. Frangi, J. H. Reiber, and B. P. Lelieveldt, "Independent Component Analysis in Statistical Shape Models," 2003, vol. 5032, pp. 375–383: Citeseer.
[39] C. Buciluǎ, R. Caruana, and A. Niculescu-Mizil, "Model Compression," in Proceedings of the 12th ACM SIGKDD international conference on Knowledge discovery and data mining, 2006, pp. 535-541: ACM.
[40] T. Lindgren, "Model Based Sampling-Fitting an Ensemble of Models into a Single Model," in Computational Science and Computational Intelligence (CSCI), 2015, pp. 186-191: IEEE.
[41] V. Soni and R. Joshi, "A Novel Dimension Reduction Technique Based on Correlation Coefficient," International Journal Of Scientific And Technology Research, vol. 1, pp. 122-124, 2012.
[42] N. Ismail, N. A. M. Ali, M. Jamil, M. H. F. Rahiman, S. N. Tajuddin, and M. N. Taib, "Differentiating Agarwood Oil Quality Using Artificial Neural Network," Malaysian Journal of Analytical Sciences,, vol. 17, no. 3, pp. 490-8, 2013.

JOURNAL OF ELECTRICAL AND ELECTRONIC SYSTEMS RESEARCH. VOL. 17 DEC 2020
59
Mohamad Hushnie Haron received the M.Sc degree in Electrical Engineering from Universiti Teknologi MARA, Shah Alam, Malaysia, in 2015 and is currently pursuing PhD degree in Electrical Engineering at Universiti Teknologi MARA, Shah Alam, Malaysia. His current research interests are system identification and electronics.
Prof. Ir. Dr. Mohd Nasir Taib received the PhD degree in Instrumentation from University of Manchester Institute of Science and Technology, United Kingdom. He is currently a professor at the Faculty of Electrical Engineering, Universiti Teknologi MARA ,Shah Alam, Malaysia. His current research interests are control systems and instrumentation.
Ir. Dr. Nurlaila Ismail received PhD degree in Electrical Engineering from Universiti Teknologi MARA, Shah Alam, Malaysia in 2015. She is currently a senior lecturer at UniversitiTeknologi MARA, Shah Alam, Malaysia. Her current research interests are artificial intelligence and system identification.
Dr. NorAzah Mohd Ali received the PhD degree from Universiti Putra Malaysia, Serdang, Malaysia in 2004. She is currently a senior research officer and Head of Herbal Product Development Programme at Forest Research Institute Malaysia, Kepong, Malaysia. Her current research interests are natural product chemistry, essential oil analysis and processing, and cosmetic formulation and product development.
Assoc. Prof. Saiful Nizam Tajuddin received the PhD degree in Industrial Chemistry from Universiti Malaysia Pahang, Pekan, Malaysia in 2011. He is currently an associate professor and Head of Industries Centre of Excellent- Biotechnology at Universiti Malaysia Pahang, Pekan, Malaysia. His current research interest is perfumery chemistry.