Determination of shear magnification factor in beams and ... · Determination of shear...
12
Determination of shear magnification factor in beams and plates subjected to blast loads F. Qin, G. Dong & X. Hengbo Department of Civil Engineering, Nanjing Engineering Institute, China Abstract In this paper, the dynamic shear force in beams and plates in the range of elastic response is firstly analysed analytically. Then the widely used simplified analytical method proposed by Biggs [1] for the dynamic shear force is evaluated and its computational accuracy is presented. Finally, the shear magnification factor (SMF) of a beam in the range of elastic response is given analytically, and the effects of the ratio of depth to span and elastic-plastic deformation on the shear force are analysed by the Timoshenko beam theory and nonlinear finite element procedure respectively. Keywords: shear magnification factor, Biggs method, beam, plate, blast load. 1 Introduction The response of shear force in reinforced concrete (RC) structures subjected to blast loads is quite complicate and different from the behavior under the static load. There are great differences between the actual shear forces of the structures and those predicted by the equivalent single degree of freedom method, as the influence of high-frequency responses has been neglected. In some cases, these differences may result in failure modes of the structures completely differing from those predicted in design. Therefore, the appropriate prediction of the dynamic shear forces in blast-loaded RC structures is very important in blast- resistant design. The simplified analytical method proposed by Biggs [1] for the dynamic shear force is widely used. However, the computational accuracy and applicability of Biggs method have not been investigated intensively. In this paper, the dynamic shear force in beams and plates is predicted analytically and numerically. The widely used simplified analytical method proposed by Biggs [1] is evaluated and the shear magnification factors are given. Structures Under Shock and Impact VIII, N. Jones & C. A. Brebbia (Editors) © 2004 WIT Press, www.witpress.com, ISBN 1-85312-706-X Structures Under Shock and Impact VIII, N. Jones & C. A. Brebbia (Editors) © 2004 WIT Press, www.witpress.com, ISBN 1-85312-706-X
Transcript of Determination of shear magnification factor in beams and ... · Determination of shear...
Determination of shear magnification factor in beams and plates subjected to blast loads
F. Qin, G. Dong & X. Hengbo Department of Civil Engineering, Nanjing Engineering Institute, China
Abstract
In this paper, the dynamic shear force in beams and plates in the range of elastic response is firstly analysed analytically. Then the widely used simplified analytical method proposed by Biggs [1] for the dynamic shear force is evaluated and its computational accuracy is presented. Finally, the shear magnification factor (SMF) of a beam in the range of elastic response is given analytically, and the effects of the ratio of depth to span and elastic-plastic deformation on the shear force are analysed by the Timoshenko beam theory and nonlinear finite element procedure respectively. Keywords: shear magnification factor, Biggs method, beam, plate, blast load.
1 Introduction
The response of shear force in reinforced concrete (RC) structures subjected to blast loads is quite complicate and different from the behavior under the static load. There are great differences between the actual shear forces of the structures and those predicted by the equivalent single degree of freedom method, as the influence of high-frequency responses has been neglected. In some cases, these differences may result in failure modes of the structures completely differing from those predicted in design. Therefore, the appropriate prediction of the dynamic shear forces in blast-loaded RC structures is very important in blast-resistant design. The simplified analytical method proposed by Biggs [1] for the dynamic shear force is widely used. However, the computational accuracy and applicability of Biggs method have not been investigated intensively. In this paper, the dynamic shear force in beams and plates is predicted analytically and numerically. The widely used simplified analytical method proposed by Biggs [1] is evaluated and the shear magnification factors are given.
Structures Under Shock and Impact VIII, N. Jones & C. A. Brebbia (Editors)© 2004 WIT Press, www.witpress.com, ISBN 1-85312-706-XStructures Under Shock and Impact VIII, N. Jones & C. A. Brebbia (Editors)© 2004 WIT Press, www.witpress.com, ISBN 1-85312-706-X

2 Computational accuracy of the Biggs simplified analytical method
2.1 Brief introduction to Biggs method
The simplified method for the prediction of dynamic shear force proposed by Biggs assumes that the shape of the distribution of the inertia force is similar to the deflected shape. Therefore, the end reaction of the beam can be determined by the external load )(tF and the total inertia force )(tI . For a simply supported, uniformly loaded beam, the dynamic end reaction can be rewritten as follows:
FRV 11.039.0 += . (1) where R is the resistance of the beam. Eqn (1) shows that the end reaction is related with the internal resistance and external load. In the same procedure, the equations for the end reactions of beams with different types of loads and boundary conditions can be obtained. The details may be found in [1].
2.2 Evaluation on computational accuracy of Biggs method
2.2.1 Beam The simply supported beams subjected to the triangular load with zero rise time and ramp load are taken as examples owing to the length limitation of the paper. The shear force ),( txQ can be obtained by the model superposition method and expressed as follows: For the simply supported, uniformly loaded beam:
∑∞
=
∆=
12
2
3
2
cos)(4),(n n
m
lxntKn
mlpEItxQ π
ωπ
( n=1,3,5……) . (2)
For the simply supported, concentrated loaded beam:
∑∞
=
=1
2
3
41
3
cos)(2
sin2),(n n l
xntKnnml
EIFtxQ ππω
π. (3)
where nω is the frequency of the beam, mp∆ and 1F denote the intensities of the
uniform and concentrated loads respectively, dt is the duration of the triangular
load, rt is the rise time of the ramp load, EI is the flexural rigidity of the beam, m is the mass per unit length of the beam, l is the span of the beam. )(tK is the displacement magnification factor and can be easily found in textbooks. In the same way, the shear force in the fixed-end beam under the triangular load with zero rise time and ramp load can be obtained. It is assumed that the basic frequency of the beam ranges between 100s-1 and 700s-1, and the duration of the triangular load or the rise time of the ramp load range between 1ms and 50ms. The maximum shear force is calculated and shown
Structures Under Shock and Impact VIII, N. Jones & C. A. Brebbia (Editors)© 2004 WIT Press, www.witpress.com, ISBN 1-85312-706-XStructures Under Shock and Impact VIII, N. Jones & C. A. Brebbia (Editors)© 2004 WIT Press, www.witpress.com, ISBN 1-85312-706-X
140 Structures Under Shock and Impact VIII
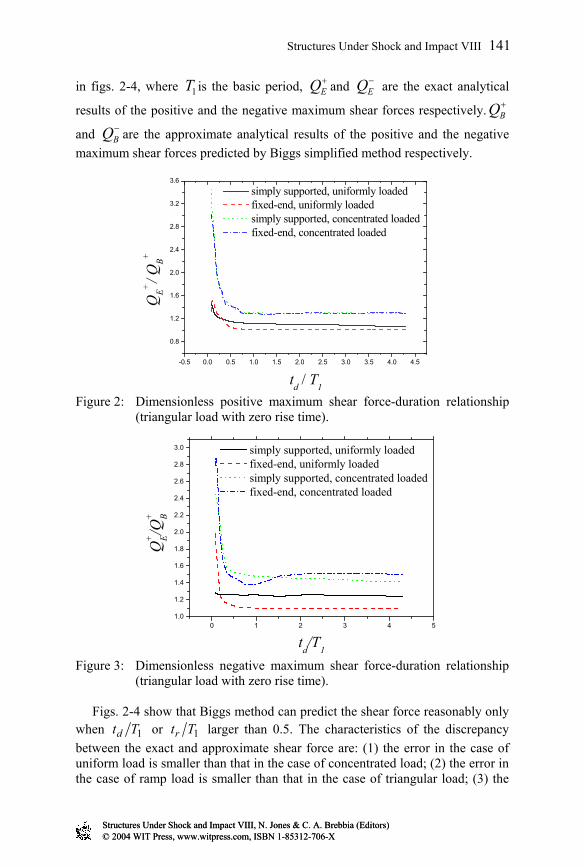
in figs. 2-4, where 1T is the basic period, +EQ and −
EQ are the exact analytical
results of the positive and the negative maximum shear forces respectively. +BQ
and −BQ are the approximate analytical results of the positive and the negative
maximum shear forces predicted by Biggs simplified method respectively.
-0.5 0.0 0.5 1.0 1.5 2.0 2.5 3.0 3.5 4.0 4.5
0.8
1.2
1.6
2.0
2.4
2.8
3.2
3.6
simply supported, uniformly loaded fixed-end, uniformly loaded simply supported, concentrated loaded fixed-end, concentrated loaded
QE+
/ QB+
td / T1 Figure 2: Dimensionless positive maximum shear force-duration relationship
(triangular load with zero rise time).
0 1 2 3 4 51.0
1.2
1.4
1.6
1.8
2.0
2.2
2.4
2.6
2.8
3.0
Q+ E/Q
+ B
td/T1
simply supported, uniformly loaded fixed-end, uniformly loaded simply supported, concentrated loaded fixed-end, concentrated loaded
Figure 3: Dimensionless negative maximum shear force-duration relationship
(triangular load with zero rise time).
Figs. 2-4 show that Biggs method can predict the shear force reasonably only when 1Ttd or 1Ttr larger than 0.5. The characteristics of the discrepancy between the exact and approximate shear force are: (1) the error in the case of uniform load is smaller than that in the case of concentrated load; (2) the error in the case of ramp load is smaller than that in the case of triangular load; (3) the
Structures Under Shock and Impact VIII, N. Jones & C. A. Brebbia (Editors)© 2004 WIT Press, www.witpress.com, ISBN 1-85312-706-XStructures Under Shock and Impact VIII, N. Jones & C. A. Brebbia (Editors)© 2004 WIT Press, www.witpress.com, ISBN 1-85312-706-X
Structures Under Shock and Impact VIII 141

error of the positive maximum shear force is smaller than the negative one; (4) the error decreases with increasing 1Ttd or 1Ttr ; (5) the effect of the boundary conditions of beams on the error may be neglected.
-0.5 0.0 0.5 1.0 1.5 2.0 2.5 3.0 3.5 4.0 4.5
0.90
0.93
0.96
0.99
1.02
1.05
1.08
1.11
1.14
simply supported, uniformly loaded fixed-end, uniformly loaded simply supported, concentrated loaded fixed-end, concentrated loaded
QE+
/QB+
tr / T1 Figure 4: Dimensionless positive maximum shear force-rise time relationship
(ramp load).
0 1 2 3 4 5 6 7 8 9 101.0
1.2
1.4
1.6
1.8
2.0
2.2
2.4
2.6
QK
+/ Q
B+
td / T1
long side (a/b=0.5) long side (a/b=1.0) short side (a/b=0.5) short side (a/b=1.0)
Figure 5: Dimensionless positive maximum shear force-duration relationship (triangular load with zero rise time).
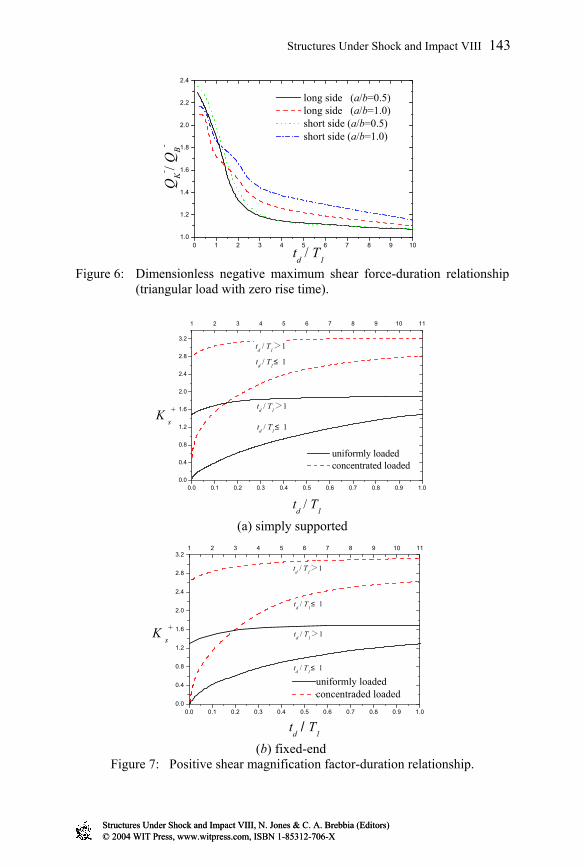
2.2.2 Plate Owing to the length limitation of the paper, only the shear force of the simply supported plate is given here, as shown in figs. 5-6. In figs. 5-6, +
KQ and −KQ
are the exact analytical results of the positive and the negative maximum shear forces, respectively. The similar characteristics of the discrepancy between the exact and approximate shear force with the beam are observed and the errors of +
BQ and −BQ in the short side are larger than that in the long side.
Structures Under Shock and Impact VIII, N. Jones & C. A. Brebbia (Editors)© 2004 WIT Press, www.witpress.com, ISBN 1-85312-706-XStructures Under Shock and Impact VIII, N. Jones & C. A. Brebbia (Editors)© 2004 WIT Press, www.witpress.com, ISBN 1-85312-706-X
142 Structures Under Shock and Impact VIII
0 1 2 3 4 5 6 7 8 9 101.0
1.2
1.4
1.6
1.8
2.0
2.2
2.4
QK
- / QB-
td / T1
long side (a/b=0.5) long side (a/b=1.0) short side (a/b=0.5) short side (a/b=1.0)
Figure 6: Dimensionless negative maximum shear force-duration relationship
(triangular load with zero rise time).
0.0 0.1 0.2 0.3 0.4 0.5 0.6 0.7 0.8 0.9 1.00.0
0.4
0.8
1.2
1.6
2.0
2.4
2.8
3.2
1 2 3 4 5 6 7 8 9 10 11
uniformly loaded concentrated loaded
td / T1>1
td / T1≤ 1
td / T1≤ 1
td / T1>1K s
+
td / T1 (a) simply supported
0.0 0.1 0.2 0.3 0.4 0.5 0.6 0.7 0.8 0.9 1.00.0
0.4
0.8
1.2
1.6
2.0
2.4
2.8
3.21 2 3 4 5 6 7 8 9 10 11
td / T
1>1
td / T
1>1
K s+
td / T1
td / T
1≤ 1
uniformly loadedconcentraded loaded
td / T1≤ 1
(b) fixed-end
Figure 7: Positive shear magnification factor-duration relationship.
Structures Under Shock and Impact VIII, N. Jones & C. A. Brebbia (Editors)© 2004 WIT Press, www.witpress.com, ISBN 1-85312-706-XStructures Under Shock and Impact VIII, N. Jones & C. A. Brebbia (Editors)© 2004 WIT Press, www.witpress.com, ISBN 1-85312-706-X
Structures Under Shock and Impact VIII 143
0.0 0.1 0.2 0.3 0.4 0.5 0.6 0.7 0.8 0.9 1.00.0
0.4
0.8
1.2
1.6
2.0
2.4
1 2 3 4 5 6 7 8 9 10 11
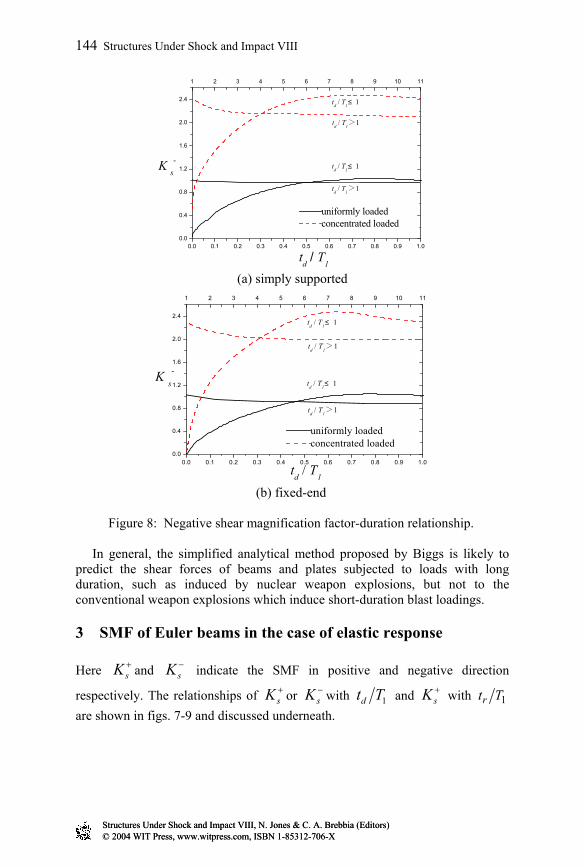
K s-
td / T1
uniformly loadedconcentrated loaded
td / T
1≤ 1
td / T1>1
td / T1≤ 1
td / T1>1
(a) simply supported
0.0 0.1 0.2 0.3 0.4 0.5 0.6 0.7 0.8 0.9 1.00.0
0.4
0.8
1.2
1.6
2.0
2.4
1 2 3 4 5 6 7 8 9 10 11
K s-
td / T1
uniformly loadedconcentrated loaded
td / T1>1
td / T1≤ 1
td / T1>1
td / T1≤ 1
(b) fixed-end
Figure 8: Negative shear magnification factor-duration relationship.
In general, the simplified analytical method proposed by Biggs is likely to predict the shear forces of beams and plates subjected to loads with long duration, such as induced by nuclear weapon explosions, but not to the conventional weapon explosions which induce short-duration blast loadings.
3 SMF of Euler beams in the case of elastic response
Here +sK and −
sK indicate the SMF in positive and negative direction
respectively. The relationships of +sK or −
sK with 1Ttd and +sK with 1Ttr
are shown in figs. 7-9 and discussed underneath.
Structures Under Shock and Impact VIII, N. Jones & C. A. Brebbia (Editors)© 2004 WIT Press, www.witpress.com, ISBN 1-85312-706-XStructures Under Shock and Impact VIII, N. Jones & C. A. Brebbia (Editors)© 2004 WIT Press, www.witpress.com, ISBN 1-85312-706-X
144 Structures Under Shock and Impact VIII

1 2 3 4 5 6 7 8 9 10 110.8
1.0
1.2
1.4
1.6
1.8
2.0
2.2
2.4
2.6
2.8
3.00.0 0.1 0.2 0.3 0.4 0.5 0.6 0.7 0.8 0.9 1.0
K s+
tr / T1
uniformly loadedconcentrated load
tr / T1> 1
tr / T1≤ 1
tr / T1≤ 1
tr / T1> 1
(a) simply supported
1 2 3 4 5 6 7 8 9 10 110.8
1.2
1.6
2.0
2.4
2.8
3.2
3.60.0 0.1 0.2 0.3 0.4 0.5 0.6 0.7 0.8 0.9 1.0
uniformly loadedconcentrated load
tr / T
1≤ 1
tr / T
1≤ 1
tr / T
1>1
K s+
tr / T1 (b) fixed-end
Figure 9: Positive shear magnification factor-rise time relationship.
3.1 Triangular load with zero rise time
Figs. 7-8 show that (1) +sK rises with increasing 1Ttd , despite of uniformly
loaded or concentrated loaded and simply supported or fixed-end beams; (2) −sK
rises with increasing 1Ttd when 7.01 ≤Ttd and decreases slightly when
7.01 ≥Ttd ; (3) Both +sK and −
sK tend to be constant values when 1Ttd is large enough.
3.2 Ramp load
Fig.9 shows that +sK decreases with increasing tr/T1 and tend to be about 1.0
when tr/T1 is large enough.
Structures Under Shock and Impact VIII, N. Jones & C. A. Brebbia (Editors)© 2004 WIT Press, www.witpress.com, ISBN 1-85312-706-XStructures Under Shock and Impact VIII, N. Jones & C. A. Brebbia (Editors)© 2004 WIT Press, www.witpress.com, ISBN 1-85312-706-X
Structures Under Shock and Impact VIII 145

0.0 0.5 1.0 1.5 2.0 2.5 3.0 3.5 4.0 4.5 5.00.0
0.2
0.4
0.6
0.8
1.0
1.2
1.4
1.6
1.8
2.0
K s+
td / T1
h/l = 0.05 h/l = 0.1 h/l = 0.2 h/l = 0.3
(a) uniformly load
0.0 0.5 1.0 1.5 2.0 2.5 3.0 3.5 4.0 4.5 5.00.5
1.0
1.5
2.0
2.5
3.0
3.5
4.0
4.5
5.0
5.5
K s+
td / T
1
h/l = 0.05 h/l = 0.1 h/l = 0.2 h/l = 0.3
(b) concentrated load
Figure 10: Positive shear magnification factor-duration relationship (triangular
load with zero rise time).
The results above show that Ks+ or Ks
- can be more than 2.0, exceeding the maximum displacement magnification factor. The reason is that the high frequency of the structural response has greater effects on the shear force than on the displacement.
4 Corrections on SMF
4.1 The effect of the ratio of the depth to span
The theory of Timoshenko beam is used in order to consider the effects of the shear deformation and moment of inertia on the shear force. The expressions for the dynamic shear forces in a simply supported Timoshenko beam can be found in [4] and omitted here. The results are shown in fig.10-12, where h is the depth of the beam and l is the span of the beam. The figures show that both Ks
+ and Ks-
rise with increasing h/l.
Structures Under Shock and Impact VIII, N. Jones & C. A. Brebbia (Editors)© 2004 WIT Press, www.witpress.com, ISBN 1-85312-706-XStructures Under Shock and Impact VIII, N. Jones & C. A. Brebbia (Editors)© 2004 WIT Press, www.witpress.com, ISBN 1-85312-706-X
146 Structures Under Shock and Impact VIII

0.0 0.5 1.0 1.5 2.0 2.5 3.0 3.5 4.0 4.5 5.00.0
0.1
0.2
0.3
0.4
0.5
0.6
0.7
0.8
0.9
1.0
1.1
1.2
K s-
td / T
1
h/l = 0.05 h/l = 0.1 h/l = 0.2 h/l = 0.3
(a) uniformly loaded
0.0 0.5 1.0 1.5 2.0 2.5 3.0 3.5 4.0 4.5 5.00.50
0.75
1.00
1.25
1.50
1.75
2.00
2.25
2.50
2.75
3.00
K s-
td / T1
h/l = 0.05 h/l = 0.1 h/l = 0.2 h/l = 0.3
(b) concentrated load
Figure 11: Negative shear magnification factor-duration relationship
(triangular load with zero rise time).
4.2 The effect of elastic-plastic deformation
So far, SMF has been discussed only in the case of elastic response. To further understand the dynamic shear deformation and shear force in RC beams in the case of elastic-plastic response, the layered Timoshenko beam nonlinear finite element procedure is used to predict the SMF. The finite element procedure takes account of the effects of strain rate, stirrup, the hardening and softening of concrete both in tension and compression. The details of the finite element procedure can be found in [2,3]. The computational results are only given here and the extent of plastic deformation is expressed by ductility ratio, denoted by β.
Structures Under Shock and Impact VIII, N. Jones & C. A. Brebbia (Editors)© 2004 WIT Press, www.witpress.com, ISBN 1-85312-706-XStructures Under Shock and Impact VIII, N. Jones & C. A. Brebbia (Editors)© 2004 WIT Press, www.witpress.com, ISBN 1-85312-706-X
Structures Under Shock and Impact VIII 147
0.0 0.5 1.0 1.5 2.0 2.5 3.0 3.5 4.0 4.5 5.01.0
1.1
1.2
1.3
1.4
1.5
1.6
1.7
1.8
1.9
2.0
h/l = 0.05 h/l = 0.1 h/l = 0.2 h/l = 0.3
K s+
tr / T
1 (a) uniformly load
0.0 0.5 1.0 1.5 2.0 2.5 3.0 3.5 4.0 4.5 5.01.0
1.5
2.0
2.5
3.0
3.5
4.0
4.5
5.0
5.5
6.0
6.5
K s+
tr / T1
h/l = 0.05 h/l = 0.1 h/l = 0.2 h/l = 0.3
(b) concentrated loaded
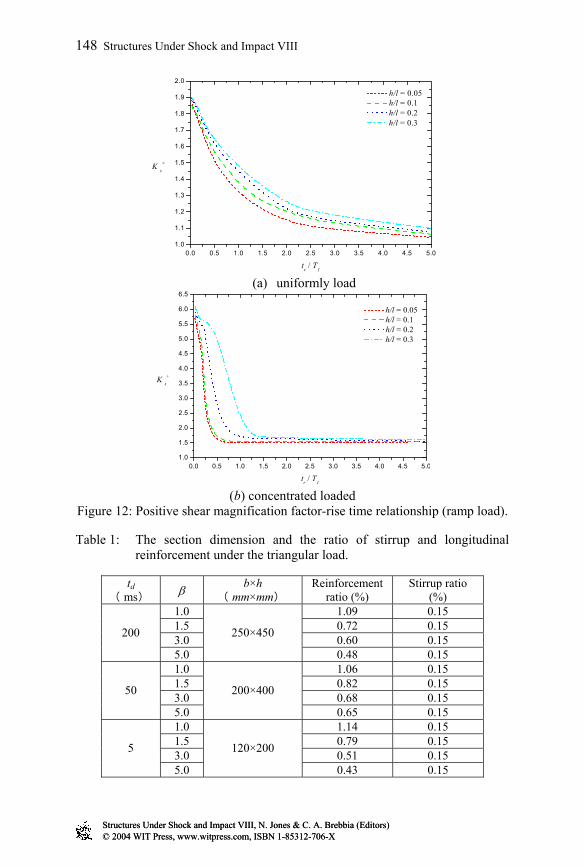
Figure 12: Positive shear magnification factor-rise time relationship (ramp load).
Table 1: The section dimension and the ratio of stirrup and longitudinal reinforcement under the triangular load.
td ( ms) β b×h
( mm×mm) Reinforcement
ratio (%) Stirrup ratio
(%) 1.0 1.09 0.15 1.5 0.72 0.15 3.0 0.60 0.15 200
5.0
250×450
0.48 0.15 1.0 1.06 0.15 1.5 0.82 0.15 3.0 0.68 0.15 50
5.0
200×400
0.65 0.15 1.0 1.14 0.15 1.5 0.79 0.15 3.0 0.51 0.15 5
5.0
120×200
0.43 0.15
Structures Under Shock and Impact VIII, N. Jones & C. A. Brebbia (Editors)© 2004 WIT Press, www.witpress.com, ISBN 1-85312-706-XStructures Under Shock and Impact VIII, N. Jones & C. A. Brebbia (Editors)© 2004 WIT Press, www.witpress.com, ISBN 1-85312-706-X
148 Structures Under Shock and Impact VIII
The parameters of the materials and loads are: (1) for concrete, the elastic modulus is 38000MPa, compressive strength is 31MPa and Poission’s ratio is 0.2. (2) for reinforcement, the elastic modulus is 210000MPa and the yield strength is 357MPa. (3) the maximum magnitudes of the triangular load and ramp load are 0.15MPa and 0.44MPa, respectively. The other parameters are listed in table 1 and table 2.
0.5 1.0 1.5 2.0 2.5 3.0 3.5 4.0 4.5 5.0 5.5
0.50
0.55
0.60
0.65
0.70
0.75
0.80
0.85
0.90
0.95
1.00
1.05
td=5 ms t
d=50 ms
td=200 ms
Q/Q
β=1
ß (a) tr=0 ms
0.5 1.0 1.5 2.0 2.5 3.0 3.5 4.0 4.5 5.0 5.50.60
0.65
0.70
0.75
0.80
0.85
0.90
0.95
1.00
1.05
tr= 0.0 ms tr= 1.3 ms
Q/Q
β=1
ß (b) td=30 ms
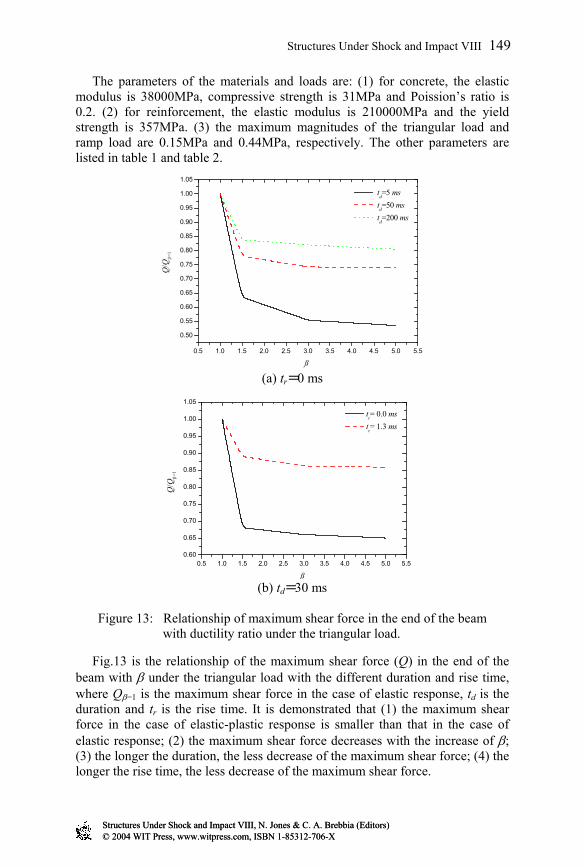
Figure 13: Relationship of maximum shear force in the end of the beam
with ductility ratio under the triangular load. Fig.13 is the relationship of the maximum shear force (Q) in the end of the beam with β under the triangular load with the different duration and rise time, where Qβ=1 is the maximum shear force in the case of elastic response, td is the duration and tr is the rise time. It is demonstrated that (1) the maximum shear force in the case of elastic-plastic response is smaller than that in the case of elastic response; (2) the maximum shear force decreases with the increase of β; (3) the longer the duration, the less decrease of the maximum shear force; (4) the longer the rise time, the less decrease of the maximum shear force.
Structures Under Shock and Impact VIII, N. Jones & C. A. Brebbia (Editors)© 2004 WIT Press, www.witpress.com, ISBN 1-85312-706-XStructures Under Shock and Impact VIII, N. Jones & C. A. Brebbia (Editors)© 2004 WIT Press, www.witpress.com, ISBN 1-85312-706-X
Structures Under Shock and Impact VIII 149

Table 2: The section dimension and the ratio of longitudinal reinforcement under the ramp load.
tr ( ms) β b×h
( mm×mm) Reinforcement
ratio (%) Stirrup ratio
(%) 1.0 1.20 0.15 1.5 0.65 0.15 3.0 0.46 0.15 0.0
5.0
1000×650
0.40 0.15 1.0 1.07 0.15 1.5 0.76 0.15 3.0 0.51 0.15 1.3
5.0
1000×550
0.48 0.15
5 Conclusions
The main conclusions may be outlined as follows. (1) The frequently used Biggs simplified analytical method is only suitable for predicting shear forces in beams and plates subjected to the loads with long duration. (2) The shear magnification factor can exceed 2, which is the maximum displacement magnification factor, as the high frequency of the structural responses has greater effect on the shear force than on the displacement. (3) The shear magnification factor rises with the increasing ratio of the depth to span. (4) The shear force in the case of elastic-plastic response is smaller than that in the case of elastic response. The shear force decreases with the increase of ductility ratio but decreases with the decreasing duration and rise time.
References
[1] Biggs J M. Introduction to Structural Dynamics. New York: McGraw-Hill Press, 1964.
[2] Fang Q and Qian Q, A Rate-sensitive Analysis of R/C Beams Subjected to Blast Loads, Structures under Shock and Impact, Elsevier Computational Mechanics Publications, Italy, 1996.
[3] Liu J C, Fang Q, Gong Z M, Fan J Y. Analysis of Dynamic Responses and Failure Modes of R/C Beams under Blast Loading. Explosion and Shock Wave; 23(1):25-30, 2003 (in Chinese).
[4] Anderson R A. Flexural Vibrations in Uniform Beams According to the Timoshenko Theory. ASME Journal of Applied Mechanics; 504-510, 1953.
Structures Under Shock and Impact VIII, N. Jones & C. A. Brebbia (Editors)© 2004 WIT Press, www.witpress.com, ISBN 1-85312-706-XStructures Under Shock and Impact VIII, N. Jones & C. A. Brebbia (Editors)© 2004 WIT Press, www.witpress.com, ISBN 1-85312-706-X
150 Structures Under Shock and Impact VIII