Determination of GM Soybean 44406 in Soya Milk Powder...
44
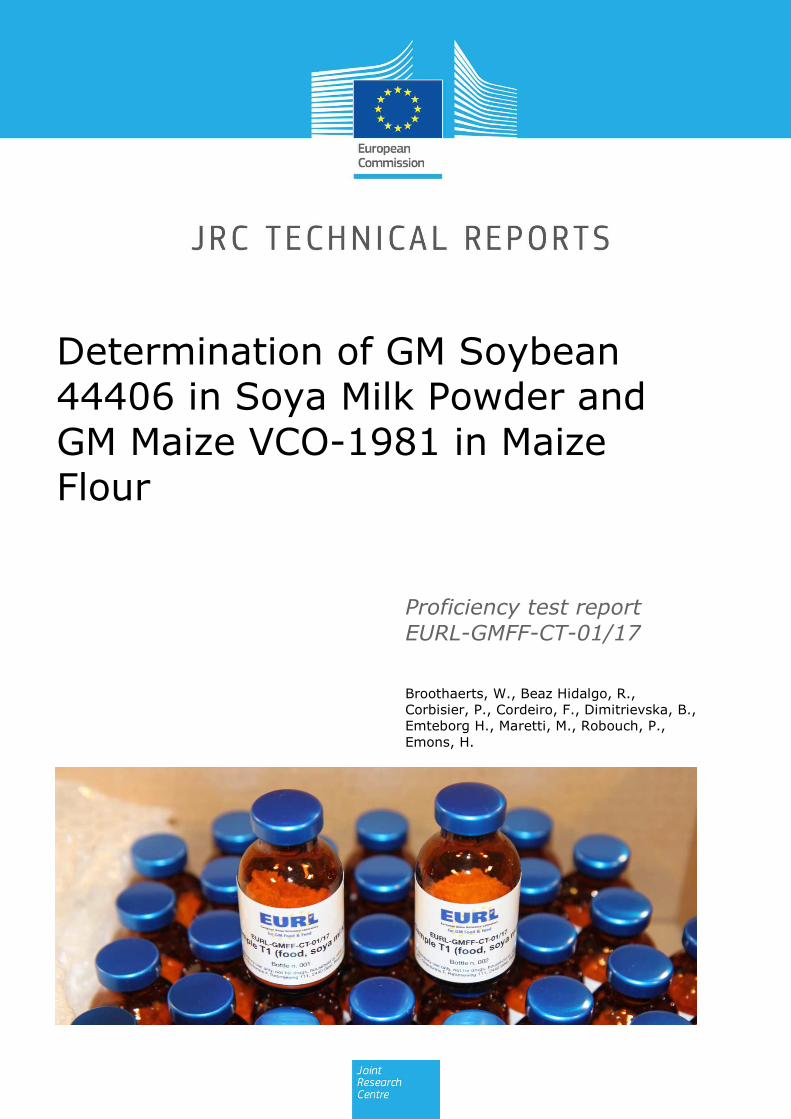
EURL-GMFF-CT-01/17final CTR Determination of GM Soybean 44406 in Soya Milk Powder and GM Maize VCO-1981 in Maize Flour Proficiency test report EURL-GMFF-CT-01/17 Broothaerts, W., Beaz Hidalgo, R., Corbisier, P., Cordeiro, F., Dimitrievska, B., Emteborg H., Maretti, M., Robouch, P., Emons, H.
Transcript of Determination of GM Soybean 44406 in Soya Milk Powder...
EURL-GMFF-CT-01/17final CTR
Determination of GM Soybean 44406 in Soya Milk Powder and GM Maize VCO-1981 in Maize Flour
Proficiency test report EURL-GMFF-CT-01/17
Broothaerts, W., Beaz Hidalgo, R., Corbisier, P., Cordeiro, F., Dimitrievska, B., Emteborg H., Maretti, M., Robouch, P., Emons, H.
This publication is a Technical report by the Joint Research Centre (JRC), the European Commission’s science
and knowledge service. It aims to provide evidence-based scientific support to the European policymaking process. The scientific output expressed does not imply a policy position of the European Commission. Neither the European Commission nor any person acting on behalf of the Commission is responsible for the use that
might be made of this publication.
Contact information Name: European Union Reference Laboratory for GM Food and Feed Address: European Commission, Joint Research Centre, Directorate F – Health, Consumers & Reference Materials, Via E. Fermi 2749, I-21027 Ispra (VA), Italy Email: [email protected] Tel.: +39 0332 78 9040 JRC Science Hub https://ec.europa.eu/jrc JRC107801 EUR 28742 EN
PDF ISBN 978-92-79-72237-0 ISSN 1831-9424 doi:10.2760/030219
Date: 28 August 2017 © European Union, 2017 The reuse of the document is authorised, provided the source is acknowledged and the original meaning or message of the texts are not distorted. The European Commission shall not be held liable for any consequences stemming from the reuse.
How to cite this report: Broothaerts, W., Beaz Hidalgo, R., Corbisier, P., Cordeiro, F., Dimitrievska, B., Emteborg, H., Maretti, M., Robouch, P., Emons, H., Determination of GM Soybean 44406 in Soya Milk Powder and GM maize VCO-1981 in Maize Flour; EUR 28742 EN, Publications Office of the European Union, Luxembourg, 2017, ISBN 978-92-79-72237, doi: 10.2760/030219
All images © European Union 2017
EURL GMFF: Comparative testing report
No 0012
Contents
Executive summary ............................................................................................... 1
1 Introduction ...................................................................................................... 2
2 Test items ........................................................................................................ 3
2.1 Test item 1 .................................................................................................. 3
2.2 Test item 2 .................................................................................................. 5
3 Instructions to the participants ............................................................................ 6
4 Results ............................................................................................................. 7
4.1 Participation to CT round 01/17 ..................................................................... 7
4.2 Information on the testing provided in the questionnaire .................................. 8
4.3 GM event identification ............................................................................... 10
4.4 GM event quantification .............................................................................. 10
4.4.1 Number of participants reporting a quantitative result ............................ 10
4.4.2 Assigned values ................................................................................. 11
4.4.3 Calculation of performance scores ........................................................ 12
4.4.4 Performance of the laboratories ........................................................... 13
5 Conclusions..................................................................................................... 16
Acknowledgements .............................................................................................. 17
References .......................................................................................................... 19
List of tables ....................................................................................................... 21
List of figures ...................................................................................................... 21
Annexes ............................................................................................................. 22
Annex 1. Homogeneity and stability of test items ................................................ 22
A1.1 Homogeneity of test items ........................................................................ 22
A1.2 Stability of test items ............................................................................... 22
Annex 2: Questionnaire data ............................................................................. 24
Annex 3: Qualitative performance of the participants ........................................... 32
Annex 4: Participants' quantitative performance .................................................. 33
EURL GMFF: Comparative testing report
No 0012
Quality assurance
The European Union Reference Laboratory for GM Food and Feed (EURL GMFF), hosted by the Joint Research Centre (JRC) in Ispra (Italy), is accredited according to ISO/IEC 17043:2010 (accreditation number: ACCREDIA 0012) for the organisation of proficiency tests (here called comparative tests or CT).
The EURL GMFF is also accredited according to ISO/IEC 17025:2005 (accreditation number: ACCREDIA 1172) for testing methods on food and feed (flexible scope) for GMOs (DNA extraction, detection, identification and quantification by PCR).
The activities described in this report for the JRC-Geel (Belgium) have been performed under a quality management system accredited according to ISO/IEC 17025:2005 (accreditation number: BELAC 268) for the testing of plant material (flexible scope) for GM content (DNA extraction, real-time PCR), and according to ISO Guide 34:2009 for the production of certified reference materials.
No 0012
Confidentiality statement
The procedures used for the organisation of PTs are accredited according to ISO 17043:2010 and guarantee that the identity of the participants and the information provided by them is treated as confidential. The participants in this comparative testing round will receive a unique lab code that will be used throughout this report.
List of abbreviations
CT Comparative testing (= proficiency testing or PT)
EURL European Union Reference Laboratory
GMFF Genetically modified food and feed
kbp Kilo (1000) basepairs
m/m % Mass per mass percentage
MW Molecular weight
N.A. Not applicable
NRL National Reference Laboratory in line with Regulation (EC) No 882/2004 (NRL/882) on official controls in food and feed or with Regulation (EU) No 120/2014 (NRL/120), cooperating with the EURL GMFF on method validation
OCL Official Control Laboratory
qPCR Quantitative (real-time) Polymerase Chain Reaction
SD Standard deviation
σpt Standard deviation for proficiency testing
U/u Expanded/standard measurement uncertainty
z and ζ Variables used to express the performance of a laboratory
EURL GMFF: Comparative testing report
No 0012
1/44
Executive summary
The European Union Reference Laboratory for Genetically Modified Food and Feed (EURL GMFF) organised a comparative test (CT) for National Reference Laboratories (NRLs) to support the official controls on food and feed in line with Regulation (EC) No 882/2004. Other official control laboratories were allowed to participate on a voluntary basis.
Two test items were distributed: a soya milk powder spiked with soybean GM event DAS-444Ø6-6 (Test Item 1, T1) and a maize flour containing maize event VCO-Ø1981-5 (Test Item 2, T2). Participants were required to screen T1 and T2 for the presence of three GM soybean events and three GM maize events, respectively, and to quantify those events identified. The results had to be reported in GM mass/mass %.
Eighty-three participants from 38 countries participated to this CT round, including 55 NRLs, of which 33 are designated in line with Regulation (EC) No 882/2004 (NRL/882) and 22 are nominated in Regulation (EU) No 120/2014 to support the EURL GMFF on method validation (NRL/120).
The qualitative results, i.e. the correct identification of the GM events, were evaluated and scored as correct or incorrect. The assigned value for the 44406 soybean mass fraction in the soy milk material was derived as the robust mean of the data provided by NRLs, while for VCO-1981, the certified value was set as the assigned value. z and ζ scores were calculated to assess laboratory performance.
The results reported indicate that all NRLs identified the correct GM events in both test items and most of the quantitative results were satisfactorily. Five laboratories, including one NRL/882, obtained an unsatisfactory z score for the quantification of 44406 soybean in soya milk powder. All z scores for VCO-1981 maize content in maize flour were satisfactory. A total of 19 and 7 unsatisfactory ζ scores were obtained for events 44406 and VCO-1981, respectively. At least for a number of laboratories this was the due to an underestimation or overestimation of the measurement uncertainty or a failure to report it.
A root-cause analysis will be requested from NRLs having reported unsatisfactory results in this CT round and will be followed-up.
EURL GMFF: Comparative testing report
No 0012
2/44
1 Introduction
The Joint Research Centre (JRC) of the European Commission was established as European Union Reference Laboratory for GM Food and Feed (EURL GMFF) by Regulations (EC) No 1829/2003(1) and (EC) No 882/2004(2). Regulation (EC) No 882/2004 also requires Member States to designate National Reference Laboratories (NRL/882) for each EURL coordinating activities for the official control of compliance with food and feed law. The analytical methods used for these controls have been validated by the EURL GMFF, as required by Regulation (EC) No 1829/2003, and for this task, the EURL GMFF is supported by NRLs listed in Regulation (EU) No 120/2014(3) (NRL/120; a part of these NRL/120 are also NRL/882). The Member States of the European Union may also appoint other laboratories (non-NRLs) for performing the official controls on food and feed.
It is crucial that official control laboratories can accurately and reliably determine the GM content in food and feed samples. Regulation (EC) No 1829/2003 established a threshold for labelling of food and feed products containing genetically modified material that is authorised in the EU (0.9 %). Furthermore, Regulation (EU) No 619/2011(4) introduced a minimum performance limit (0.1 m/m %) for detecting the accidental presence, in feed, of genetically modified material with pending or expired authorisation status. Compliance with these values is verified by the Member States of the European Union in the official control of food and feed.
The EURL GMFF is tasked with the organisation of proficiency tests (here called comparative tests or CT in line with the legislation(2)) to foster the correct application of the analytical methods available for the official controls(2). The EURL GMFF is operating under a quality management system which is accredited according to ISO/IEC 17043(5) for the organisation of proficiency testing.
This report summarises the results obtained in a CT round organised by the EURL GMFF in 2017 (CT 01/17). Participation in such CT rounds is mandatory for NRL/882, recommended for NRL/120, and open to official control laboratories within or outside the EU.
EURL GMFF: Comparative testing report
No 0012
3/44
2 Test items
The test items used in this CT round were prepared and characterised at JRC-Geel.
2.1 Test item 1
The T1 test item was prepared from base materials that were characterised before their use (Table 1). The base materials employed for the preparation of T1 were soya milk powder (Now Foods, Real Food, USDA Organic Soy Milk) and the ERM-BF436b containing the DAS-44406-6 event (hereafter named 44406) as spiked material (Table 1).
For the soya milk powder and the ERM-BF436b powder, a residual water mass fraction of 22.6 ± 3.2 g/kg and 45.5 ± 6.4 g/kg, respectively, was measured by volumetric Karl Fischer titration (758 KFD Titrino, Metrohm, Herisau, CH) with the expanded uncertainty calculated with a coverage factor of k = 2. Both powders were sufficiently dry to perform the dry mixing and did not require an additional drying step.
The particle volumes for both powders were measured based on laser diffraction patterns (PSA, Sympatec, Clausthal-Zellerfeld, DE) and were compared. The mean particle diameters (N = 1, n = 5), calculated by the PSA software, were 74.1 µm (SD = 0.4 µm) for the soya milk powder and 93 µm (SD = 9 µm) for the ERM-BF436b powder. It was concluded that the particle volume fractions of both powders were sufficiently similar to allow the processing of mixtures without introducing an additional bias as the result of a different DNA extractability.
The amount and the quality of the DNA extracted from the soya milk powder and the GM spiking material were verified by UV spectrometry, fluorometry and gel electrophoresis. Four different extraction methods were tested: a DNeasy Plant Mini kit, a CTAB method(6), and two other CTAB methods optimised for soybean with and without purification step by Genomic-tip 20/G (Qiagen, Hilden, Germany). Sample intakes of 50, 100 and 200 mg were tested. The DNA extraction method offering the highest yield with an optimal Abs260/280 ratio was the JRC-GEEL in-house CTAB extraction method without extra column purification (Table 1). DNA extracted with the in-house CTAB methods (referred to as C and D in Table 1) were tested between 40 ng/µL to 0.02 ng/µL with a lectin qPCR assay (5 µL per PCR) and did not show any inhibition (∆Cq values were very close to the theoretical ∆Cq values). The PCR efficiencies ranged between 96 and 98 % with a coefficient of determination (R2) between 0.99 and 1, confirming the absence of significant amounts of PCR inhibitors in the extracts.
The CTAB method (C) was chosen for all further analyses because it yielded a sufficient amount of DNA of PCR grade quality from both base materials.
However, the amount of DNA extracted from the soya milk powder was seriously underestimated when measured by UV fluorometry (PicoGreen). Upon agarose gel electrophoresis, this DNA showed a high level of fragmentation (smear from ± 25 to 1 kbp), while the DNA extracted from the spiking material migrated as a high molecular weight band (above 25 kbp). The precise industrial process that has been used to transform the soybean seeds into a soya milk powder used in this CT is unknown. However, instant soya milk powders are often produced by a succession of evaporations or ultrafiltration, spray drying and fluidised bed agglomeration(7). Some of those processes may be disruptive and generate a mixture of small single-stranded and double-stranded (ds) DNA. As the PicoGreen assay only measures dsDNA and as the final GM percentage is affected by the amount of DNA that can be extracted and amplified by PCR, it was decided to estimate the amount of DNA per mg soya milk powder on the basis of the amount of amplifiable lectin fragments. That amount was determined by qPCR with a lectin assay using DNA from the spiking material as calibrant.
The yield of amplifiable DNA per mg soya milk powder and the yield of DNA measured by PicoGreen for the spiking material were both taken into account to calculate the amount of spike material and soya milk powder to be mixed to obtain a target value of 0.6 m/m %.
EURL GMFF: Comparative testing report
No 0012
4/44
Table 1. Characteristics of the base materials used for preparation of test item 1 (T1).
Characteristic Soya Milk 44406 Soybean
Type of base material Instant soya milk powder CRM
Origin Now Foods, Real Food, USDA Organic Soy Milk
ERM-BF436b(8)
Grinding method None, used as such Cryo-grinding vibrating mill
Mixing method DynaMIX CM200 (WAB, Basel, CH)
Water content in m/m %, mean ± U (k = 2, n = 3) 45.5 ± 6.4 22.6 ± 3.2
Particle diameter in µm ± SD (n = 5) 74.1± 0.4 93 ± 9
DNA yield in ng/mg1, mean ± SD (n = 2 - 3)
A: 20.4 ± 2.8 B: 5.0 ± 2.5 C: 65.5 ± 2.5 D: 33.1 ± 6.1
A: 10.3 ± 4.0 B: 1.8 ± 0.7 C: 72.0 ± 3.8 D: 70.3 ± 0.2
Genetic elements detected with screening pre-spotted
plates
Hmg, Lec, P35S (Cq 33.3), tNOS (Cq 39.91), CTP2_EPSPS (Cq 34.02)
Lec, PAT
GM soybean events detected with event-specific pre-
spotted plates2
GTS 40-3-2 (Cq 33.75), MON89788 (Cq 33.32)
none
Mass used to prepare T1 (g)
Intermediate mixture T01 1700 100
Final test item T1 1600 100 of T01
Nominal target GM mass fraction in T1 (m/m %)
measured by qPCR NA 0.6 m/m %
1 Results reported here for a sample intake of 200 mg. A: CTAB method(6), B: DNeasy Plant Mini kit(6), C: in-house validated CTAB method for soybean (JRC-GEEL), D: in-house validated CTAB method for soybean, omitting the Genomic-tip 20/G purification (JRC-GEEL). The DNA yield values for the soya milk were determined by qPCR, whereas the yield for the spiking material 44406 was measured by fluorometry. 2 An all-species event-specific pre-spotted plate (PSP) was used for all tests; the PSP version used does not contain the 44406 method. NA: not applicable; SD: standard deviation; k: coverage factor; U: expanded uncertainty.
The presence of unexpected GM events in the base materials and in a pilot mixture was tested by using the screening(9) and GM soybean event-specific pre-spotted plates(10). The organic soya milk powder (labelled "non GMO") contained traces of p35S, tNOS and CTP2-EPSPS, GTS 40-3-2 and MON89788 at a level estimated around 0.01 m/m %.
The final test items were prepared gravimetrically in accordance with ISO Guide 34(11) as follows:
• The mass of the GM ingredient to add (44406 soybean) was calculated taking into account the amount of DNA that could be extracted and amplified from both materials (Table 1).
• The compound sample T1 was mixed in a DynaMIX CM200 (WAB, Basel, CH) for 1 h to improve equal distribution of the different types of soya tissues.
• After finalisation of the mixing step, the powders were filled manually in 20 mL brown glass vials using lyophilisation inserts manually placed in the bottle necks. Before final closure of the vials, air was evacuated in a freeze-dryer and replaced by argon. The vials were finally closed inside the freeze-dryer with the help of a hydraulic device and then sealed with blue aluminium caps to prevent accidental opening during storage and transport.
• A total of 336 vials containing each at least 5 g of flour were then labelled with a sample number and the description "Sample T1 (Food, soya milk)".
• Following the inventory and the selection of vials for future analysis according to a random stratified sampling scheme, the bottles were brought to a storage room for long-term storage in the dark at 4 ± 3 °C.
Homogeneity and stability testing of T1 was performed in-house, as described in Annex 1, using an event-specific quantification method previously validated by the EURL GMFF. Material T1 was found to be homogeneous for both GM events (p-value > 0.05; 200 mg sample intake).
EURL GMFF: Comparative testing report
No 0012
5/44
From the isochronous stability study, it was concluded that the test item would be sufficiently stable under ambient shipment conditions (5 % significance level). Stability was also confirmed during the whole period covered by this CT (Annex 1).
JRC-Ispra tested the T1 material and confirmed the results obtained by JRC-Geel. The average measured mass fraction for event 44406 in T1 (0.57 ± 0.09 (k=2) m/m %; n = 104) was in agreement with the expected nominal value.
2.2 Test item 2
The T2 test item was a certified reference material (Table 2). The bottles of T2 were re-labelled with a unique sample number as "Sample T2 (Feed, maize)".
Homogeneity and short-term stability of T2 had been previously demonstrated as part of the certification of the CRM; stability monitoring confirmed the stability of T2 during the running time of the CT (Annex 1).
Table 2. Characteristics of test item 2 (T2).
Characteristic Soybean feed
Type of base material CRM
Origin
ERM-BF438d(12) containing 10.0 ± 0.8 g/kg VCO-Ø1981-5 maize, produced in 2015 by JRC-Geel; prepared from a hemizygous GMO with the GM event contributed from the male parent during hybrid production
EURL GMFF: Comparative testing report
No 0012
6/44
3 Instructions to the participants
Participants in this CT round were instructed to analyse the two test items (T1 and T2) as follows:
Test Item 1: "Food, soya milk"
- Screen for the presence of the following three GM soybean event(s): 44406, CV127, MON87708;
- Quantify the GM soybean event(s) detected.
Test Item 2: "Feed, maize"
- Screen for the presence of the following three GM maize events: MON810, NK603, VCO-1981;
- Quantify the GM maize event(s) detected.
Quantitative results had to be reported in m/m % as outlined below:
Mass GM event [g] m/m % = x 100 % (1)
Total mass species [g]
Participants were reminded of the general rule that results obtained using a calibrant certified for GM mass fraction (i.e. a matrix CRM certified in [x] g/kg) can directly be expressed in m/m %, while results obtained using a calibrant certified for DNA copy number ratio (e.g. a plasmid containing both the GM and reference gene target or some matrix CRMs) need to be converted into m/m %, using a conversion factor(13,14).
The participants were also informed that the identification information on the participants in this comparative testing round would be kept confidential, except for the National Reference Laboratories that have been appointed in line with Regulation (EC) No 882/2004, of which the lab codes will be disclosed to DG SANTE for the purpose of an assessment of their performance.
EURL GMFF: Comparative testing report
No 0012
7/44
4 Results
4.1 Participation to CT round 01/17
On 23 February 2017, 201 laboratories were invited to participate in the CT round EURL-GMFF-CT-01/17 and 88 laboratories registered for it and received a random unique lab code (L01 to L88). Eighty-three laboratories from 38 countries returned results within the reporting deadline. Five laboratories did not submit any results, one of which (L77, non-NRL) had not received the samples from customs in time and one NRL/882 (L65) had a problem with ordering the reagents in time; for the remaining 3 non-NRLs the reason for not participating is not known.
Table 3 shows an overview of the participation to this CT round.
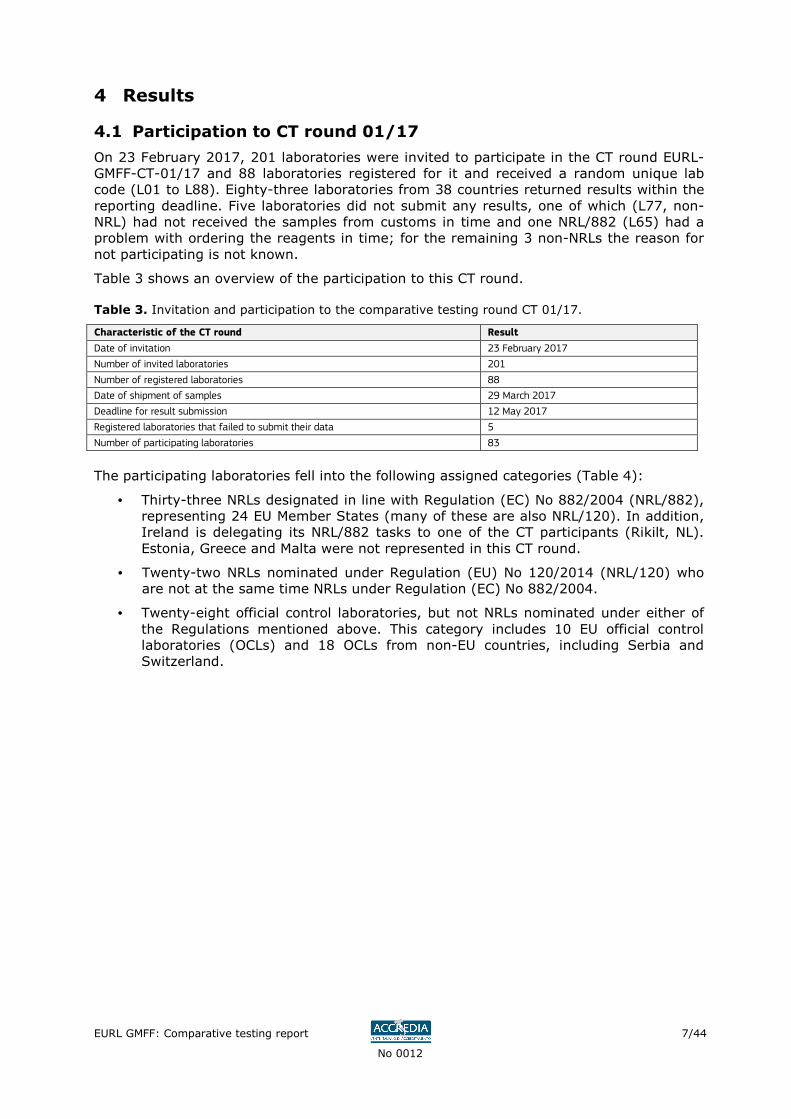
Table 3. Invitation and participation to the comparative testing round CT 01/17.
Characteristic of the CT round Result
Date of invitation 23 February 2017
Number of invited laboratories 201
Number of registered laboratories 88
Date of shipment of samples 29 March 2017
Deadline for result submission 12 May 2017
Registered laboratories that failed to submit their data 5
Number of participating laboratories 83
The participating laboratories fell into the following assigned categories (Table 4):
• Thirty-three NRLs designated in line with Regulation (EC) No 882/2004 (NRL/882), representing 24 EU Member States (many of these are also NRL/120). In addition, Ireland is delegating its NRL/882 tasks to one of the CT participants (Rikilt, NL). Estonia, Greece and Malta were not represented in this CT round.
• Twenty-two NRLs nominated under Regulation (EU) No 120/2014 (NRL/120) who are not at the same time NRLs under Regulation (EC) No 882/2004.
• Twenty-eight official control laboratories, but not NRLs nominated under either of the Regulations mentioned above. This category includes 10 EU official control laboratories (OCLs) and 18 OCLs from non-EU countries, including Serbia and Switzerland.
EURL GMFF: Comparative testing report
No 0012
8/44
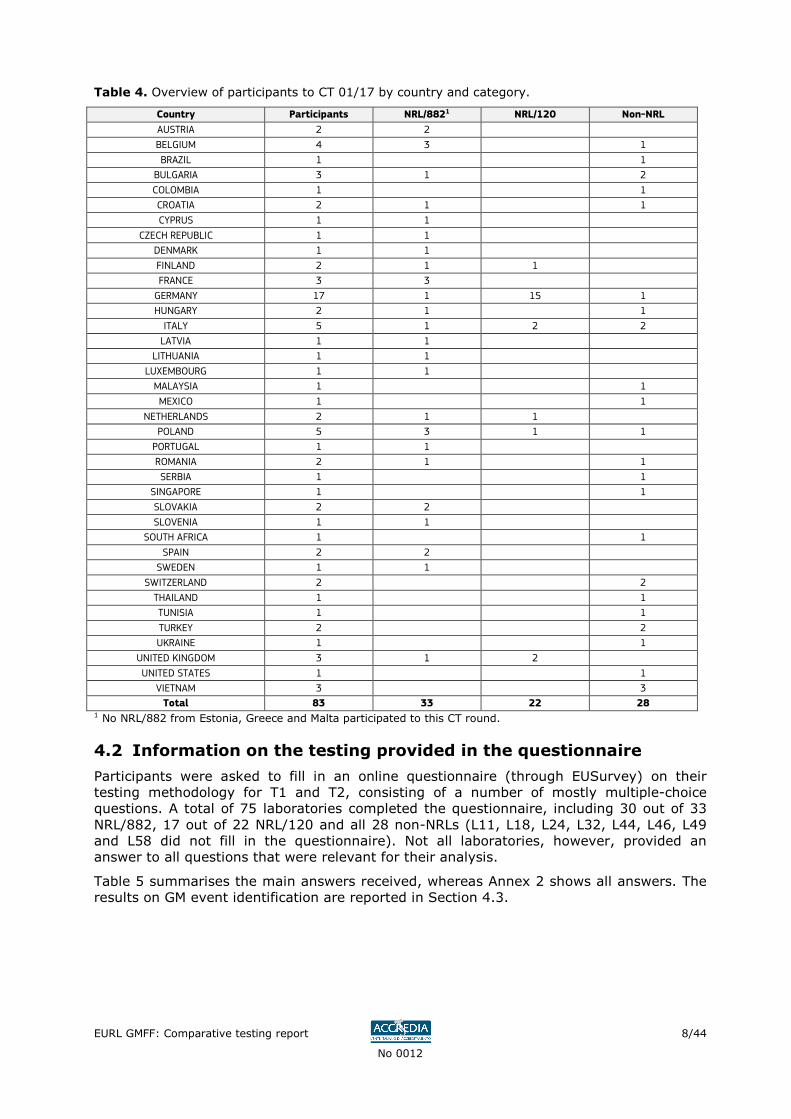
Table 4. Overview of participants to CT 01/17 by country and category.
Country Participants NRL/8821 NRL/120 Non-NRL
AUSTRIA 2 2
BELGIUM 4 3
1
BRAZIL 1
1
BULGARIA 3 1
2
COLOMBIA 1
1
CROATIA 2 1
1
CYPRUS 1 1
CZECH REPUBLIC 1 1
DENMARK 1 1
FINLAND 2 1 1
FRANCE 3 3
GERMANY 17 1 15 1
HUNGARY 2 1
1
ITALY 5 1 2 2
LATVIA 1 1
LITHUANIA 1 1
LUXEMBOURG 1 1
MALAYSIA 1
1
MEXICO 1
1
NETHERLANDS 2 1 1
POLAND 5 3 1 1
PORTUGAL 1 1
ROMANIA 2 1
1
SERBIA 1
1
SINGAPORE 1
1
SLOVAKIA 2 2
SLOVENIA 1 1
SOUTH AFRICA 1
1
SPAIN 2 2
SWEDEN 1 1
SWITZERLAND 2
2
THAILAND 1
1
TUNISIA 1
1
TURKEY 2
2
UKRAINE 1
1
UNITED KINGDOM 3 1 2
UNITED STATES 1
1
VIETNAM 3
3
Total 83 33 22 28 1 No NRL/882 from Estonia, Greece and Malta participated to this CT round.
4.2 Information on the testing provided in the questionnaire
Participants were asked to fill in an online questionnaire (through EUSurvey) on their testing methodology for T1 and T2, consisting of a number of mostly multiple-choice questions. A total of 75 laboratories completed the questionnaire, including 30 out of 33 NRL/882, 17 out of 22 NRL/120 and all 28 non-NRLs (L11, L18, L24, L32, L44, L46, L49 and L58 did not fill in the questionnaire). Not all laboratories, however, provided an answer to all questions that were relevant for their analysis.
Table 5 summarises the main answers received, whereas Annex 2 shows all answers. The results on GM event identification are reported in Section 4.3.
EURL GMFF: Comparative testing report
No 0012
9/44
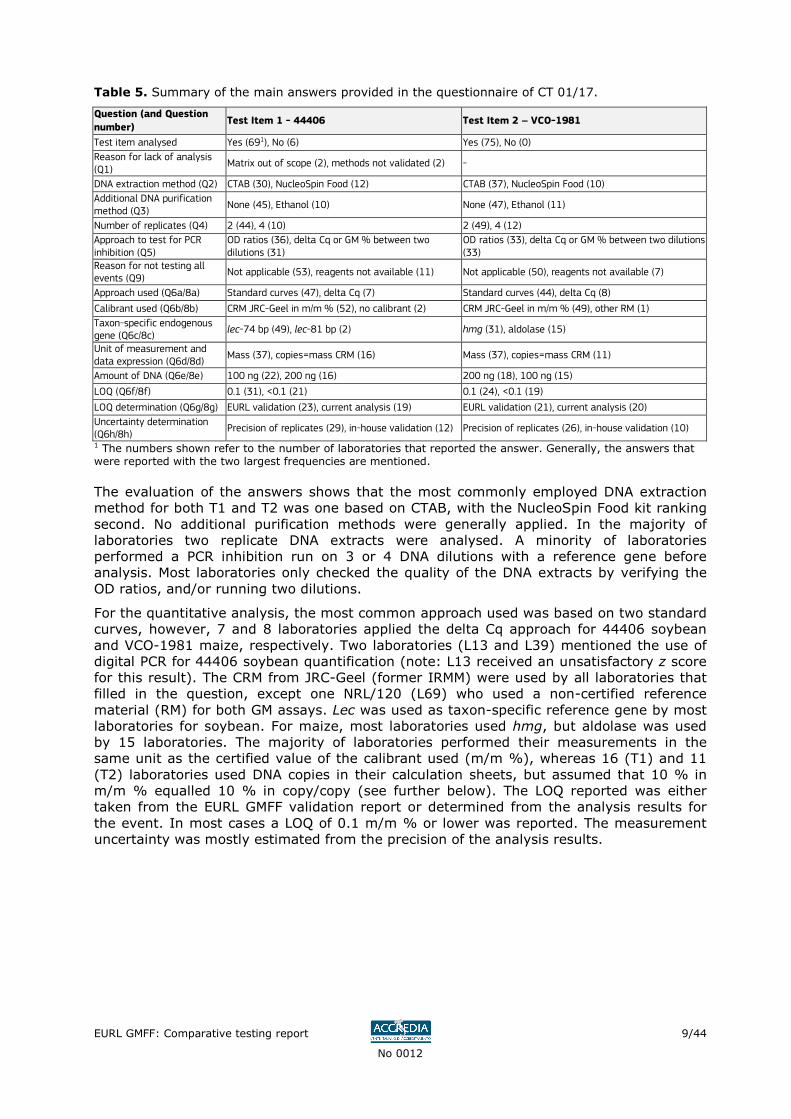
Table 5. Summary of the main answers provided in the questionnaire of CT 01/17.
Question (and Question
number) Test Item 1 - 44406 Test Item 2 – VCO-1981
Test item analysed Yes (691), No (6) Yes (75), No (0)
Reason for lack of analysis (Q1)
Matrix out of scope (2), methods not validated (2) -
DNA extraction method (Q2) CTAB (30), NucleoSpin Food (12) CTAB (37), NucleoSpin Food (10)
Additional DNA purification method (Q3)
None (45), Ethanol (10) None (47), Ethanol (11)
Number of replicates (Q4) 2 (44), 4 (10) 2 (49), 4 (12)
Approach to test for PCR inhibition (Q5)
OD ratios (36), delta Cq or GM % between two dilutions (31)
OD ratios (33), delta Cq or GM % between two dilutions (33)
Reason for not testing all events (Q9)
Not applicable (53), reagents not available (11) Not applicable (50), reagents not available (7)
Approach used (Q6a/8a) Standard curves (47), delta Cq (7) Standard curves (44), delta Cq (8)
Calibrant used (Q6b/8b) CRM JRC-Geel in m/m % (52), no calibrant (2) CRM JRC-Geel in m/m % (49), other RM (1)
Taxon-specific endogenous gene (Q6c/8c)
lec-74 bp (49), lec-81 bp (2) hmg (31), aldolase (15)
Unit of measurement and data expression (Q6d/8d)
Mass (37), copies=mass CRM (16) Mass (37), copies=mass CRM (11)
Amount of DNA (Q6e/8e) 100 ng (22), 200 ng (16) 200 ng (18), 100 ng (15)
LOQ (Q6f/8f) 0.1 (31), <0.1 (21) 0.1 (24), <0.1 (19)
LOQ determination (Q6g/8g) EURL validation (23), current analysis (19) EURL validation (21), current analysis (20)
Uncertainty determination (Q6h/8h)
Precision of replicates (29), in-house validation (12) Precision of replicates (26), in-house validation (10)
1 The numbers shown refer to the number of laboratories that reported the answer. Generally, the answers that were reported with the two largest frequencies are mentioned.
The evaluation of the answers shows that the most commonly employed DNA extraction method for both T1 and T2 was one based on CTAB, with the NucleoSpin Food kit ranking second. No additional purification methods were generally applied. In the majority of laboratories two replicate DNA extracts were analysed. A minority of laboratories performed a PCR inhibition run on 3 or 4 DNA dilutions with a reference gene before analysis. Most laboratories only checked the quality of the DNA extracts by verifying the OD ratios, and/or running two dilutions.
For the quantitative analysis, the most common approach used was based on two standard curves, however, 7 and 8 laboratories applied the delta Cq approach for 44406 soybean and VCO-1981 maize, respectively. Two laboratories (L13 and L39) mentioned the use of digital PCR for 44406 soybean quantification (note: L13 received an unsatisfactory z score for this result). The CRM from JRC-Geel (former IRMM) were used by all laboratories that filled in the question, except one NRL/120 (L69) who used a non-certified reference material (RM) for both GM assays. Lec was used as taxon-specific reference gene by most laboratories for soybean. For maize, most laboratories used hmg, but aldolase was used by 15 laboratories. The majority of laboratories performed their measurements in the same unit as the certified value of the calibrant used (m/m %), whereas 16 (T1) and 11 (T2) laboratories used DNA copies in their calculation sheets, but assumed that 10 % in m/m % equalled 10 % in copy/copy (see further below). The LOQ reported was either taken from the EURL GMFF validation report or determined from the analysis results for the event. In most cases a LOQ of 0.1 m/m % or lower was reported. The measurement uncertainty was mostly estimated from the precision of the analysis results.
EURL GMFF: Comparative testing report
No 0012
10/44
4.3 GM event identification
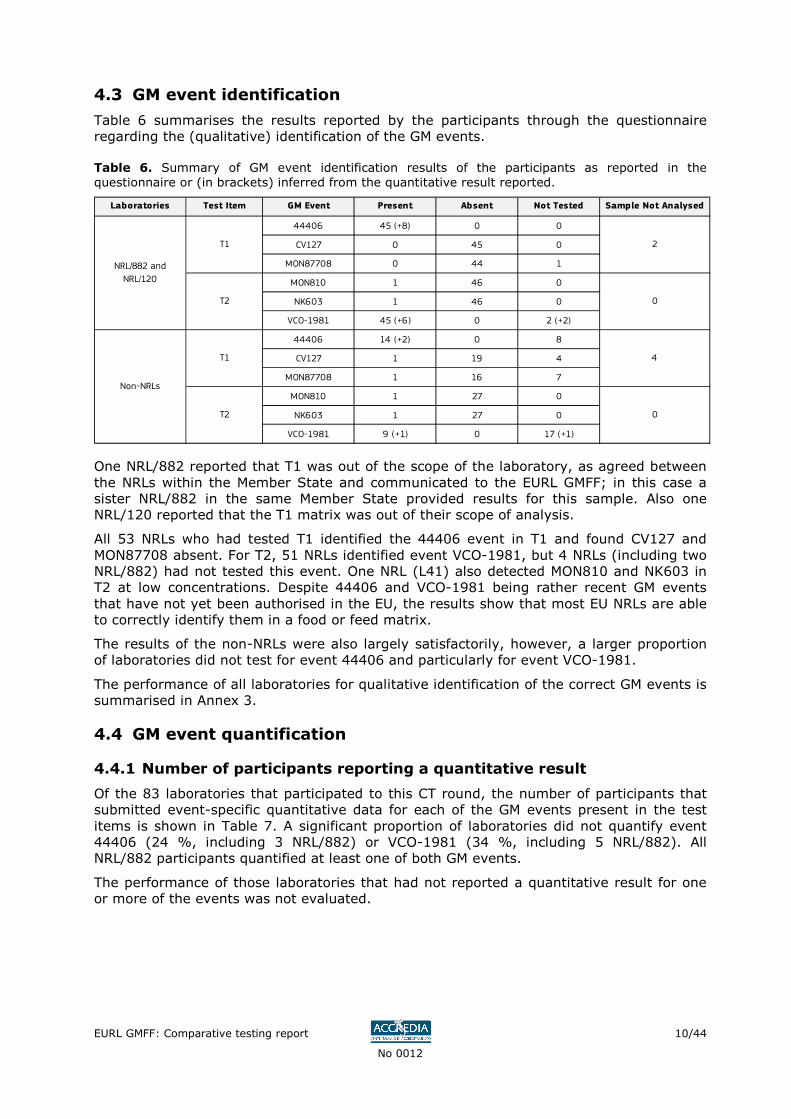
Table 6 summarises the results reported by the participants through the questionnaire regarding the (qualitative) identification of the GM events.
Table 6. Summary of GM event identification results of the participants as reported in the questionnaire or (in brackets) inferred from the quantitative result reported.
One NRL/882 reported that T1 was out of the scope of the laboratory, as agreed between the NRLs within the Member State and communicated to the EURL GMFF; in this case a sister NRL/882 in the same Member State provided results for this sample. Also one NRL/120 reported that the T1 matrix was out of their scope of analysis.
All 53 NRLs who had tested T1 identified the 44406 event in T1 and found CV127 and MON87708 absent. For T2, 51 NRLs identified event VCO-1981, but 4 NRLs (including two NRL/882) had not tested this event. One NRL (L41) also detected MON810 and NK603 in T2 at low concentrations. Despite 44406 and VCO-1981 being rather recent GM events that have not yet been authorised in the EU, the results show that most EU NRLs are able to correctly identify them in a food or feed matrix.
The results of the non-NRLs were also largely satisfactorily, however, a larger proportion of laboratories did not test for event 44406 and particularly for event VCO-1981.
The performance of all laboratories for qualitative identification of the correct GM events is summarised in Annex 3.
4.4 GM event quantification
4.4.1 Number of participants reporting a quantitative result
Of the 83 laboratories that participated to this CT round, the number of participants that submitted event-specific quantitative data for each of the GM events present in the test items is shown in Table 7. A significant proportion of laboratories did not quantify event 44406 (24 %, including 3 NRL/882) or VCO-1981 (34 %, including 5 NRL/882). All NRL/882 participants quantified at least one of both GM events.
The performance of those laboratories that had not reported a quantitative result for one or more of the events was not evaluated.
Laboratories Test Item GM Event Present Absent Not Tested Sample Not Analysed
44406 45 (+8) 0 0
CV127 0 45 0
MON87708 0 44 1
MON810 1 46 0
NK603 1 46 0
VCO-1981 45 (+6) 0 2 (+2)
44406 14 (+2) 0 8
CV127 1 19 4
MON87708 1 16 7
MON810 1 27 0
NK603 1 27 0
VCO-1981 9 (+1) 0 17 (+1)
T2
NRL/882 and
NRL/120
Non-NRLs
2
0
4
0
T1
T2
T1
EURL GMFF: Comparative testing report
No 0012
11/44
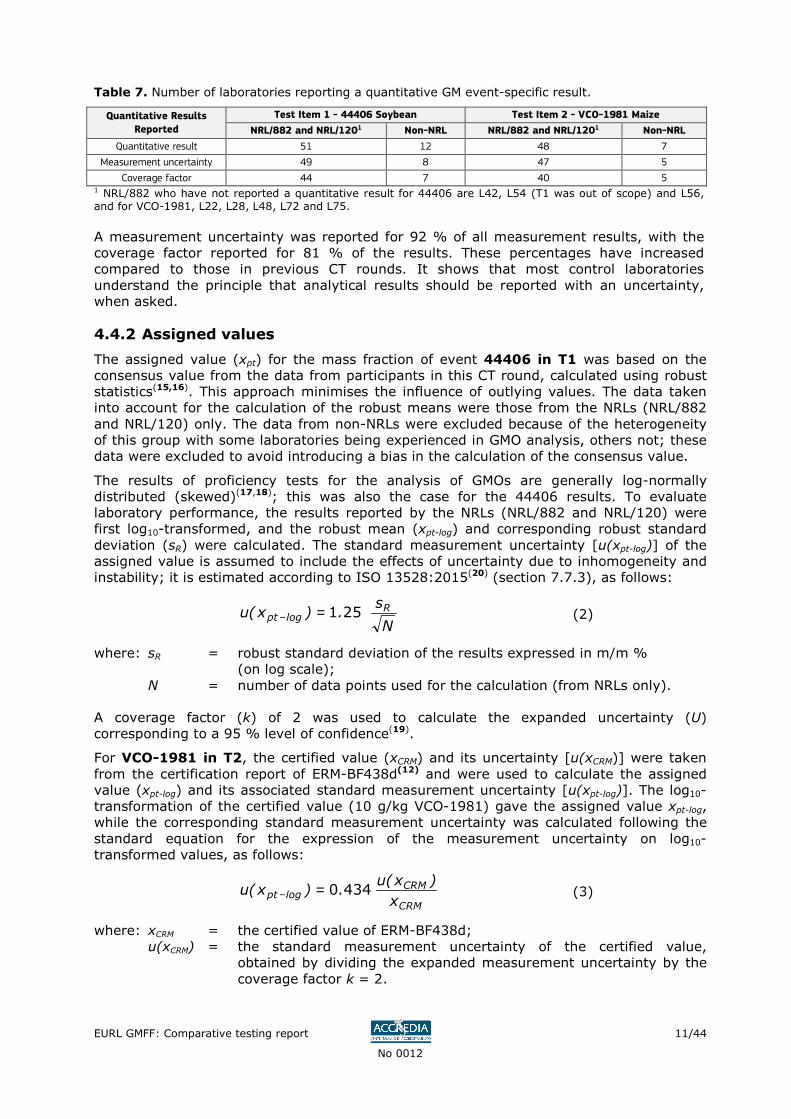
Table 7. Number of laboratories reporting a quantitative GM event-specific result.
Quantitative Results
Reported
Test Item 1 - 44406 Soybean Test Item 2 - VCO-1981 Maize
NRL/882 and NRL/1201 Non-NRL NRL/882 and NRL/1201 Non-NRL
Quantitative result 51 12 48 7
Measurement uncertainty 49 8 47 5
Coverage factor 44 7 40 5 1 NRL/882 who have not reported a quantitative result for 44406 are L42, L54 (T1 was out of scope) and L56, and for VCO-1981, L22, L28, L48, L72 and L75.
A measurement uncertainty was reported for 92 % of all measurement results, with the coverage factor reported for 81 % of the results. These percentages have increased compared to those in previous CT rounds. It shows that most control laboratories understand the principle that analytical results should be reported with an uncertainty, when asked.
4.4.2 Assigned values
The assigned value (xpt) for the mass fraction of event 44406 in T1 was based on the consensus value from the data from participants in this CT round, calculated using robust statistics(15,16). This approach minimises the influence of outlying values. The data taken into account for the calculation of the robust means were those from the NRLs (NRL/882 and NRL/120) only. The data from non-NRLs were excluded because of the heterogeneity of this group with some laboratories being experienced in GMO analysis, others not; these data were excluded to avoid introducing a bias in the calculation of the consensus value.
The results of proficiency tests for the analysis of GMOs are generally log-normally distributed (skewed)(17,18); this was also the case for the 44406 results. To evaluate laboratory performance, the results reported by the NRLs (NRL/882 and NRL/120) were first log10-transformed, and the robust mean (xpt-log) and corresponding robust standard deviation (sR) were calculated. The standard measurement uncertainty [u(xpt-log)] of the assigned value is assumed to include the effects of uncertainty due to inhomogeneity and instability; it is estimated according to ISO 13528:2015(20) (section 7.7.3), as follows:
N
s .)x(u R
logpt 251=− (2)
where: sR = robust standard deviation of the results expressed in m/m % (on log scale); N = number of data points used for the calculation (from NRLs only).
A coverage factor (k) of 2 was used to calculate the expanded uncertainty (U) corresponding to a 95 % level of confidence(19).
For VCO-1981 in T2, the certified value (xCRM) and its uncertainty [u(xCRM)] were taken from the certification report of ERM-BF438d(12) and were used to calculate the assigned value (xpt-log) and its associated standard measurement uncertainty [u(xpt-log)]. The log10-transformation of the certified value (10 g/kg VCO-1981) gave the assigned value xpt-log, while the corresponding standard measurement uncertainty was calculated following the standard equation for the expression of the measurement uncertainty on log10-transformed values, as follows:
CRM
CRMlogpt
x
)x(u .)x(u 4340=− (3)
where: xCRM = the certified value of ERM-BF438d; u(xCRM) = the standard measurement uncertainty of the certified value,
obtained by dividing the expanded measurement uncertainty by the coverage factor k = 2.
EURL GMFF: Comparative testing report
No 0012
12/44
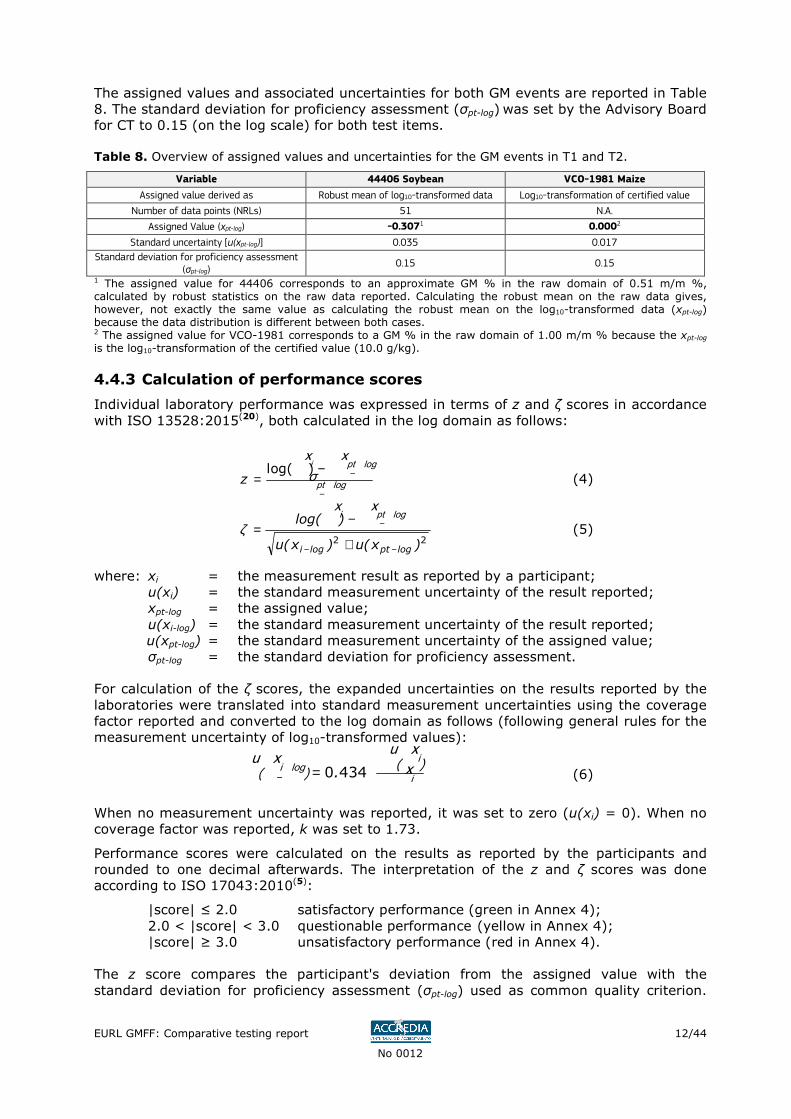
The assigned values and associated uncertainties for both GM events are reported in Table 8. The standard deviation for proficiency assessment (σpt-log) was set by the Advisory Board for CT to 0.15 (on the log scale) for both test items.
Table 8. Overview of assigned values and uncertainties for the GM events in T1 and T2.
Variable 44406 Soybean VCO-1981 Maize
Assigned value derived as Robust mean of log10-transformed data Log10-transformation of certified value
Number of data points (NRLs) 51 N.A.
Assigned Value (xpt-log) -0.3071 0.0002
Standard uncertainty [u(xpt-log)] 0.035 0.017
Standard deviation for proficiency assessment (σpt-log)
0.15 0.15
1 The assigned value for 44406 corresponds to an approximate GM % in the raw domain of 0.51 m/m %, calculated by robust statistics on the raw data reported. Calculating the robust mean on the raw data gives, however, not exactly the same value as calculating the robust mean on the log10-transformed data (xpt-log) because the data distribution is different between both cases. 2 The assigned value for VCO-1981 corresponds to a GM % in the raw domain of 1.00 m/m % because the xpt-log is the log10-transformation of the certified value (10.0 g/kg).
4.4.3 Calculation of performance scores
Individual laboratory performance was expressed in terms of z and ζ scores in accordance with ISO 13528:2015(20), both calculated in the log domain as follows:
logpt
logpti
σxx
−
−−=
)log(z (4)
22 )x(u)x(u
)log(
logptlogi −−
−
+
−= logpti xx
ζ (5)
where: xi = the measurement result as reported by a participant; u(xi) = the standard measurement uncertainty of the result reported; xpt-log = the assigned value; u(xi-log) = the standard measurement uncertainty of the result reported;
u(xpt-log) = the standard measurement uncertainty of the assigned value; σpt-log = the standard deviation for proficiency assessment.
For calculation of the ζ scores, the expanded uncertainties on the results reported by the laboratories were translated into standard measurement uncertainties using the coverage factor reported and converted to the log domain as follows (following general rules for the measurement uncertainty of log10-transformed values):
i
ilogi x
)u (x)u (x .4340=− (6)
When no measurement uncertainty was reported, it was set to zero (u(xi) = 0). When no coverage factor was reported, k was set to 1.73.
Performance scores were calculated on the results as reported by the participants and rounded to one decimal afterwards. The interpretation of the z and ζ scores was done according to ISO 17043:2010(5):
|score| ≤ 2.0 satisfactory performance (green in Annex 4); 2.0 < |score| < 3.0 questionable performance (yellow in Annex 4); |score| ≥ 3.0 unsatisfactory performance (red in Annex 4).
The z score compares the participant's deviation from the assigned value with the standard deviation for proficiency assessment (σpt-log) used as common quality criterion.
EURL GMFF: Comparative testing report
No 0012
13/44
Measurements that are carried out correctly are assumed to generate results that can be described (after log transformation) by a normal distribution with mean xpt-log and standard deviation σpt-log. The z scores will then be normally distributed with a mean of zero and a standard deviation of 1.0. Only 0.3 % of scores would be expected to fall outside the range -3.0 < z < 3.0 and only 5 % would be expected to fall outside the range -2.0 ≤ z ≤ 2.0. These percentages may change when the true interlaboratory variability deviates from the standard deviation of 0.15, set based on experience from previous CT rounds and reasonable performance expectations. It is unlikely that unacceptable z scores will occur by chance when no real problem exists; rather, it is likely that there is an identifiable cause for any anomaly when an unsatisfactory performance, expressed as a z score, is obtained.
The ζ score states whether the laboratory's result agrees with the assigned value within the respective measurement uncertainty. The denominator is the combined uncertainty of the assigned value [u(xpt-log)] and the measurement uncertainty as stated by the laboratory [u(xi-log)]. The ζ score includes all parts of a measurement result, namely the expected value (assigned value), its measurement uncertainty in the unit of the result as well as the uncertainty of the reported values. An unsatisfactory ζ score can either be caused by the presence of a significant bias (inaccurate measurement) or by a not realistic estimation of the measurement uncertainty (seriously under-estimated), or by a combination of both. Participants that have obtained a satisfactory z score but an unsatisfactory ζ score may have underestimated their measurement uncertainty. Participants that have obtained an unsatisfactory z score but a satisfactory ζ score may have assessed the uncertainty of their result accurately but the result itself does not meet the performance expected for the CT scheme.
More detailed information about measurement uncertainty evaluation can be found in some international standards and other guidance documents(19,21,22,23,24).
4.4.4 Performance of the laboratories
The performance of the laboratories for GM quantification is primarily evaluated on the basis of their z scores. The ζ scores obtained are providing additional information to the laboratory regarding the correct estimation of the measurement uncertainty of the result, but should be used as indicative values only.
4.4.4.1 z scores
Although the performance scores were calculated on the log-transformed data, the corresponding GM % on the raw domain, which are easier to understand, were as follows:
For 44406 soybean: Assigned value on the raw domain 0.51 m/m % |z| ≤ 2.0 lower and upper limits 0.25 – 1.00 m/m %
|z| < 3.0 lower and upper limits 0.18 – 1.36 m/m %
For VCO-1981 maize: Assigned value on the raw domain 1.00 m/m % |z| ≤ 2.0 lower and upper limits 0.50 – 2.03 m/m %
|z| < 3.0 lower and upper limits 0.37 – 2.77 m/m %
Table 9 summarises the performance results obtained in this CT round, based on the z scores. Detailed results per laboratory are reported in Annex 4, Tables A4.1 and A4.2 and Figures A4.1 and A4.2.
EURL GMFF: Comparative testing report
No 0012
14/44
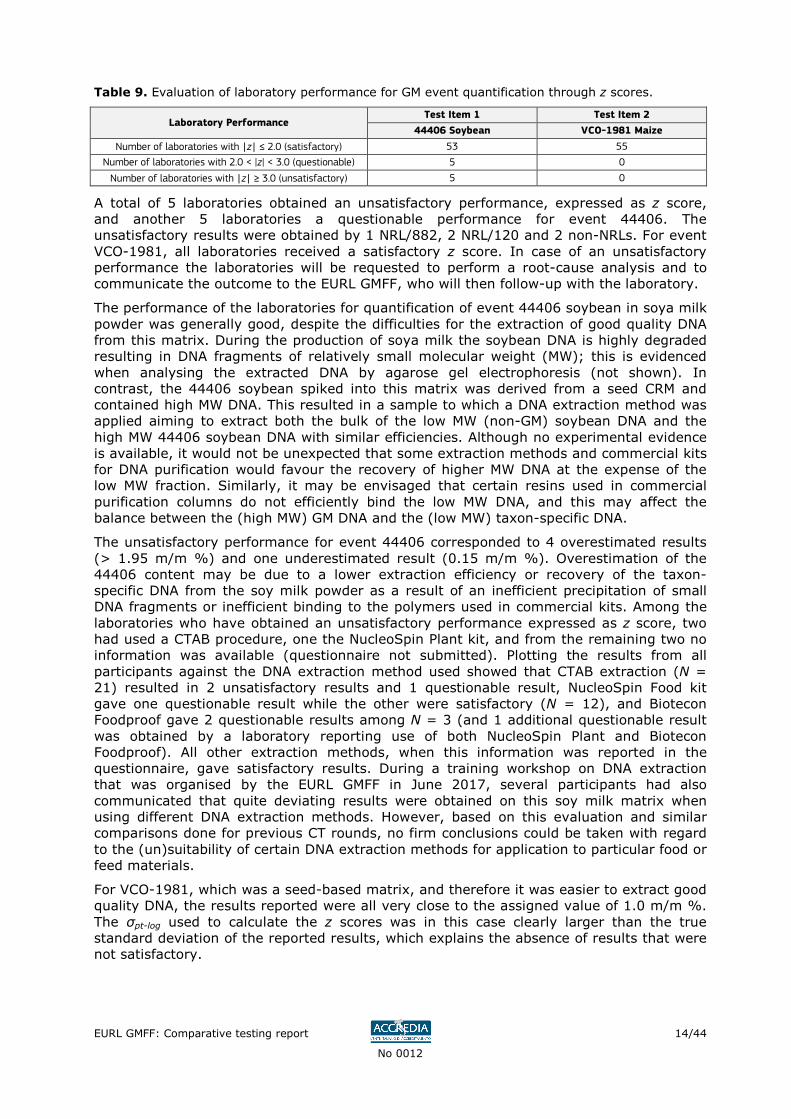
Table 9. Evaluation of laboratory performance for GM event quantification through z scores.
Laboratory Performance Test Item 1 Test Item 2
44406 Soybean VCO-1981 Maize
Number of laboratories with |z| ≤ 2.0 (satisfactory) 53 55
Number of laboratories with 2.0 < |z| < 3.0 (questionable) 5 0
Number of laboratories with |z| ≥ 3.0 (unsatisfactory) 5 0
A total of 5 laboratories obtained an unsatisfactory performance, expressed as z score, and another 5 laboratories a questionable performance for event 44406. The unsatisfactory results were obtained by 1 NRL/882, 2 NRL/120 and 2 non-NRLs. For event VCO-1981, all laboratories received a satisfactory z score. In case of an unsatisfactory performance the laboratories will be requested to perform a root-cause analysis and to communicate the outcome to the EURL GMFF, who will then follow-up with the laboratory.
The performance of the laboratories for quantification of event 44406 soybean in soya milk powder was generally good, despite the difficulties for the extraction of good quality DNA from this matrix. During the production of soya milk the soybean DNA is highly degraded resulting in DNA fragments of relatively small molecular weight (MW); this is evidenced when analysing the extracted DNA by agarose gel electrophoresis (not shown). In contrast, the 44406 soybean spiked into this matrix was derived from a seed CRM and contained high MW DNA. This resulted in a sample to which a DNA extraction method was applied aiming to extract both the bulk of the low MW (non-GM) soybean DNA and the high MW 44406 soybean DNA with similar efficiencies. Although no experimental evidence is available, it would not be unexpected that some extraction methods and commercial kits for DNA purification would favour the recovery of higher MW DNA at the expense of the low MW fraction. Similarly, it may be envisaged that certain resins used in commercial purification columns do not efficiently bind the low MW DNA, and this may affect the balance between the (high MW) GM DNA and the (low MW) taxon-specific DNA.
The unsatisfactory performance for event 44406 corresponded to 4 overestimated results (> 1.95 m/m %) and one underestimated result (0.15 m/m %). Overestimation of the 44406 content may be due to a lower extraction efficiency or recovery of the taxon-specific DNA from the soy milk powder as a result of an inefficient precipitation of small DNA fragments or inefficient binding to the polymers used in commercial kits. Among the laboratories who have obtained an unsatisfactory performance expressed as z score, two had used a CTAB procedure, one the NucleoSpin Plant kit, and from the remaining two no information was available (questionnaire not submitted). Plotting the results from all participants against the DNA extraction method used showed that CTAB extraction (N = 21) resulted in 2 unsatisfactory results and 1 questionable result, NucleoSpin Food kit gave one questionable result while the other were satisfactory (N = 12), and Biotecon Foodproof gave 2 questionable results among N = 3 (and 1 additional questionable result was obtained by a laboratory reporting use of both NucleoSpin Plant and Biotecon Foodproof). All other extraction methods, when this information was reported in the questionnaire, gave satisfactory results. During a training workshop on DNA extraction that was organised by the EURL GMFF in June 2017, several participants had also communicated that quite deviating results were obtained on this soy milk matrix when using different DNA extraction methods. However, based on this evaluation and similar comparisons done for previous CT rounds, no firm conclusions could be taken with regard to the (un)suitability of certain DNA extraction methods for application to particular food or feed materials.
For VCO-1981, which was a seed-based matrix, and therefore it was easier to extract good quality DNA, the results reported were all very close to the assigned value of 1.0 m/m %. The σpt-log used to calculate the z scores was in this case clearly larger than the true standard deviation of the reported results, which explains the absence of results that were not satisfactory.
EURL GMFF: Comparative testing report
No 0012
15/44
4.4.4.2 ζ scores
Tables A4.1 and A4.2 also show the ζ scores obtained by the laboratories. A total of 35 laboratories were given a satisfactory performance when expressed as ζ score for 44406 (N = 63), 9 a questionable score and 19 an unsatisfactory score. For VCO-1981 (N = 55), 44 laboratories performed satisfactorily, 4 questionable and 7 unsatisfactorily. As explained in Section 4.4.3, a bad ζ score may be due to a result that strongly deviates from the assigned value (and has therefore also yielded an unsatisfactory performance when expressed as a z score) or it may indicate an underestimation of the measurement uncertainty of the result.
In Figures A4.1 and A4.2 (Annex 4) the reported measurement uncertainties can easily be compared between the participants; the figures also allow verification if the uncertainty bars overlap with the horizontal dashed line that corresponds to the satisfactory interval for the z scores. For 44406 soybean, it is clear that L36 has strongly overestimated its measurement uncertainty, and to a minor extent this also applies to L37, although they both obtained a satisfactory ζ score because their reported values were close to the assigned value. The same can be said for the VCO-1981 result reported by L86. Both L32 and L60 also reported quite large measurement uncertainties for 44406 soybean (and obtained unsatisfactory z and ζ scores), but this cannot be seen in the graph because their reported result (Xi) was also large (and this is the denominator in formula (6)). From the same figures, it can easily be seen that several laboratories have reported a too low measurement uncertainty (or no uncertainty at all) and therefore received an unsatisfactory ζ score; e.g. if L49 and L81 would have reported a realistic measurement uncertainty, and if L8, L31 and L71 would have reported an uncertainty value at all, they would have obtained a satisfactory ζ score for 44406 (Figure A4.1). Similarly, for VCO-1981 (Figure A4.2), L10, L31 and L71 have not reported the measurement uncertainty, and the results of L49, L62 and L66 would have been satisfactory if they had reported a more realistic measurement uncertainty.
As a general guideline, standard measurement uncertainties for both GM events below the measurement uncertainty of the assigned value (i.e. < 0.04 m/m % on the raw scale) are probably underestimated, while values above 1.5 times the robust standard deviation of the (NRL) results, i.e. above 0.35 m/m % for 44406 and above 0.25 m/m % for VCO-1981, may be overestimated(20).
EURL GMFF: Comparative testing report
No 0012
16/44
5 Conclusions
Participants in this CT round were required to analyse two test items varying in composition and complexity. The analytical tasks resembled the routine operational analysis tasks of an official control laboratory analysing a food or feed material for the presence of material derived from, containing, or consisting of GMOs.
The results reported by the participants were analysed and a performance evaluation was carried out taking into account both the qualitative and the quantitative results reported. The majority of the participants performed satisfactorily for all tasks in this CT round, i.e. the detection and quantification of the soybean event 44406 in T1, a soya milk powder, and VCO-1981 maize in T2, a maize flour. All participants who tested for the events were able to identify the correct events in both test items. Regarding quantification, five laboratories, including one NRL/882, obtained an unsatisfactory z score for 44406 soybean measurements in a more difficult food matrix. All laboratories demonstrated a satisfactory performance for quantification of event VCO-1981 in the T2 matrix.
While all laboratories demonstrated a satisfactory performance for analysis of a relatively simple matrix (T2), the challenging matrix of T1 affected the performance of some of the laboratories for quantification of the event in T1. The soy milk powder of test item T1 was also somewhat artificial in terms of the combination of low MW soybean DNA and high MW DNA from the spiked 44406 soybean.
One third of the participants had not provided a quantitative result, including 6 and 5 NRL/882 for events 44406 and VCO-1981, respectively.
All participants and NRL/882 specifically are reminded that under EU legislation it is mandatory to be able to identify and quantify all GM events that are authorised in the EU or for which the authorisation is pending or has expired, or to have a procedure in place to delegate such tasks to another laboratory.
EURL GMFF: Comparative testing report
No 0012
17/44
Acknowledgements
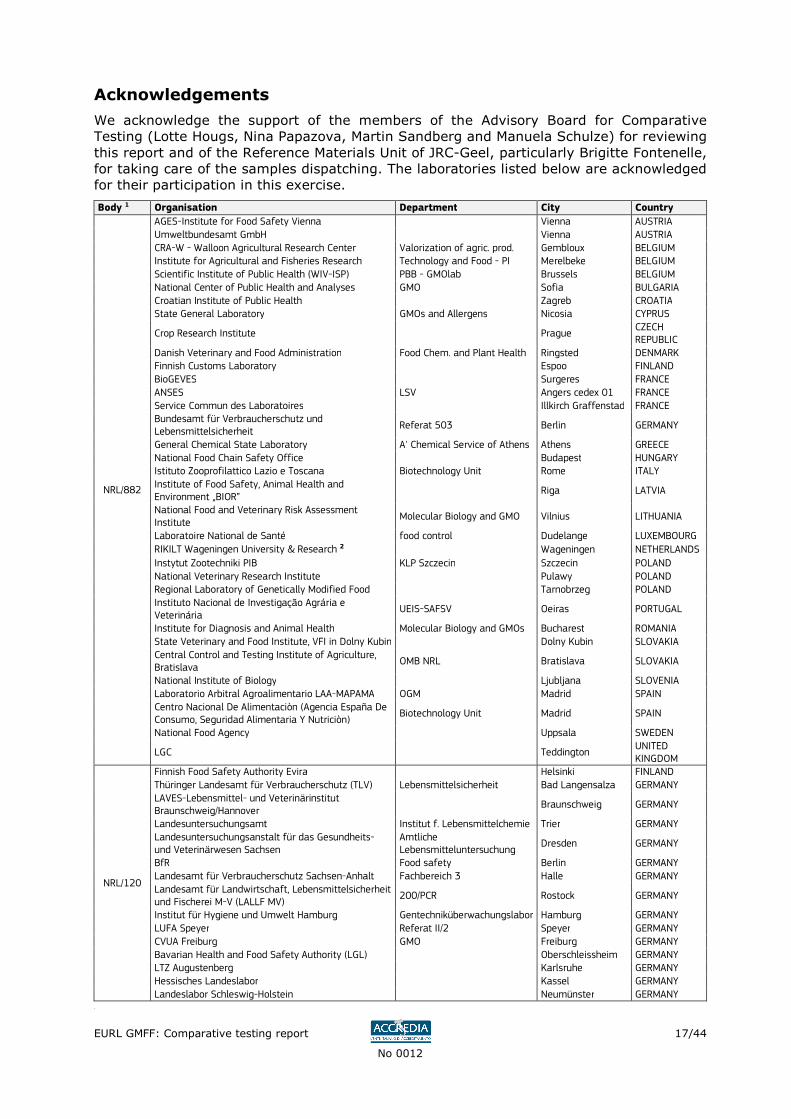
We acknowledge the support of the members of the Advisory Board for Comparative Testing (Lotte Hougs, Nina Papazova, Martin Sandberg and Manuela Schulze) for reviewing this report and of the Reference Materials Unit of JRC-Geel, particularly Brigitte Fontenelle, for taking care of the samples dispatching. The laboratories listed below are acknowledged for their participation in this exercise.
Body 1 Organisation Department City Country
NRL/882
AGES-Institute for Food Safety Vienna Vienna AUSTRIA Umweltbundesamt GmbH Vienna AUSTRIA CRA-W - Walloon Agricultural Research Center Valorization of agric. prod. Gembloux BELGIUM Institute for Agricultural and Fisheries Research Technology and Food - PI Merelbeke BELGIUM Scientific Institute of Public Health (WIV-ISP) PBB - GMOlab Brussels BELGIUM National Center of Public Health and Analyses GMO Sofia BULGARIA Croatian Institute of Public Health Zagreb CROATIA State General Laboratory GMOs and Allergens Nicosia CYPRUS
Crop Research Institute Prague CZECH REPUBLIC
Danish Veterinary and Food Administration Food Chem. and Plant Health Ringsted DENMARK Finnish Customs Laboratory Espoo FINLAND BioGEVES Surgeres FRANCE ANSES LSV Angers cedex 01 FRANCE Service Commun des Laboratoires Illkirch Graffenstad FRANCE Bundesamt für Verbraucherschutz und Lebensmittelsicherheit
Referat 503 Berlin GERMANY
General Chemical State Laboratory A' Chemical Service of Athens Athens GREECE National Food Chain Safety Office Budapest HUNGARY Istituto Zooprofilattico Lazio e Toscana Biotechnology Unit Rome ITALY Institute of Food Safety, Animal Health and Environment „BIOR”
Riga LATVIA
National Food and Veterinary Risk Assessment Institute
Molecular Biology and GMO Vilnius LITHUANIA
Laboratoire National de Santé food control Dudelange LUXEMBOURG
RIKILT Wageningen University & Research 2 Wageningen NETHERLANDS
Instytut Zootechniki PIB KLP Szczecin Szczecin POLAND National Veterinary Research Institute Pulawy POLAND Regional Laboratory of Genetically Modified Food Tarnobrzeg POLAND Instituto Nacional de Investigação Agrária e Veterinária
UEIS-SAFSV Oeiras PORTUGAL
Institute for Diagnosis and Animal Health Molecular Biology and GMOs Bucharest ROMANIA State Veterinary and Food Institute, VFI in Dolny Kubin Dolny Kubin SLOVAKIA Central Control and Testing Institute of Agriculture, Bratislava
OMB NRL Bratislava SLOVAKIA
National Institute of Biology Ljubljana SLOVENIA Laboratorio Arbitral Agroalimentario LAA-MAPAMA OGM Madrid SPAIN Centro Nacional De Alimentaciòn (Agencia España De Consumo, Seguridad Alimentaria Y Nutriciòn)
Biotechnology Unit Madrid SPAIN
National Food Agency Uppsala SWEDEN
LGC Teddington UNITED KINGDOM
NRL/120
Finnish Food Safety Authority Evira Helsinki FINLAND Thüringer Landesamt für Verbraucherschutz (TLV) Lebensmittelsicherheit Bad Langensalza GERMANY LAVES-Lebensmittel- und Veterinärinstitut Braunschweig/Hannover
Braunschweig GERMANY
Landesuntersuchungsamt Institut f. Lebensmittelchemie Trier GERMANY Landesuntersuchungsanstalt für das Gesundheits- und Veterinärwesen Sachsen
Amtliche Lebensmitteluntersuchung
Dresden GERMANY
BfR Food safety Berlin GERMANY Landesamt für Verbraucherschutz Sachsen-Anhalt Fachbereich 3 Halle GERMANY Landesamt für Landwirtschaft, Lebensmittelsicherheit und Fischerei M-V (LALLF MV)
200/PCR Rostock GERMANY
Institut für Hygiene und Umwelt Hamburg Gentechniküberwachungslabor Hamburg GERMANY LUFA Speyer Referat II/2 Speyer GERMANY CVUA Freiburg GMO Freiburg GERMANY Bavarian Health and Food Safety Authority (LGL) Oberschleissheim GERMANY LTZ Augustenberg Karlsruhe GERMANY Hessisches Landeslabor Kassel GERMANY Landeslabor Schleswig-Holstein Neumünster GERMANY
0
EURL GMFF: Comparative testing report
No 0012
18/44
Body Organisation Department City Country
NRL/120 cont.
Staatliche Betriebsgesellschaft für Umwelt und Landwirtschaft
GB 6, Fachbereich 63 Nossen GERMANY
Istituto Superiore di Sanità DSPVSA Rome ITALY
CREA-SCS Sede di Tavazzano, Laboratorio
Tavazzano (LO) ITALY
Netherlands Food and Consumer Product Safety Authority (NVWA)
Laboratorium VV Wageningen NETHERLANDS
Plant Breeding and Acclimatization Institute NRI GMO Controlling Laboratory Blonie POLAND
Fera Science Ltd Plants York UNITED KINGDOM
SASA Scottish Government Seed certification Edinburgh UNITED KINGDOM
Non-NRL
FASFC Melle GMO Melle BELGIUM
Laboratório Nacional Agropecuário - LANAGRO/MG Pedro Leopoldo/MG BRAZIL
Ministry of Agriculture, Livestock and Food Supply Official Laboratory of Goiás Goiania BRAZIL
Executive Environment Agency LBM and GMO Sofia BULGARIA
Laboratory of SGS Bulgaria Ltd Varna BULGARIA
Instituto Nacional de Vigilancia de Medicamentos y Alimentos Invima
Laboratorio OGM Bogotá COLOMBIA
Croatian Centre for Agriculture, Food and Rural Affairs, Institute for Seed and Seedlings
Non-NRL Osijek CROATIA
Chemical and Veterinary Analytical Institute Muensterland-Emscher-Lippe
Münster GERMANY
Biomi Ltd. Godollo HUNGARY
IZSLER Brescia ITALY
Istituto Sperimentale Del Piemonte, Liguria e Valle D'Aosta
S.C. Biotechnologie Torino ITALY
Istituto Zooprofilattico Sperimentale Del Mezzogiorno Food Control Portici ITALY
Department of Chemistry Malaysia Biotechnology Section Petaling Jaya MALAYSIA
SENASICA-CNRDOGM Detección de OGM Tecámac MEXICO
Wojewodzki Inspektorat Weterynarii Zaklad Higieny Weterynaryjnej Opole POLAND
Laboratorul Central pentru Calitatea Semintelor si a Materialului Saditor Bucuresti
LEDOMG Bucuresti ROMANIA
SP Laboratorija a.d. Genetical dpt. Becej SERBIA
Agri-Food & Veterinary Authority of Singapore Veterinary Public Health Labor Singapore SINGAPORE
University of the Free State GMO Testing Facility G2 Bloemfontein SOUTH AFRICA
Federal Food Safety and Veterinary Office FSVO Risk Assessment Division Bern SWITZERLAND
Agroscope Feed Analytics Posieux SWITZERLAND
DNA Technology Laboratory Nakorn Pathom THAILAND
National Gene Bank of Tunisia GMO testing Laboratory Tunis TUNISIA
National Food Reference Laboratory Biotechnology and GMO Unit Ankara TURKEY
Ankara Food Control Laboratory Molecular Biology Ankara TURKEY
Ukrmetrteststandart Molecular Biology Kiev UKRAINE
Ukrainian Laboratory of Quality and Safety of Agricultural Products (ULQSAP)
Chabany village UKRAINE
Worcestershire Scientific Services Worcester UNITED KINGDOM
USDA-GIPSA Biotechnology Laboratory Kansas City UNITED STATES
Agricultural Genetics Institute GMO Detection 04 VIETNAM
National Institute for Food Control Quality management Ha Noi VIETNAM
Quality Assurance and Testing Center 3 (QUATEST 3) Microbiology – GMO Testing Lab
Bienhoa VIETNAM
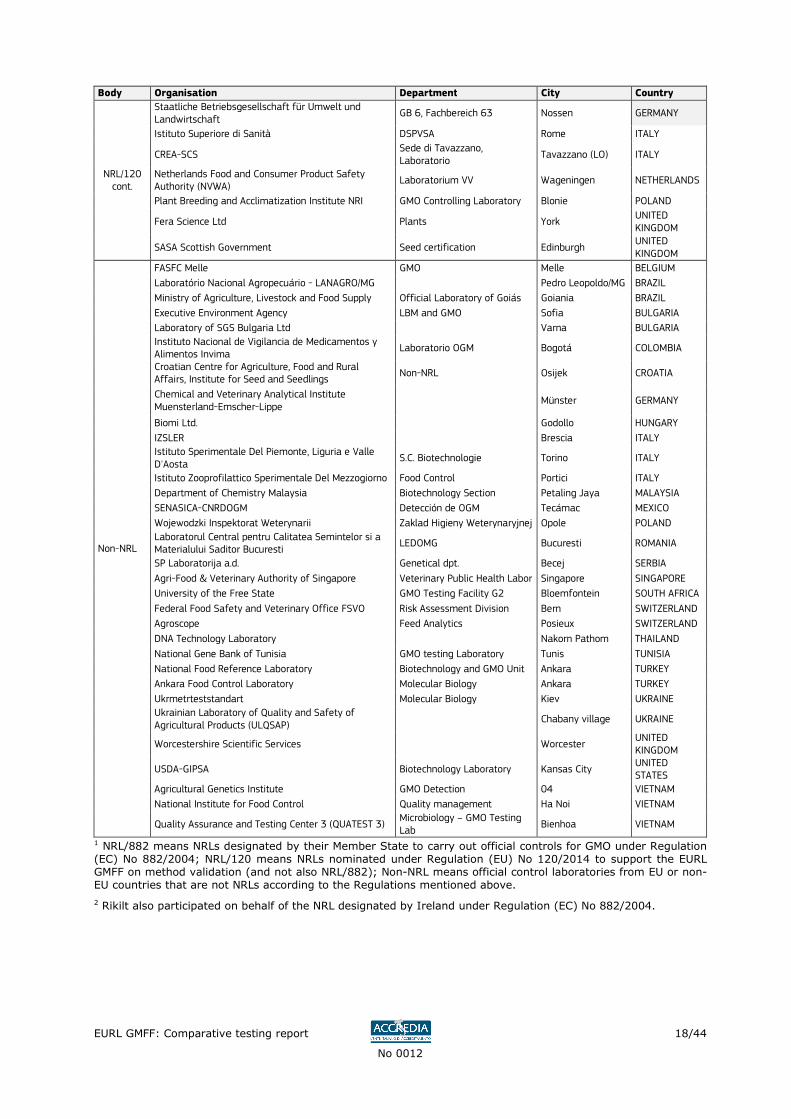
1 NRL/882 means NRLs designated by their Member State to carry out official controls for GMO under Regulation (EC) No 882/2004; NRL/120 means NRLs nominated under Regulation (EU) No 120/2014 to support the EURL GMFF on method validation (and not also NRL/882); Non-NRL means official control laboratories from EU or non-EU countries that are not NRLs according to the Regulations mentioned above.
2 Rikilt also participated on behalf of the NRL designated by Ireland under Regulation (EC) No 882/2004.
EURL GMFF: Comparative testing report
No 0012
19/44
References
(including those referred to in the Annexes)
1. European Commission (2003). Regulation (EC) No 1829/2003 of the European Parliament and of the Council of 22 September 2003 on genetically modified food and feed. Off. J. Eur. Union L 268: 1-23
2. European Commission (2004). Regulation (EC) No 882/2004 of the European Parliament and of the Council of 29 April 2004 on official controls performed to ensure the verification of compliance with feed and food law, animal health and animal welfare rules. Off. J. Eur. Union L 191: 1-52
3. European Commission (2014). Commission Implementing Regulation (EU) No 120/2014 of 7 February 2014 amending Regulation (EC) No 1981/2006 on detailed rules for the implementation of Article 32 of Regulation (EC) No 1829/2003 of the European Parliament and the Council as regards the Community reference laboratory for genetically modified organisms. Off. J. Eur. Union L 39: 46-52
4. European Commission (2011). Commission Regulation (EU) No 619/2011 of 24 June 2011 laying down the methods of sampling and analysis for the official control of feed as regards presence of genetically modified material for which an authorisation procedure is pending or the authorisation of which has expired. Off. J. Eur. Union L 166: 9-15
5. ISO/IEC 17043:2010 Conformity assessment – General requirements for proficiency testing. International Organization for Standardization, Geneva, Switzerland
6. Branquinho M.R., Ferreira R.T.B., Cardarelli-Leite P. (2012). Use of real-time PCR to evaluate two DNA extraction methods from food. Ciênc. Tecnol. Aliment., Campinas, 32:112-118
7. Jinapong N., Suphantharika M., Jamnong P. (2008) Production of instant soymilk powders by ultrafiltration, spray drying and fluidized bed agglomeration. J. Food Engineering 84: 194-205
8. Zobell, O., Kortekaas, A.M., Scaravelli, E., Contreras, M., Leys, H., Conneely, P., Corbisier, P., Trapmann, S. (2013) The certification of different mass fractions of DAS-44406-6 in soya seed powder: ERM®-BF436a, ERM®-BF436b, ERM®-BF436c, ERM®-BF436d and ERM®-BF436e. EC certification report EUR 25997 EN, ISBN 978-92-79-30492-7
9. Rosa, S.F., Gatto, F., Angers-Loustau, A., Petrillo, M., Kreysa, J., Querci, M. (2016) Development and applicability of a ready-to-use PCR system for GMO screening. Food Chemistry 201: 110–119
10. Querci, M., Foti, N., Bogni, B., Kluga, L., Broll, H. & Van den Eede, G. (2009). Real-time PCR-based ready-to-use multi-target analytical system for GMO detection. Food Anal. Methods 2: 325-336
11. ISO Guide 34:2009 General requirements for the competence of reference material producers. International Organization for Standardization, Geneva, Switzerland
12. Kortekaas, A.M., Mazoua, S., Seghers, J., Leys, H., Corbisier, P., Dimitrievska, B., Trapmann, S. (2015) The certification of different mass fractions of VCO-Ø1981-5 in maize seed powder. Certified Reference Materials ERM®-BF438a, ERM®-BF438b, ERM®-BF438c, ERM®-BF438d and ERM®-BF438e. EC certification report EUR 27409 EN, ISBN 978-92-79-50553-9
13. European Union Reference Laboratory for Genetically Modified Food and Feed (2011). Technical guidance document from the European Union Reference Laboratory for Genetically Modified Food and Feed on the implementation of Commission Regulation (EU) No 619/2011 (http://gmo-crl.jrc.ec.europa.eu/guidancedocs.htm)
EURL GMFF: Comparative testing report
No 0012
20/44
14. Corbisier P., Barbante A., Berben G., Broothaerts W., De Loose M., Emons H., Georgieva Tz, Lievens A., Mazzara M., Papazova N., Perri E., Sowa S., Stebih D., Terzi V., Trapmann S. (2017) Recommendation for the unit of measurement and the measuring system to report traceable and comparable results expressing GM content in accordance with EU legislation. JRC Technical report (http://gmo-crl.jrc.ec.europa.eu/ENGL/docs/WG-UoM-Final-Report.pdf)
15. Analytical Methods Committee (1989). Robust statistics – How not to reject outliers Part 1. Basic Concepts. Analyst 114: 1359-1364
16. Analytical Methods Committee (2001). Robust statistics: a method for coping with outliers. AMC Technical Brief. No. 6. April 2001
17. Thompson, M., Ellison, S.L.R., Owen, L., Mathieson, K., Powell, J., Key, P., Wood, R., Damant, A.P. (2006). Scoring in Genetically Modified Organism Proficiency Tests Based on Log-Transformed Results. J. AOAC Int. 89: 232-239
18. Analytical Methods Committee (2004). GMO Proficiency Testing: Interpreting z scores derived from log-transformed data. RSC. AMC Technical Brief. No. 18. December 2004.
19. EURACHEM/CITAC Guide CG4 (2000). Quantifying Uncertainty in Analytical Measurement, 2nd edition
20. ISO 13528:2015 Statistical methods for use in proficiency testing by interlaboratory comparison. International Organization for Standardization, Geneva, Switzerland
21. ISO/IEC Guide 98-3:2008 (JCGM/WG1/100) Uncertainty of measurement - Part 3: Guide to the expression of uncertainty in measurement
22. Linsinger, T. (2010) Comparison of a measurement result with the certified value. Application Note 1. Luxemburg, Office for Official Publications of the European Communities (https://crm.jrc.ec.europa.eu)
23. Trapmann, S., Burns, M., Broll, H., Macarthur, R., Wood, R., Zel, J. (2009). Guidance Document on Measurement Uncertainty for GMO Testing Laboratories. Luxembourg, Office for Official Publications of the European Communities, EUR 22756 EN/2-2009
24. Corbisier, P, Zobell, O., Trapmann, S., Auclair, G. and Emons, H. (2014). Training Manual on GMO Quantification: Proper Calibration and Estimation of Measurement Uncertainty. Luxembourg, Publications Office of the European Union (doi:10.2787/10085)
25. Thompson, M., Wood, R. (1993). The international harmonized protocol for the proficiency testing of (chemical) analytical laboratories. J. AOAC Int. 76: 926-940
26. Powell, J., Owen, L. (2002). Reliability of Food Measurements: The Application of Proficiency Testing to GMO Analysis. Accred. Qual. Ass. 7: 392-402
27. Linsinger, T.P.J., van der Veen, A.M.H., Gawlik, B.M., Pauwels, J., Lamberty, A. (2004). Planning and combining of isochronous stability studies of CRMs. Accred. Qual. Assur. 9: 464-472
EURL GMFF: Comparative testing report
No 0012
21/44
List of tables
(Table numbers preceded by an "A" refer to tables in an Annex)
Table 1. Characteristics of the base materials used for preparation of test item 1 (T1). ... 4
Table 2. Characteristics of test item 2 (T2). ............................................................... 5
Table 3. Invitation and participation to the comparative testing round CT 01/17. ............ 7
Table 4. Overview of participants to CT 01/17 by country and category. ........................ 8
Table 5. Summary of the main answers provided in the questionnaire of CT 01/17. ........ 9
Table 6. Summary of GM event identification results of the participants as reported in the questionnaire or (in brackets) inferred from the quantitative result reported. ................ 10
Table 7. Number of laboratories reporting a quantitative GM event-specific result. ........ 11
Table 8. Overview of assigned values and uncertainties for the GM events in T1 and T2. 12
Table 9. Evaluation of laboratory performance for GM event quantification through z scores. ................................................................................................................. 14
Table A3.1. Performance of the participants for the qualitative identification of GM events in comparative test EURL-GMFF-CT-01/17. ............................................................... 32
Table A4.1. Quantitative results (in m/m %) and performance scores of participants for 44406 soybean in soya milk powder (T1)1. ............................................................... 33
Table A4.2. Quantitative results (in m/m %) and performance scores of participants for VCO-1981 maize in maize flour (T2). ....................................................................... 35
List of figures
(Figure numbers preceded by an "A" refer to figures in an Annex)
Figure A4.1. Laboratory results for soybean event 44406 in test item 1. ..................... 37
Figure A4.2. Laboratory results for maize event VCO-1981 in test item 2. ................... 38
EURL GMFF: Comparative testing report
No 0012
22/44
Annexes
Annex 1. Homogeneity and stability of test items
A1.1 Homogeneity of test items
The homogeneity of T2 was confirmed during the certification of this CRM.
The assessment of the homogeneity(20) of T1 was performed after the test item had been packed in its final form and before distribution to participants, using the following acceptance criterion:
pts .s σ30≤ (A1.1)
Where ss is the between-test item standard deviation as determined by a 1-way random
effects ANOVA(25) and σpt is the standard deviation for comparative testing. The value of σpt, the target standard deviation for comparative testing, was defined by the Members of the Advisory Board on the basis of the experience acquired in previous CT rounds, and set to 0.15 on the log domain(26). On a raw data scale, this σpt value corresponds to approximately 0.15 m/m % (30 % of xpt).
If the criterion according to A1.1 is met (i.e. ss ≤ 0.045), the between-test item standard
deviation contributes no more than about 10 % to the standard deviation for comparative testing.
The repeatability of the test method is the square root of the mean sum of squares within-test items MSwithin. The relative between-test item standard deviation ss,rel is given by
%100, ×
−
=yn
MSMS
s
withinbetween
rels (A1.2)
where: MSbetween is the mean sum of squares between test items MSwithin is the mean sum of squares within test items n is the number of replicates for each sample
y is the mean of the homogeneity data
If MSwithin > MSbetween, then:
( )%100
12
4
*, ×−==
y
nNn
ityrepeatabil
us bbrels (A1.3)
where: u*bb is the maximum uncertainty contribution that can be obtained by the hidden heterogeneity of the material.
Seven bottles (N = 7) were randomly selected and analysed in five replicates (n = 5). The between-test item standard deviation was 0.024 m/m %. The criterion described in formula (A1.1) was fulfilled (0.024 < 0.045), indicating that T1 was homogeneous.
A1.2 Stability of test items
For T1, an isochronous short-term stability study(27) involving two test samples with three replicates each (N = 2, n = 3) was conducted over two and four weeks at +4 °C, +18 °C and +60 °C. The 44406 soybean mass fraction was measured by qPCR. The measurements were performed under intermediate precision conditions with respect to the PCR plates.
EURL GMFF: Comparative testing report
No 0012
23/44
The results did not reveal any influence of time or storage at +4 °C or +18 °C on the stability of the test item (compared to storage at -70 °C) with regard to soybean event 44406. Even at 60 °C, no significant trend was measured.
The test items were shipped at ambient temperature.
The stability of T1 during the period covered by the CT was tested by analysing, simultaneously on one PCR plate, two units (N = 2, n = 3) stored either at the normal storage temperature (4 °C) or at a reference temperature (-70 °C). The evaluation was based on the results ratio between samples stored at 4 °C and -70 °C. The data were evaluated against storage time and regression lines were calculated. The slopes of the regression lines were tested for statistical significance (loss/increase due to storage). No significant trend was detected at a 95 % confidence level. The T1 material can, therefore, be stored at 4 °C and was stable during the period covered by this CT.
The stability of T2 was ensured as part of the post-certification stability monitoring of ERM-BF438. Measurements were performed simultaneously on one PCR plate as described for T1, on units stored at the normal storage temperature (4 °C) and at a reference temperature (-70 °C). No significant trend was detected at a 95 % confidence level. The T2 material can, therefore, be stored at 4 °C and was stable during the period covered by this CT.
EURL GMFF: Comparative testing report
No 0012
24/44
Annex 2: Questionnaire data
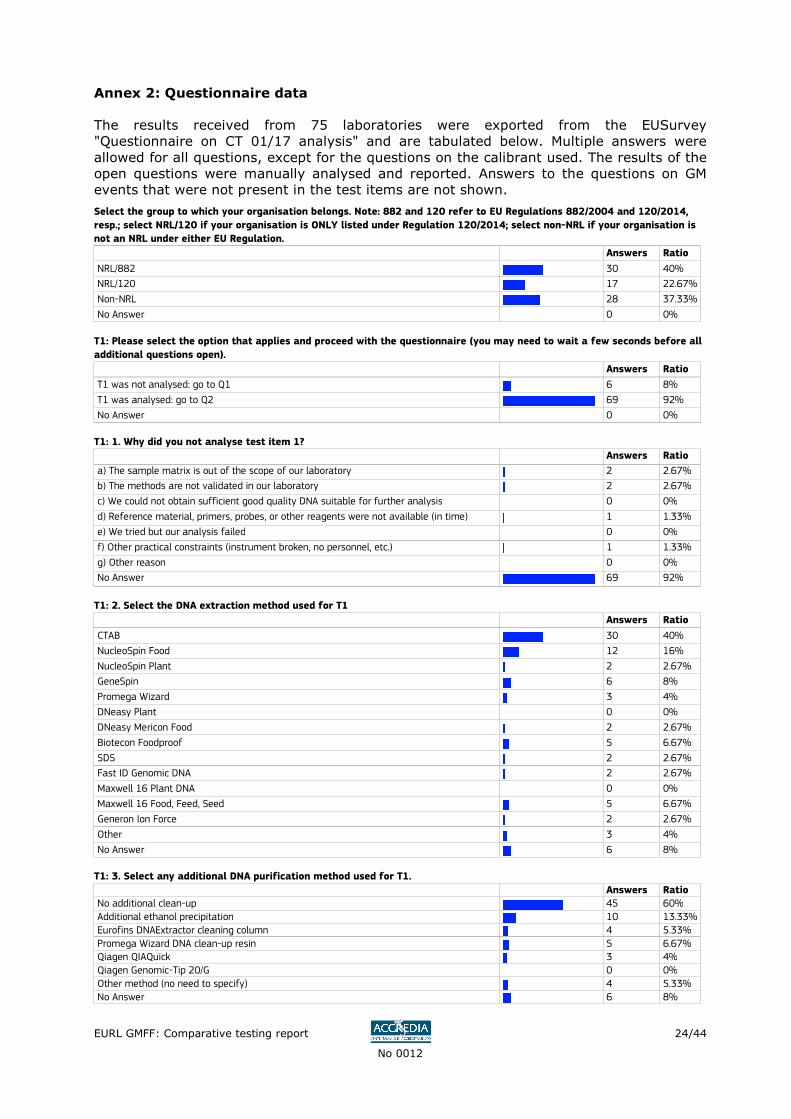
The results received from 75 laboratories were exported from the EUSurvey "Questionnaire on CT 01/17 analysis" and are tabulated below. Multiple answers were allowed for all questions, except for the questions on the calibrant used. The results of the open questions were manually analysed and reported. Answers to the questions on GM events that were not present in the test items are not shown.
Select the group to which your organisation belongs. Note: 882 and 120 refer to EU Regulations 882/2004 and 120/2014,
resp.; select NRL/120 if your organisation is ONLY listed under Regulation 120/2014; select non-NRL if your organisation is
not an NRL under either EU Regulation.
Answers Ratio
NRL/882 30 40%
NRL/120 17 22.67%
Non-NRL 28 37.33%
No Answer 0 0%
T1: Please select the option that applies and proceed with the questionnaire (you may need to wait a few seconds before all
additional questions open).
Answers Ratio
T1 was not analysed: go to Q1 6 8%
T1 was analysed: go to Q2 69 92%
No Answer 0 0%
T1: 1. Why did you not analyse test item 1?
Answers Ratio
a) The sample matrix is out of the scope of our laboratory 2 2.67%
b) The methods are not validated in our laboratory 2 2.67%
c) We could not obtain sufficient good quality DNA suitable for further analysis 0 0%
d) Reference material, primers, probes, or other reagents were not available (in time) 1 1.33%
e) We tried but our analysis failed 0 0%
f) Other practical constraints (instrument broken, no personnel, etc.) 1 1.33%
g) Other reason 0 0%
No Answer 69 92%
T1: 2. Select the DNA extraction method used for T1
Answers Ratio
CTAB 30 40%
NucleoSpin Food 12 16%
NucleoSpin Plant 2 2.67%
GeneSpin 6 8%
Promega Wizard 3 4%
DNeasy Plant 0 0%
DNeasy Mericon Food 2 2.67%
Biotecon Foodproof 5 6.67%
SDS 2 2.67%
Fast ID Genomic DNA 2 2.67%
Maxwell 16 Plant DNA 0 0%
Maxwell 16 Food, Feed, Seed 5 6.67%
Generon Ion Force 2 2.67%
Other 3 4%
No Answer 6 8%
T1: 3. Select any additional DNA purification method used for T1.
Answers Ratio
No additional clean-up 45 60%
Additional ethanol precipitation 10 13.33%
Eurofins DNAExtractor cleaning column 4 5.33%
Promega Wizard DNA clean-up resin 5 6.67% Qiagen QIAQuick 3 4%
Qiagen Genomic-Tip 20/G 0 0%
Other method (no need to specify) 4 5.33%
No Answer 6 8%
EURL GMFF: Comparative testing report
No 0012
25/44
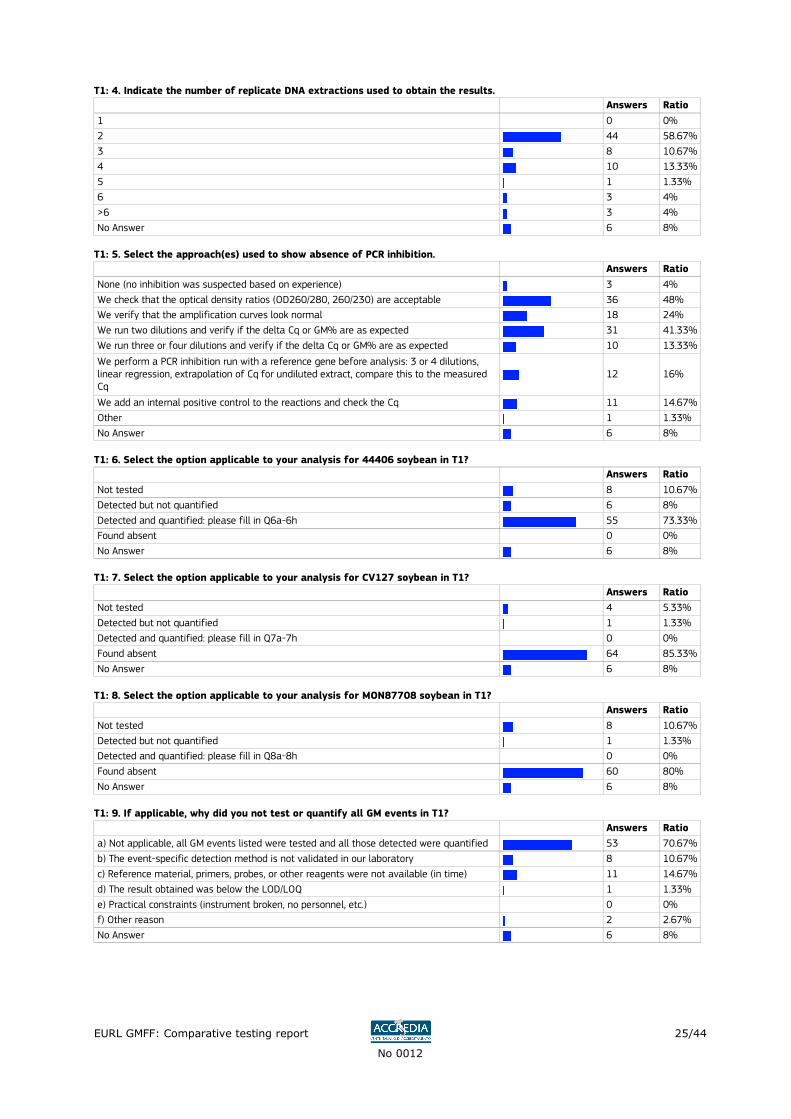
T1: 4. Indicate the number of replicate DNA extractions used to obtain the results.
Answers Ratio
1 0 0%
2 44 58.67%
3 8 10.67%
4 10 13.33%
5 1 1.33%
6 3 4%
>6 3 4%
No Answer 6 8%
T1: 5. Select the approach(es) used to show absence of PCR inhibition.
Answers Ratio
None (no inhibition was suspected based on experience) 3 4%
We check that the optical density ratios (OD260/280, 260/230) are acceptable 36 48%
We verify that the amplification curves look normal 18 24%
We run two dilutions and verify if the delta Cq or GM% are as expected 31 41.33%
We run three or four dilutions and verify if the delta Cq or GM% are as expected 10 13.33%
We perform a PCR inhibition run with a reference gene before analysis: 3 or 4 dilutions, linear regression, extrapolation of Cq for undiluted extract, compare this to the measured Cq
12 16%
We add an internal positive control to the reactions and check the Cq 11 14.67%
Other 1 1.33%
No Answer 6 8%
T1: 6. Select the option applicable to your analysis for 44406 soybean in T1?
Answers Ratio
Not tested 8 10.67%
Detected but not quantified 6 8%
Detected and quantified: please fill in Q6a-6h 55 73.33%
Found absent 0 0%
No Answer 6 8%
T1: 7. Select the option applicable to your analysis for CV127 soybean in T1?
Answers Ratio
Not tested 4 5.33%
Detected but not quantified 1 1.33%
Detected and quantified: please fill in Q7a-7h 0 0%
Found absent 64 85.33%
No Answer 6 8%
T1: 8. Select the option applicable to your analysis for MON87708 soybean in T1?
Answers Ratio
Not tested 8 10.67%
Detected but not quantified 1 1.33%
Detected and quantified: please fill in Q8a-8h 0 0%
Found absent 60 80%
No Answer 6 8%
T1: 9. If applicable, why did you not test or quantify all GM events in T1?
Answers Ratio
a) Not applicable, all GM events listed were tested and all those detected were quantified 53 70.67%
b) The event-specific detection method is not validated in our laboratory 8 10.67%
c) Reference material, primers, probes, or other reagents were not available (in time) 11 14.67%
d) The result obtained was below the LOD/LOQ 1 1.33%
e) Practical constraints (instrument broken, no personnel, etc.) 0 0%
f) Other reason 2 2.67%
No Answer 6 8%
EURL GMFF: Comparative testing report
No 0012
26/44
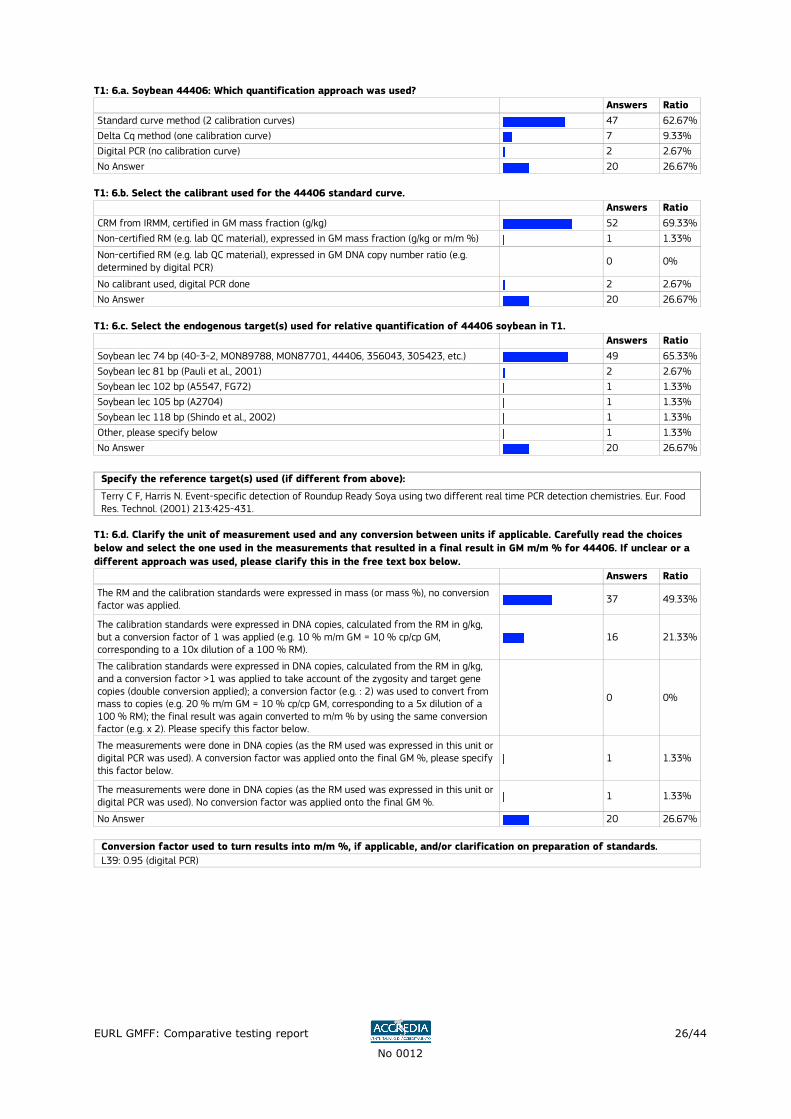
T1: 6.a. Soybean 44406: Which quantification approach was used?
Answers Ratio
Standard curve method (2 calibration curves) 47 62.67%
Delta Cq method (one calibration curve) 7 9.33%
Digital PCR (no calibration curve) 2 2.67%
No Answer 20 26.67%
T1: 6.b. Select the calibrant used for the 44406 standard curve.
Answers Ratio
CRM from IRMM, certified in GM mass fraction (g/kg) 52 69.33%
Non-certified RM (e.g. lab QC material), expressed in GM mass fraction (g/kg or m/m %) 1 1.33%
Non-certified RM (e.g. lab QC material), expressed in GM DNA copy number ratio (e.g. determined by digital PCR)
0 0%
No calibrant used, digital PCR done 2 2.67%
No Answer 20 26.67%
T1: 6.c. Select the endogenous target(s) used for relative quantification of 44406 soybean in T1.
Answers Ratio
Soybean lec 74 bp (40-3-2, MON89788, MON87701, 44406, 356043, 305423, etc.) 49 65.33%
Soybean lec 81 bp (Pauli et al., 2001) 2 2.67%
Soybean lec 102 bp (A5547, FG72) 1 1.33%
Soybean lec 105 bp (A2704) 1 1.33%
Soybean lec 118 bp (Shindo et al., 2002) 1 1.33%
Other, please specify below 1 1.33%
No Answer 20 26.67%
Specify the reference target(s) used (if different from above):
Terry C F, Harris N. Event-specific detection of Roundup Ready Soya using two different real time PCR detection chemistries. Eur. Food Res. Technol. (2001) 213:425-431.
T1: 6.d. Clarify the unit of measurement used and any conversion between units if applicable. Carefully read the choices
below and select the one used in the measurements that resulted in a final result in GM m/m % for 44406. If unclear or a
different approach was used, please clarify this in the free text box below.
Answers Ratio
The RM and the calibration standards were expressed in mass (or mass %), no conversion factor was applied. 37 49.33%
The calibration standards were expressed in DNA copies, calculated from the RM in g/kg, but a conversion factor of 1 was applied (e.g. 10 % m/m GM = 10 % cp/cp GM, corresponding to a 10x dilution of a 100 % RM).
16 21.33%
The calibration standards were expressed in DNA copies, calculated from the RM in g/kg, and a conversion factor >1 was applied to take account of the zygosity and target gene copies (double conversion applied); a conversion factor (e.g. : 2) was used to convert from mass to copies (e.g. 20 % m/m GM = 10 % cp/cp GM, corresponding to a 5x dilution of a 100 % RM); the final result was again converted to m/m % by using the same conversion factor (e.g. x 2). Please specify this factor below.
0 0%
The measurements were done in DNA copies (as the RM used was expressed in this unit or digital PCR was used). A conversion factor was applied onto the final GM %, please specify this factor below.
1 1.33%
The measurements were done in DNA copies (as the RM used was expressed in this unit or digital PCR was used). No conversion factor was applied onto the final GM %. 1 1.33%
No Answer 20 26.67%
Conversion factor used to turn results into m/m %, if applicable, and/or clarification on preparation of standards.
L39: 0.95 (digital PCR)
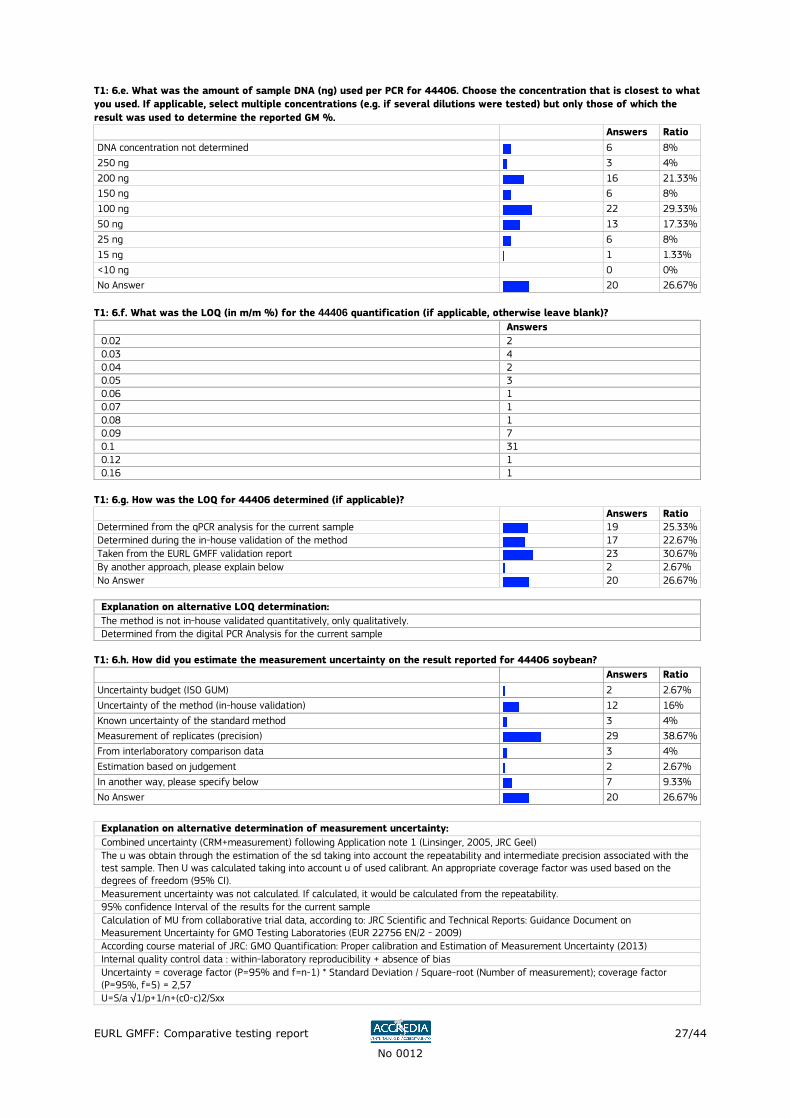
EURL GMFF: Comparative testing report
No 0012
27/44
T1: 6.e. What was the amount of sample DNA (ng) used per PCR for 44406. Choose the concentration that is closest to what
you used. If applicable, select multiple concentrations (e.g. if several dilutions were tested) but only those of which the
result was used to determine the reported GM %.
Answers Ratio
DNA concentration not determined 6 8%
250 ng 3 4%
200 ng 16 21.33%
150 ng 6 8%
100 ng 22 29.33%
50 ng 13 17.33%
25 ng 6 8%
15 ng 1 1.33%
<10 ng 0 0%
No Answer 20 26.67%
T1: 6.f. What was the LOQ (in m/m %) for the 44406 quantification (if applicable, otherwise leave blank)?
Answers
0.02 2 0.03 4 0.04 2 0.05 3 0.06 1 0.07 1 0.08 1 0.09 7 0.1 31 0.12 1 0.16 1
T1: 6.g. How was the LOQ for 44406 determined (if applicable)?
Answers Ratio
Determined from the qPCR analysis for the current sample 19 25.33% Determined during the in-house validation of the method 17 22.67%
Taken from the EURL GMFF validation report 23 30.67%
By another approach, please explain below 2 2.67%
No Answer 20 26.67%
Explanation on alternative LOQ determination:
The method is not in-house validated quantitatively, only qualitatively. Determined from the digital PCR Analysis for the current sample
T1: 6.h. How did you estimate the measurement uncertainty on the result reported for 44406 soybean?
Answers Ratio
Uncertainty budget (ISO GUM) 2 2.67%
Uncertainty of the method (in-house validation) 12 16%
Known uncertainty of the standard method 3 4%
Measurement of replicates (precision) 29 38.67%
From interlaboratory comparison data 3 4%
Estimation based on judgement 2 2.67%
In another way, please specify below 7 9.33%
No Answer 20 26.67%
Explanation on alternative determination of measurement uncertainty:
Combined uncertainty (CRM+measurement) following Application note 1 (Linsinger, 2005, JRC Geel) The u was obtain through the estimation of the sd taking into account the repeatability and intermediate precision associated with the test sample. Then U was calculated taking into account u of used calibrant. An appropriate coverage factor was used based on the degrees of freedom (95% CI). Measurement uncertainty was not calculated. If calculated, it would be calculated from the repeatability. 95% confidence Interval of the results for the current sample Calculation of MU from collaborative trial data, according to: JRC Scientific and Technical Reports: Guidance Document on Measurement Uncertainty for GMO Testing Laboratories (EUR 22756 EN/2 - 2009) According course material of JRC: GMO Quantification: Proper calibration and Estimation of Measurement Uncertainty (2013) Internal quality control data : within-laboratory reproducibility + absence of bias Uncertainty = coverage factor (P=95% and f=n-1) * Standard Deviation / Square-root (Number of measurement); coverage factor (P=95%, f=5) = 2,57 U=S/a √1/p+1/n+(c0-c)2/Sxx
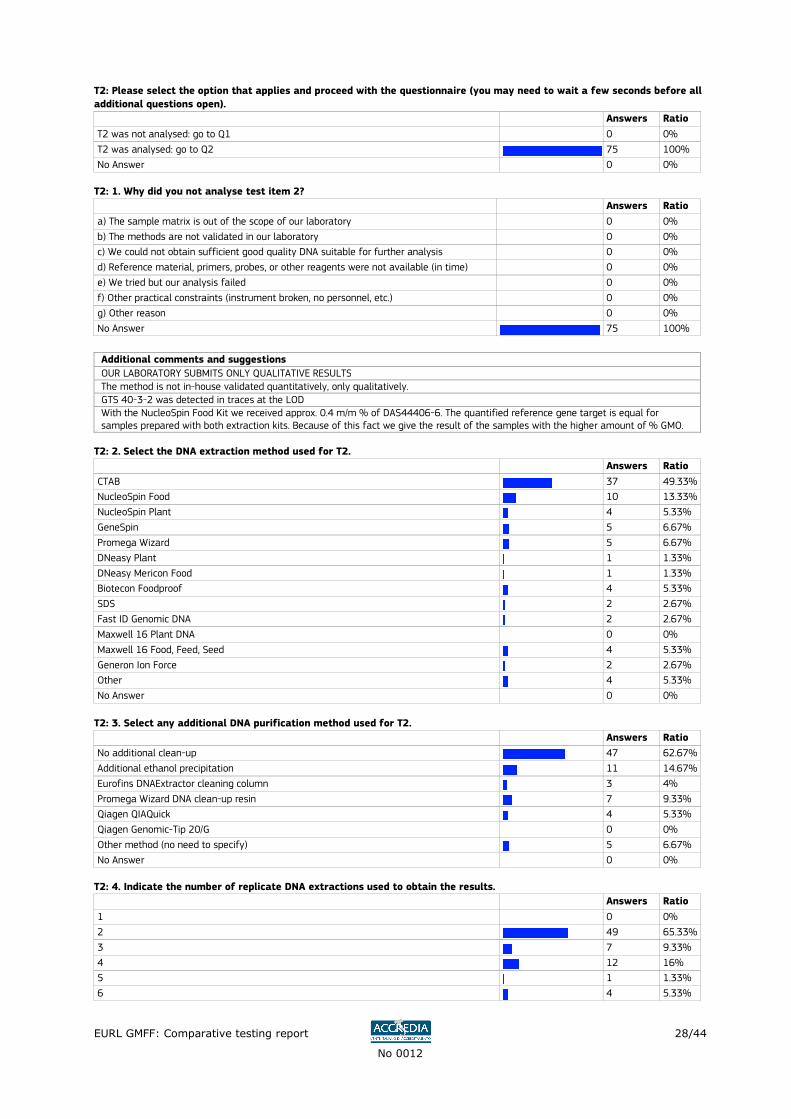
EURL GMFF: Comparative testing report
No 0012
28/44
T2: Please select the option that applies and proceed with the questionnaire (you may need to wait a few seconds before all
additional questions open).
Answers Ratio
T2 was not analysed: go to Q1 0 0%
T2 was analysed: go to Q2 75 100%
No Answer 0 0%
T2: 1. Why did you not analyse test item 2?
Answers Ratio
a) The sample matrix is out of the scope of our laboratory 0 0%
b) The methods are not validated in our laboratory 0 0%
c) We could not obtain sufficient good quality DNA suitable for further analysis 0 0%
d) Reference material, primers, probes, or other reagents were not available (in time) 0 0%
e) We tried but our analysis failed 0 0%
f) Other practical constraints (instrument broken, no personnel, etc.) 0 0%
g) Other reason 0 0%
No Answer 75 100%
Additional comments and suggestions
OUR LABORATORY SUBMITS ONLY QUALITATIVE RESULTS The method is not in-house validated quantitatively, only qualitatively. GTS 40-3-2 was detected in traces at the LOD With the NucleoSpin Food Kit we received approx. 0.4 m/m % of DAS44406-6. The quantified reference gene target is equal for samples prepared with both extraction kits. Because of this fact we give the result of the samples with the higher amount of % GMO.
T2: 2. Select the DNA extraction method used for T2.
Answers Ratio
CTAB 37 49.33%
NucleoSpin Food 10 13.33%
NucleoSpin Plant 4 5.33%
GeneSpin 5 6.67%
Promega Wizard 5 6.67%
DNeasy Plant 1 1.33%
DNeasy Mericon Food 1 1.33%
Biotecon Foodproof 4 5.33%
SDS 2 2.67%
Fast ID Genomic DNA 2 2.67%
Maxwell 16 Plant DNA 0 0%
Maxwell 16 Food, Feed, Seed 4 5.33%
Generon Ion Force 2 2.67%
Other 4 5.33%
No Answer 0 0%
T2: 3. Select any additional DNA purification method used for T2.
Answers Ratio
No additional clean-up 47 62.67%
Additional ethanol precipitation 11 14.67%
Eurofins DNAExtractor cleaning column 3 4%
Promega Wizard DNA clean-up resin 7 9.33%
Qiagen QIAQuick 4 5.33%
Qiagen Genomic-Tip 20/G 0 0%
Other method (no need to specify) 5 6.67%
No Answer 0 0%
T2: 4. Indicate the number of replicate DNA extractions used to obtain the results.
Answers Ratio
1 0 0%
2 49 65.33%
3 7 9.33%
4 12 16%
5 1 1.33%
6 4 5.33%
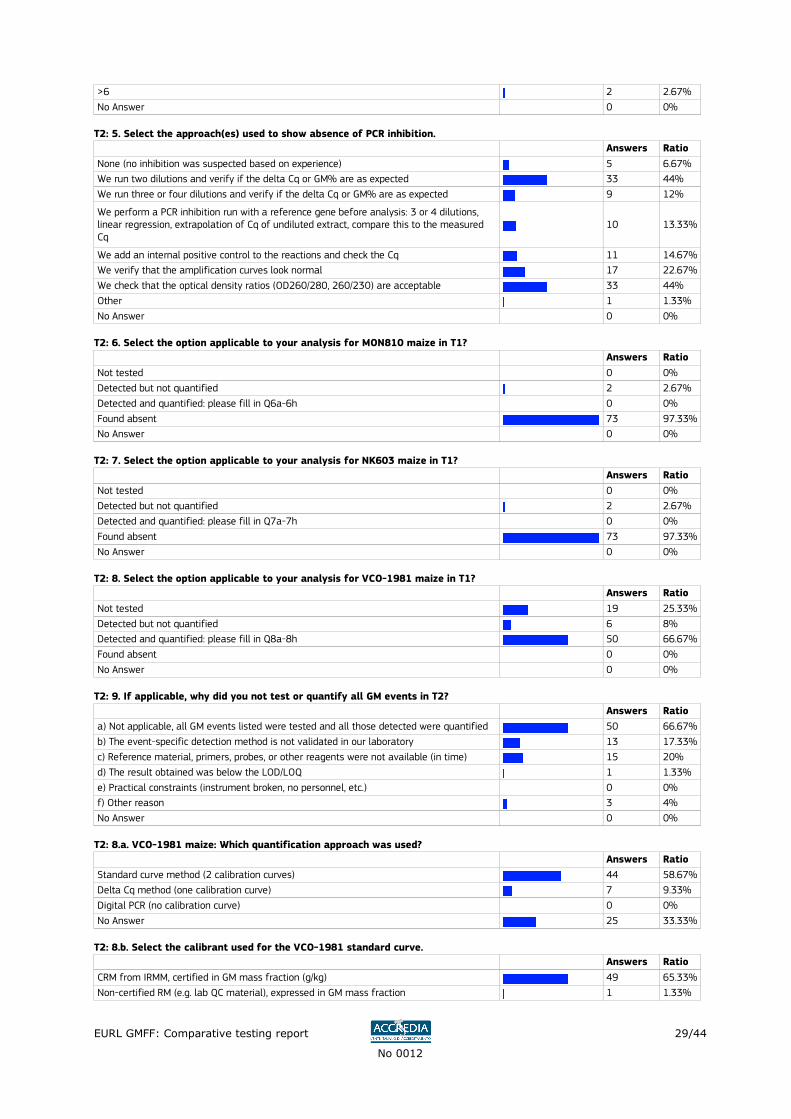
EURL GMFF: Comparative testing report
No 0012
29/44
>6 2 2.67%
No Answer 0 0%
T2: 5. Select the approach(es) used to show absence of PCR inhibition.
Answers Ratio
None (no inhibition was suspected based on experience) 5 6.67%
We run two dilutions and verify if the delta Cq or GM% are as expected 33 44%
We run three or four dilutions and verify if the delta Cq or GM% are as expected 9 12%
We perform a PCR inhibition run with a reference gene before analysis: 3 or 4 dilutions, linear regression, extrapolation of Cq of undiluted extract, compare this to the measured Cq
10 13.33%
We add an internal positive control to the reactions and check the Cq 11 14.67%
We verify that the amplification curves look normal 17 22.67%
We check that the optical density ratios (OD260/280, 260/230) are acceptable 33 44%
Other 1 1.33%
No Answer 0 0%
T2: 6. Select the option applicable to your analysis for MON810 maize in T1?
Answers Ratio
Not tested 0 0%
Detected but not quantified 2 2.67%
Detected and quantified: please fill in Q6a-6h 0 0%
Found absent 73 97.33%
No Answer 0 0%
T2: 7. Select the option applicable to your analysis for NK603 maize in T1?
Answers Ratio
Not tested 0 0%
Detected but not quantified 2 2.67%
Detected and quantified: please fill in Q7a-7h 0 0%
Found absent 73 97.33%
No Answer 0 0%
T2: 8. Select the option applicable to your analysis for VCO-1981 maize in T1?
Answers Ratio
Not tested 19 25.33%
Detected but not quantified 6 8%
Detected and quantified: please fill in Q8a-8h 50 66.67%
Found absent 0 0%
No Answer 0 0%
T2: 9. If applicable, why did you not test or quantify all GM events in T2?
Answers Ratio
a) Not applicable, all GM events listed were tested and all those detected were quantified 50 66.67%
b) The event-specific detection method is not validated in our laboratory 13 17.33%
c) Reference material, primers, probes, or other reagents were not available (in time) 15 20%
d) The result obtained was below the LOD/LOQ 1 1.33%
e) Practical constraints (instrument broken, no personnel, etc.) 0 0%
f) Other reason 3 4%
No Answer 0 0%
T2: 8.a. VCO-1981 maize: Which quantification approach was used?
Answers Ratio
Standard curve method (2 calibration curves) 44 58.67%
Delta Cq method (one calibration curve) 7 9.33%
Digital PCR (no calibration curve) 0 0%
No Answer 25 33.33%
T2: 8.b. Select the calibrant used for the VCO-1981 standard curve.
Answers Ratio
CRM from IRMM, certified in GM mass fraction (g/kg) 49 65.33%
Non-certified RM (e.g. lab QC material), expressed in GM mass fraction 1 1.33%
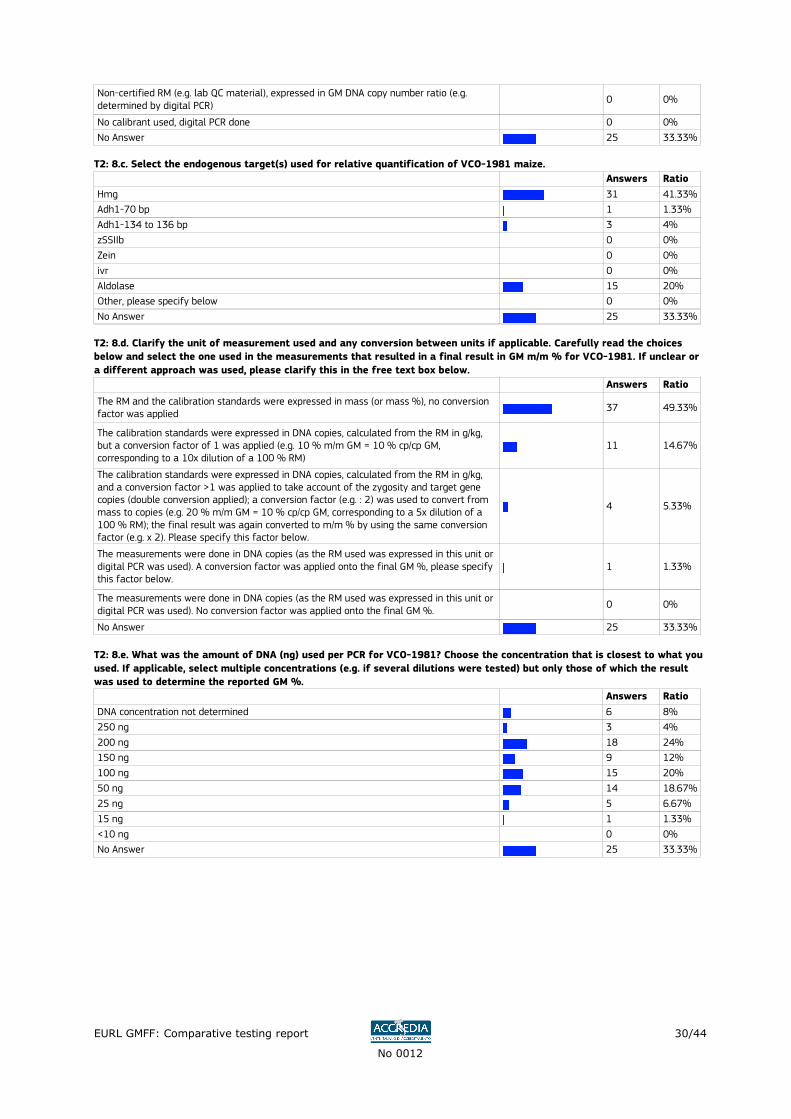
EURL GMFF: Comparative testing report
No 0012
30/44
Non-certified RM (e.g. lab QC material), expressed in GM DNA copy number ratio (e.g. determined by digital PCR)
0 0%
No calibrant used, digital PCR done 0 0%
No Answer 25 33.33%
T2: 8.c. Select the endogenous target(s) used for relative quantification of VCO-1981 maize.
Answers Ratio
Hmg 31 41.33%
Adh1-70 bp 1 1.33%
Adh1-134 to 136 bp 3 4%
zSSIIb 0 0%
Zein 0 0%
ivr 0 0%
Aldolase 15 20%
Other, please specify below 0 0%
No Answer 25 33.33%
T2: 8.d. Clarify the unit of measurement used and any conversion between units if applicable. Carefully read the choices
below and select the one used in the measurements that resulted in a final result in GM m/m % for VCO-1981. If unclear or
a different approach was used, please clarify this in the free text box below.
Answers Ratio
The RM and the calibration standards were expressed in mass (or mass %), no conversion factor was applied 37 49.33%
The calibration standards were expressed in DNA copies, calculated from the RM in g/kg, but a conversion factor of 1 was applied (e.g. 10 % m/m GM = 10 % cp/cp GM, corresponding to a 10x dilution of a 100 % RM)
11 14.67%
The calibration standards were expressed in DNA copies, calculated from the RM in g/kg, and a conversion factor >1 was applied to take account of the zygosity and target gene copies (double conversion applied); a conversion factor (e.g. : 2) was used to convert from mass to copies (e.g. 20 % m/m GM = 10 % cp/cp GM, corresponding to a 5x dilution of a 100 % RM); the final result was again converted to m/m % by using the same conversion factor (e.g. x 2). Please specify this factor below.
4 5.33%
The measurements were done in DNA copies (as the RM used was expressed in this unit or digital PCR was used). A conversion factor was applied onto the final GM %, please specify this factor below.
1 1.33%
The measurements were done in DNA copies (as the RM used was expressed in this unit or digital PCR was used). No conversion factor was applied onto the final GM %.
0 0%
No Answer 25 33.33%
T2: 8.e. What was the amount of DNA (ng) used per PCR for VCO-1981? Choose the concentration that is closest to what you
used. If applicable, select multiple concentrations (e.g. if several dilutions were tested) but only those of which the result
was used to determine the reported GM %.
Answers Ratio
DNA concentration not determined 6 8%
250 ng 3 4%
200 ng 18 24%
150 ng 9 12%
100 ng 15 20%
50 ng 14 18.67%
25 ng 5 6.67%
15 ng 1 1.33%
<10 ng 0 0%
No Answer 25 33.33%
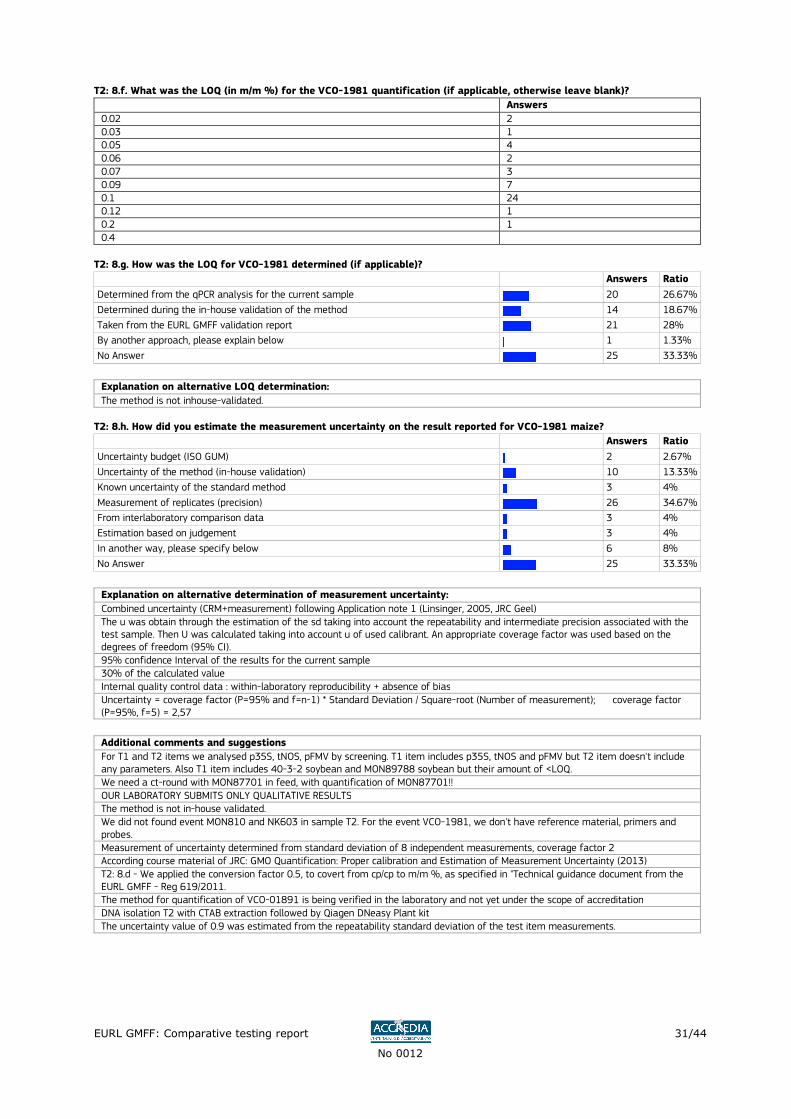
EURL GMFF: Comparative testing report
No 0012
31/44
T2: 8.f. What was the LOQ (in m/m %) for the VCO-1981 quantification (if applicable, otherwise leave blank)?
Answers
0.02 2 0.03 1 0.05 4 0.06 2 0.07 3 0.09 7 0.1 24 0.12 1 0.2 1 0.4
T2: 8.g. How was the LOQ for VCO-1981 determined (if applicable)?
Answers Ratio
Determined from the qPCR analysis for the current sample 20 26.67%
Determined during the in-house validation of the method 14 18.67%
Taken from the EURL GMFF validation report 21 28%
By another approach, please explain below 1 1.33%
No Answer 25 33.33%
Explanation on alternative LOQ determination:
The method is not inhouse-validated. T2: 8.h. How did you estimate the measurement uncertainty on the result reported for VCO-1981 maize?
Answers Ratio
Uncertainty budget (ISO GUM) 2 2.67%
Uncertainty of the method (in-house validation) 10 13.33%
Known uncertainty of the standard method 3 4%
Measurement of replicates (precision) 26 34.67%
From interlaboratory comparison data 3 4%
Estimation based on judgement 3 4%
In another way, please specify below 6 8%
No Answer 25 33.33%
Explanation on alternative determination of measurement uncertainty:
Combined uncertainty (CRM+measurement) following Application note 1 (Linsinger, 2005, JRC Geel) The u was obtain through the estimation of the sd taking into account the repeatability and intermediate precision associated with the test sample. Then U was calculated taking into account u of used calibrant. An appropriate coverage factor was used based on the degrees of freedom (95% CI). 95% confidence Interval of the results for the current sample 30% of the calculated value Internal quality control data : within-laboratory reproducibility + absence of bias Uncertainty = coverage factor (P=95% and f=n-1) * Standard Deviation / Square-root (Number of measurement); coverage factor (P=95%, f=5) = 2,57
Additional comments and suggestions
For T1 and T2 items we analysed p35S, tNOS, pFMV by screening. T1 item includes p35S, tNOS and pFMV but T2 item doesn't include any parameters. Also T1 item includes 40-3-2 soybean and MON89788 soybean but their amount of <LOQ. We need a ct-round with MON87701 in feed, with quantification of MON87701!! OUR LABORATORY SUBMITS ONLY QUALITATIVE RESULTS The method is not in-house validated. We did not found event MON810 and NK603 in sample T2. For the event VCO-1981, we don't have reference material, primers and probes. Measurement of uncertainty determined from standard deviation of 8 independent measurements, coverage factor 2 According course material of JRC: GMO Quantification: Proper calibration and Estimation of Measurement Uncertainty (2013) T2: 8.d - We applied the conversion factor 0.5, to covert from cp/cp to m/m %, as specified in "Technical guidance document from the EURL GMFF - Reg 619/2011. The method for quantification of VCO-01891 is being verified in the laboratory and not yet under the scope of accreditation DNA isolation T2 with CTAB extraction followed by Qiagen DNeasy Plant kit The uncertainty value of 0.9 was estimated from the repeatability standard deviation of the test item measurements.
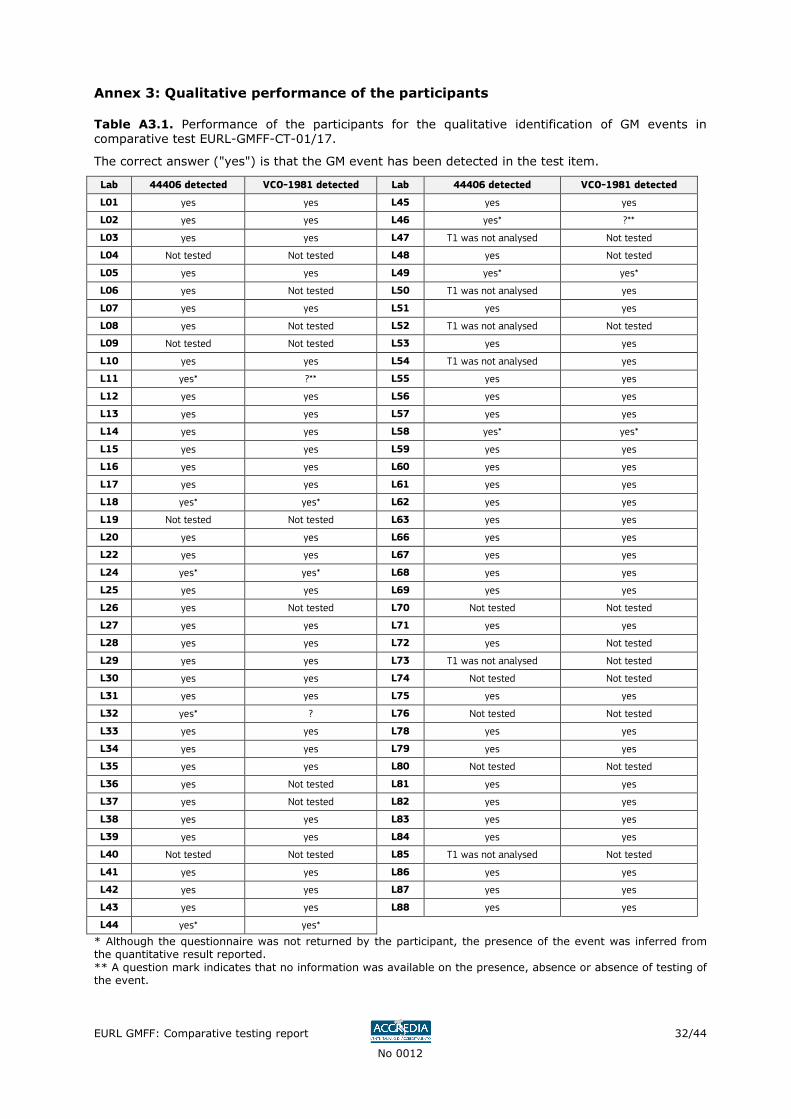
EURL GMFF: Comparative testing report
No 0012
32/44
Annex 3: Qualitative performance of the participants
Table A3.1. Performance of the participants for the qualitative identification of GM events in comparative test EURL-GMFF-CT-01/17.
The correct answer ("yes") is that the GM event has been detected in the test item.
Lab 44406 detected VCO-1981 detected Lab 44406 detected VCO-1981 detected
L01 yes yes L45 yes yes
L02 yes yes L46 yes* ?**
L03 yes yes L47 T1 was not analysed Not tested
L04 Not tested Not tested L48 yes Not tested
L05 yes yes L49 yes* yes*
L06 yes Not tested L50 T1 was not analysed yes
L07 yes yes L51 yes yes
L08 yes Not tested L52 T1 was not analysed Not tested
L09 Not tested Not tested L53 yes yes
L10 yes yes L54 T1 was not analysed yes
L11 yes* ?** L55 yes yes
L12 yes yes L56 yes yes
L13 yes yes L57 yes yes
L14 yes yes L58 yes* yes*
L15 yes yes L59 yes yes
L16 yes yes L60 yes yes
L17 yes yes L61 yes yes
L18 yes* yes* L62 yes yes
L19 Not tested Not tested L63 yes yes
L20 yes yes L66 yes yes
L22 yes yes L67 yes yes
L24 yes* yes* L68 yes yes
L25 yes yes L69 yes yes
L26 yes Not tested L70 Not tested Not tested
L27 yes yes L71 yes yes
L28 yes yes L72 yes Not tested
L29 yes yes L73 T1 was not analysed Not tested
L30 yes yes L74 Not tested Not tested
L31 yes yes L75 yes yes
L32 yes* ? L76 Not tested Not tested
L33 yes yes L78 yes yes
L34 yes yes L79 yes yes
L35 yes yes L80 Not tested Not tested
L36 yes Not tested L81 yes yes
L37 yes Not tested L82 yes yes
L38 yes yes L83 yes yes
L39 yes yes L84 yes yes
L40 Not tested Not tested L85 T1 was not analysed Not tested
L41 yes yes L86 yes yes
L42 yes yes L87 yes yes
L43 yes yes L88 yes yes
L44 yes* yes*
* Although the questionnaire was not returned by the participant, the presence of the event was inferred from the quantitative result reported. ** A question mark indicates that no information was available on the presence, absence or absence of testing of the event.
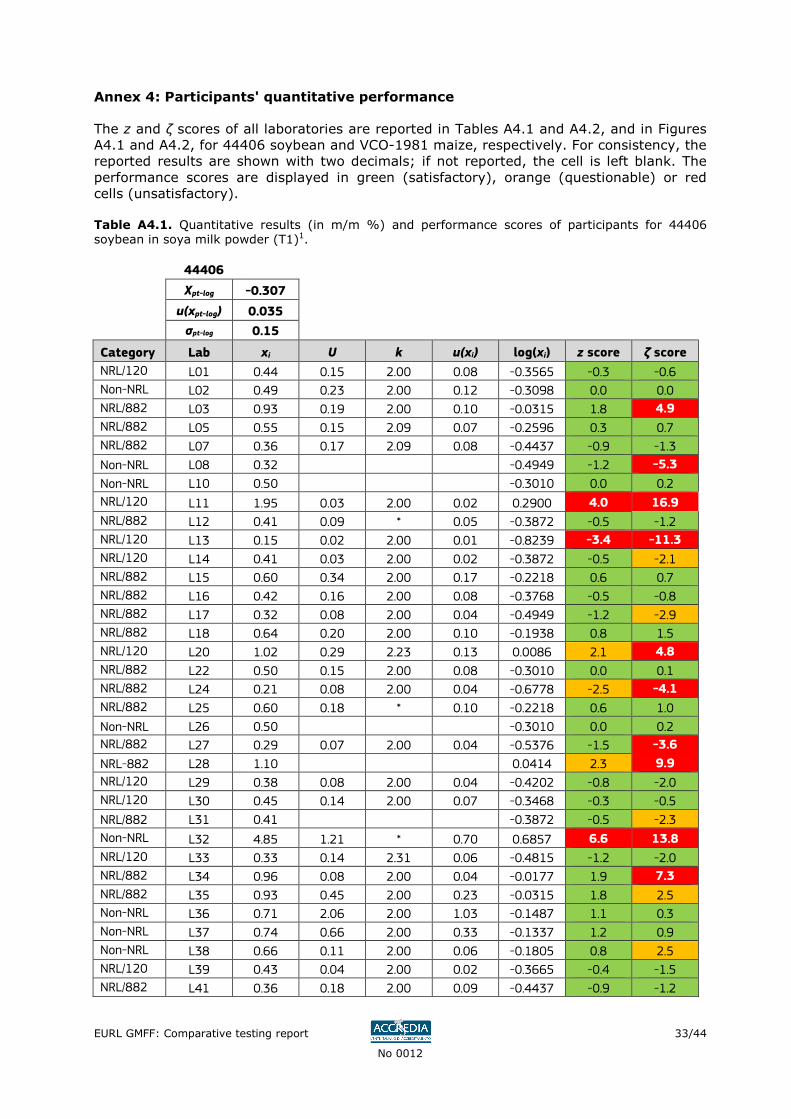
EURL GMFF: Comparative testing report
No 0012
33/44
Annex 4: Participants' quantitative performance
The z and ζ scores of all laboratories are reported in Tables A4.1 and A4.2, and in Figures A4.1 and A4.2, for 44406 soybean and VCO-1981 maize, respectively. For consistency, the reported results are shown with two decimals; if not reported, the cell is left blank. The performance scores are displayed in green (satisfactory), orange (questionable) or red cells (unsatisfactory).
Table A4.1. Quantitative results (in m/m %) and performance scores of participants for 44406 soybean in soya milk powder (T1)1.
44406
Xpt-log -0.307
u(xpt-log) 0.035
σpt-log 0.15
Category Lab xi U k u(xi) log(xi) z score ζ score
NRL/120 L01 0.44 0.15 2.00 0.08 -0.3565 -0.3 -0.6
Non-NRL L02 0.49 0.23 2.00 0.12 -0.3098 0.0 0.0
NRL/882 L03 0.93 0.19 2.00 0.10 -0.0315 1.8 4.9
NRL/882 L05 0.55 0.15 2.09 0.07 -0.2596 0.3 0.7
NRL/882 L07 0.36 0.17 2.09 0.08 -0.4437 -0.9 -1.3
Non-NRL L08 0.32
-0.4949 -1.2 -5.3
Non-NRL L10 0.50
-0.3010 0.0 0.2
NRL/120 L11 1.95 0.03 2.00 0.02 0.2900 4.0 16.9
NRL/882 L12 0.41 0.09 * 0.05 -0.3872 -0.5 -1.2
NRL/120 L13 0.15 0.02 2.00 0.01 -0.8239 -3.4 -11.3
NRL/120 L14 0.41 0.03 2.00 0.02 -0.3872 -0.5 -2.1
NRL/882 L15 0.60 0.34 2.00 0.17 -0.2218 0.6 0.7
NRL/882 L16 0.42 0.16 2.00 0.08 -0.3768 -0.5 -0.8
NRL/882 L17 0.32 0.08 2.00 0.04 -0.4949 -1.2 -2.9
NRL/882 L18 0.64 0.20 2.00 0.10 -0.1938 0.8 1.5
NRL/120 L20 1.02 0.29 2.23 0.13 0.0086 2.1 4.8
NRL/882 L22 0.50 0.15 2.00 0.08 -0.3010 0.0 0.1
NRL/882 L24 0.21 0.08 2.00 0.04 -0.6778 -2.5 -4.1
NRL/882 L25 0.60 0.18 * 0.10 -0.2218 0.6 1.0
Non-NRL L26 0.50
-0.3010 0.0 0.2
NRL/882 L27 0.29 0.07 2.00 0.04 -0.5376 -1.5 -3.6
NRL-882 L28 1.10
0.0414 2.3 9.9
NRL/120 L29 0.38 0.08 2.00 0.04 -0.4202 -0.8 -2.0
NRL/120 L30 0.45 0.14 2.00 0.07 -0.3468 -0.3 -0.5
NRL/882 L31 0.41
-0.3872 -0.5 -2.3
Non-NRL L32 4.85 1.21 * 0.70 0.6857 6.6 13.8
NRL/120 L33 0.33 0.14 2.31 0.06 -0.4815 -1.2 -2.0
NRL/882 L34 0.96 0.08 2.00 0.04 -0.0177 1.9 7.3
NRL/882 L35 0.93 0.45 2.00 0.23 -0.0315 1.8 2.5
Non-NRL L36 0.71 2.06 2.00 1.03 -0.1487 1.1 0.3
Non-NRL L37 0.74 0.66 2.00 0.33 -0.1337 1.2 0.9
Non-NRL L38 0.66 0.11 2.00 0.06 -0.1805 0.8 2.5
NRL/120 L39 0.43 0.04 2.00 0.02 -0.3665 -0.4 -1.5
NRL/882 L41 0.36 0.18 2.00 0.09 -0.4437 -0.9 -1.2
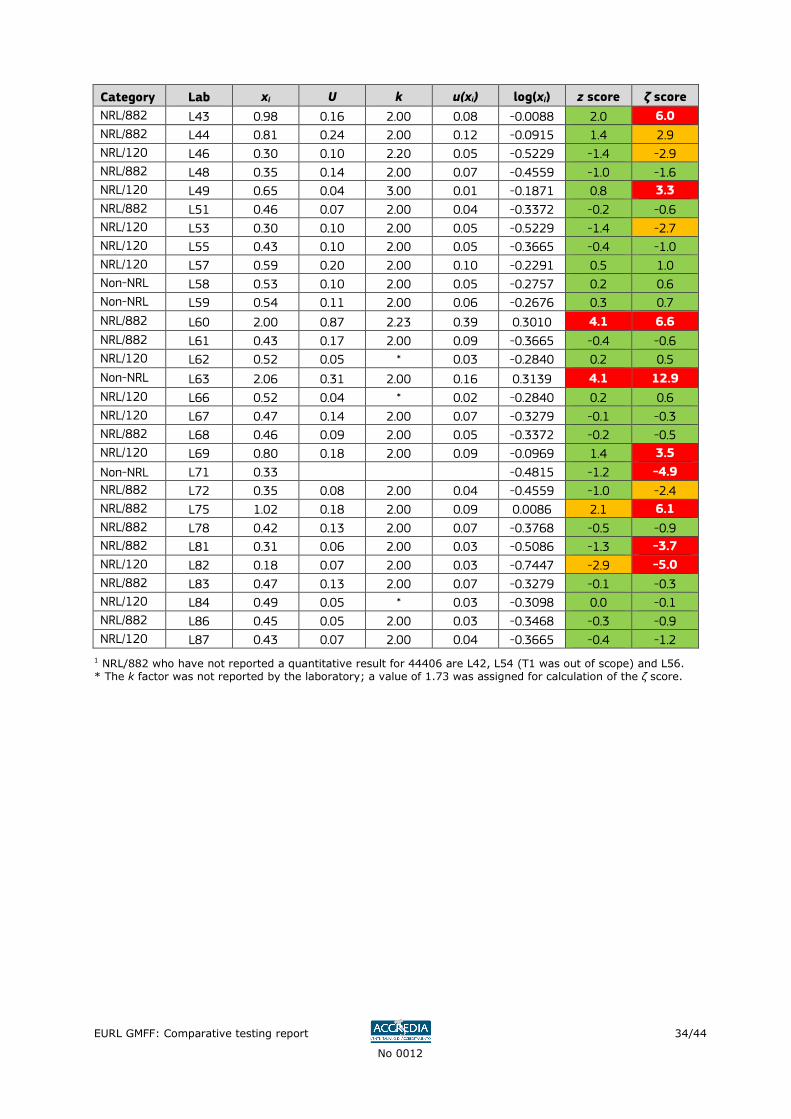
EURL GMFF: Comparative testing report
No 0012
34/44
Category Lab xi U k u(xi) log(xi) z score ζ score
NRL/882 L43 0.98 0.16 2.00 0.08 -0.0088 2.0 6.0
NRL/882 L44 0.81 0.24 2.00 0.12 -0.0915 1.4 2.9
NRL/120 L46 0.30 0.10 2.20 0.05 -0.5229 -1.4 -2.9
NRL/882 L48 0.35 0.14 2.00 0.07 -0.4559 -1.0 -1.6
NRL/120 L49 0.65 0.04 3.00 0.01 -0.1871 0.8 3.3
NRL/882 L51 0.46 0.07 2.00 0.04 -0.3372 -0.2 -0.6
NRL/120 L53 0.30 0.10 2.00 0.05 -0.5229 -1.4 -2.7
NRL/120 L55 0.43 0.10 2.00 0.05 -0.3665 -0.4 -1.0
NRL/120 L57 0.59 0.20 2.00 0.10 -0.2291 0.5 1.0
Non-NRL L58 0.53 0.10 2.00 0.05 -0.2757 0.2 0.6
Non-NRL L59 0.54 0.11 2.00 0.06 -0.2676 0.3 0.7
NRL/882 L60 2.00 0.87 2.23 0.39 0.3010 4.1 6.6
NRL/882 L61 0.43 0.17 2.00 0.09 -0.3665 -0.4 -0.6
NRL/120 L62 0.52 0.05 * 0.03 -0.2840 0.2 0.5
Non-NRL L63 2.06 0.31 2.00 0.16 0.3139 4.1 12.9
NRL/120 L66 0.52 0.04 * 0.02 -0.2840 0.2 0.6
NRL/120 L67 0.47 0.14 2.00 0.07 -0.3279 -0.1 -0.3
NRL/882 L68 0.46 0.09 2.00 0.05 -0.3372 -0.2 -0.5
NRL/120 L69 0.80 0.18 2.00 0.09 -0.0969 1.4 3.5
Non-NRL L71 0.33
-0.4815 -1.2 -4.9
NRL/882 L72 0.35 0.08 2.00 0.04 -0.4559 -1.0 -2.4
NRL/882 L75 1.02 0.18 2.00 0.09 0.0086 2.1 6.1
NRL/882 L78 0.42 0.13 2.00 0.07 -0.3768 -0.5 -0.9
NRL/882 L81 0.31 0.06 2.00 0.03 -0.5086 -1.3 -3.7
NRL/120 L82 0.18 0.07 2.00 0.03 -0.7447 -2.9 -5.0
NRL/882 L83 0.47 0.13 2.00 0.07 -0.3279 -0.1 -0.3
NRL/120 L84 0.49 0.05 * 0.03 -0.3098 0.0 -0.1
NRL/882 L86 0.45 0.05 2.00 0.03 -0.3468 -0.3 -0.9
NRL/120 L87 0.43 0.07 2.00 0.04 -0.3665 -0.4 -1.2
1 NRL/882 who have not reported a quantitative result for 44406 are L42, L54 (T1 was out of scope) and L56. * The k factor was not reported by the laboratory; a value of 1.73 was assigned for calculation of the ζ score.
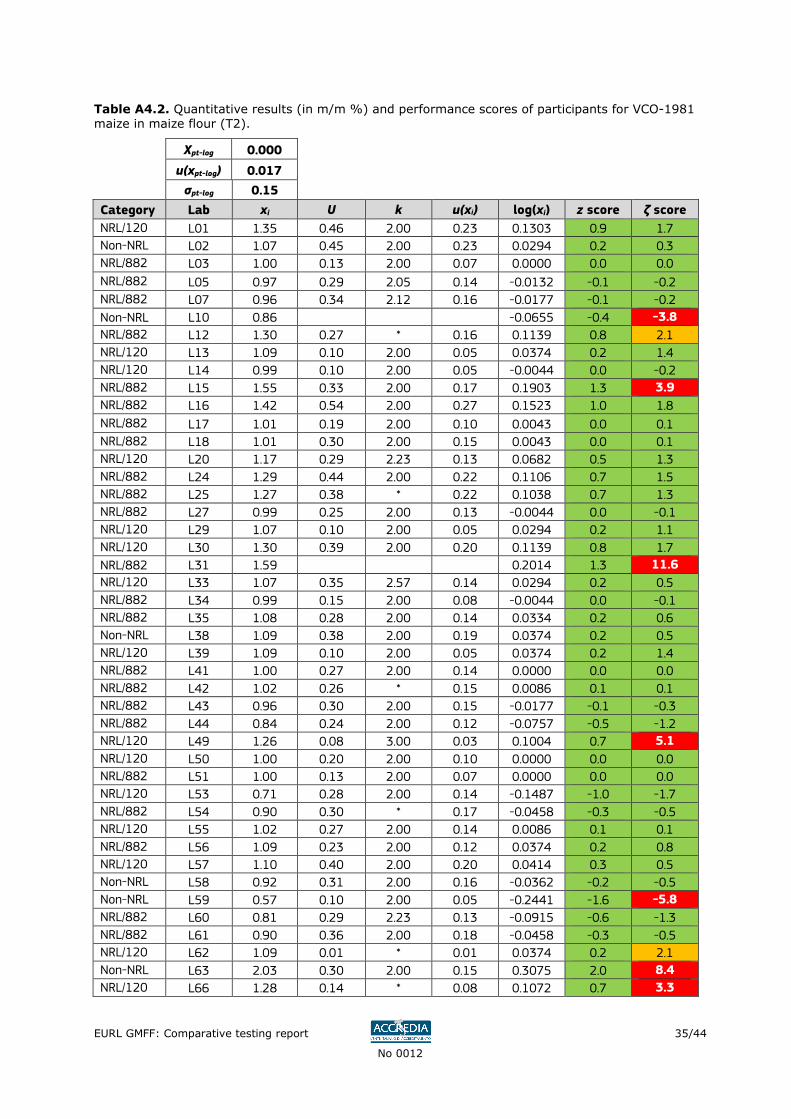
EURL GMFF: Comparative testing report
No 0012
35/44
Table A4.2. Quantitative results (in m/m %) and performance scores of participants for VCO-1981 maize in maize flour (T2).
Xpt-log 0.000
u(xpt-log) 0.017
σpt-log 0.15
Category Lab xi U k u(xi) log(xi) z score ζ score
NRL/120 L01 1.35 0.46 2.00 0.23 0.1303 0.9 1.7
Non-NRL L02 1.07 0.45 2.00 0.23 0.0294 0.2 0.3
NRL/882 L03 1.00 0.13 2.00 0.07 0.0000 0.0 0.0
NRL/882 L05 0.97 0.29 2.05 0.14 -0.0132 -0.1 -0.2
NRL/882 L07 0.96 0.34 2.12 0.16 -0.0177 -0.1 -0.2
Non-NRL L10 0.86 -0.0655 -0.4 -3.8
NRL/882 L12 1.30 0.27 * 0.16 0.1139 0.8 2.1
NRL/120 L13 1.09 0.10 2.00 0.05 0.0374 0.2 1.4
NRL/120 L14 0.99 0.10 2.00 0.05 -0.0044 0.0 -0.2
NRL/882 L15 1.55 0.33 2.00 0.17 0.1903 1.3 3.9
NRL/882 L16 1.42 0.54 2.00 0.27 0.1523 1.0 1.8
NRL/882 L17 1.01 0.19 2.00 0.10 0.0043 0.0 0.1
NRL/882 L18 1.01 0.30 2.00 0.15 0.0043 0.0 0.1
NRL/120 L20 1.17 0.29 2.23 0.13 0.0682 0.5 1.3
NRL/882 L24 1.29 0.44 2.00 0.22 0.1106 0.7 1.5
NRL/882 L25 1.27 0.38 * 0.22 0.1038 0.7 1.3
NRL/882 L27 0.99 0.25 2.00 0.13 -0.0044 0.0 -0.1
NRL/120 L29 1.07 0.10 2.00 0.05 0.0294 0.2 1.1
NRL/120 L30 1.30 0.39 2.00 0.20 0.1139 0.8 1.7
NRL/882 L31 1.59 0.2014 1.3 11.6
NRL/120 L33 1.07 0.35 2.57 0.14 0.0294 0.2 0.5
NRL/882 L34 0.99 0.15 2.00 0.08 -0.0044 0.0 -0.1
NRL/882 L35 1.08 0.28 2.00 0.14 0.0334 0.2 0.6
Non-NRL L38 1.09 0.38 2.00 0.19 0.0374 0.2 0.5
NRL/120 L39 1.09 0.10 2.00 0.05 0.0374 0.2 1.4
NRL/882 L41 1.00 0.27 2.00 0.14 0.0000 0.0 0.0
NRL/882 L42 1.02 0.26 * 0.15 0.0086 0.1 0.1
NRL/882 L43 0.96 0.30 2.00 0.15 -0.0177 -0.1 -0.3
NRL/882 L44 0.84 0.24 2.00 0.12 -0.0757 -0.5 -1.2
NRL/120 L49 1.26 0.08 3.00 0.03 0.1004 0.7 5.1
NRL/120 L50 1.00 0.20 2.00 0.10 0.0000 0.0 0.0
NRL/882 L51 1.00 0.13 2.00 0.07 0.0000 0.0 0.0
NRL/120 L53 0.71 0.28 2.00 0.14 -0.1487 -1.0 -1.7
NRL/882 L54 0.90 0.30 * 0.17 -0.0458 -0.3 -0.5
NRL/120 L55 1.02 0.27 2.00 0.14 0.0086 0.1 0.1
NRL/882 L56 1.09 0.23 2.00 0.12 0.0374 0.2 0.8
NRL/120 L57 1.10 0.40 2.00 0.20 0.0414 0.3 0.5
Non-NRL L58 0.92 0.31 2.00 0.16 -0.0362 -0.2 -0.5
Non-NRL L59 0.57 0.10 2.00 0.05 -0.2441 -1.6 -5.8
NRL/882 L60 0.81 0.29 2.23 0.13 -0.0915 -0.6 -1.3
NRL/882 L61 0.90 0.36 2.00 0.18 -0.0458 -0.3 -0.5
NRL/120 L62 1.09 0.01 * 0.01 0.0374 0.2 2.1
Non-NRL L63 2.03 0.30 2.00 0.15 0.3075 2.0 8.4
NRL/120 L66 1.28 0.14 * 0.08 0.1072 0.7 3.3
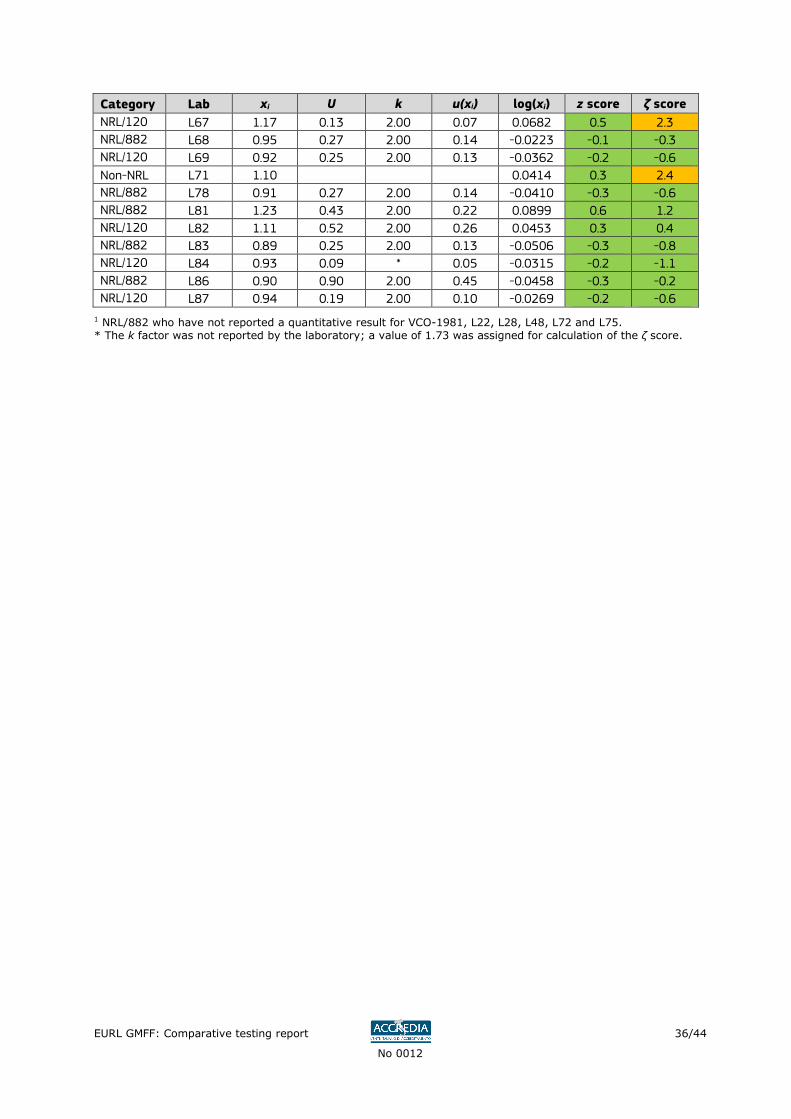
EURL GMFF: Comparative testing report
No 0012
36/44
Category Lab xi U k u(xi) log(xi) z score ζ score
NRL/120 L67 1.17 0.13 2.00 0.07 0.0682 0.5 2.3
NRL/882 L68 0.95 0.27 2.00 0.14 -0.0223 -0.1 -0.3
NRL/120 L69 0.92 0.25 2.00 0.13 -0.0362 -0.2 -0.6
Non-NRL L71 1.10 0.0414 0.3 2.4
NRL/882 L78 0.91 0.27 2.00 0.14 -0.0410 -0.3 -0.6
NRL/882 L81 1.23 0.43 2.00 0.22 0.0899 0.6 1.2
NRL/120 L82 1.11 0.52 2.00 0.26 0.0453 0.3 0.4
NRL/882 L83 0.89 0.25 2.00 0.13 -0.0506 -0.3 -0.8
NRL/120 L84 0.93 0.09 * 0.05 -0.0315 -0.2 -1.1
NRL/882 L86 0.90 0.90 2.00 0.45 -0.0458 -0.3 -0.2
NRL/120 L87 0.94 0.19 2.00 0.10 -0.0269 -0.2 -0.6
1 NRL/882 who have not reported a quantitative result for VCO-1981, L22, L28, L48, L72 and L75. * The k factor was not reported by the laboratory; a value of 1.73 was assigned for calculation of the ζ score.
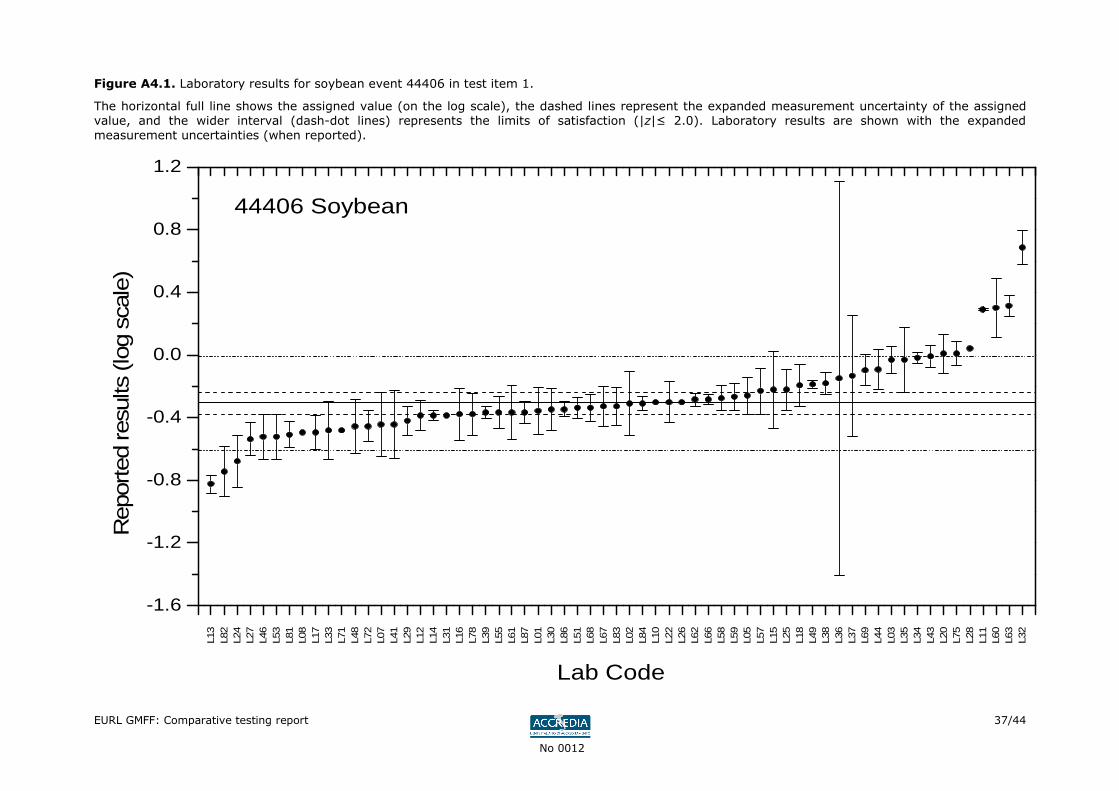
EURL GMFF: Comparative testing report
No 0012
37/44
Figure A4.1. Laboratory results for soybean event 44406 in test item 1.
The horizontal full line shows the assigned value (on the log scale), the dashed lines represent the expanded measurement uncertainty of the assigned value, and the wider interval (dash-dot lines) represents the limits of satisfaction (|z|≤ 2.0). Laboratory results are shown with the expanded measurement uncertainties (when reported).
L13
L82
L24
L27
L46
L53
L81
L08
L17
L33
L71
L48
L72
L07
L41
L29
L12
L14
L31
L16
L78
L39
L55
L61
L87
L01
L30
L86
L51
L68
L67
L83
L02
L84
L10
L22
L26
L62
L66
L58
L59
L05
L57
L15
L25
L18
L49
L38
L36
L37
L69
L44
L03
L35
L34
L43
L20
L75
L28
L11
L60
L63
L32
-1.6
-1.2
-0.8
-0.4
0.0
0.4
0.8
1.2
Rep
orte
d re
sults
(lo
g sc
ale)
44406 Soybean
Lab Code
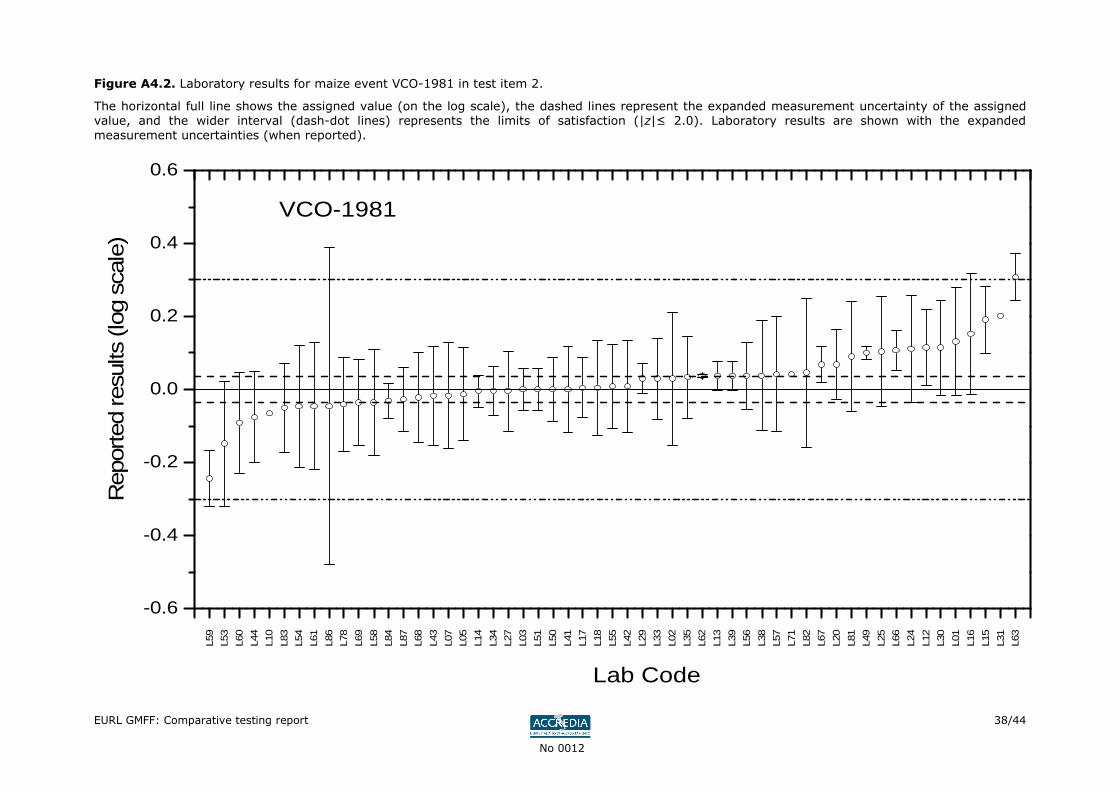
EURL GMFF: Comparative testing report
No 0012
38/44
Figure A4.2. Laboratory results for maize event VCO-1981 in test item 2.
The horizontal full line shows the assigned value (on the log scale), the dashed lines represent the expanded measurement uncertainty of the assigned value, and the wider interval (dash-dot lines) represents the limits of satisfaction (|z|≤ 2.0). Laboratory results are shown with the expanded measurement uncertainties (when reported).
L59
L53
L60
L44
L10
L83
L54
L61
L86
L78
L69
L58
L84
L87
L68
L43
L07
L05
L14
L34
L27
L03
L51
L50
L41
L17
L18
L55
L42
L29
L33
L02
L35
L62
L13
L39
L56
L38
L57
L71
L82
L67
L20
L81
L49
L25
L66
L24
L12
L30
L01
L16
L15
L31
L63
-0.6
-0.4
-0.2
0.0
0.2
0.4
0.6
Rep
orte
d re
sults
(lo
g sc
ale)
Lab Code
VCO-1981
Europe Direct is a service to help you find answers to your questions about the European Union.
Freephone number (*):
00 800 6 7 8 9 10 11 (*) The information given is free, as are most calls (though some operators, phone boxes or hotels may
charge you). More information on the European Union is available on the internet (http://europa.eu).
HOW TO OBTAIN EU PUBLICATIONS
Free publications:
• one copy:
via EU Bookshop (http://bookshop.europa.eu);
• more than one copy or posters/maps:
from the European Union’s representations (http://ec.europa.eu/represent_en.htm); from the delegations in non-EU countries (http://eeas.europa.eu/delegations/index_en.htm); by contacting the Europe Direct service (http://europa.eu/europedirect/index_en.htm) or calling 00 800 6 7 8 9 10 11 (freephone number from anywhere in the EU) (*). (*) The information given is free, as are most calls (though some operators, phone boxes or hotels may charge you).
Priced publications:
• via EU Bookshop (http://bookshop.europa.eu).
EU
R 2
8742 E
N
doi: 10.2760/592693
ISBN 978-92-79-66969-9