DETERMINATION OF COMPACTED CLAY PERMEABILITY BY ARTIFICIAL NEURAL...
12
Ninth International Water Technology Conference, IWTC9 2005, Sharm El-Sheikh, Egypt 515 DETERMINATION OF COMPACTED CLAY PERMEABILITY BY ARTIFICIAL NEURAL NETWORKS A. Boroumand and M. H. Baziar College of Civil Engineering, Iran University of Science and Technology Narmak, Tehran, Iran E-mail: [email protected], [email protected] ABSTRACT In many civil engineering practices like design of landfills, earth dams, pavements and agricultural issues, it is necessary to know the permeability coefficient of soils. In situ tests are frequently used to predict permeability of the soil. On the other hand, high ability of Artificial Neural Networks (ANNs) in prediction of nonlinear behavior has attracted the attention of many researchers. In present research a prior attempt to predict permeability of fine soils using Artificial Neural Networks is reviewed. In the prior research both soil physical properties and also compaction properties are used as ANN inputs. In present research, it is tried to show that if the dry density value after compaction be used as an input of model, other compaction properties can be omitted without any significant influence on accuracy of the prediction, and also it is tried to decrease the number of inputs in soil property group while the improved accuracy is obtained. Keywords: Permeability, neural networks, compacted clays, correlation factor. INTRODUCTION Suitable impermeable layers should be used in different kinds of engineering projects to prevent seepage in earth structures. Supplying water for agricultural and industrial usages is an everyday issue all over the world. Precious stored water should be saved in dam reservoirs, and should be irrigate by channels with minimum looses. In addition, excessive amounts of solid waste, generated every day in urban areas, have imposed a serious danger to environment. The leachate, generated as the result of waste decaying procedure in landfills, should be blocked by impermeable layers not to enter environment. If suitable earthen material is available near the site of construction, or is in-situ, a lining of compacted earth is an inexpensive and efficient mean of controlling seepage. This type of lining, especially a thick compacted lining, has been used extensively. A well-compacted lining can be highly impermeable, reducing permeability coefficient to 10 -7 cm/sec. The permeability of compacted clay is affected by soil physical and chemical properties, permanent chemical characteristics, and compaction parameters. There are many studies which describe parameters affecting permeability of soil, in literature [1, 2, 3, 4, 5, 6, 7, 8].
Transcript of DETERMINATION OF COMPACTED CLAY PERMEABILITY BY ARTIFICIAL NEURAL...
Ninth International Water Technology Conference, IWTC9 2005, Sharm El-Sheikh, Egypt 515
DETERMINATION OF COMPACTED CLAY PERMEABILITY BY
ARTIFICIAL NEURAL NETWORKS
A. Boroumand and M. H. Baziar
College of Civil Engineering, Iran University of Science and Technology Narmak, Tehran, Iran
E-mail: [email protected], [email protected] �
ABSTRACT In many civil engineering practices like design of landfills, earth dams, pavements and agricultural issues, it is necessary to know the permeability coefficient of soils. In situ tests are frequently used to predict permeability of the soil. On the other hand, high ability of Artificial Neural Networks (ANNs) in prediction of nonlinear behavior has attracted the attention of many researchers. In present research a prior attempt to predict permeability of fine soils using Artificial Neural Networks is reviewed. In the prior research both soil physical properties and also compaction properties are used as ANN inputs. In present research, it is tried to show that if the dry density value after compaction be used as an input of model, other compaction properties can be omitted without any significant influence on accuracy of the prediction, and also it is tried to decrease the number of inputs in soil property group while the improved accuracy is obtained. Keywords: Permeability, neural networks, compacted clays, correlation factor. INTRODUCTION Suitable impermeable layers should be used in different kinds of engineering projects to prevent seepage in earth structures. Supplying water for agricultural and industrial usages is an everyday issue all over the world. Precious stored water should be saved in dam reservoirs, and should be irrigate by channels with minimum looses. In addition, excessive amounts of solid waste, generated every day in urban areas, have imposed a serious danger to environment. The leachate, generated as the result of waste decaying procedure in landfills, should be blocked by impermeable layers not to enter environment. If suitable earthen material is available near the site of construction, or is in-situ, a lining of compacted earth is an inexpensive and efficient mean of controlling seepage. This type of lining, especially a thick compacted lining, has been used extensively. A well-compacted lining can be highly impermeable, reducing permeability coefficient to 10-7 cm/sec. The permeability of compacted clay is affected by soil physical and chemical properties, permanent chemical characteristics, and compaction parameters. There are many studies which describe parameters affecting permeability of soil, in literature [1, 2, 3, 4, 5, 6, 7, 8].
Ninth International Water Technology Conference, IWTC9 2005, Sharm El-Sheikh, Egypt 516
Beside varied laboratorial methods of permeability determination, some numerical methods have been used. Benson et al. [1] used data collected from 67 landfills in North America to give a regression equation of compacted clay permeability. Najjar and Basheer [2] utilized 47 sets of the same database in order to predict permeability coefficient by artificial neural networks. They used an ANN with 11 input parameters. These parameters can be listed in two categories, soil properties and compaction properties. In present study, it is tried to improve permeability prediction accuracy using ANNs, and also, to prove that some of the input parameters implemented by Najjar and Basheer can be omitted; since, they depend on other parameters. Finally using 55 data sets from Benson database, a neural network with only 5 input parameters will be presented in this study. PERMEABILITY Soils are permeable (water may flow through them) because they consist not only of solid particles, but a network of interconnected pores. The degree to which soils are permeable depends upon a number of factors, such as soil type, grain size distribution and soil stress history. The degree of permeability is characterized by the coefficient of permeability (k), and it is a product of Darcy’s Law. In 1856, Darcy established an empirical relationship for the flow of water through porous media. His relationship has evolved into Darcy’s Law, which states:
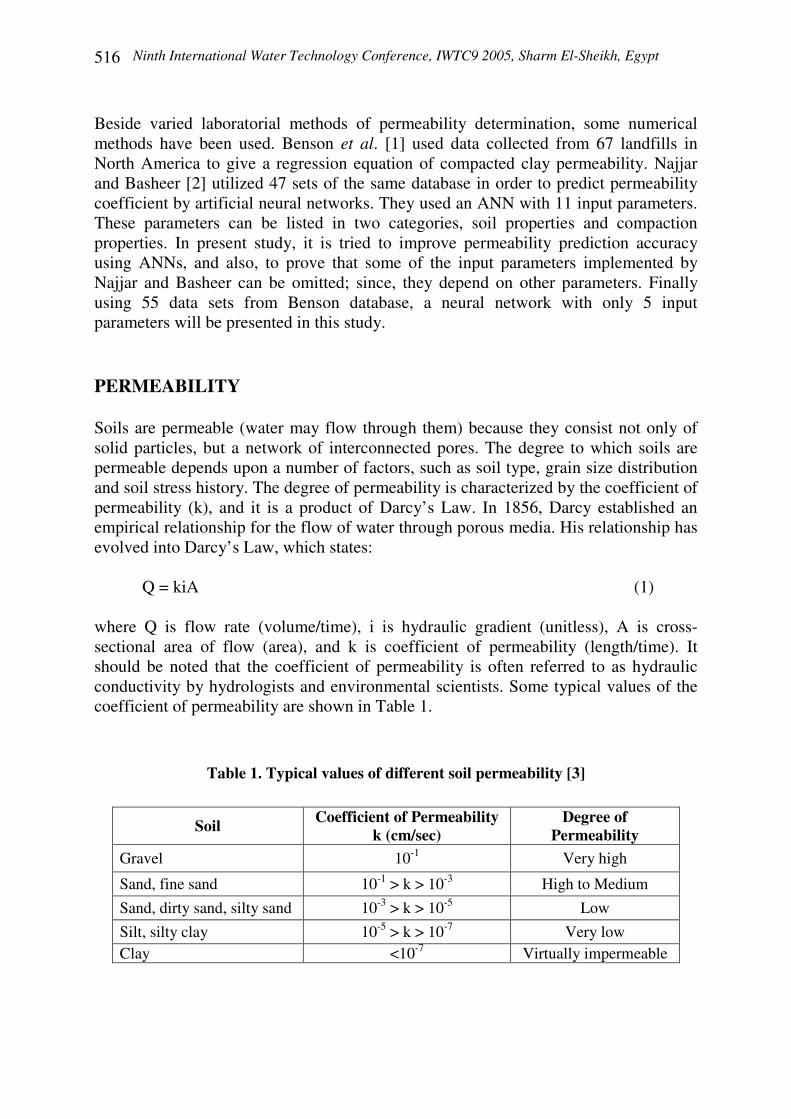
Q = kiA (1) where Q is flow rate (volume/time), i is hydraulic gradient (unitless), A is cross-sectional area of flow (area), and k is coefficient of permeability (length/time). It should be noted that the coefficient of permeability is often referred to as hydraulic conductivity by hydrologists and environmental scientists. Some typical values of the coefficient of permeability are shown in Table 1.
Table 1. Typical values of different soil permeability [3]
Soil Coefficient of Permeability k (cm/sec)
Degree of Permeability
Gravel 10-1 Very high
Sand, fine sand 10-1 > k > 10-3 High to Medium Sand, dirty sand, silty sand 10-3 > k > 10-5 Low Silt, silty clay 10-5 > k > 10-7 Very low Clay <10-7 Virtually impermeable

Ninth International Water Technology Conference, IWTC9 2005, Sharm El-Sheikh, Egypt 517
Different methods of determining the coefficient of permeability exists, including in-situ methods and laboratory methods. In the laboratory, two common tests are generally used to determine this soil permeability. These two tests are the falling head and the constant head permeability tests. Which test is used depends upon the type of soil to be tested. For soils with high permeability (sands and gravels), the constant head and for soils with intermediate to low permeability, falling head tests are used. In both, constant and falling head methods, it is essential to have undisturbed specimens of soil, or to rebuild soil with the same density as the field in laboratory. Obviously this time-consuming procedure would have inevitable undesired approximations. Moreover, the sensitivity of fine soils might result large errors in the permeability coefficient, even while the actual density has been reached in laboratory. Since in many occasions designers need to have a primary rapid determination of soil permeability instead of exact value , different researchers have tried to introduced empirical equations, regression models, numerical methods or some graphs in order to relate permeability coefficient to other aspects of soil properties. There are numerous valuable studies in literature for soils permeability [1, 2, 3, 4, 5, 6, 7, 8]. Parameters affecting permeability of compacted clays [1] In his initial studies on engineering behavior of compacted clay, Lambe [4] stated that five factors had the greatest influence on hydraulic conductivity: (1) Soil composition; (2) permanent chemical characteristics; (3) void ratio; (4); structure; and (5) degree of saturation during permeation. In exceeding paragraphs some of these aspects are discussed. Atterberg limits The Atterberg limits are indices of the quantity of clay size particles and their mineralogical composition. Typically, higher liquid limit and plasticity index are associated with soils having a greater quantity of clay particles or clay particles having higher surface activity [5]. According to this fact, lower permeability is expected when the ratio of plastic clay increases in soil combination. Particle size distribution Fluid velocity between soil particles is directly related to void dimensions which conduct flow. Also void dimensions depend on proportion of large and small particle sizes. Therefore, permeability coefficient is affected by the shape of soil particle size distribution curve. Low permeability is expected to be achieved when the soil is well graded and the clay fraction governs the hydraulic behavior of the matrix. Percentages of clay, percentage of fines, and percentage of coarse are three controlling parameters in this category. Soil structure As the water content is increased beyond optimum, or the compactive effort is raised, the permeability decreases. Furthermore the lowest permeability occurs at water contents slightly (2-4%) in the wet side of optimum water content [5]. Increases in
Ninth International Water Technology Conference, IWTC9 2005, Sharm El-Sheikh, Egypt 518
water content and compactive effort result in reorientation of clay particles and reduction in the size of interparticles pores [4]. Dry density Soil dry density distinctly affects the permeability coefficient. A dense specimen obviously has fewer pores than a loose one with equal volume. Therefore, it is logical to expect less permeability in dense soils than what is expected in loose soils. ARTIFICIAL NEURAL NETWORK (ANN) Artificial neural networks are highly parallel, flexible mathematical constructs that have been inspired by the workings of the biological nervous system. ANNs have a natural propensity for storing experiential knowledge and making it available for use [9]. The ANN mathematics are simple to implement yet difficult to comprehend, and ANN is sometimes viewed as a ‘black box’. In recent years, there has been a growing interest in the application of ANNs in the different engineering fields. The use of an artificial neural network requires a discrete set of steps, outlined as follows [10]; 1. Determination of ‘what is to be predicted’. 2. Data collection: Since artificial neural networks are not usually able to extrapolate, the data patterns should include the edges of the problem domain in all dimensions and should be evenly distributed. 3. Preprocessing of data: To extract information from data sets, it is sometimes required to modify or preprocess the inputs. For example two (or more) values can be reduced into one input, which has more value to the network than the original variables.
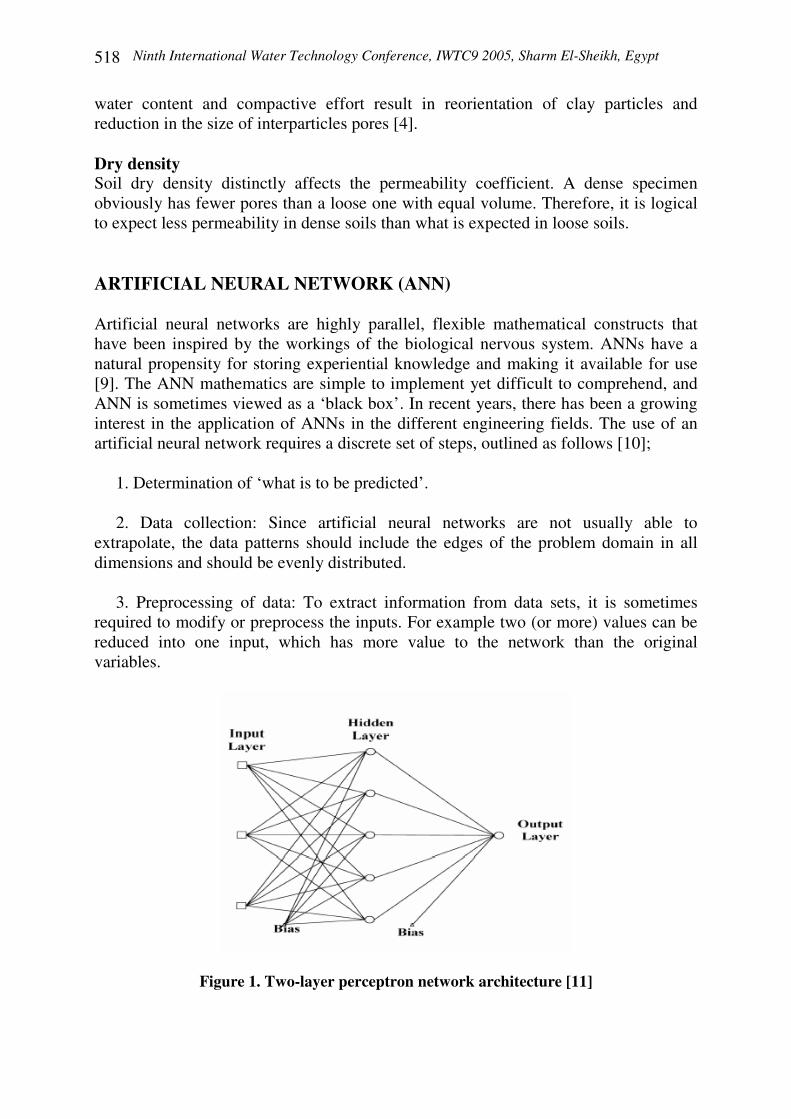
Figure 1. Two-layer perceptron network architecture [11]
Ninth International Water Technology Conference, IWTC9 2005, Sharm El-Sheikh, Egypt 519
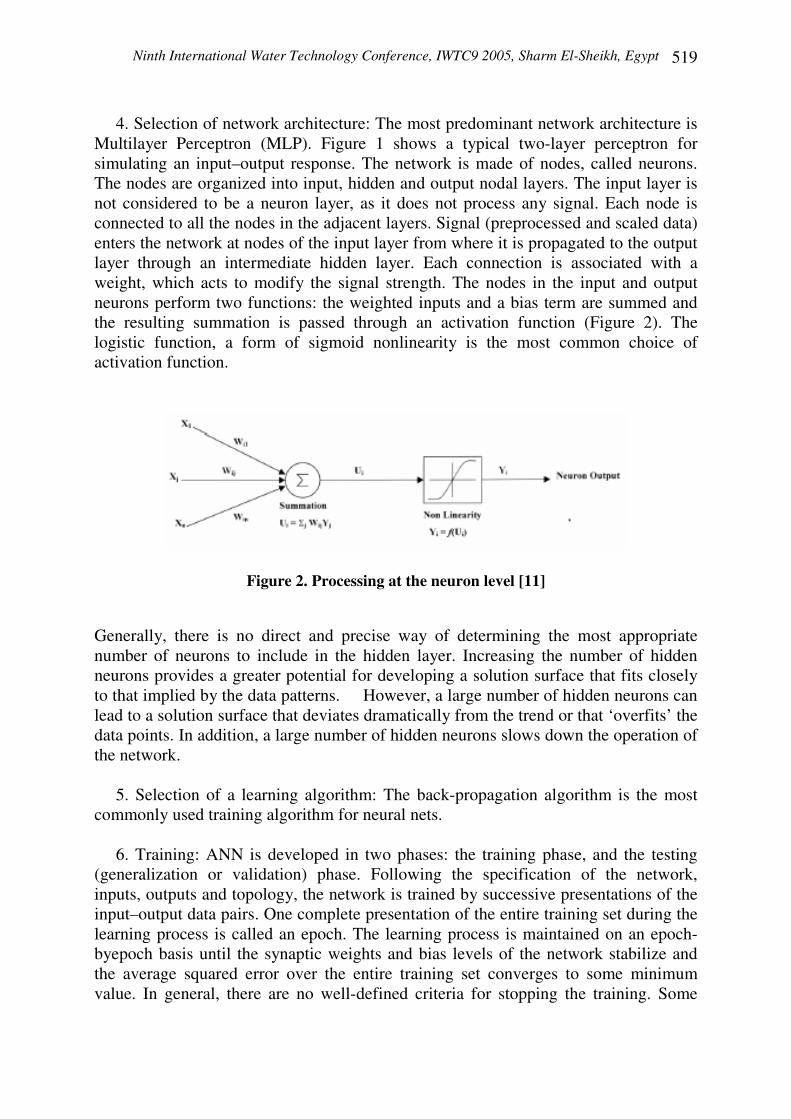
4. Selection of network architecture: The most predominant network architecture is Multilayer Perceptron (MLP). Figure 1 shows a typical two-layer perceptron for simulating an input–output response. The network is made of nodes, called neurons. The nodes are organized into input, hidden and output nodal layers. The input layer is not considered to be a neuron layer, as it does not process any signal. Each node is connected to all the nodes in the adjacent layers. Signal (preprocessed and scaled data) enters the network at nodes of the input layer from where it is propagated to the output layer through an intermediate hidden layer. Each connection is associated with a weight, which acts to modify the signal strength. The nodes in the input and output neurons perform two functions: the weighted inputs and a bias term are summed and the resulting summation is passed through an activation function (Figure 2). The logistic function, a form of sigmoid nonlinearity is the most common choice of activation function.
Figure 2. Processing at the neuron level [11]
Generally, there is no direct and precise way of determining the most appropriate number of neurons to include in the hidden layer. Increasing the number of hidden neurons provides a greater potential for developing a solution surface that fits closely to that implied by the data patterns. However, a large number of hidden neurons can lead to a solution surface that deviates dramatically from the trend or that ‘overfits’ the data points. In addition, a large number of hidden neurons slows down the operation of the network. 5. Selection of a learning algorithm: The back-propagation algorithm is the most commonly used training algorithm for neural nets. 6. Training: ANN is developed in two phases: the training phase, and the testing (generalization or validation) phase. Following the specification of the network, inputs, outputs and topology, the network is trained by successive presentations of the input–output data pairs. One complete presentation of the entire training set during the learning process is called an epoch. The learning process is maintained on an epoch-byepoch basis until the synaptic weights and bias levels of the network stabilize and the average squared error over the entire training set converges to some minimum value. In general, there are no well-defined criteria for stopping the training. Some
Ninth International Water Technology Conference, IWTC9 2005, Sharm El-Sheikh, Egypt 520
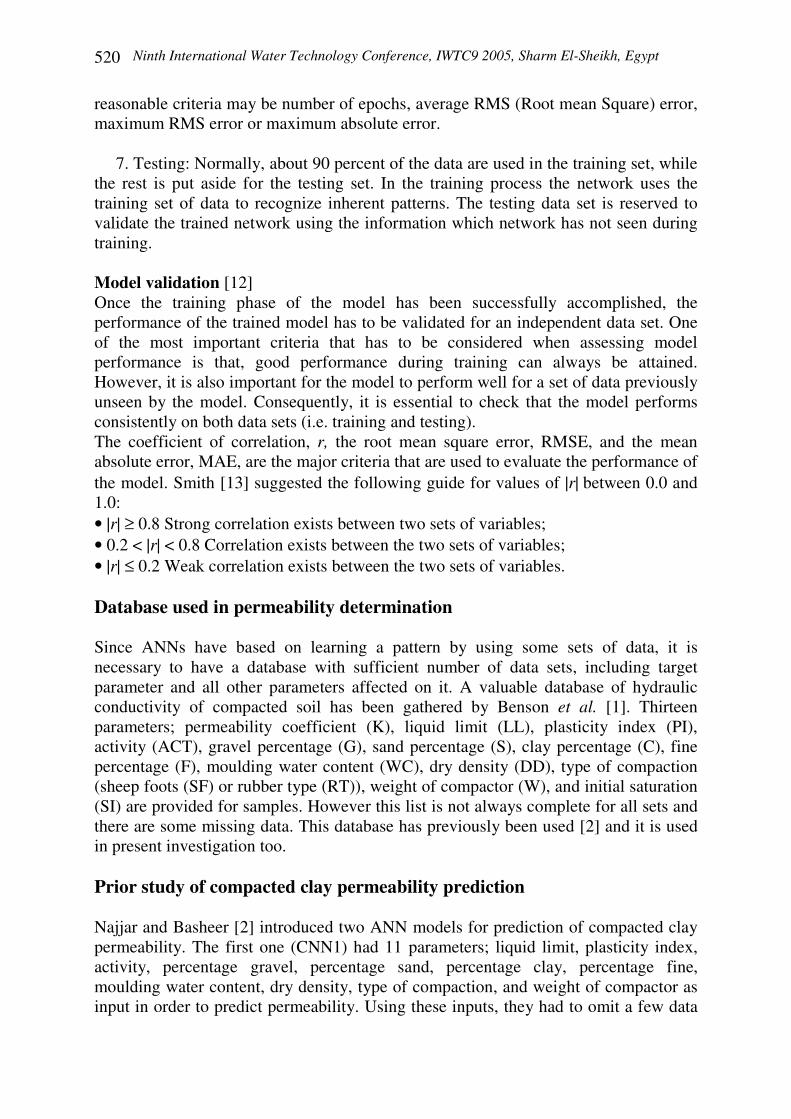
reasonable criteria may be number of epochs, average RMS (Root mean Square) error, maximum RMS error or maximum absolute error. 7. Testing: Normally, about 90 percent of the data are used in the training set, while the rest is put aside for the testing set. In the training process the network uses the training set of data to recognize inherent patterns. The testing data set is reserved to validate the trained network using the information which network has not seen during training. Model validation [12] Once the training phase of the model has been successfully accomplished, the performance of the trained model has to be validated for an independent data set. One of the most important criteria that has to be considered when assessing model performance is that, good performance during training can always be attained. However, it is also important for the model to perform well for a set of data previously unseen by the model. Consequently, it is essential to check that the model performs consistently on both data sets (i.e. training and testing). The coefficient of correlation, r, the root mean square error, RMSE, and the mean absolute error, MAE, are the major criteria that are used to evaluate the performance of the model. Smith [13] suggested the following guide for values of |r| between 0.0 and 1.0: • |r| ≥ 0.8 Strong correlation exists between two sets of variables; • 0.2 < |r| < 0.8 Correlation exists between the two sets of variables; • |r| ≤ 0.2 Weak correlation exists between the two sets of variables. Database used in permeability determination Since ANNs have based on learning a pattern by using some sets of data, it is necessary to have a database with sufficient number of data sets, including target parameter and all other parameters affected on it. A valuable database of hydraulic conductivity of compacted soil has been gathered by Benson et al. [1]. Thirteen parameters; permeability coefficient (K), liquid limit (LL), plasticity index (PI), activity (ACT), gravel percentage (G), sand percentage (S), clay percentage (C), fine percentage (F), moulding water content (WC), dry density (DD), type of compaction (sheep foots (SF) or rubber type (RT)), weight of compactor (W), and initial saturation (SI) are provided for samples. However this list is not always complete for all sets and there are some missing data. This database has previously been used [2] and it is used in present investigation too. Prior study of compacted clay permeability prediction Najjar and Basheer [2] introduced two ANN models for prediction of compacted clay permeability. The first one (CNN1) had 11 parameters; liquid limit, plasticity index, activity, percentage gravel, percentage sand, percentage clay, percentage fine, moulding water content, dry density, type of compaction, and weight of compactor as input in order to predict permeability. Using these inputs, they had to omit a few data
Ninth International Water Technology Conference, IWTC9 2005, Sharm El-Sheikh, Egypt 521
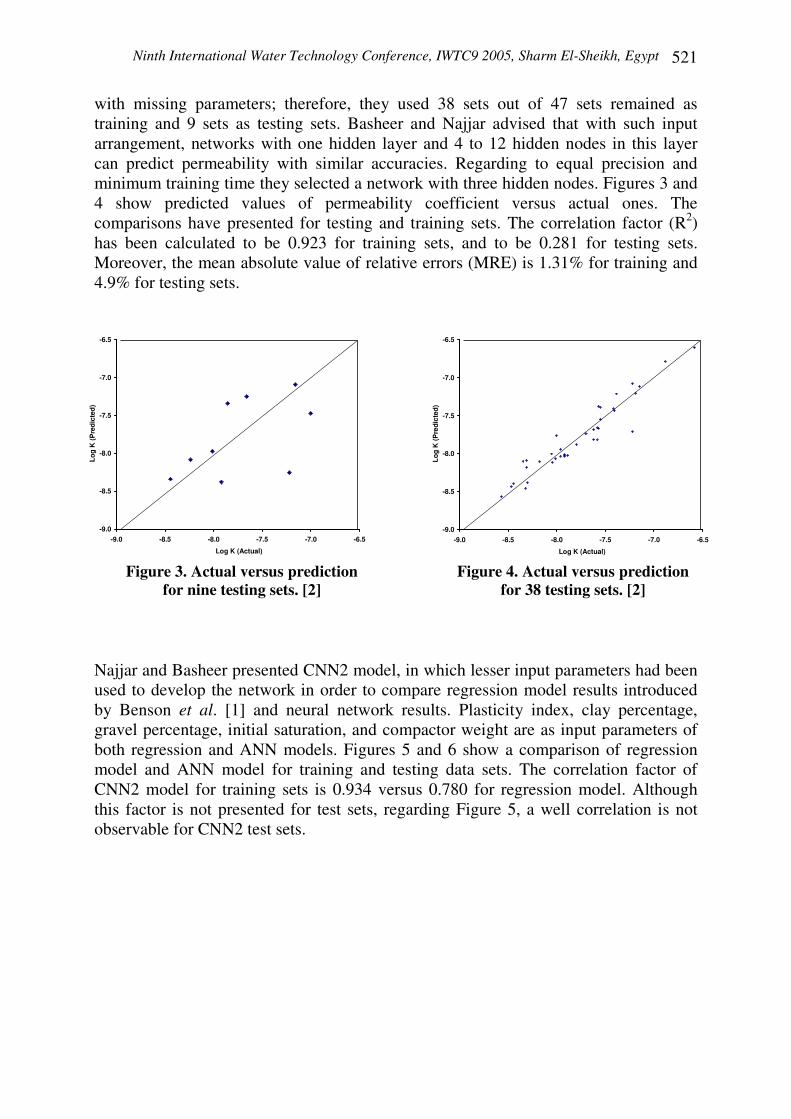
with missing parameters; therefore, they used 38 sets out of 47 sets remained as training and 9 sets as testing sets. Basheer and Najjar advised that with such input arrangement, networks with one hidden layer and 4 to 12 hidden nodes in this layer can predict permeability with similar accuracies. Regarding to equal precision and minimum training time they selected a network with three hidden nodes. Figures 3 and 4 show predicted values of permeability coefficient versus actual ones. The comparisons have presented for testing and training sets. The correlation factor (R2) has been calculated to be 0.923 for training sets, and to be 0.281 for testing sets. Moreover, the mean absolute value of relative errors (MRE) is 1.31% for training and 4.9% for testing sets.
-9.0
-8.5
-8.0
-7.5
-7.0
-6.5
-9.0 -8.5 -8.0 -7.5 -7.0 -6.5
Log K (Actual)
Log
K (P
redi
cted
)
-9.0
-8.5
-8.0
-7.5
-7.0
-6.5
-9.0 -8.5 -8.0 -7.5 -7.0 -6.5
Log K (Actual)
Log
K (P
redi
cted
)
Figure 3. Actual versus prediction for nine testing sets. [2]
Figure 4. Actual versus prediction for 38 testing sets. [2]
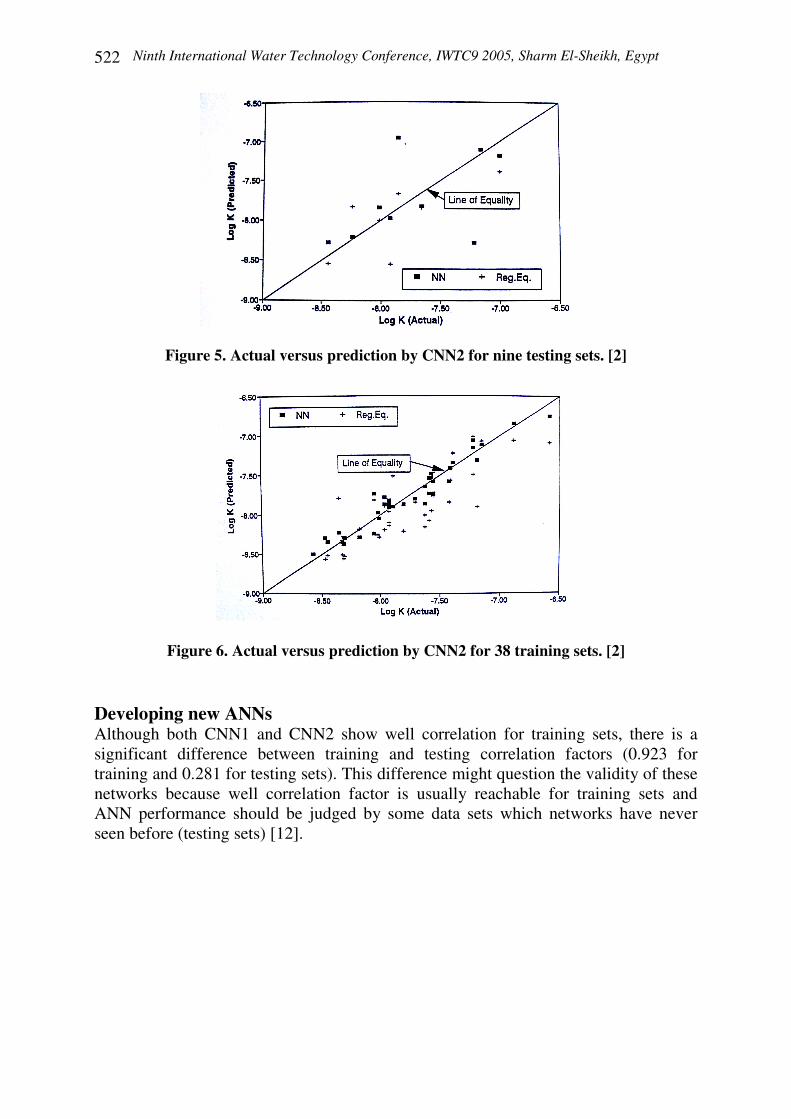
Najjar and Basheer presented CNN2 model, in which lesser input parameters had been used to develop the network in order to compare regression model results introduced by Benson et al. [1] and neural network results. Plasticity index, clay percentage, gravel percentage, initial saturation, and compactor weight are as input parameters of both regression and ANN models. Figures 5 and 6 show a comparison of regression model and ANN model for training and testing data sets. The correlation factor of CNN2 model for training sets is 0.934 versus 0.780 for regression model. Although this factor is not presented for test sets, regarding Figure 5, a well correlation is not observable for CNN2 test sets.
Ninth International Water Technology Conference, IWTC9 2005, Sharm El-Sheikh, Egypt 522
Figure 5. Actual versus prediction by CNN2 for nine testing sets. [2]
Figure 6. Actual versus prediction by CNN2 for 38 training sets. [2] Developing new ANNs Although both CNN1 and CNN2 show well correlation for training sets, there is a significant difference between training and testing correlation factors (0.923 for training and 0.281 for testing sets). This difference might question the validity of these networks because well correlation factor is usually reachable for training sets and ANN performance should be judged by some data sets which networks have never seen before (testing sets) [12].
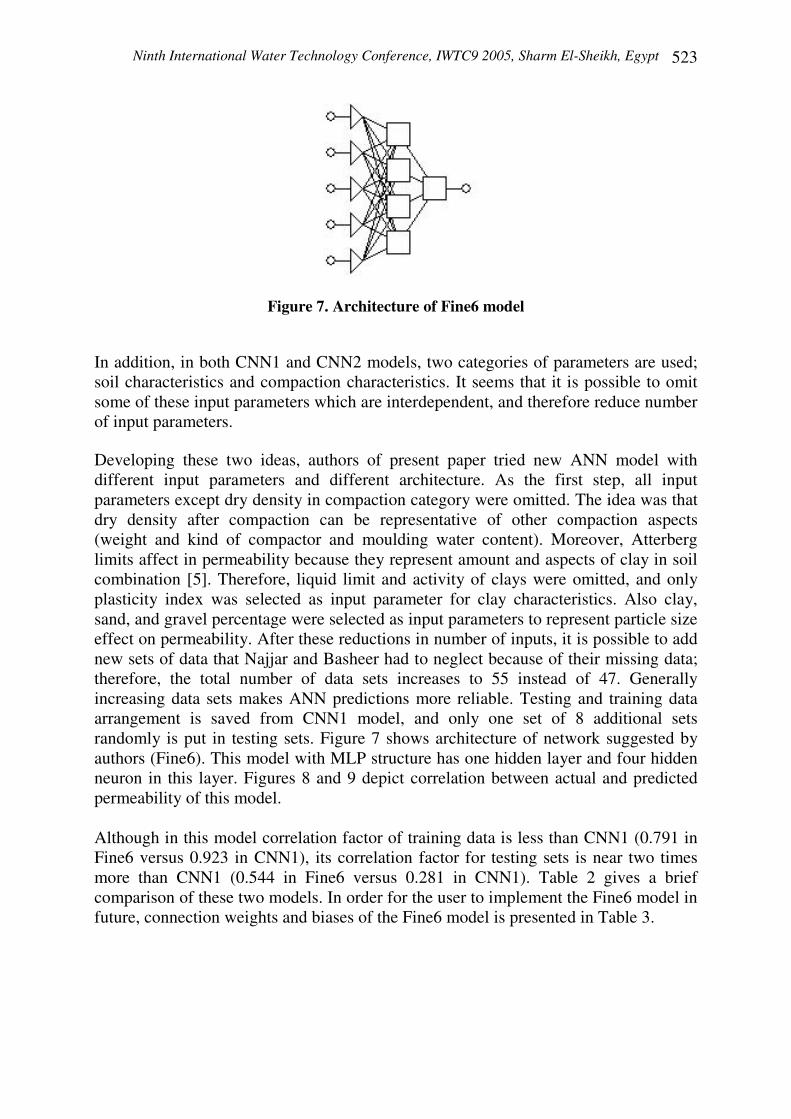
Ninth International Water Technology Conference, IWTC9 2005, Sharm El-Sheikh, Egypt 523
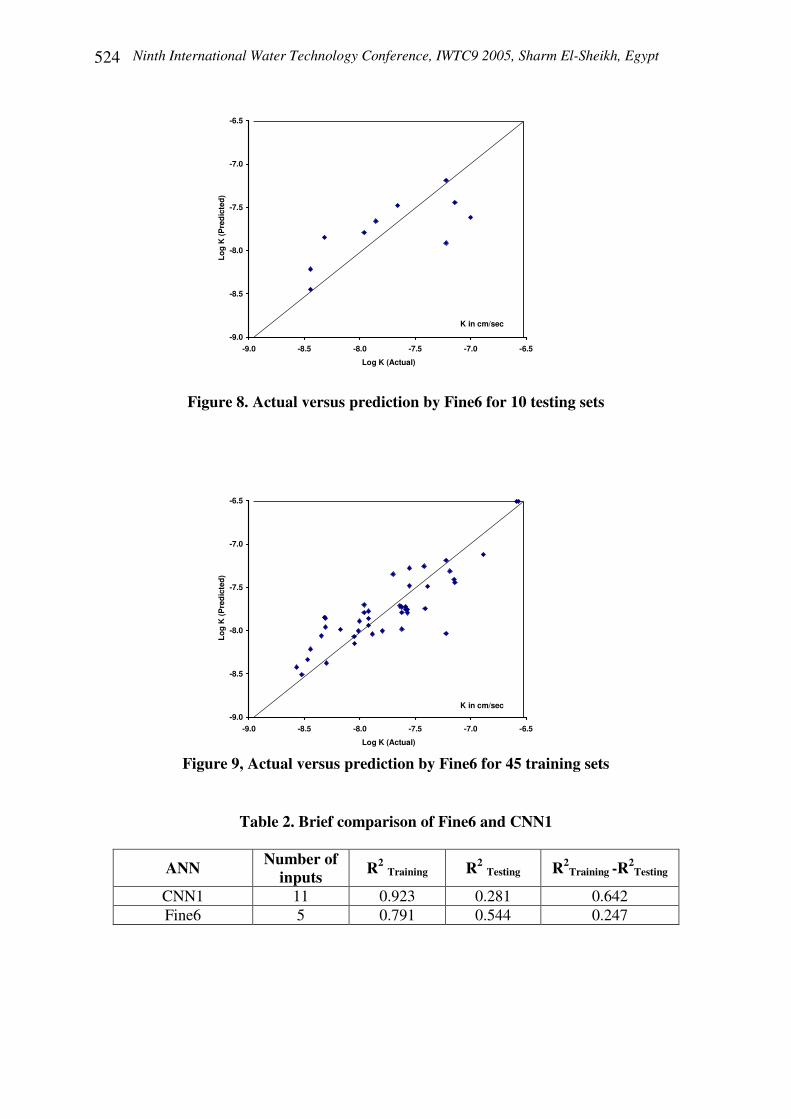
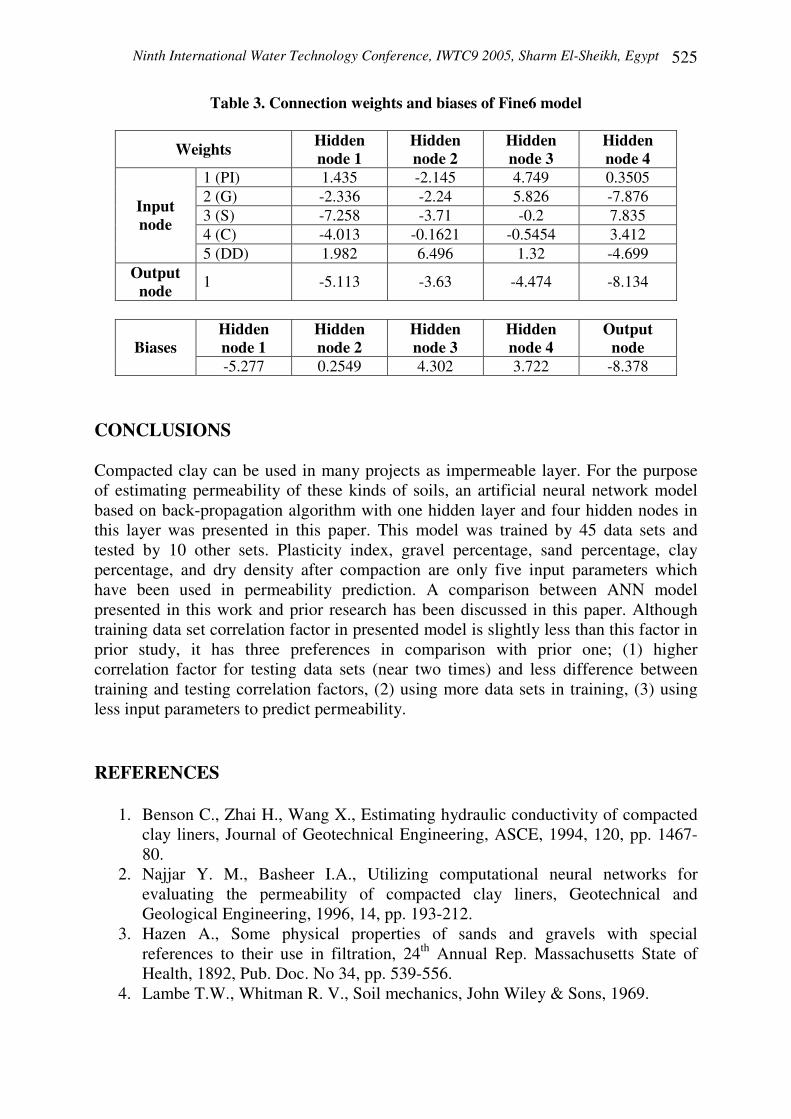
Figure 7. Architecture of Fine6 model In addition, in both CNN1 and CNN2 models, two categories of parameters are used; soil characteristics and compaction characteristics. It seems that it is possible to omit some of these input parameters which are interdependent, and therefore reduce number of input parameters. Developing these two ideas, authors of present paper tried new ANN model with different input parameters and different architecture. As the first step, all input parameters except dry density in compaction category were omitted. The idea was that dry density after compaction can be representative of other compaction aspects (weight and kind of compactor and moulding water content). Moreover, Atterberg limits affect in permeability because they represent amount and aspects of clay in soil combination [5]. Therefore, liquid limit and activity of clays were omitted, and only plasticity index was selected as input parameter for clay characteristics. Also clay, sand, and gravel percentage were selected as input parameters to represent particle size effect on permeability. After these reductions in number of inputs, it is possible to add new sets of data that Najjar and Basheer had to neglect because of their missing data; therefore, the total number of data sets increases to 55 instead of 47. Generally increasing data sets makes ANN predictions more reliable. Testing and training data arrangement is saved from CNN1 model, and only one set of 8 additional sets randomly is put in testing sets. Figure 7 shows architecture of network suggested by authors (Fine6). This model with MLP structure has one hidden layer and four hidden neuron in this layer. Figures 8 and 9 depict correlation between actual and predicted permeability of this model. Although in this model correlation factor of training data is less than CNN1 (0.791 in Fine6 versus 0.923 in CNN1), its correlation factor for testing sets is near two times more than CNN1 (0.544 in Fine6 versus 0.281 in CNN1). Table 2 gives a brief comparison of these two models. In order for the user to implement the Fine6 model in future, connection weights and biases of the Fine6 model is presented in Table 3.
Ninth International Water Technology Conference, IWTC9 2005, Sharm El-Sheikh, Egypt 524
-9.0
-8.5
-8.0
-7.5
-7.0
-6.5
-9.0 -8.5 -8.0 -7.5 -7.0 -6.5
Log K (Actual)
Log
K (P
red
icte
d)
K in cm/sec
Figure 8. Actual versus prediction by Fine6 for 10 testing sets
-9.0
-8.5
-8.0
-7.5
-7.0
-6.5
-9.0 -8.5 -8.0 -7.5 -7.0 -6.5
Log K (Actual)
Log
K (P
red
icte
d)
K in cm/sec
Figure 9, Actual versus prediction by Fine6 for 45 training sets
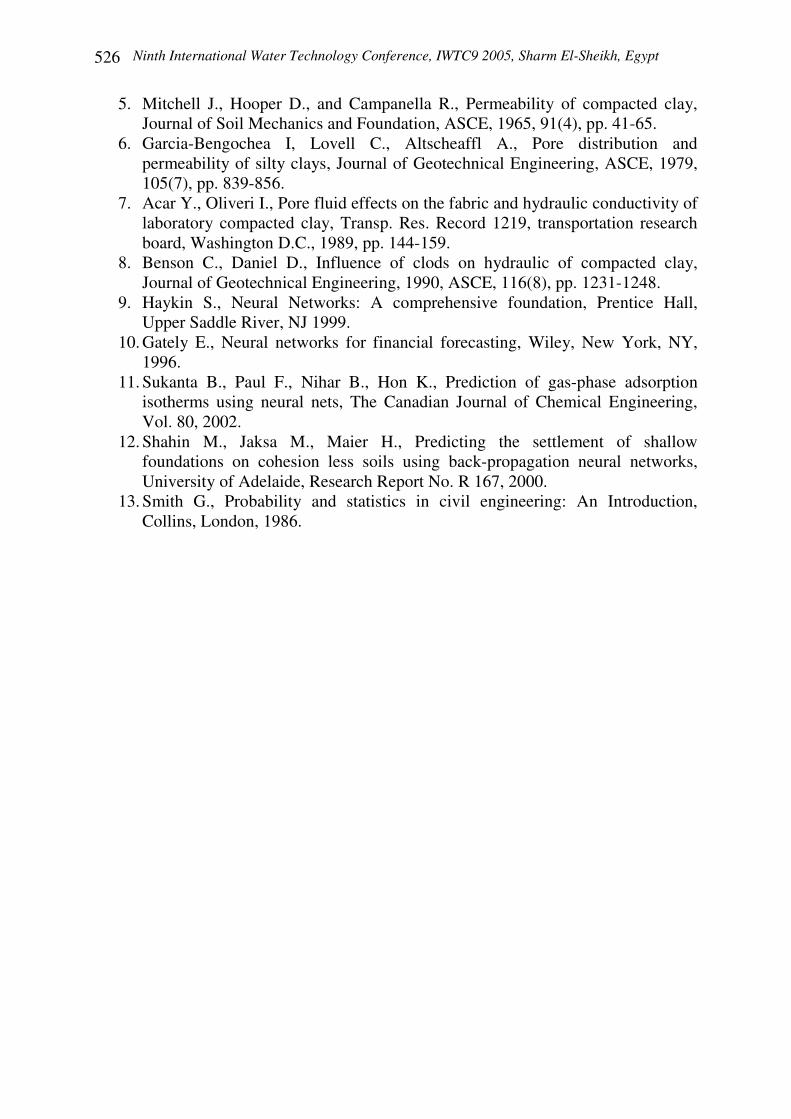
Table 2. Brief comparison of Fine6 and CNN1
ANN Number of inputs R2 Training R2 Testing R2
Training -R2Testing
CNN1 11 0.923 0.281 0.642 Fine6 5 0.791 0.544 0.247
Ninth International Water Technology Conference, IWTC9 2005, Sharm El-Sheikh, Egypt 525
Table 3. Connection weights and biases of Fine6 model
Weights Hidden node 1
Hidden node 2
Hidden node 3
Hidden node 4
1 (PI) 1.435 -2.145 4.749 0.3505 2 (G) -2.336 -2.24 5.826 -7.876 3 (S) -7.258 -3.71 -0.2 7.835 4 (C) -4.013 -0.1621 -0.5454 3.412
Input node
5 (DD) 1.982 6.496 1.32 -4.699 Output
node 1 -5.113 -3.63 -4.474 -8.134
Hidden node 1
Hidden node 2
Hidden node 3
Hidden node 4
Output node Biases
-5.277 0.2549 4.302 3.722 -8.378 CONCLUSIONS Compacted clay can be used in many projects as impermeable layer. For the purpose of estimating permeability of these kinds of soils, an artificial neural network model based on back-propagation algorithm with one hidden layer and four hidden nodes in this layer was presented in this paper. This model was trained by 45 data sets and tested by 10 other sets. Plasticity index, gravel percentage, sand percentage, clay percentage, and dry density after compaction are only five input parameters which have been used in permeability prediction. A comparison between ANN model presented in this work and prior research has been discussed in this paper. Although training data set correlation factor in presented model is slightly less than this factor in prior study, it has three preferences in comparison with prior one; (1) higher correlation factor for testing data sets (near two times) and less difference between training and testing correlation factors, (2) using more data sets in training, (3) using less input parameters to predict permeability. REFERENCES
1. Benson C., Zhai H., Wang X., Estimating hydraulic conductivity of compacted clay liners, Journal of Geotechnical Engineering, ASCE, 1994, 120, pp. 1467-80.
2. Najjar Y. M., Basheer I.A., Utilizing computational neural networks for evaluating the permeability of compacted clay liners, Geotechnical and Geological Engineering, 1996, 14, pp. 193-212.
3. Hazen A., Some physical properties of sands and gravels with special references to their use in filtration, 24th Annual Rep. Massachusetts State of Health, 1892, Pub. Doc. No 34, pp. 539-556.
4. Lambe T.W., Whitman R. V., Soil mechanics, John Wiley & Sons, 1969.
Ninth International Water Technology Conference, IWTC9 2005, Sharm El-Sheikh, Egypt 526
5. Mitchell J., Hooper D., and Campanella R., Permeability of compacted clay, Journal of Soil Mechanics and Foundation, ASCE, 1965, 91(4), pp. 41-65.
6. Garcia-Bengochea I, Lovell C., Altscheaffl A., Pore distribution and permeability of silty clays, Journal of Geotechnical Engineering, ASCE, 1979, 105(7), pp. 839-856.
7. Acar Y., Oliveri I., Pore fluid effects on the fabric and hydraulic conductivity of laboratory compacted clay, Transp. Res. Record 1219, transportation research board, Washington D.C., 1989, pp. 144-159.
8. Benson C., Daniel D., Influence of clods on hydraulic of compacted clay, Journal of Geotechnical Engineering, 1990, ASCE, 116(8), pp. 1231-1248.
9. Haykin S., Neural Networks: A comprehensive foundation, Prentice Hall, Upper Saddle River, NJ 1999.
10. Gately E., Neural networks for financial forecasting, Wiley, New York, NY, 1996.
11. Sukanta B., Paul F., Nihar B., Hon K., Prediction of gas-phase adsorption isotherms using neural nets, The Canadian Journal of Chemical Engineering, Vol. 80, 2002.
12. Shahin M., Jaksa M., Maier H., Predicting the settlement of shallow foundations on cohesion less soils using back-propagation neural networks, University of Adelaide, Research Report No. R 167, 2000.
13. Smith G., Probability and statistics in civil engineering: An Introduction, Collins, London, 1986.