DETERMINATION AND CHARACTERIZATION OF CAFFEINE …
113
International Journal of Scientific & Engineering Research Volume 11, Issue 7, July-2020 1084 ISSN 2229-5518 IJSER © 2020 http://www.ijser.org DILLA UNIVERSITY SCHOOL OF GRADUATE STUDIES DEPARTMENT OF PHYSICS DETERMINATION AND CHARACTERIZATION OF CAFFEINE CONTENT OF SMALL AND LARGE SIZE COFFEE BEANS IN SIDAMA AND KAMBATA TAMBARO ZONES SOUTHERN, ETHIOPIA USING UV-VIS SPECTROPHOTOMETER Research Thesis By Tsegaye Bojago Dado Advisor: Getachew Worku (PhD) August 2019 Dilla University, Ethiopia IJSER
Transcript of DETERMINATION AND CHARACTERIZATION OF CAFFEINE …

International Journal of Scientific & Engineering Research Volume 11, Issue 7, July-2020 1084 ISSN 2229-5518
IJSER © 2020
http://www.ijser.org
DILLA UNIVERSITY
SCHOOL OF GRADUATE STUDIES
DEPARTMENT OF PHYSICS
DETERMINATION AND CHARACTERIZATION OF CAFFEINE
CONTENT OF SMALL AND LARGE SIZE COFFEE BEANS IN
SIDAMA AND KAMBATA TAMBARO ZONES SOUTHERN,
ETHIOPIA USING UV-VIS SPECTROPHOTOMETER
Research Thesis
By
Tsegaye Bojago Dado
Advisor: Getachew Worku (PhD)
August 2019
Dilla University, Ethiopia
IJSER

International Journal of Scientific & Engineering Research Volume 11, Issue 7, July-2020 1085 ISSN 2229-5518
IJSER © 2020
http://www.ijser.org
DETERMINATION AND CHARACTERIZATION OF CAFFEINE
CONTENT OF SMALL AND LARGE SIZE COFFEE BEANS IN
SIDAMA AND KAMBATA TAMBARO ZONES SOUTHERN,
ETHIOPIA USING UV-VIS SPECTROPHOTOMETER
A Thesis Submitted to the School of Graduate studies
DILLA UNIVERSITY
By
Tsegaye Bojago
August 2019
Dilla University
ii
IJSER

International Journal of Scientific & Engineering Research Volume 11, Issue 7, July-2020 1086 ISSN 2229-5518
IJSER © 2020
http://www.ijser.org
APPROVAL SHEET OF THESIS
SCHOOL OF GRADUATE STUDIES
DILLA UNIVERSITY
As thesis research advisor, I herby certify that I have read and evaluated this thesis
research prepared, under my guidance by: Tsegaye Bojago, entitled: Determination and Characterization of caffeine content of small and large size coffee beans in Sidama andKambata Tambaro zones southern, Ethiopia using Uv-vis spectrophotometer andrecommend that it be accepted as fulfilling the thesis research requirement.
Name of Advisor Signature Date
Getachew Worku (PhD) …………………. ……………...
As members of the Examining board of the final M.Sc. open defense, we certify that we
have read and evaluated the thesis research prepared by: Tsegaye Bojago. We recommendedthat it be accepted as fulfilling the graduate project requirement for the degree of Master ofScience in physics (Laser Spectroscopy).
Name of Chairman Signature Date
………………………………… …………………. ……………...
Name of Internal Examiner Signature Date
………………………………… …………………. ……………...
Name of External Examiner Signature Date
………………………………… …………………. ……………...
iii
IJSER
International Journal of Scientific & Engineering Research Volume 11, Issue 7, July-2020 1087 ISSN 2229-5518
IJSER © 2020
http://www.ijser.org
STATEMENT OF THE AUTHOR
First, I declare that this study is my own work and all sources of materials used for thesis
work has been actual acknowledged. This work has been submitted in partial fulfillment of
the requirements of M.Sc. degree at Dilla University and is documented at the University
Library to be made available to borrow under rules of library. I strongly declare that this
thesis manual is not submitted to any other institution anywhere for the award of any
academic degree, diploma or certificate.
Brief quotations from this work research of thesis manual are allowed without special
permission that accurate and complete acknowledgement of the source is made. Requests
for permission for extended quotations from, or reproduction of, this thesis work in totally
or in part may be granted by the Head of the Department or the Dean of the School of
Graduate Studies when in his or her judgment the proposed use of the materials interest of
scholarship. For all other instances, permission must be obtained from the author of the
research worker based thesis.
Name: Tsegaye Bojago Signature: ___________________
Place: Dilla University, Dilla
Date of Submission: ____________________
IJSER

International Journal of Scientific & Engineering Research Volume 11, Issue 7, July-2020 1088 ISSN 2229-5518
IJSER © 2020
http://www.ijser.org
iv
IJSER

International Journal of Scientific & Engineering Research Volume 11, Issue 7, July-2020 1089 ISSN 2229-5518
IJSER © 2020
http://www.ijser.org
ACKNOWLEDGEMENTS
First of all I thank and praise the Almighty God who offered me everything from the
beginning up to the final of this work, since my ability is very limited without his help.
I am expressing my deepest gratitude to my advisors Dr. Getachew Worku for his endless
help, guidance and kindness approach with me. In addition to this I like to express my
deepest gratitude to Dr. Tolera Seda for his effective facilitation of different chemicals to
this work and equipments in Arbminch University.
I would like to thank our department head Yetinayet Tafa and all physics staffs in Dilla
University who encouraged me during this study and their facilitation of comfortable
studying conditions.
I respectfully thank Dr. Takele Teklu for his limitless adivice and the financial support to
this work and I am grateful to my families specially, my mother, my sister Adanech Seta
and all brothes who did their most in giving their invaluable adivice, materials needs for
this study. Moreover, I am also grateful to all friends and relatives contributing their most
for the present study.
IJSER

International Journal of Scientific & Engineering Research Volume 11, Issue 7, July-2020 1090 ISSN 2229-5518
IJSER © 2020
http://www.ijser.org
v
IJSER

International Journal of Scientific & Engineering Research Volume 11, Issue 7, July-2020 1091 ISSN 2229-5518
IJSER © 2020
http://www.ijser.org
ABBREVIATIONS AND ACCRONYMS
ANOVA analysis of variance
UV-VIS ultraviolet visible
CNS central nervous system
BP blood pressure
FT-IR Fourier transforms infrared spectrophotometer
EXC Ethiopia exchange commodity
PPM parts per million
CM centimeter
MM millimeter
SD standard deviation
CONC concentration
VS versus
DCM dichloromethane
IJSER

International Journal of Scientific & Engineering Research Volume 11, Issue 7, July-2020 1092 ISSN 2229-5518
IJSER © 2020
http://www.ijser.org
vi
IJSER

International Journal of Scientific & Engineering Research Volume 11, Issue 7, July-2020 1093 ISSN 2229-5518
IJSER © 2020
http://www.ijser.org
TABLE OF CONTENTS
STATEMENT OF THE AUTHOR .......................................................................................... iv
BIOGRAPHICAL SKETCH ..................................................................................................... v
ACKNOWLEDGEMENTS ...................................................................................................... vi
ABBREVIATIONS AND ACCRONYMS .............................................................................vii
LIST OF TABLES ..................................................................................................................... x
LIST OF FIGURES .................................................................................................................. xi
LIST OF FIGURES IN THE APPENDIX...............................................................................xii
ABSTRACT........................................................................................................................... xiii
1. INTRODUCTION ................................................................................................................. 1
2. LITERATURE REVIEW ...................................................................................................... 7
2.1. Spectroscopy.................................................................................................................... 9
2.2. Interaction of Light with Matter .................................................................................... 11
2.3. Beer-Lambert’s Law and Integrated Absorption Technique ......................................... 12
2.4. UV-Visible Absorption Spectra..................................................................................... 13
2.5. Comparison the Theoretical Results with Experimental Quantities.............................. 15
3. MATERIALS AND METHODS......................................................................................... 16
3.1. Study Area and Study Period......................................................................................... 16
3.2. Samples Collection ........................................................................................................ 17
3.3. Laboratory Instruments.................................................................................................. 17
3.4. Chemicals ...................................................................................................................... 18
3.5. Method of the Experiment ............................................................................................. 18
3.5.1. Coffee sample preparation ...................................................................................... 18
3.5.2. Roasting coffee bean ............................................................................................... 19
3.5.3. Grinding coffee beans ............................................................................................. 20
3.6. Instrumental Calibrations .............................................................................................. 21
3.6.1. Calibration curve graph for standard solution......................................................... 21
3.7. Characterization of Caffeine in Pure Water .................................................................. 22
3.7.1. Caffeine analysis ..................................................................................................... 22
3.7.2. Caffeine extraction with dichloromethane .............................................................. 23
4. RESULTS AND DISCUSSION .......................................................................................... 25
4.1. Data Analysis................................................................................................................. 25
4.1.1. Linearity of calibration graph.................................................................................. 25
4.1.2. Characterization of pure caffeine ............................................................................ 26
IJSER

International Journal of Scientific & Engineering Research Volume 11, Issue 7, July-2020 1094 ISSN 2229-5518
IJSER © 2020
http://www.ijser.org
vii
IJSER

International Journal of Scientific & Engineering Research Volume 11, Issue 7, July-2020 1095 ISSN 2229-5518
IJSER © 2020
http://www.ijser.org
TABLE OF CONTENTS (Continued)
4.1.3. Determination of caffeine in small and large size roasted coffee sample ............... 28
4.1.4. Coffee sample extraction by dichloromethane........................................................ 29
4.1.5. Determination of caffeine mass and its percentage from experimental data .......... 30
4.1.6. Caffeine concentration in selected Wordas of South Ethiopia................................ 30
4.1.7. Determination of caffeine content in Small and Large Roasted coffee from four
selected Woredas of South Ethiopia ................................................................................. 32
4.1.8. Caffeine content in coffee beans collected from each woredas .............................. 32
4.1.9. Absorbance of mean caffeine concentration extracted from coffee sample ........... 33
4.1.10. Mean absorbance of caffeine concentration in small and large size coffee from
selected four woredas ........................................................................................................ 34
4.2. Decadic molar absorption from coffee sample .............................................................. 35
4.2.1. The mean and standard deviation of molar decadic absorption coefficient in coffee
........................................................................................................................................... 36
5. CONCLUSION AND RECOMMENDATION................................................................... 38
5.1. Conclusion ..................................................................................................................... 38
5.2. Recommendation ........................................................................................................... 39
6. REFFERENCES .................................................................................................................. 40
7. APPENDICES ..................................................................................................................... 42
IJSER

International Journal of Scientific & Engineering Research Volume 11, Issue 7, July-2020 1096 ISSN 2229-5518
IJSER © 2020
http://www.ijser.org
ix
IJSER

International Journal of Scientific & Engineering Research Volume 11, Issue 7, July-2020 1097 ISSN 2229-5518
IJSER © 2020
http://www.ijser.org
LIST OF TABLES
Table Page
Table 1: Absorbance of standard solution ............................................................................... 21
Table 2 the measured value of absorbance from prepared standards. ..................................... 25
Table 3 Experimental result and measured value of coffee sample......................................... 29
Table: 4 mass of caffeine (g) and its percentages from experimental data.............................. 30
Table 5: Mean concentrations of caffeine in small and large roasted coffee samples from four
woredas of South Ethiopia ....................................................................................................... 31
Table 6 The mean caffeine concentration in Small and Large Roasted coffee from each
selected woredas ...................................................................................................................... 32
Table 7; mean absorbance of caffeine of coffee sample by uv-vis spectrophotometer. .......... 33
Table: 8 mean molar decadic absorption of coffee sample from conc. and absorbance ......... 34
Table: 9 the calculated value of mean molar decadic absorption coefficient and standard
deviation................................................................................................................................... 35
Table: 10 Mean molar decadic absorption of coffee sample from conc. and absorbance…...36
IJSER

International Journal of Scientific & Engineering Research Volume 11, Issue 7, July-2020 1098 ISSN 2229-5518
IJSER © 2020
http://www.ijser.org
x
IJSER

International Journal of Scientific & Engineering Research Volume 11, Issue 7, July-2020 1099 ISSN 2229-5518
IJSER © 2020
http://www.ijser.org
LIST OF FIGURES
Figure Page
Figure 1: Interactions of Light with Matter ............................................................................. 11
Figure 2:UV-Visible Absorption spectra ................................................................................. 14
Figure 3; Indicates selected Zones( map) ................................................................................ 16
Figure 4; coffee screening process with sieving mesh............................................................. 18
Figure: 5 roasting process of coffee beans............................................................................... 19
Figure: 6 grinding process of roasted coffee............................................................................ 20
Figure 7 sealed ground coffee powder ..................................................................................... 20
Figure 8 ; water coffee solution ............................................................................................... 22
Figure: 9, The process of stirring filtrated coffee water solution by DCM. ............................ 23
Figure:10 ,The extracting process of caffeine by DCM. ......................................................... 24
Figure: 11Absorption of caffeine concentration measured by uv-vis spectrophotometer ....... 24
Figure 12 calibration graph of standard solution. .................................................................... 26
Figure 13 UV–vis absorption spectra of caffeine in water were found to be in region of 2
43-300nm. ................................................................................................................................ 27
Figure 14 the UV/vis absorption spectra of caffeine in dichloromethane were found to be in
the region of 200–320 nm. ....................................................................................................... 28
Figure:15 Comparssion of mean caffeine concentration in small and large..…….………… 31
IJSER

International Journal of Scientific & Engineering Research Volume 11, Issue 7, July-2020 1100 ISSN 2229-5518
IJSER © 2020
http://www.ijser.org
xi
IJSER

International Journal of Scientific & Engineering Research Volume 11, Issue 7, July-2020 1101 ISSN 2229-5518
IJSER © 2020
http://www.ijser.org
LIST OF FIGURES IN THE APPENDIX
Appendix Figure Page
Figure: 1 Uv-vis absorption spectra of Boricha small size coffee sample..……………. …..42
Figure: 2 Uv-vis absorption spectra of Boricha large size coffee sample…………...………43
Figure: 3 Uv-vis absorption spectra of Wondogenet small size coffee sample……………...44
Figure4: Uv-vis absorption spectra of Wondogenet large size coffee sample……………….45
Figure 5 Uv-vis absorption spectra of Kachabira small size coffee sample………………....46
Figure: 6 Uv-vis absorption spectra of Kachabira large size coffee sample…………………47
Figure: 7 Uv-vis absorption spectra of Hadaro small size coffee sample……………………48
Figure: 8 Uv-vis absorption spectra of Hadaro large size coffee sample…………………....49
IJSER

International Journal of Scientific & Engineering Research Volume 11, Issue 7, July-2020 1102 ISSN 2229-5518
IJSER © 2020
http://www.ijser.org
ABSTRACT
In this study work using UV/vis spectrophotometer, the caffeine determination and
comparison, as well as characterization of caffeine from small and large size roasted coffee
by molar decadic absorption coefficient of pure caffeine were studied. The molar decadic
absorption coefficient of pure caffeine in water, wavelength at 272.5nm and dichloromethane
at275nm were 27.73 and respectively.
The extraction of caffeine from coffee sample in water solution was helped by
dichloromethane and the mean value of caffeine in coffee sample calculated one way analysis
of variance (ANOVA) and based on the ANOVA result at 0.05significance of confident level.
The mean value of Caffeine concentration in small and large size coffee bean were
significantly different. the mean concentration of caffeine was significantly high in small
coffee beans as compared to large coffee beans (mean 29.75 Vs 22.42 with SD of 4.070 Vs
4.641; t= 4.1; P<0.001).
The mean mass of caffeine in small and large size coffee bean in (g) were
(0.07665 ) and (0.0567 The mean percentagecontent in small and large size coffee bean in (g) were (7.665Respectively.The mean molar decadic absorption coefficient in small and large
size roasted coffee sample were (31.65 32.28 ) respectively, The
transition dipole moment of pure caffeine in water at 272.5nm and dichloromethane at 275nm
were ( Cm) and ( .
The mean absorbance of coffee sample in small and large roasted coffee beans were (0.946
0.7225 ) respectively=3.47145; p=0.01328.
Keywords; caffeine content, coffee, extraction, determination, uv-vis spectrophotometer.
xiii
IJSER
International Journal of Scientific & Engineering Research Volume 11, Issue 7, July-2020 1103 ISSN 2229-5518
IJSER © 2020
http://www.ijser.org
CHAPTER ONE
1. INTRODUCTION
1.1. Background
Coffee is one of the most popular beverages and an important commodity, for many years
next to oil, (Ramalakshmi, Raghavan, 1999; Tsegaye, Y; O, Getachew and Z. Tesfaye,
2000) whatever the resources of the woodland flora may be the two main species exploited
in the world at the present time are coffee Arabica L. and coffee canephor Pierre (Robusta).
Other species of coffee are being cultivated less extensively, although they are still found
in certain countries for various reasons.
Coffee canephor has a very wide geographic distribution, extending from the western to
the central tropical and subtropical regions of the African continent, from Guinea and
Liberia to Sudan and the Uganda forest, with a high concentration of types in the
Democratic Republic of Congo (Carencro, 1997). Coffee canephors or Robusta, grows at
low altitudes (about 850 m), and accounts for 80% of African coffee production. However,
Robusta has also been cultivated in American and Asian countries (Vinod et al., 2006)
The history of coffee has been recorded as far back as the ninth century. During that time,
coffee beans were available only in their native habitat, Ethiopia. A popular legend traces
its discovery to a goat herder named kaldi, who apparently observed goats that become
elated and sleepless at night after grazing on coffee shrubs and, upon trying the berries that
the goats had been eating, experienced the same vitality. In 1587, MalayeJaziri compiled a
work tracing the history and legal controversies of coffee. In this work, Jaziri recorded that
one sheikh, Jamal-al-Coffee is originated in the highlands of Ethiopia, and from there
spread into the Arabic world and became known in Europe during the early 17th century,
at first as a medicine and then as a social drink in the Arab tradition. Drinking coffee,
which in the Amharic language is called ―Buna‖, is an important element of cultural
beverage in Ethiopia. Enormous industrial plantations are situated in the South-West of the
country, but it is possible to come across single small trees literally everywhere. The
peoples of the South who cannot afford genuine coffee prepare a beverage with the use of
the husks of coffee grains,(Ethiopian Commodity Exchange Authority, 2008).
IJSER

International Journal of Scientific & Engineering Research Volume 11, Issue 7, July-2020 1104 ISSN 2229-5518
IJSER © 2020
http://www.ijser.org
1
IJSER

International Journal of Scientific & Engineering Research Volume 11, Issue 7, July-2020 1105 ISSN 2229-5518
IJSER © 2020
http://www.ijser.org
Coffee is a crucial to the economies and politics of many developing countries and the
worlds’ least developed countries, exports of coffee account for more than 50℅ of their
foreign exchange earnings.Its cultivation, processing, trading, transportation and
marketing provide employment for hundreds of millions of people worldwide. In Ethiopia,
coffee had been and still contributes to the Lion’s share in its national economy being the
leading source of foreign exchange earnings. Besides, the livelihood of a quarter (25%) of
the Ethiopian population depends directly or indirectly on the different processes of
production and marketing along the coffee value-chain, (Grima et al., and 2008). It is a
typical global commodity because it is usually produced in developing countries and
consumed in developed countries. Therefore, marketing channels extend beyond borders,
hand the price of coffee is basically determined at international exchange markets in New
York and London (International coffee organization (ICO), 2009; Kodama, 2007). Most of
Ethiopian coffee is practically organic, and only a fee for the organic certificate is
required.
There are four types of production systems in Ethiopia; forest coffee, semi-forest coffee,
garden coffee and plantation coffee. 95℅ of the coffee production from these systems can
be considered as organic, although not yet officially certified. Forest coffee accounts for
about 10℅, semi- forest coffee accounts for about 35℅, garden coffee accounts for about
50℅, and plantation coffee accounts for about 5℅ of total coffee production in Ethiopia.
Most of Ethiopian coffee is practically organic, and only a fee for the organic certificate is
required.
The export volume of Ethiopian organic coffee is the second largest in the world next to
that of Peru (Kodama, 2007; International coffee organization (ICO), 2009. Due to the
economic importance of coffee there is an increasing demand for proper quality control for
certification of its contents and substances in standardized products. Therefore by using
accurate analytical methods for quantitative determinations of chemical substances in
coffee are needed. Nowadays, coffee is produced in a large number of countries
worldwide.
Coffee grows under diverse environmental conditions ranging from 550m to 2600 m
above sea level, with annual rainfall from 1000-2000 mm, temperature (minimum and
maximum from 8-150C, and 24-310C, respectively), requires deep, well drained, loamy
and slightly acidic soils (Paulos and Tesfaye, 2000). The estimated area of land covered by
IJSER

International Journal of Scientific & Engineering Research Volume 11, Issue 7, July-2020 1106 ISSN 2229-5518
IJSER © 2020
http://www.ijser.org
2
IJSER

International Journal of Scientific & Engineering Research Volume 11, Issue 7, July-2020 1107 ISSN 2229-5518
IJSER © 2020
http://www.ijser.org
coffee is about 662,000 hectares, whereas the estimated annual national production of
clean coffee is about 350,000 tons (Almayehu et al., 2008).
Caffeine is a bitter, white crystalline xanthenes alkaloid that is a psychoactive stimulant
drug. Caffeine was discovered by a German chemist, Friedrich Ferdinand Runge, in 1819.
He coined the term caffeine, a chemical compound in coffee (the German word for which
is kaffee), which in English become caffeine.
Caffeine is an alkaloid of the methylxanthine family which is a naturally occurring
substance found in the leaves, seeds or fruits of over 63 plants species worldwide
(Wanyika et al., 2010 H. N.; Gatebe, E. G.; Gitu, L. M.; Ngumba, E. K.; and Maritim, C.
W.). Pure caffeine occurs as odorless, white fleecy masses, glistening needles of powder.
Its molecular weight is 194.19 g/mole, melting point 236 C, point at which caffeine
sublimes is 178 Atmosphericpressure, specific gravity is 1.2, volatility is 0.5%, vapor
pressure is 760 mmHg at 178 oC; solubility in water is 2.17%, vapor density 6.7 and pH
values in the range of 6 to 9, (Belay ;2011).
The world's primary source of caffeine is the coffee bean which is actually the seed of the
coffee plant, from which coffee is, brewed (Wanyika et al,2010).The highest
concentrations of caffeine are found in the leaves and beans of the coffee plant, in tea,
yerba mate, guarana berries, the kola nut and cocoa (Meltzer et al,2008). In the literature
the amount of caffeine found in these products have been reported as the highest amounts
are found in guarana (4–7%), followed by tea leaves (3.5%), mate tea leaves (0.89–1.73%),
coffee beans (1.1–2.2%), cola nuts (1.5%), and cocoa beans (0.03%) (Clifford, N, (1990).
Ramirez, Martinez, J. R (1990).
The caffeine is degraded relatively slowly and involves demethylation steps to yield
theobromine and theophyline. Theophyline is catabolized to xanthenes via 3-methyl
xanthenes. However, it is unclear either 3-methyl xanthenes or 7-methyl xanthenes are
intermediates in the conversion of theobromine to xanthenes (Kumar et al., 2006).
Caffeine found in many plant species, where it acts as a natural pesticide, with high
caffeine levels being observed in seedlings that are still developing foliage, but are lacking
mechanical protection. Common sources of caffeine are coffee, tea, and a lesser extent
chocolate derived from cocoa beans. Pure caffeine occurs as odorless, white fleecy masses,
glistening needles of powder. Its molecular weight is 194.19g, melting point is 236 point
at which caffeine sublimes is 178 at atmospheric pressure, pH is 6.9(1% solution), specific
o
IJSER

International Journal of Scientific & Engineering Research Volume 11, Issue 7, July-2020 1108 ISSN 2229-5518
IJSER © 2020
http://www.ijser.org
3
IJSER

International Journal of Scientific & Engineering Research Volume 11, Issue 7, July-2020 1109 ISSN 2229-5518
IJSER © 2020
http://www.ijser.org
gravity is 1.2, volatility is 0.5%, vapor pressure is 760mmHg at 178; solubility in water is
2.17%, vapor density 6.7.
1.2. Statement of the Problem
One of the world's primary sources of caffeine is the coffee "bean" (which is the seed of
the coffee plant), from which coffee is brewed. Caffeine content in coffee varies widely
depending on the type of coffee varieties and the method of preparation used. Caffeine is a
central nervous system (CNS) and metabolic stimulant, and is used both recreationally and
medically to reduce physical fatigue and restore mental alertness when unusual weakness
or drowsiness occurs (Nehlig, A; Daval, JL; Debry, G (1992).Caffeine stimulates the CNS
first the higher levels, resulting in increased alertness and wakefulness, faster and clearer
flow of thought, increased focus, and better general body coordination, and later at the
spinal cord level at higher doses.
Extraction of caffeine from coffee, to produce decaffeinated coffee and caffeine is an
important industrial process and can be performed using a number of different solvents.
Benzene, chloroform, trichloroethylene and dichloromethane have all been used over the
years but for reasons of safety, environmental impact, cost and flavor, they have been
superseded by water extraction and supercritical carbon dioxide extraction methods.
Caffeine absorbs strongly in the ultraviolet region (272 nm in water and 276 nm in
dichloromethane) and this provides the basis of innumerable spectrophotometer methods,
(Clarke and Marroe, 1985; R. J.; Macarae, Z. R. 1985). For caffeine content determination
from roasted coffee many analytical methods have been reported. Normally, high-
performance liquid chromatography separation and UV/Vis spectrophotometer detection
methods are applied.
Spectrophotometer method is relatively simple sensitive, rapid, reproducible valid and the
most suitable for on line monitoring, when considerable attention is paid to the removal of
interfering compounds using mathematical methods. A method is used for quantitative
determination of one or more species in mixtures by Beer-Lambert’s law and for
determination of the particular species in a mixture or the identification of certain
functional groups in a compound under structural investigation (Thorne, 1988; Rao, 1975;
Bauman, 1962).
IJSER

International Journal of Scientific & Engineering Research Volume 11, Issue 7, July-2020 1110 ISSN 2229-5518
IJSER © 2020
http://www.ijser.org
4
IJSER

International Journal of Scientific & Engineering Research Volume 11, Issue 7, July-2020 1111 ISSN 2229-5518
IJSER © 2020
http://www.ijser.org
In this research, it is intended to determine the quantitative comparison, compositional
analysis of Caffeine compound of small and large roasted coffee beans using
spectrophotometer via experimental and computational methods.
Caffeine is provided through a number of different sources, most commonly through
coffee, tea and soft drinks. Like many other drinks, coffee is a mixture of many macro and
micro nutrients within it. Therefore, it is the most popular beverages consumed and
worldwide, worth it is considered to nutritional contribution to make our balance diet, in
coffee, it is believed to have implication upon human health. Thus it has been very
important; to determine caffeine amount in the coffee due to the reason that coffee is used
in our day to day consumption with high amount of caffeine. In addition, it is also
important to see presence of caffeine amount difference in large and small size coffee
beans.
In spite of the fact that coffee is the most economic source in SNNPR region, caffeine
amount in coffee was not well documented in the region. Therefore, this study is intended
to determine the amount of caffeine and its difference in large and small size as well as to
characterize caffeine content in roasted coffee beans by molar decadic absorption and
transitional dipole moment in selected Zones (Sidama and KambataTambaro) of SNNPR,
Ethiopia.
1.3. Objective of the Study
1.3.1. General Objective
The main objective of this study is to determine the caffeine content of small and large
size coffee beans from Sidama and KambataTambaro zones southern, Ethiopia using
uv-vis spectrophotometer.
1.3.2. Specific Objectives
To determine the caffeine content in small and large size roasted coffee beans.
To compare caffeine content in small and large size coffee beans.
To characterize caffeine content in coffee bean by molar decadic absorption
coefficients and translational dipole moment of pure caffeine.
IJSER

International Journal of Scientific & Engineering Research Volume 11, Issue 7, July-2020 1112 ISSN 2229-5518
IJSER © 2020
http://www.ijser.org
5
IJSER

International Journal of Scientific & Engineering Research Volume 11, Issue 7, July-2020 1113 ISSN 2229-5518
IJSER © 2020
http://www.ijser.org
1.4. Significance of the Study
The aim of this study is to determine the amount of caffeine in small and large size roasted
coffee beans. Currently Regular daily consumption of caffeine containing beverages
mainly coffee is widespread throughout the globe. However; excessive caffeine
consumption should be avoided by people who are being treated for certain condition such
as depression, anxiety and heart problems.
In line with this, the study provide basic information on the amount of caffeine in small
and large size roasted coffee beans, in ordered to determine whether roasted coffee beans
from selected zones should be decaffeinated before used .in addition to this, the study will
provide base line information about the caffeine content in small and large size roasted
coffee beans. Moreover, it will give the base line data for further study.
1.5. Scope of the Study
The scope of this study is to determine the amount of caffeine in small and large
roasted coffee bean by using uv–vis spectrophotometer and characterization of coffee bean
by molar decadic absorption coefficients and transitional dipole moment of pure caffeine.
IJSER

International Journal of Scientific & Engineering Research Volume 11, Issue 7, July-2020 1114 ISSN 2229-5518
IJSER © 2020
http://www.ijser.org
6
IJSER

International Journal of Scientific & Engineering Research Volume 11, Issue 7, July-2020 1115 ISSN 2229-5518
IJSER © 2020
http://www.ijser.org
CHAPTER TWO
2. LITERATURE REVIEW
The coffee tree belongs to the large Rubiaceae family within which it constitutes the
coffee genus. Although more than 80 coffee species have been identified worldwide
(Clarke, 2003), only two are economically important. Coffee Arabica, also known as
Arabica coffee, is responsible for approximately 70% of the global coffee market, and
coffee canephor or Robusta coffee (commercial name of one of the main c. canephor
cultivars) accounts for the rest (ICO, 2011). Arabica coffee is the species that has been
known for the longest time and is also the widespread throughout the world. It is the only
tetraploid in the genus, with 2n=44, (Almayehu ; Wilson).
There is much speculation but only limited evidence of coffee consumption being linked
to protective effects on human health. Literatures reveal coffee beans contain efficient
water soluble antioxidants, such as chlorogenic acids, caffeic acids, ferulic acids,
p-coumarou acids, melanoids and alkaloids (Adam et al., 2006) and their content depends
mainly on the coffee species, origin and degree of roasting (Huck et al., 2005; Belay et al.,
2008).
The caffeine content of green coffee beans varies according to the species. During roasting
there is no significant loss in terms of Caffeine, Caffeine was discovered by a German
chemist, Friedrich Ferdinand Runge, in 1819. He coined the term caffeine, a chemical
compound in coffee (the German word for which is kaffee), which in English become
caffeine (Anonymous, 2009). Caffeine found in many plant species, where it acts as a
natural pesticide, with high caffeine levels being observed in seedlings that are still
developing foliages, but are lacking mechanical protection (Frischknecht et al.,
1986)Experimental studies that investigated the cardiovascular effects of caffeine found an
increase in systolic or diastolic blood pressure (BP), increase in blood sugar, increase in
gastric acid and pepsin secretion, increased plasma levels of fatty acids and decreased
heart beat rate (HR) at doses as low as 1 mg/kg in children and 1.4 mg/kg in adults.
Caffeine intakes of ≥1.4 mg/kg increased aortic stiffness, in-creased vascular resistance,
decreased cerebral blood flow, increased plasma epinephrine, and rennin activity reported
by,(BlenWeldegebreal al,2016) ,(Milanez,S.2011).
IJSER

International Journal of Scientific & Engineering Research Volume 11, Issue 7, July-2020 1116 ISSN 2229-5518
IJSER © 2020
http://www.ijser.org
7
IJSER

International Journal of Scientific & Engineering Research Volume 11, Issue 7, July-2020 1117 ISSN 2229-5518
IJSER © 2020
http://www.ijser.org
Recently appeared methods (1996–2012) reporting the determination of caffeine in
various sample matrices (environmental, biological, plants, food, etc.) cover a broad
spectrum of instrumental analysis (Ally, 2013). Many methods exist for determining the
methylxanthine contents of food and beverages. Some of these methods include
UV-Visible spectrophotometers, electro analytical, the overall land area devoted to coffee
production due to new plantings is increasing and estimated to be 662,000 hectares, of
which 496,000 hectares are estimated to be productive. The average annual production is
amounting to about 350,000 ton and productivity of about 0.71 t/ha (Almayehu, 2008).
There is much speculation but only limited evidence of coffee consumption being linked
to protective effects on human health. Literatures reveal coffee beans contain efficient
water soluble antioxidants, such as chlorogenic acids, caffeic acids, ferulic acids,
p-coumarou acids, melanoids and alkaloids (Adam et al., 2006) and their content depends
mainly on the coffee species, origin and degree of roasting (Huck et al., 2005; Belay et al.
Common sources of caffeine are coffee, tea, and a lesser extent chocolate derived from
cocoa beans (Matissek, 1997). Pure caffeine occurs as odorless, white fleecy masses,
glistening needles of powder. Its molecular weight is 194.19g, melting point is 236, point
at which caffeine sublimes is 178 at atmospheric pressure, pH is 6.9(1% solution), specific
gravity is 1.2, volatility is 0.5%, vapour caffeine (Ramalakshmi and Raghavan, 1999).
Caffeine is one of the most widely used psychoactive substances in the world, its
estimated global consumption being 120,000 tons per year. Caffeine is of major
importance with respect to the physiological properties of coffee, and also in determining
the strength, body and bitterness of brewed coffee. It also increases the effectiveness of
certain drugs. Hence, it is used with some over-the-counter drugs for the treatment of
conditions such as migraine and cluster headaches (Salihovic et al., 2014).
For most healthy adults, consuming moderate doses of caffeine, or about 200 to 300 mg a
day, equal to about two to four cups of brewed coffee, is not harmful. Studies have shown
it can help relieve pain, thwart migraine headaches, reduce asthma symptoms, and elevate
mood. Although caffeine can contribute to dehydration, recent studies show that it is not
dehydrating in moderate amounts, even for athletes (Nicole and Olsen, 2013).
For caffeine content determination from roasted coffee many analytical methods have
been reported. Normally, high-performance liquid chromatography separation and UV/Vis
spectrophotometer detection methods are applied. Also other methods such as capillary
IJSER

International Journal of Scientific & Engineering Research Volume 11, Issue 7, July-2020 1118 ISSN 2229-5518
IJSER © 2020
http://www.ijser.org
8
IJSER

International Journal of Scientific & Engineering Research Volume 11, Issue 7, July-2020 1119 ISSN 2229-5518
IJSER © 2020
http://www.ijser.org
electrophoresis, thin layer chromatography and gas chromatography, are used for
separation of caffeine in the analysis of mixtures, combined with several other detection
methods such as mass spectroscopy and FTIR spectrophotometric measurements.
However, very costly instrumentation, highly skilled technicians and complicated and time
consuming procedures are required for such methods. Spectrometric method is simple
sensitive, rapid, reproducible valid and the most suitable for on line monitoring, when
considerable attention is paid to the removal of interfering compounds using mathematical
methods.
2.1. Spectroscopy
Spectroscopy is a scientific measurement technique. It measures light that is emitted,
absorbed, or scattered by materials and can be used to study, identify and quantify those
materials. Spectroscopy is the study of the interaction of light and matter; it plays an
important role in the emergence and validation of quantum theory in the early twentieth
century. Molecular spectroscopy is the study of the absorption or emission of
electromagnetic radiation by molecules. Quantum theory and Einstein’s concept of
photons converge in our modern microscopic view of spectroscopy.
A typical spectrum consists of the intensity of a certain response, such as absorption of
light, as a function of frequency of the light. The intensity is a measure of the rate at which
molecules make transitions from one energy level to another, while the frequency is
directly related to the difference in the initial and final energies of the molecule (Bauman’s.
P,1962), Several processes leading to emission or absorption may occur in the atom or
molecule, to a good approximation each of these processes is associated with radiation of
very different frequency ranges. Several types of spectroscopy may be distinguished on
the bases of the frequency range in which measurements are made as well as the type of
information sought.(Laqua K. et al, 1988).One can often understand the nature of the
molecular charges that are responsible for the emission or absorption of the radiation. In
such cases, the experimental spectroscopic data can be used to determine quantitative
value for various molecular properties. When the theory of molecular spectra is treated; it
is convenient to classify Spectra according to the type of molecular energy that is being
altered in the emission and absorption process.
IJSER

International Journal of Scientific & Engineering Research Volume 11, Issue 7, July-2020 1120 ISSN 2229-5518
IJSER © 2020
http://www.ijser.org
9
IJSER

International Journal of Scientific & Engineering Research Volume 11, Issue 7, July-2020 1121 ISSN 2229-5518
IJSER © 2020
http://www.ijser.org
In this way the principal headings for the material that is to be presented can be arrived at.
These are: Rotational spectra due to changes in the rotational energy of the molecule;
Vibration spectra due to changes in the vibration energy of the molecule and Electronic
spectra due to changes in the electronic energy of the molecule due to different electron
arrangements. The quantized internal energy Eint of a molecule in its electronic ground or
excited state can be approximated with sufficient accuracy for analytical purposes, by (2.1)
where Eel is the electronic, Evib the vibration and the rotational energy respectively.
Absorption of a photon results in a change of the electronic energy accompanied by
changes in the vibration and rotational energies. Each veronica transition, i.e. a particular
electronic plus vibration transition, corresponds to an absorption band consisting of the
rotational lines in liquids and solids the rotational lines are broad and overlap so that no
rotational structure is distinguishable. The experimental data that such studies provide are
the frequencies, or wavelengths, of the radiation and the amount of radiation emitted or
absorbed by the sample, one can often understand the nature of the molecular charges that
are responsible for the emission or absorption of the radiation.
Spectroscopic techniques provide a non destructive, fast and cheap determination of
caffeine in green and roasted coffee beans. But UV-Vis spectrophotometer method cannot
be used directly for determination of caffeine in coffee beans extracted with water owing
to the matrix effect of UV-Vis absorbing substances in the sample matrix by ( Belay et al,
2008).In roasted coffee beans it was observed that there is spectral interference from
caffeine and chlorogenic acid in the wavelength regions of 200-500 nm. Yet this method
requires the extraction of Caffeine from coffee powder in water solution using
dichloromethane for the spectroscopic determination. This is necessary since the
caffeine spectrum is overlapped with other compounds found in coffee. Hence, the use of
dichloromethane limits from wider application of UV-Vis method which is described
above
In such cases, the experimental spectroscopic data can be used to determine quantitative
value for various molecular properties when the theory of molecular spectra is treated; it is
convenient to classify spectra according to the type of molecular energy that is being
IJSER

International Journal of Scientific & Engineering Research Volume 11, Issue 7, July-2020 1122 ISSN 2229-5518
IJSER © 2020
http://www.ijser.org
10
IJSER

International Journal of Scientific & Engineering Research Volume 11, Issue 7, July-2020 1123 ISSN 2229-5518
IJSER © 2020
http://www.ijser.org
2.2. Interaction of Light with Matter
One of the most important and interesting aspects of spectroscopy are study the
propagation of light through matter. In this the interaction of light with matter by classical
and semi-classical theory are discussed. The mathematical derivation that can often n used
for qualitative and quantitative understanding of how transitions induced in molecular
System are presented by semi-classical approach. The time dependent Schrodinger
equation has been solved to relate, the theoretical expressions, (the transition dipole
moment) with the experimental quantities, (the molar extinction coefficient, and extinction
coefficient) that are important in UV-is spectroscopy. Only green light can be transmitted
(pass through) this material. Interactions between light and matter determine the
appearance of everything around us.
Figure 9: Interactions of Light with Matter,
IJSER

International Journal of Scientific & Engineering Research Volume 11, Issue 7, July-2020 1124 ISSN 2229-5518
IJSER © 2020
http://www.ijser.org
11
IJSER

International Journal of Scientific & Engineering Research Volume 11, Issue 7, July-2020 1125 ISSN 2229-5518
IJSER © 2020
http://www.ijser.org
2.3. Beer-Lambert’s Law and Integrated Absorption Technique
In optics the quantitative spectrophotometers is based on the two principal law of
Photometry namely Beer and Lamberts law. The Beer-Lambert’s law relates the
absorption of light to the properties of the materials through which the light travels. The
law states that there is a logarithmic dependence between the transmission, T, of light
through substance and the absorption coefficient of substance, α, and the distance the light
travel through the material (the path length), l.
The absorption coefficient can, in turn be written as a product of either a molar absorption
coefficient of the absorber, ɛ, and the concentration c, of the absorbing species in material
or the absorption cross-section, σ, and number density N of the absorbers. For liquids,
these relations are usually written as.,
Where and are the intensities of the incident and transmitted light respectively, for
gases and in particular among physicist and for some spectroscopic techniques (Bauman,
1962; Thorne; 1988; Milonni and Eberly, 1988). The transmission for liquid substances
expressed in terms of absorbance as follow,
( )
The absorption cross-section σ, related to the absorption coefficient α at a single frequency
for N number of molecules per unit volume can be expressed by the following relation,
(Thorne; 1988; Milonni and Eberly, 1988)
However, in a UV-Vis spectrophotometer, the absorption of molecules in a liquid occurs
over a certain range of frequencies rather than at a single frequency reported by, (Abebe et
al;Thorne, Ture, K.; Redi, M.; Asfa , 1988; Rao, 1975).Therefore, absorption coefficient
measured at any single frequency may not express the true intensity of the molecular
transition. An Integrated absorption coefficient which is the sum of absorption coefficients
for all frequencies in the band is preferable in such cases; the technique is useful for
IJSER

International Journal of Scientific & Engineering Research Volume 11, Issue 7, July-2020 1126 ISSN 2229-5518
IJSER © 2020
http://www.ijser.org
12
IJSER

International Journal of Scientific & Engineering Research Volume 11, Issue 7, July-2020 1127 ISSN 2229-5518
IJSER © 2020
http://www.ijser.org
different applications since it is independent of the line function which may vary by
parameters like
Pressure, temperature, concentration of the solute and solute-solvent interaction as
reported by,(Thorne, 1988; Rao, 1975; Liptay, 1969). In addition to that, the technique is
very important in the absence of a high-resolution spectrometer, (Ephraim, GD.; Grima,
W.W.; Araya S, A. Ramsey, 1951).Therefore, in liquids and solutions where the above
effects are observed, the true integrated absorption intensity of a band should be defined
by the following equation. :
2.1.4
Using Eq (2.1.2) into (2.1.4) yields
2.1.5
From the integrated absorption coefficient, the integrated absorption cross-section can be
calculated using the following equation (Milonni and Eberly, 1988).
2.1.6
Where, is the integrated absorption cross-section, and the integrated absorption
coefficient, and N, is the number density
2.4. UV-Visible Absorption Spectra
The visible region of the spectrum comprises photon energies of 36 to 72 kcal=mole, and
the near ultraviolet region, out to 200 nm, extends this energy range to 14kcal=mole.
Ultraviolet radiation having wavelengths less than200nm is difficult to handle.
IJSER

International Journal of Scientific & Engineering Research Volume 11, Issue 7, July-2020 1128 ISSN 2229-5518
IJSER © 2020
http://www.ijser.org
13
IJSER

International Journal of Scientific & Engineering Research Volume 11, Issue 7, July-2020 1129 ISSN 2229-5518
IJSER © 2020
http://www.ijser.org
Figure 10: UV-Visible Absorption spectra
Squinty, absorption the six transitions outlined, only the two lowest energy ones are
achieved by the energies available in the 200 to 800 nm spectrum. For molecules that
possess bonding energy that is available can promote electrons from a bonding
molecular orbital to a anti-bonding molecular orbital.This is called a transition.
The energy difference for such a transition to occur will depend upon the atoms
bonded to each other, other atoms attached as well as the relationship between two or
more bonds within the molecule. bonds between two carbon atoms will have a
different transition compared to bonds between a carbon and an oxygen
atom (a carbonyl) or a bond between a carbon atom and a nitrogen atom (in a nitrite) :
This is because there will be a different energy gap between the bonding and
anti-bonding molecular orbital energy states. The greater the energy of transition the
shorter is the wavelength of UV orVisible radiation will have to be for electrons to be
promoted from the bonding to the anti-bonding state. Every group of atoms with
bonding will have a different wavelength where maximum absorption will take place. This
is called the the wavelength where maximum absorption takes place, and the group
of atoms with the π bonding is called a chromospheres’ each chromophore will have a
different energy of transition between the bonding and anti-bonding molecular orbital for
which the electron transition takes place.
IJSER

International Journal of Scientific & Engineering Research Volume 11, Issue 7, July-2020 1130 ISSN 2229-5518
IJSER © 2020
http://www.ijser.org
14
IJSER

International Journal of Scientific & Engineering Research Volume 11, Issue 7, July-2020 1131 ISSN 2229-5518
IJSER © 2020
http://www.ijser.org
2.5. Comparison the Theoretical Results with Experimental Quantities
Now, let us relate the measurable quantities, the molar decadic absorption coefficient ε to
quantum mechanical expression that means the theoretical expression for the rate of
transfer of molecules from ground to excited state. The molar decadic absorption
coefficient, Eq (2.4.1) related to the absorption coefficient by the following Eq (2.4.2)
(Barrow, 1962; Ban well, 1972).
2.4.7
and where c, is the concentration
IJSER

International Journal of Scientific & Engineering Research Volume 11, Issue 7, July-2020 1132 ISSN 2229-5518
IJSER © 2020
http://www.ijser.org
15
IJSER

International Journal of Scientific & Engineering Research Volume 11, Issue 7, July-2020 1133 ISSN 2229-5518
IJSER © 2020
http://www.ijser.org
CHAPTER THERE
3. MATERIALS AND METHODS
In this chapter Study area and study period, Samples Collection, laboratory instruments,
chemicals and samples experimental procedures were included.
3.1. Study Area and Study Period
The study was carried out in two selected Zones of southern Ethiopia from November
2017 to December 2017. The South Region shares borders with Kenya in the South part,
South Sudan in the West part and Oromia Regional State in the East and North parts
(Fig.3).Coffee is one of the best cash plant in southern Region. In the region there are 10
and 1 special woredas Zones that are mainly depending on coffee plantings.
Of them the two Zones such as Sidama and KambataTambaro were selected based on their
high coffee productivity and geographically feasibility.
Figure 11: is Indicates selected Zones (map).
IJSER

International Journal of Scientific & Engineering Research Volume 11, Issue 7, July-2020 1134 ISSN 2229-5518
IJSER © 2020
http://www.ijser.org
16
IJSER

International Journal of Scientific & Engineering Research Volume 11, Issue 7, July-2020 1135 ISSN 2229-5518
IJSER © 2020
http://www.ijser.org
3.2. Samples Collection
The green coffee beans were collected from southern region, Sidama (wondogenet and
Boricha) and kambataTambaro (kachabira and hadaro) Zones, SNNPR, Ethiopia. The
collected green coffee samples were species of coffee Arabica informed from each
woredas farmer. Then collected eight coffee samples were taken to Ethiopia, commodity
exchange (ECX) laboratory Woliata at where the roasting and grinding process was
occurred.
3.3. Laboratory Instruments
All the laboratory instruments were safely used for their roles and activity,
Electronic balance and Electronic microbalance were used to measure mass of
coffee before roast and pure caffeine respectively.
The Electric motor grinder (GUATEMALA SB, USA) was used to grinding
roasted coffee beans and ProbatWerkeEmmeirch Am Rhein Germany (AC
Induction Motor 41K25GN-CF, USA) used to roast green coffee beans,
Beakers were thoroughly washed and used to measuring volume of conc.,
de-ionized water and dichloromethane.
Safely washed Cylinders were used to measuring volume of extracted
concentration of caffeine.
Spatula was used to add the coffee sample powder and pure caffeine in to
solvents.
Quartz cuvette was used to take measuring concentration in the UV/Vis
spectrophotometer.
separator funnels caffeine from were used to extract the coffee water solution,
The glass filter was used to filtrate coffee water solution from interfering
substances, the coffee water solution was stirred with magnetic stirrer with hot
plate, and the watch was needed to record the duration of time.
The UV/Vis spectrophotometer was the instruments which used to measure the
absorbance of standard and sample concentration in laboratory. The
spectrophotometer was interfaced (linked) with personal computer which is
operated by software.
IJSER

International Journal of Scientific & Engineering Research Volume 11, Issue 7, July-2020 1136 ISSN 2229-5518
IJSER © 2020
http://www.ijser.org
17
IJSER

International Journal of Scientific & Engineering Research Volume 11, Issue 7, July-2020 1137 ISSN 2229-5518
IJSER © 2020
http://www.ijser.org
3.4. Chemicals
In this section, all necessary reagents and chemicals were used for the determination of
caffeine content in coffee beans were 854ml of Dichloromethane which is 98- 99% of
efficient to extract caffeine from coffee sample as reported by,(A,Abebe et al.),78mg of
pure caffeine and 800mlde-ionized water were used for the experiment.
3.5. Method of the Experiment
3.5.1. Coffee sample preparation
Collected green coffee beans were screened with sieving sieve to separate the size of coffee sample
as 15mm and above for large and 14mm and below for small size coffee beans, in Woliata Ethiopia
exchange commodity (EXC) at where the roasting and grinding process was done ,the figure-4,
below illustrates the standard scale of the size separation of sieve
Figure 12; coffee screening process with sieving mesh
IJSER

International Journal of Scientific & Engineering Research Volume 11, Issue 7, July-2020 1138 ISSN 2229-5518
IJSER © 2020
http://www.ijser.org
18
IJSER

International Journal of Scientific & Engineering Research Volume 11, Issue 7, July-2020 1139 ISSN 2229-5518
IJSER © 2020
http://www.ijser.org
3.5.2. Roasting coffee bean 50 grams of each coffee bean were measured and thoroughly washed with pure water, and
then dried at equal time of 30 minutes separately each green coffee bean. The safely dried
each green coffee beans were roasted by using Probat Werke Emmeirch Am Rhein
Germany at 80 temperature for 8-12 minutes. Figure 3, below illustrates the instrument
used to roast coffee sample in the above favorable.
Figure: 13 roasting process of coffee beans
IJSER

International Journal of Scientific & Engineering Research Volume 11, Issue 7, July-2020 1140 ISSN 2229-5518
IJSER © 2020
http://www.ijser.org
19
IJSER

International Journal of Scientific & Engineering Research Volume 11, Issue 7, July-2020 1141 ISSN 2229-5518
IJSER © 2020
http://www.ijser.org
3.5.3. Grinding coffee beans The well prepared and safely roasted coffee beans were ground by using GUATEMALA
SBGERMANY; the grinding condition used was 250-450µms sieve for powder were the
laboratory apparatus used for the experiment at Woliata exc., Coffee sample powdered were
sealed and transported to Arbminch University where caffeine analysis and extraction was
occurred. Figure 6.illustrates
Figure: 14 grinding process of roasted coffee.
Figure 15 sealed ground coffee powder
IJSER

International Journal of Scientific & Engineering Research Volume 11, Issue 7, July-2020 1142 ISSN 2229-5518
IJSER © 2020
http://www.ijser.org
20
IJSER

International Journal of Scientific & Engineering Research Volume 11, Issue 7, July-2020 1143 ISSN 2229-5518
IJSER © 2020
http://www.ijser.org
3.6. Instrumental Calibrations
To determine the caffeine content of the coffee samples, the validation was properly done
by using the prepared standard solutions for the experiment. The stocks solution was
(500ppm) of caffeine was prepared by dissolving 25 mg of the pure standards in 50 mL
De-ionized water. This prepared solution where strewed with magnetic stirrer 30 minutes.
Then working standard solutions were (0, 10,30,60,80 and 100 ppm)5standards were
prepared with concentrations in the range of 1–100 mg L-1.The solutions were measured
by using uv-vis spectrophotometer and 0 ppm solution did no peak or absorbance but the
rest standard solutions were (10, 30, 60, 80 and 100ppm) gave their responses. Moreover,
the peak area was found with increasing of concentration. The absorbances of the standard
solutions were listed in table 2 below.
3.6.1. Calibration curve graph for standard solution
A calibration curve for absorbance versus concentration of working caffeine standards was
constructed to validate for the quantification of caffeine in case of linearity and calibration
purpose. Then curve showed good linear relationship between the absorbance and
concentrations of the standard solutions as well as serial and absorbance. The equation
formulated was derived as Y=0.5265x+2.1377 and calibration curve of standard ( =
0.9978), where Y absorbance, X is concentration of caffeine (mg/L) and R is the linear
correlation factor. Therefore the method was taken as cheap rapid and reproducible for the
quantitative determination of caffeine extracted by dichloromethane from coffee sample.
Table 1: Absorbance of standard solution
Concentration in(mg/L) Absorbance in(au)
10 2.635
30 3.211
60 3.751
80 4.232
100 4.757
IJSER

International Journal of Scientific & Engineering Research Volume 11, Issue 7, July-2020 1144 ISSN 2229-5518
IJSER © 2020
http://www.ijser.org
21
IJSER

International Journal of Scientific & Engineering Research Volume 11, Issue 7, July-2020 1145 ISSN 2229-5518
IJSER © 2020
http://www.ijser.org
3.7. Characterization of Caffeine in Pure Water
The characterization of pure caffeine in de-ionized water and dichloromethane were don
independently adding a mass of 25mg pure caffeine powder and dissolved in 30 ml of
de-ionized water and 28mg of pure caffeine powder was added to 34ml of
dichloromethane solvent.
The solved quantitative value of the concentration of two solution were
C=4.29 mol and C=4.23 mol respectively were stirred 50 minutes using magnetic
stirrer, then the maximum peak of absorbance were found by wavelength at 243—300nm
for in water solution and 243-312nm for dichloromethane solution. Then absorbances of
the above solutions were measured by UV/vis spectrophotometer at room temperature, so
that from the above conc. each cuvette (cm) was measured at given wavelength and its
absorbance recorded. From the absorbance, molar decadic absorption coefficient,
integrated area under curve and transitional dipole moment of caffeine in water and
dichloromethane were obtained respectively.
3.7.1. Caffeine analysis
Powdered coffee sample was prepared and 1.00g of each was measured by using
electronic balance and poured into 250ml volumetric flasks separately for each coffee
powder. Then 50ml de-ionized water was added and stirred with magnetic stirrer for 50
minutes and heated gently to 80 to extract caffeine from water solution. The solution
was cooled and filtered with filter glass. The filtrates were pipette into safely washed
100ml volumetric flasks and formed mobile phase.
Figure 16 ; water coffee solution
IJSER

International Journal of Scientific & Engineering Research Volume 11, Issue 7, July-2020 1146 ISSN 2229-5518
IJSER © 2020
http://www.ijser.org
22
IJSER

International Journal of Scientific & Engineering Research Volume 11, Issue 7, July-2020 1147 ISSN 2229-5518
IJSER © 2020
http://www.ijser.org
3.7.2. Caffeine extraction with dichloromethane
Due to the interfering matrices in the water coffee solution, 30ml of Dichloromethane was
used to overcome this difficulty. The reagent used to extract caffeine easily from coffee
solution. This is a quite similar to those of used by (Blen Weldegebreal et al, 2016;Belay
et al, 2008).Then 30ml of dichloromethane was dissolved and stirred with magnetic stirrer
for 10 minutes for each of the solution filtered.
After filtration the solution was transferred into the separator funnel, due to the high
solubility of dichloromethane Coffee solution was occurred upper part and extracted
caffeine with dichloromethane was at lower part of separator funnel, therefore the volume
of the extracted caffeine was filtered and recorded (4-times repeated)and fourth round was
negligibly zero. Then mean value was taken after extraction of coffee water solution by
dichloromethane. The extracting steps illustrated b by figure 7, 8 respectively
Figure: 17, the process of stirring filtrated coffee water solution by DCM.
IJSER

International Journal of Scientific & Engineering Research Volume 11, Issue 7, July-2020 1148 ISSN 2229-5518
IJSER © 2020
http://www.ijser.org
23
IJSER

International Journal of Scientific & Engineering Research Volume 11, Issue 7, July-2020 1149 ISSN 2229-5518
IJSER © 2020
http://www.ijser.org
The figure10 below illustrates filtaring technques to each of the solution in above figure 9
and measured by the cylinders (three times).
Figure:18 ,The extracting process of caffeine by DCM.
The caffeine concentrations measured in above figure 10 were repeated three times and
each of absorbance was measured by uv-vis spectrophotometer in figure11 below.
Figure:19Absorption of caffeine concentration measured byuv-vis spectrophotometer
IJSER

International Journal of Scientific & Engineering Research Volume 11, Issue 7, July-2020 1150 ISSN 2229-5518
IJSER © 2020
http://www.ijser.org
24
IJSER

International Journal of Scientific & Engineering Research Volume 11, Issue 7, July-2020 1151 ISSN 2229-5518
IJSER © 2020
http://www.ijser.org
CHAPTER FOUR
4. RESULTS AND DISCUSSION
4.1. Data Analysis
4.1.1. Linearity of calibration graph
The calibration graph was generated using 10 mm curvet. Five different standard
concentrations (10, 30, 60, 80 and, 100) of caffeine from 10 ppm to 100 ppm were
analyzed according to experimental conditions. The absorbance of the dilution of serial
number above calculated was (0.04, 0.16, 0.22, 0.34, and 1.4) then the calibration curve
was established according to the obtained response (peak area) and the concentrations of
caffeine in standard solutions. The results show a good linear relationship that was found
to be 0.999. The calibration graph is also shown in below the absorbance versus
concentration from the table 2.
Table 2 the measured value of absorbance from prepared standards.
Absorbance in
Concentration
10 2.635
30 3.211
60 3.751
80 4.232
100 4.757
Concentration
in(ppm)
IJSER

International Journal of Scientific & Engineering Research Volume 11, Issue 7, July-2020 1152 ISSN 2229-5518
IJSER © 2020
http://www.ijser.org
25
IJSER

International Journal of Scientific & Engineering Research Volume 11, Issue 7, July-2020 1153 ISSN 2229-5518
IJSER © 2020
http://www.ijser.org
The calibration graph below in the figure 11 shows the linearity and the regression factor
and y=0.5265x+2.1377, were y indicates the maximum absorbance and
xindicates concentration.
standard caffiene
100
80
60
40
20
0
0.00 0.02 0.04 0.06 0.08 0.10 0.12 0.14 0.16 0.18 0.20 0.22
absorbance
Figure 20 calibration graph of standard solution.
4.1.2. Characterization of pure caffeine
UV–vis absorption of caffeine in de-ionized water and dichloromethane; the UV–vis
absorption spectrum of caffeine in de-ionized water was found to be in the region of
243-300nm and its intensity is drops the wavelength greater than this.
The peak absorbance of the solution is found to be IA = 1.190 at the maximum
wavelength =272.5nm.this experiment was quite similar to those reported by (A,
Abebe et al, Clarke and Macrae (1985).The molar decadic absorption coefficient was
measured at a given wavelength and it’s the peak absorbance 1.190 taken to calculate
value of using Beer–Lambert’s e equation (Liptay, 1969).
The molar decadic absorption coefficient of pure caffeine in water is computed and its
value 27.73 by using beer lamberts law; equation 2.1.2 in review
literature reported by (Bauman,(1962),Thorne;1988;Milonni and Eberly,
1988).Transitional dipole moment was calculated by integrating the coefficient from
integral line of frequencies band v1=34000 to v2=412000 and its value
was ,µi=15.20 .
y=0.5265x+2.1377
R2=0.9978
IJSER

International Journal of Scientific & Engineering Research Volume 11, Issue 7, July-2020 1154 ISSN 2229-5518
IJSER © 2020
http://www.ijser.org
26
IJSER
International Journal of Scientific & Engineering Research Volume 11, Issue 7, July-2020 1155 ISSN 2229-5518
IJSER © 2020
http://www.ijser.org
1.2
1.0
0.8
0.6
0.4
0.2
0.0
200 220 240 260 280 300 320
Wavelength (nm)
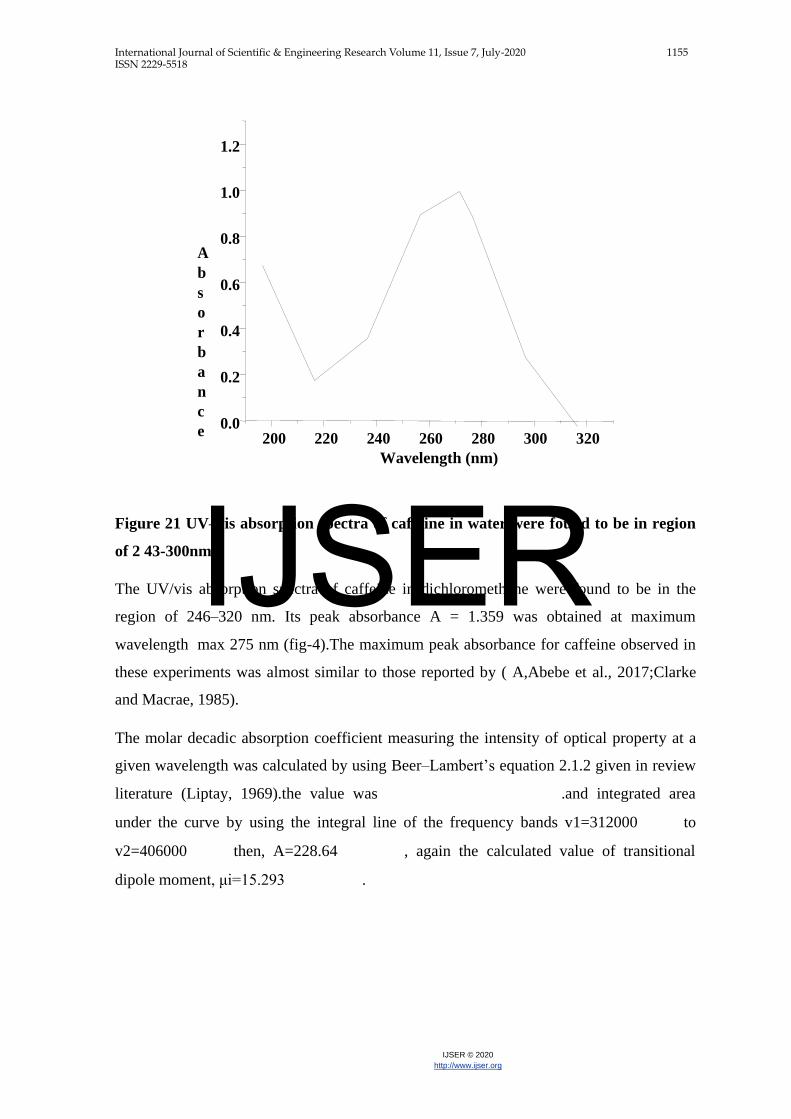
Figure 21 UV–vis absorption spectra of caffeine in water were found to be in region
of 2 43-300nm.
The UV/vis absorption spectra of caffeine in dichloromethane were found to be in the
region of 246–320 nm. Its peak absorbance A = 1.359 was obtained at maximum
wavelength max 275 nm (fig-4).The maximum peak absorbance for caffeine observed in
these experiments was almost similar to those reported by ( A,Abebe et al., 2017;Clarke
and Macrae, 1985).
The molar decadic absorption coefficient measuring the intensity of optical property at a
given wavelength was calculated by using Beer–Lambert’s equation 2.1.2 given in review
literature (Liptay, 1969).the value was .and integrated area
under the curve by using the integral line of the frequency bands v1=312000 to
v2=406000 then, A=228.64 , again the calculated value of transitional
dipole moment, μi=15.293 .
A
b
s
o
r
b
a
n
c
e
IJSER

International Journal of Scientific & Engineering Research Volume 11, Issue 7, July-2020 1156 ISSN 2229-5518
IJSER © 2020
http://www.ijser.org
27
IJSER

International Journal of Scientific & Engineering Research Volume 11, Issue 7, July-2020 1157 ISSN 2229-5518
IJSER © 2020
http://www.ijser.org
Figure 22 the UV/vis absorption spectra of caffeine in dichloromethane were found to
be in the region of 200–320 nm.
4.1.3. Determination of caffeine in small and large size roasted coffee sample
Determination of caffeine in the laboratory were helped by uv-vis spectrophotometer
method direct way to owing the matrix effect of UV –Vis spectrophotometer absorbing
substances in the simple matrix (A, Belay et al, 2017; Ortega-Burrales., 2002; Zhang et al.,
2005).The matrix effect coffee sample in water solution was clearly seen before extracted
by dichloromethane. In order to minimize this interfering substance in coffee was first
dissolved in water and caffeine extracted from solution Using dichloromethane
Dichloromethane is the most commonly powerful solvent used to the extraction of
caffeine from small and large roasted coffee beans (AlmayehuKros, 2008; Rofti, 1971).
Many commercial products applied dichloromethane for decaffeinating the coffee roasted
coffee Beans for its extraction efficiency 98–99% (A, Belay et al ;Clarke, 1980).Then the
extraction was made three times and the extracted concentration was measured by uv-vis
IJSER

International Journal of Scientific & Engineering Research Volume 11, Issue 7, July-2020 1158 ISSN 2229-5518
IJSER © 2020
http://www.ijser.org
28
IJSER

International Journal of Scientific & Engineering Research Volume 11, Issue 7, July-2020 1159 ISSN 2229-5518
IJSER © 2020
http://www.ijser.org
spectrophotometer. Then the peak absorbance of coffee sample versus wavelength caffeine
content and absorbance were obtained.
4.1.4. Coffee sample extraction by dichloromethane
Caffeine concentration in coffee, triplicate measurements and standard deviation After
dissolving the coffee powder in water were obtained but there was some interfering
matrices, hence to minimize this, the most common extracting solvent dichloromethane
was used and the caffeine concentration measured three times by the procedure in figure 9,
then Result of triplicate measurements, standard deviation and mean caffeine
concentrations were listed in table 3 below.
Table 3 Experimental result and measured value of coffee sample
Origin of Coffee Size of Triplicates of Mean value of Std.dev.
sample Measurements In conc. in (ppm) Coffee Value
(ppm)
Small 28.5,29 .0, 32.5 30.0 2.345
Boricha Large 18.5 21 22.8 20.16 2.989
Small 30, 31.5 31.5 31.0 1.224
Wondogenet Large 22.5, 23.5 23 23.0 0.707
Small 25.5,27,28.5 27.0 2.212
Kachabira Large 20,19.5,21.5 20.3 1.473
Small 31.5,31.5,30 31.0 1.224
Hadaro Large 25,22.5,26.5 24.6 2.860
IJSER

International Journal of Scientific & Engineering Research Volume 11, Issue 7, July-2020 1160 ISSN 2229-5518
IJSER © 2020
http://www.ijser.org
29
IJSER

International Journal of Scientific & Engineering Research Volume 11, Issue 7, July-2020 1161 ISSN 2229-5518
IJSER © 2020
http://www.ijser.org
4.1.5. Determination of caffeine mass and its percentage from experimental data
Extraction by dichloromethane in the table below 4; summarizes caffeine concentration,
mass of caffeine and their percentage of caffeine in coffee sample. Hence, the result of
caffeine content and mean caffeine concentrations are listed in table 4 below.
Table: 4 mass of caffeine (g) and its percentages from experimental data.
4.1.6. Caffeine concentration in selected Wordas of South Ethiopia
The Mean concentrations of caffeine in small and large roasted coffee from four selected
Woreda’s of South Ethiopia were measured at max =275nm and analyzed by one way
analysis of variance (ANOVA). The result was shown in table-4. The minimum
concentration was observed in Kachabira and maximum concentration was observed in
Hadaro (Fig-3). However, there was no significant difference in caffeine concentration
among coffee from four woredas (F test= 0.888; P=0.464). Our result suggests that the
concentration of caffeine in coffee may not depend on the geographical variation.
Origin of
coffee
sample
Size of
coffee
Mass of
coffee
powder (g)
Conc. of
caffeine in
Mean (ppm)
Mass of
caffeine in
(g)
Percentage
of caffeine
in coffee
(w/w) %
Borcha Small 1.00 30 0.0773 7.73
Large 1.00 20.16 0.0519 5.19
Small 1.00 31 0.0799 7.99
Wondogenet Large 1.00 23 0.0592 5.92
Kachabira Small 1.00 27 0.0695 6.95
Large 1.00 20.3 0.0523 5.23
Hadaro Small 1.00 31 0.0799 1.050
Large 1.00 24.16 0.0634 0.790
IJSER

International Journal of Scientific & Engineering Research Volume 11, Issue 7, July-2020 1162 ISSN 2229-5518
IJSER © 2020
http://www.ijser.org
30
IJSER

International Journal of Scientific & Engineering Research Volume 11, Issue 7, July-2020 1163 ISSN 2229-5518
IJSER © 2020
http://www.ijser.org
Table 5: Mean concentrations of caffeine in small and large roasted coffee samples from
four woredas of South Ethiopia
Woredas No Mean Std.
Conc. Deviation
(ppm)
Boricha 6 25.00 6.753 17.91
Wondogene 6 27.00 4.517 22.26
t
Kachabira 6 23.67 7.421 15.88
Hadaro 6 28.67 3.141 25.37
24 26.08 5.679 23.69
The mean caffeine concentration of small size coffee sample and large coffee sample
were illustrated in figure 5 below, in which the red line indicates mean caffeine
concentration of small coffee sample where the black one indicates large
small coffee sample
large coffee sample
0.0 0.5 1.0 1.5 2.0 2.5 3.0
code
Figure:15 Comparssion of mean caffeine concentration in small and large.
Confidence F-test P-value
Upper
32.09
31.74 0.888 0.448
31.45
31.96
28.48
95%
Interval
Lower
Total
31
30
29
28
27
26
25
24
23
22
21
20
IJSER

International Journal of Scientific & Engineering Research Volume 11, Issue 7, July-2020 1164 ISSN 2229-5518
IJSER © 2020
http://www.ijser.org
31
IJSER

International Journal of Scientific & Engineering Research Volume 11, Issue 7, July-2020 1165 ISSN 2229-5518
IJSER © 2020
http://www.ijser.org
Where, 0 indicate Boricha, 1 Wondogenet, 2 Kachabira and 3 Hadaro Figure 15;
Comparssion of mean caffeine concentration in four Woredas of southern Ethiopia,
Where, 0 indicate Boricha, 1 Wondogenet, 2 Kachabira and 3 Hadaro.
4.1.7. Determination of caffeine content in Small and Large Roasted coffee from four
selected Woredas of South Ethiopia
The mean concentration differences of caffeine between large and small roasted coffee
was analyzed using independent t-test regardless of the area. As illustrated in table-6, the
mean concentration of caffeine was significantly high in small coffee beans as compared
to large coffee beans (mean 29.75 Vs 22.42 with SD of 4.070 Vs 4.641; t= 4.1; P<0.001).
High concentration of caffeine was found in small sized coffee beans while as compared
to large. Therefore the hypothesis suggests that the concentration of caffeine was depend
on the size of coffee.
Table 6. Determination of caffeine content in Small and Large Roasted coffee from four
selected Woredas of South Ethiopia
95% Confidence Interval
Lower Upper
Small 12 29.75 4.070 4.115 <001 3.638 11.029
Large 12 22.42 4.641 3.634 11.033
4.1.8. Caffeine content in coffee beans collected from each woredas
Caffeine content was determined in small and large sized roasted coffee from each four
selected woredas. The caffeine content was significantly high in small coffee beans
collected from Boricha, Wondogenet and Hadaro as compared to large sized coffee beans
(P<0.05), however, the caffeine content was not significantly changed between small and
large coffee beans from Kachabira (P=0.343).
Std. t-test P-Value
Deviation
Coffee No
size
Mean conc.
In(ppm)
IJSER

International Journal of Scientific & Engineering Research Volume 11, Issue 7, July-2020 1166 ISSN 2229-5518
IJSER © 2020
http://www.ijser.org
32
IJSER

International Journal of Scientific & Engineering Research Volume 11, Issue 7, July-2020 1167 ISSN 2229-5518
IJSER © 2020
http://www.ijser.org
Table 1 The mean caffeine concentration in Small and Large Roasted coffee from each
selected woredas
Woredas Coffee Mean Con Std T-test P-value 95% CI
Size (ppm) Dev
Lower Upper
Boricha Small 30.00 5.696 2.74 0.050 0.001 20.011
Large 20.00 3.464 0.60 20.623
Wondogenet Small 31.00 0.00 8.00 0.001 5.224 10.776
Large 23.00 1.732 3.697 12.303
Kachabira Small 31.00 6.928 1.074 0.343 -10.040 22.707
Large 24.67 7.506 -10.081 22.748
Hadaro Small 31.50 0.866 13.59 <0.001 6.498 9.835
Large 23.333 0.574 6.396 9.937
4.1.9. Absorbance of mean caffeine concentration extracted from coffee sample
The absorbance of mean caffeine concentration was measured by uv-vis
spectrophotometer at 275 wavelength and the experimental recorded values were listed in
table 6.the reap tidily measured mean value of the absorbance is high in small and low in
large size roasted coffee beans from the selected four Woredas. This suggests that
concentration and the absorbance are directly proportional; the literature review in
IJSER

International Journal of Scientific & Engineering Research Volume 11, Issue 7, July-2020 1168 ISSN 2229-5518
IJSER © 2020
http://www.ijser.org
33
IJSER

International Journal of Scientific & Engineering Research Volume 11, Issue 7, July-2020 1169 ISSN 2229-5518
IJSER © 2020
http://www.ijser.org
equation 2.1.2, Beer-lamberts law, A=cl ,(Bauman, 1962; Thorne; 1988; Milonni and
Eberly, 1988).
Table 2; mean absorbance of caffeine of coffee sample by uv-vis spectrophotometer.
Origin of coffee Coffee size Mean Caffeine Mean mass of Mean
sample conc. in(ppm) caffeine in (g) Absorbance in
( au
Boricha Small 30 0.0773 0.870
Large 20.16 0.0519 0.689
Wondogenet Small 31 0.0799 1.030
Large 23 0.0592 0.760
Kachabira Small 27 0.0695 0.830
Large 20.3 0.0523 0.651
Hadaro Small 31 0.0799 1.050
Large 24.6 0.0634 0.790
4.1.10. Mean absorbance of caffeine concentration in small and large size coffee from
selected four woredas
The mean absorbance differences of caffeine between large and small roasted coffee was
analyzed using independent t-test regardless of the area. . As illustrated in table-7, the
mean absorbance of caffeine was significantly high in small coffee beans as compared to
large coffee beans (mean0.945 Vs 0.7225 with SD of 0.01237 Vs 0.00407; t= -3.47145;
P<0.01328). High absorbance of caffeine in small sized coffee beans as compared to large
IJSER
International Journal of Scientific & Engineering Research Volume 11, Issue 7, July-2020 1170 ISSN 2229-5518
IJSER © 2020
http://www.ijser.org
34
IJSER

International Journal of Scientific & Engineering Research Volume 11, Issue 7, July-2020 1171 ISSN 2229-5518
IJSER © 2020
http://www.ijser.org
as hypothesis suggest that the absorbance of caffeine was depend on the concentration of
caffeine in coffee size rather geographical difference.
Table 9, mean absorbance of caffeine and its standard deviation from selected four
woredas
.
Size of coffee N of Mean
sample absorbanc
e(au)
Small 12 0.945 0.01237 -3.47145 0.01328
Large 12 0.7225 0.00407
4.2. Decadic molar absorption from coffee sample
The molar decadic absorption of coffee sample were calculated by using the mean conc. of
caffeine from coffee sample in(ppm),path length l in(cm) and the absorbance of sample in
(au). Hence rearranging the Beer-Lambert equation 2.1.2 into reported by review
which is quite similar to(Bauman, 1962; Thorne; 1988; Milonni and Eberly,
1988),. Molar absorptive, c is the concentration of absorbing species, A, is amount of
light absorbed by sample for the given wavelength at 275nm and l, is the distance that
light travels through the solution,
Std.deviation t-value
In absorbance absorbance
P-value
absorbance
IJSER

International Journal of Scientific & Engineering Research Volume 11, Issue 7, July-2020 1172 ISSN 2229-5518
IJSER © 2020
http://www.ijser.org
35
IJSER

International Journal of Scientific & Engineering Research Volume 11, Issue 7, July-2020 1173 ISSN 2229-5518
IJSER © 2020
http://www.ijser.org
Table: 10 Mean molar decadic absorption of coffee sample from conc. and absorbance
4.2.1. The mean and standard deviation of molar decadic absorption coefficient in
coffee
The calculated value was helped by the equation 2.1.2 in review literature, reported by
Bauman, 1962; Thorne; 1988; Milonni and Eberly, 1988).And mean molar decadic
absorption coefficient with its standard value of molar decadic absorption from small and
large size roasted coffee sample, in ( were (31.652vs32.28) with SD of (1.998 vs
0.892) respectively.
Origin of coffee
sample
Size of coffee Mean conc. of
caffeine
in(ppm)
Absorbance of
sample in(au)
Molar decadic
absorption in
( )
Boricha small 30.0 0.870 29.0
large 20.16 0.689 31.9
.Wondogenet small 31.0 1.030 33.22
large 23.0 0.760 33.04
Kachabira Small 27.0 0.830 30.74
Large 20.3 0.651 32.06
Hadaro Small 31.0 1.050 33.87
Large 24.6 0.790 32.12 IJSER

International Journal of Scientific & Engineering Research Volume 11, Issue 7, July-2020 1174 ISSN 2229-5518
IJSER © 2020
http://www.ijser.org
36
IJSER
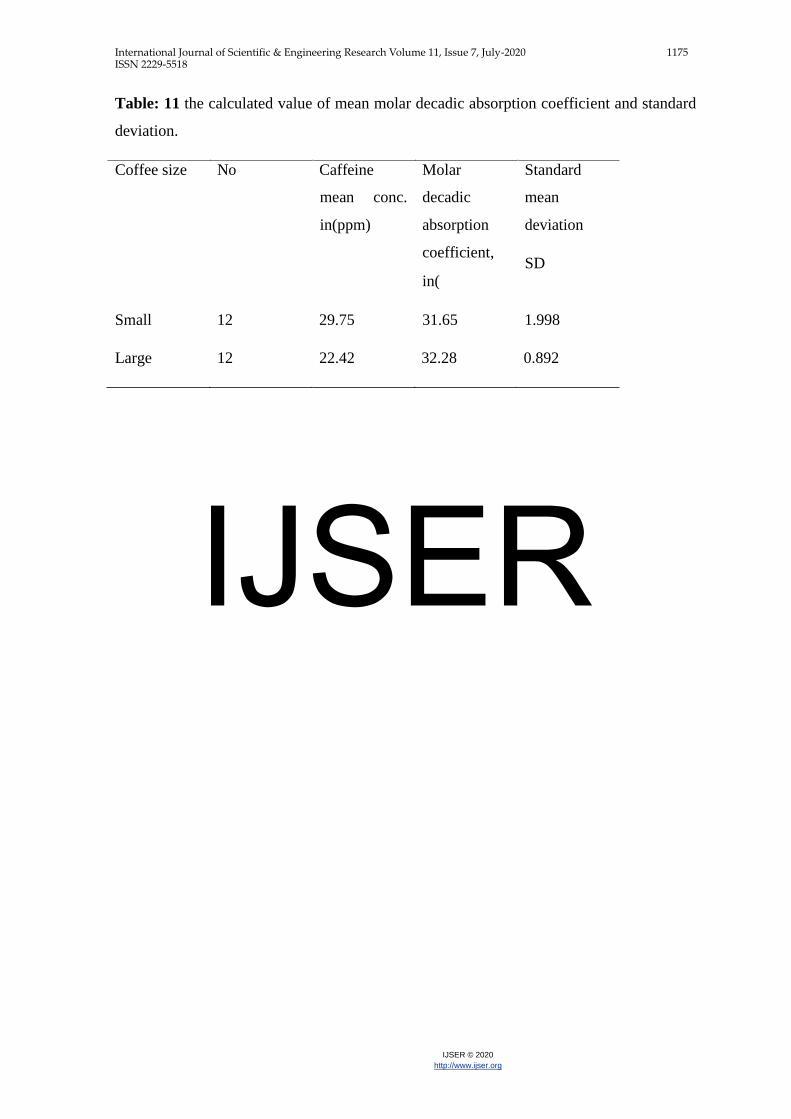
International Journal of Scientific & Engineering Research Volume 11, Issue 7, July-2020 1175 ISSN 2229-5518
IJSER © 2020
http://www.ijser.org
Table: 11 the calculated value of mean molar decadic absorption coefficient and standard
deviation.
Coffee size No Caffeine
mean conc.
in(ppm)
Small 12 29.75
Large 12 22.42 32.28 0.892
Molar
decadic
absorption
coefficient,
in(
Standard
mean
deviation
SD
31.65 1.998
IJSER

International Journal of Scientific & Engineering Research Volume 11, Issue 7, July-2020 1176 ISSN 2229-5518
IJSER © 2020
http://www.ijser.org
37
IJSER

International Journal of Scientific & Engineering Research Volume 11, Issue 7, July-2020 1177 ISSN 2229-5518
IJSER © 2020
http://www.ijser.org
CHAPTER FIVE
5. CONCLUSION AND RECOMMENDATION
5.1. Conclusion The right methods were developed to determine caffeine content in the small and large
size roasted coffee beans from SNNPR, Ethiopia using UV-visible spectrophotometer. In
this research, determination of caffeine content, comparison and characterization of
caffeine in roasted coffee beans by decadic molar absorption coefficients at optimum
temperature were analyzed and the results agreed with the others literature value of
analytical methods.
To make the value more accurate, the experiments were measured three times and the mean
values were taken. The result of caffeine concentration was extracted by dichloromethane,
and the determined value of content in small and large size coffee sample was analyzed by
one way analysis of variance (ANOVA). The minimum content of caffeine from selected
zones was observed in Kachabira and maximum content was observed in Hadaro. However,
there was no significant difference in caffeine content among coffee from four woredas (F
test= 0.888; P=0.464). Our result suggests that the content of caffeine in coffee may not
depend on the geographical variation.
The mean caffeine content differences of caffeine between large and small roasted coffee
was analyzed using independent t-test regardless of the area. The mean content of caffeine
was significantly high in small coffee beans as compared to large coffee beans. The mean
value of caffeine in small and large size roasted coffee were (7.665 Vs 5.67 ) with SD
of 2.422 Vs 3.118 ; t= 5.3605; P<0.0017).respectively. High
concentration of caffeine in small sized coffee beans as compared to large, hypothesis
suggest that the concentration of caffeine was merely depend on the size of coffee rather
geographical difference. Therefore, determination of caffeine in small and large roasted
coffee beans have practical done by using uv-vis spectrophotometer with fast, simple and
inexpensive methods. In generally the caffeine concentration and mass of caffeine have
significance difference in small and large size coffee beans from selected zones. Moreover,
IJSER

International Journal of Scientific & Engineering Research Volume 11, Issue 7, July-2020 1178 ISSN 2229-5518
IJSER © 2020
http://www.ijser.org
38
IJSER

International Journal of Scientific & Engineering Research Volume 11, Issue 7, July-2020 1179 ISSN 2229-5518
IJSER © 2020
http://www.ijser.org
the data showed that the caffeine contents of the small and large size coffee samples
needed in this study are quietly limited to that of standards for coffee Arabica and its value
in range was (5.67 7.665 ) by uv-vis spectrophotometer. In addition to this, the
methods have been tested for small and large size green coffee beans as well as green
coffee leaves are applied without any restriction.
5.2. Recommendation
In the work of this study findings and the conclusion made above, the following
recommendations are forwarded for other studies those not included in this thesis.
By the help of other extrac ants like chloroform, hydrochloric acid, Sulpheric acid
should also be checked for the quantification of caffeine content in small and large
size roasted coffee samples from different places.
This thesis work might be repeated with NIR FT-IR, and FT-IR-ATR to determine
and compare the caffeine content in small and large size coffee samples from
different coffee producing regions.
Determining and characterizing of the concentration of caffeine in coffee sample of
different species should be encouraged.
IJSER

International Journal of Scientific & Engineering Research Volume 11, Issue 7, July-2020 1180 ISSN 2229-5518
IJSER © 2020
http://www.ijser.org
6. REFFERENCES
Alemayehu,T;Esayas, K; Kassu, K,(2008).Coffee development and marketing
improvement plan in Ethiopia
Bauman, John; Wiley and sons. .Absorption spectroscopy,
Belay, A.; Ture, K.; Redi, M.; Asfa, A. Measurement of caffeine in coffee beans with
UV/vis spectrophotometer, Food Chemistry, 2008, 108:
Clarke, Marroe, R. J.; Macarae, Z. R. Coffee Chemistry, Elsevier, New York, (1985)
Clifford, M. N.; Ramirez-Martinez, J. R. Chlorogenic acids and purine alkaloids contents
of mate (Ilex paraguariensis) leaf and beverage, Food Chemistry, 1990, 35: 13-21.
Grima Ephraim, GD;W,W; Araya S, A.UV/VIS spectrometer determination of caffeine
in green coffee beans from Hararghe, Ethiopia, Using Beer-Lambert’s law and integrated
Absorption coefficient techniques, Scientific Study & Research Chemistry & Chemical
Engineering, Biotechnology. Food Indus,2016, 17,109-123.
Guzin, A, (2002).Derivative spectrophotometer determination of caffeine in some
Beverages. Turk, J. Chem., 26: 295–302
Honors Thesis 2013, Paper103 http://dx.doi.org/10.1155/2014/384230
Huck, W.C.; Guggenbichler, W.; Bonn, G.K. Analysis of caffeine, theobromine and
theophylline in coffeeby near infrared spectroscopy (NIRS) compared to HPLC coupled to
mass spectrometry. Anal. Chimica Acta. 2005, 538, 195-203.
International coffee organization (ICO);Statistics Breakdown of exports of green Arabica
and green Robusta of countries exporting significant volumes of both types of coffee June
2009, January 2011www.ico.org(accessed January 21, 2011.
Kodama, 2007;International coffee organization (ICO),Statistics Break down of exports of
green Arabica and green Robusta of countries exporting significant volumes of both types
of coffee June 2009, January 2011. www.ico.org(accessed January 21, 2011.
Kumar, V.; Naidu, M. M.; Ravishankar, G. A. Developments in coffee biotechnology,
Plant Cell Tissue Organ Cultivation, 2006, 87: 49-65.
Laqua K.,Mellhuish W.H., and Zander M. Molecular Absorption spectroscopy
Liptay W(1969). Electrochromism and solvatochromism. Angewandte Chemie, Int. Ed.,
8(3): 177-187.
40
IJSER

International Journal of Scientific & Engineering Research Volume 11, Issue 7, July-2020 1181 ISSN 2229-5518
IJSER © 2020
http://www.ijser.org
Matissek, R (1997). "Evaluation of xanthine derivatives in chocolate: nutritional and
chemical aspects". European Food Research and Technology205 (3): 175â€―84.
http://cat.inist.fr/?aModele=afficheN&cpsidt=2861730
Meltzer, H. M.; Fotland, T. O.; Alexander, J.; Elind, E.; Hallstrom, H.; Lam, H. R.;
Liukkonen, K. H.; Petersen, M. A.; Solbergsdottir, E. J. Risk assessment of caffeine
among children and adolescents in the Nordic countries, TemaNord, Copenhagen,Nordic
Council of Ministers Copenhagen, 2008: 551
Milanez, S. Adverse health effects of caffeine: Review and analysis of recent human and
animal research, US Food and Drug Administration, College Park MD 20740-3835,
USA,2011 Newyork,(1962) ,p.10-12
Nicole, L.; Olsen, L. Caffeine consumption habits and perceptions among University of
New Hampshire Students,
Nuhu, A. Bioactive micronutrients in coffee: Recent analytical approaches for
characterization and quantification, ISRN Nutrition, Hindawi Publishing Corporation,
Nigeria, 2014,
Ramalakshmi and Raghavan (1999). Tsegaye, Y.; O, Getachew and Z.Tesfaye,2000 Some
socio-economic issues related to fungicide use against CBD in Ethiopia.In the proceedings
of coffee berry disease (CBD) workshop in Ethiopia,pp.72-84.EthiopiaAgricultural
Research organization (EARO) Addis Ababa
Ramsay, D. A. (1951): Intensity and shapes of infrared absorption bands of substances in
the liquid phase, Contribution from the Division of Chemistry Publication of National
Research Council of Canada, 74: 72-80.
Rao, C. N. R. (1975): Ultra-violet and visible spectroscopy chemical applications
Salihovic, M.; Sapcanin, A.; Pazalja, M.; Alispahic, A.; Dedic, A.; Ramic, E.
Determination of caffeine in different commercially available green and black teas,
Bulletin of the Chemists and Technologists of Bosnia and Herzegovina, 2014, 43:
1-4.
Wanyika, H. N.; Gatebe, E. G.; Gitu, L. M.; Ngumba, E. K.; and Maritim, C. W.
Determination of caffeine content of tea and instant coffee brands found in the Kenyan
market, Journal of Food Science,2010, 4(6): 353-358.
Zhang,Q.-L., Lian, H.-Z., Wang, W.-H., & Chen, H.-Y. (2005).Separation of caffeine and
theophylline in poly (dimethylsiloxane) micro channel electrophoresis with
electrochemical detection. Journal of Chromatography A, 1098, 172–176
IJSER

International Journal of Scientific & Engineering Research Volume 11, Issue 7, July-2020 1182 ISSN 2229-5518
IJSER © 2020
http://www.ijser.org
41
IJSER

International Journal of Scientific & Engineering Research Volume 11, Issue 7, July-2020 1183 ISSN 2229-5518
IJSER © 2020
http://www.ijser.org
7. APPENDICES
Appendix I. The UV/vis absorption spectra of caffeine in coffee samples
The UV/vis absorption spectra of caffeine in coffee samples from hadaro (small) found to
be in the region of 243–320 nm.
.
8
.
0.4
.
50 00 50
Wavelength (nm) Wavelength
Figure: 23 Uv-vis absorption spectra of Boricha small size coffee sample
IJSER

International Journal of Scientific & Engineering Research Volume 11, Issue 7, July-2020 1184 ISSN 2229-5518
IJSER © 2020
http://www.ijser.org
42
IJSER

International Journal of Scientific & Engineering Research Volume 11, Issue 7, July-2020 1185 ISSN 2229-5518
IJSER © 2020
http://www.ijser.org
1
8
6
4
2402 2803 3203
Wavelength (nm) Wavelength
Figure: 24 Uv-vis absorption spectra of Boricha large size coffee sample
8
6
4
2
260 280 320
Wavelength (nm) Wavelength
IJSER

International Journal of Scientific & Engineering Research Volume 11, Issue 7, July-2020 1186 ISSN 2229-5518
IJSER © 2020
http://www.ijser.org
43
IJSER

International Journal of Scientific & Engineering Research Volume 11, Issue 7, July-2020 1187 ISSN 2229-5518
IJSER © 2020
http://www.ijser.org
Figure: 25 Uv-vis absorption spectra of Wondogenet small size coffee sample.
1.2
0.8
0.6
0.4
0.2
0.0
240 260 280 300 320 340
Wavelength (nm)
Figure 26: Uv-vis absorption spectra of Wondogenet large size coffee sample.
IJSER

International Journal of Scientific & Engineering Research Volume 11, Issue 7, July-2020 1188 ISSN 2229-5518
IJSER © 2020
http://www.ijser.org
44
IJSER

International Journal of Scientific & Engineering Research Volume 11, Issue 7, July-2020 1189 ISSN 2229-5518
IJSER © 2020
http://www.ijser.org
1.0
0.8
0.6
0.4
0.2
0.0
240 260 280 300 320 340
Wavelength (nm)
Figure 27 Uv-vis absorption spectra of Kachabira small size coffee sample
IJSER

International Journal of Scientific & Engineering Research Volume 11, Issue 7, July-2020 1190 ISSN 2229-5518
IJSER © 2020
http://www.ijser.org
45
IJSER

International Journal of Scientific & Engineering Research Volume 11, Issue 7, July-2020 1191 ISSN 2229-5518
IJSER © 2020
http://www.ijser.org
0.8
0.6
0.4
0.2
0.00
240 260 280 300 320 340
Wavelength (nm)
Figure: 28 Uv-vis absorption spectra of Kachabira large size coffee sample
IJSER

International Journal of Scientific & Engineering Research Volume 11, Issue 7, July-2020 1192 ISSN 2229-5518
IJSER © 2020
http://www.ijser.org
46
IJSER

International Journal of Scientific & Engineering Research Volume 11, Issue 7, July-2020 1193 ISSN 2229-5518
IJSER © 2020
http://www.ijser.org
1.2
1.0
0.8
0.6
0.4
240 260 280 300 320 340
Wavelength (nm)
Figure: 29 Uv-vis absorption spectra of Hadaro small size coffee sample.
IJSER

International Journal of Scientific & Engineering Research Volume 11, Issue 7, July-2020 1194 ISSN 2229-5518
IJSER © 2020
http://www.ijser.org
47
IJSER

International Journal of Scientific & Engineering Research Volume 11, Issue 7, July-2020 1195 ISSN 2229-5518
IJSER © 2020
http://www.ijser.org
1.2
1.0
0.8
0.6
0.4
240 260 280 300 320 340
Wavelength (nm)
Figure: 30 Uv-vis absorption spectra of Hadaro large size coffee sample.
IJSER

International Journal of Scientific & Engineering Research Volume 11, Issue 7, July-2020 1196 ISSN 2229-5518
IJSER © 2020
http://www.ijser.org
48
IJSER