Determinants of the Premium in Forward Contracts · 2 Determinants of the Premium in Forward...
29
Determinants of the Premium in Forward Contracts Christian Redl 1 , Vienna University of Technology & Derek W. Bunn 2 , London Business School Version March 2011 Abstract Whilst the benefits of forward contracting for goods and services have been extensively researched in terms of mitigating market power effects in spot markets, we analyse how the risk in spot price formation induces a counteracting premium in the contract prices. We consider and test a wide-ranging set of propositions, involving fundamental, behavioural, dynamic, market conduct and shock components, on a long data set from the most liquid of European electricity forward markets, the EEX. We show that much of what is conventionally regarded as the market price of risk in electricity is actually that of its underlying fuel commodity, gas; that market power has a double effect on prices, insofar as it increases spot prices and induces a forward premium; that oil price sentiment spills over and that the premium reacts to scarcity and the higher moments of spot price uncertainty. We observe that considerations of the scale and determinants of the forward premium are at least as important as the market power effects in spot market price formation when evaluating the efficiency of wholesale power trading. JEL classification : Q40; C10; G13 Keywords: Electricity, prices, risk, forward contracting, market power, spillover. 1 Energy Economics Group, Vienna University of Technology; Gusshausstrasse 25-29/373-2, 1040 Vienna, Austria; E-mail: [email protected] 2 Energy Markets Group, London Business School; Regent's Park, London NW1 4SA, United Kingdom; E-mail: [email protected];
Transcript of Determinants of the Premium in Forward Contracts · 2 Determinants of the Premium in Forward...
Determinants of the Premium in Forward Contracts
Christian Redl1,
Vienna University of Technology
&
Derek W. Bunn2,
London Business School
Version March 2011
Abstract
Whilst the benefits of forward contracting for goods and services have been extensively
researched in terms of mitigating market power effects in spot markets, we analyse how the
risk in spot price formation induces a counteracting premium in the contract prices. We
consider and test a wide-ranging set of propositions, involving fundamental, behavioural,
dynamic, market conduct and shock components, on a long data set from the most liquid of
European electricity forward markets, the EEX. We show that much of what is conventionally
regarded as the market price of risk in electricity is actually that of its underlying fuel
commodity, gas; that market power has a double effect on prices, insofar as it increases spot
prices and induces a forward premium; that oil price sentiment spills over and that the
premium reacts to scarcity and the higher moments of spot price uncertainty. We observe that
considerations of the scale and determinants of the forward premium are at least as important
as the market power effects in spot market price formation when evaluating the efficiency of
wholesale power trading.
JEL classification : Q40; C10; G13
Keywords: Electricity, prices, risk, forward contracting, market power, spillover.
1 Energy Economics Group, Vienna University of Technology; Gusshausstrasse 25-29/373-2, 1040 Vienna, Austria; E-mail: [email protected] 2 Energy Markets Group, London Business School; Regent's Park, London NW1 4SA, United Kingdom; E-mail: [email protected];
2
Determinants of the Premium in Forward Contracts
1. Introduction
In fully liberalised wholesale electricity markets, as with most commodities, trading in
forwards and futures constitutes a substantially higher volume than physical demand. For
example in 2008, churn3 ratios of about 8 and 7 were reported for the German and Nordic
markets, and in Britain, over 90% of the power delivered was via forward contracts with
maturities of between a month and two years (Ofgem, 2009). Given the intense scrutiny of
wholesale electricity markets by regulatory and competition authorities, questions of the
efficiency and determinants of the realised premia in these forward prices, i.e. the systematic
difference between the forward price and the associated subsequent spot price(s), are therefore
at least as relevant as those regarding the exercise of market power on the spot market itself
(EC, 2007, 2008). Furthermore, in considering the efficiency of retail prices, regulators are
increasingly recognising the extent of hedging decisions by utilities and thus benchmarking or
regulating retail profit margins with reference to forward rather than spot prices (Ofgem,
2010, Omel, 2010).
Whilst forward markets clearly promote market completeness, facilitate the necessary risk
management4, and in theory induce greater competitive behaviour on the spot markets
(Bushnell et al., 2008), the transaction costs (premia) that emerge may well erode some of
these benefits in practice5. Thus, in cases where forward and spot market conduct has been
3 The ratio of estimated forward traded volume for a particular delivery period to actual physical delivery. 4 Companies regularly report their forward contracting policy in financial and investor relations reports, e.g. http://rwecom.online-report.eu/2008; www.centrica.com/; www.draxgroup.plc.uk/investor/. 5 Whilst Bushnell et al. (2008) suggest that forward contracting may have reduced spot prices by about 31% comparing data from California with NE US markets, in the British market, 2001-2005, there was actually a 40% winter month ahead forward premium for peak hours of the day (7am-7pm), though much less for off-peak and summer quarters (own analysis on Platts data).
3
investigated by competition authorities, the question of determining fair values for the
forward premia as counterfactuals inevitably arise (Christensen et al., 2007).
However, identifying and estimating the components of the premia implied by forward prices
has remained, despite an increasing amount of research, a challenging and relatively
unresolved area of analysis. Whilst research has been quite widely undertaken documenting
the empirical properties of electricity forward premia and proposing stylized equilibrium
models (references in the next section), testing the causal factors of the realised premia has
not been specified as widely as the complexity and interrelatedness of the price drivers
require. From a taxonomy of propositions, therefore, we have sought to provide a more
complete multi-factor analysis of the empirical determinants of the forward premium and their
implications. Within the wider context of the financial behaviour of energy derivatives, we
focus particularly upon the characteristics of electricity that render its forward price formation
rather special.
Firstly, as a product, wholesale electricity is a “flow” rather than a “stock”; it is produced and
consumed instantaneously and continuously. This results in a wide range of traded products of
different maturities and delivery periods, e.g. for the British market, where the spot market is
settled against half-hourly trading periods throughout the day, the APX power exchange6
offers forward products ranging from blocks of two and four hours for daily maturities to
various peak (e.g. 7am to 7pm) and baseload (midnight to midnight) contracts extending over
delivery periods ranging from a day, week, month, quarter or a year, for up to three years
ahead. This microstructure implies an absence of a 1:1 correspondence between forward and
spot products, and, as a consequence, that forward premia evaluations are complicated by the
averaging required over more extended delivery periods.
6 www.apxendex.com.
4
A more crucial implication of this “flow” aspect is that the nonstorability of power precludes
the classic cost of carry equilibrium of spot and forwards (Kaldor, 1939). Instead it is usual to
consider equilibrium in expectations and risk aversion (Keynes, 1930) amongst agents with
heterogeneous needs for hedging spot price uncertainty. The forward price is thereby viewed
as being determined as the expected spot price plus an ex ante market premium. However, as
this ex ante premium is unobservable, empirical analysis looks instead at an ex post (realised)
estimate, Ft,T - ST, where Ft,T is the forward price quoted at time t, for delivery at time T,
whereupon the spot price turns out to be ST . Thus,
, , , , (1)
and the ex post forward premium clearly equals the ex ante premium FPt,T plus a random
error εt,T in the (rational) spot price expectation due to price relevant shocks, occurring
between t and T. Electricity spot prices are well known to be characterised by high volatility
and occasional spikes7, caused, structurally by the intersection of steeply increasing convex
supply curves and, in the short term, price inelastic demand. Supply or demand shocks
therefore lead to sudden rises in spot market prices. Formal models of asset pricing under risk
can be adapted to electricity to associate, under risk neutrality, the emergence of this ex ante
forward premium from a market price of risk (Kolos and Ronn, 2008), but it is more usual to
invoke concepts of risk aversion between producers and retailers resulting in the forward
premium being the net hedging cost in the market (Bessembinder and Lemmon, 2002).
Without appeal to a stylized equilibrium model, in focusing upon the realised (ex post)
premium, to the extent that the random error distribution has zero mean, the realised premium
is a consistent estimator of the ex ante premium. However, it does raise the important question
in data analysis of how much of each ex post value reflects the price of risk and how much is
7 See for example, Lucia and Schwartz (2002), Burger et al. (2004), Huisman et al. (2007), Kanamura and Ohashi (2008), Karakatsani and Bunn (2008), Bowden and Payne (2008), Higgs and Worthington (2008).
5
error in the rational expectation of the spot price. In a multi-factor analysis, this means that
careful consideration needs to be given to variables that influence the forward price
formation, known to the market at time t, and shocks to the drivers of the spot price that occur
between t and T. In our analysis we give more consideration to this than previous studies. We
take a reduced-form perspective seeking to interpret in detail the significant factors affecting
the realised premium, which, since it does not require a theoretical counterfactual, would be
taken as the basis of ex post market monitoring.
Another special feature of electricity as a commodity is that it is actually a derived
commodity, insofar as in most electricity markets a substantial amount of the technologies use
the conversion of gas, coal or oil, and furthermore these technologies tend to set the market
price. Forecasts of electricity prices are strongly dependent upon those of the marginal fuels
(mainly gas) and so an important, and as yet unaddressed question, is how much of the market
price of risk is due to price formation in the electricity sector as such and how much is simply
a supply-chain transmission of the risk premia in the underlying primary fuels.
The industry structure of the electricity sector itself gives rise to another special feature, in
that electricity generation is usually a highly concentrated industry and as a consequence
oligopoly pricing remains a serious concern (EC, 2007, 2008). Although a substantial amount
of theoretical research (following Allaz, 1992) has suggested that forward contracting in a
concentrated market may mitigate market power effects in the spot market, we know that
market power raises spot prices (Weron, 2006) and it is an open question to what extent
market concentration may compound this by inducing additional market power effects in the
forward risk premium. We seek to address this as part of our multifactor analysis.
6
This paper therefore proceeds as follows: The next section summarises related research in
forward prices and positions our analysis. Section 3 introduces the market setting for our
analysis and quantifies the realised ex post forward premia. Section 4 develops a propositional
framework on the forward premia determinants. Section 5 presents the results of the
econometric model-based analysis. Finally, section 6 concludes.
2. Research Background
Two quite different streams of equilibrium modelling in forward markets have been
influential. One has focussed on the strategic effects of contracts in an oligopolistic risk
neutral environment, following Allaz (1992) and Allaz and Vila (1993), and the other on risk
aversion in a competitive financial market environment, following the work of Bessembinder
and Lemmon (2002). Allaz and Vila (1993), using a two stage game, show how Cournot
producers can be induced into forward commitments which in turn makes them behave more
competitively in the spot market. With risk neutral and arbitrage free assumptions, this
suggests lower prices than without a forward contracting opportunity. Although this pro-
competitive view of forward markets continues to be endorsed (Bushnell, 2007, et al., 2008),
the theoretical results become less clear when the simple two stage view of contracting is
relaxed (e.g. Mahenc and Salanie, 2004; Green and Le Coq, 2010).
From the other perspective, Bessembinder and Lemmon (2002), using a Taylor series
expansion of expected utility, suggest that the forward premium is a function of the variance
(negative influence) and skewness (positive influence) of spot prices. Empirical confirmations
of the significance of variance and skewness in the risk premia have been mixed, however.
Whilst Douglas and Popova (2008) confirm these for the PJM day-ahead forward market,
others including Lucia and Torro (2008), Botterud et al. (2009) for weekly contracts at the
Nord Pool, Redl et al. (2009) for monthly contracts at the EEX and Nord Pool, and Furio and
7
Meneu (2010) for monthly contracts in the Spanish electricity market find at best only partial
support.
In general, descriptive research on forward premia show significant values, although signs
vary by time of day and season. Longstaff and Wang (2004), Hadsell and Shawky (2006),
Diko et al. (2006), and Gjolberg and Johnsen (2001), Weron (2008) as well as Daskalakis and
Markellos (2009) find significant premia in the PJM, NYISO, APX, Powernext and Nord
Pool long-term electricity markets respectively.
In our analysis we focus upon EEX, the European Energy Exchange (EEX) based in Leipzig,
Germany, which has the most liquid futures/forward market in Europe (EC, 2007). Previous
studies which have analysed EEX forward premia include Diko et al. (2006), Bierbauer et al.
(2007), Kolos and Ronn (2008), Benth et al. (2008), Daskalakis and Markellos (2009) and
Redl et al. (2009). Kolos and Ronn (2008) find, in contrast to our study, a negative forward
premium for monthly, quarterly and yearly contracts at the EEX. However, their sample size
is smaller and covers only forward trading in 2002 and 2003. Diko et al. (2006) find that the
forward premium decreases as time to maturity for EEX peak load contracts decreases, whilst
Benth et al. (2008) relate the term structure of the forward premium to the net hedging
demand of consumers and producers (which they term as market power). Their model yields
decreasing absolute values of forward premia (eventually getting negative) and market power
estimates when time to maturity or delivery period length increase. These EEX price studies
take the risk considerations of market participants as the source of the forward premium
(implicitly assuming efficient spot price forecasts). Extending this, Redl et al. (2009) show
that additionally supply and demand shocks can contribute to the explanation of the futures-
spot difference as well as the conventional stochastic risk measures (variance and skewness of
spot prices).

8
3. Market setting and Initial Data Analysis
We focus on month-ahead futures for several reasons. Firstly, this is the most liquid contract
and most price data is available for futures with monthly delivery periods. Secondly, due to
the near-term delivery period, the forecast errors of market participants should, on average, be
low for up to one month ahead.8 More specifically, we consider only prices on the last trading
day before the delivery month.9 Futures at the EEX are settled financially. For baseload the
underlying is the mean of all hourly spot prices during the delivery period. For peak load the
underlying is the Phelix peak load index, which is the mean of the peak hours from 8:00am to
8:00 pm from Monday to Friday during the delivery period.10
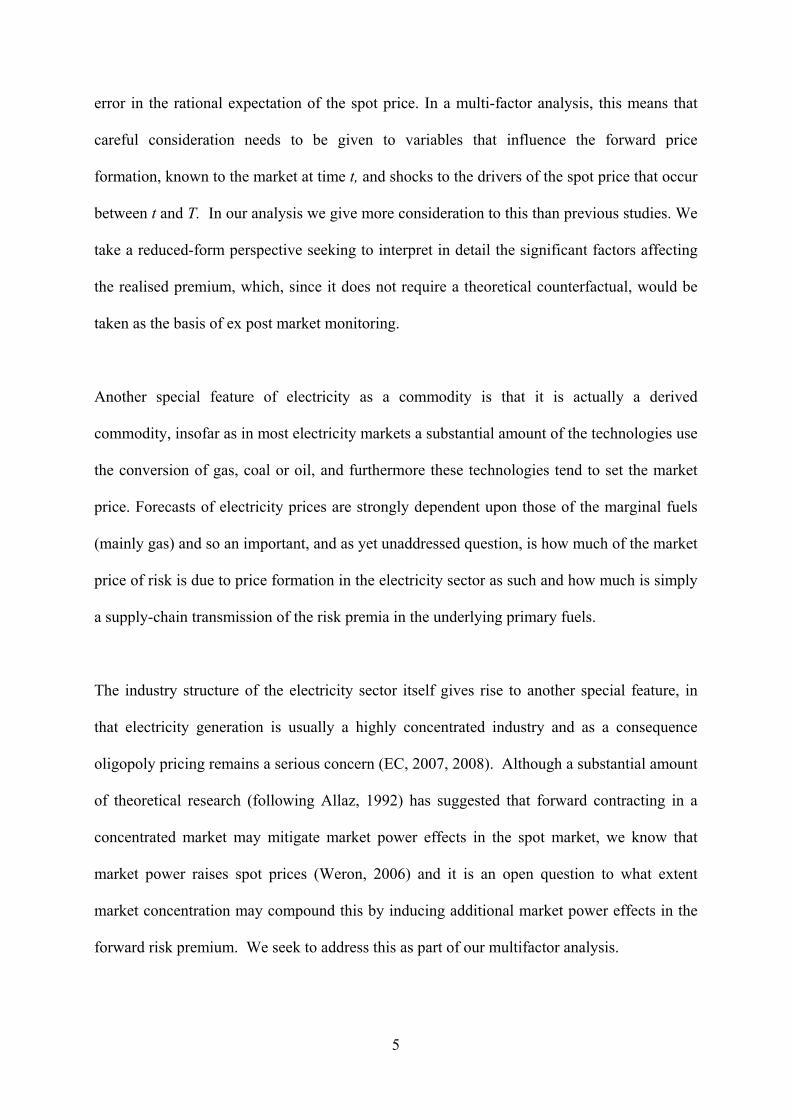
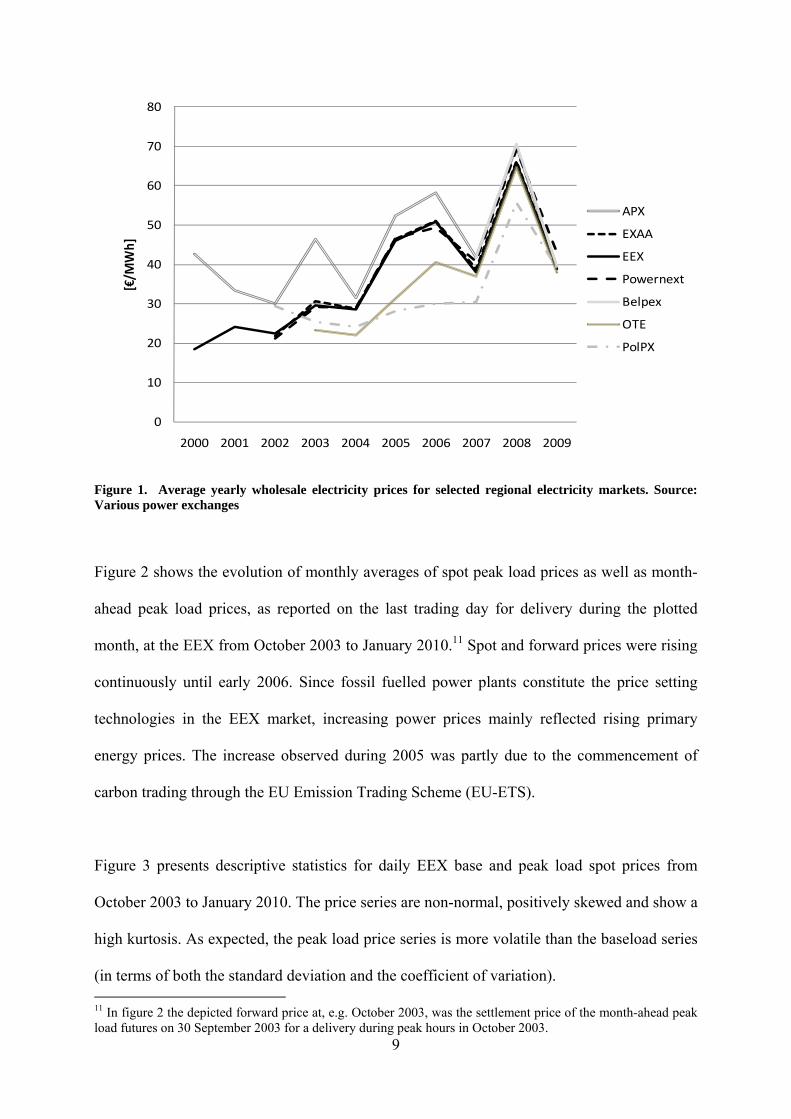
The European electricity market is still characterised by several (regional or national)
wholesale price areas which is caused by, among others, limited cross-border transmission
capacities. However, the Central/Western European market comprising Austria, Germany,
France and, to a certain extent, Switzerland is emerging to form the largest integrated
reference market for power in Continental Europe. The EEX is the leading exchange in this
extended region. In early 2007 implicit auctions between France, Belgium and the
Netherlands were introduced leading to a coupling of these markets thereby effectively
extending the Central European market and wholesale prices in the Czech Republic as well as
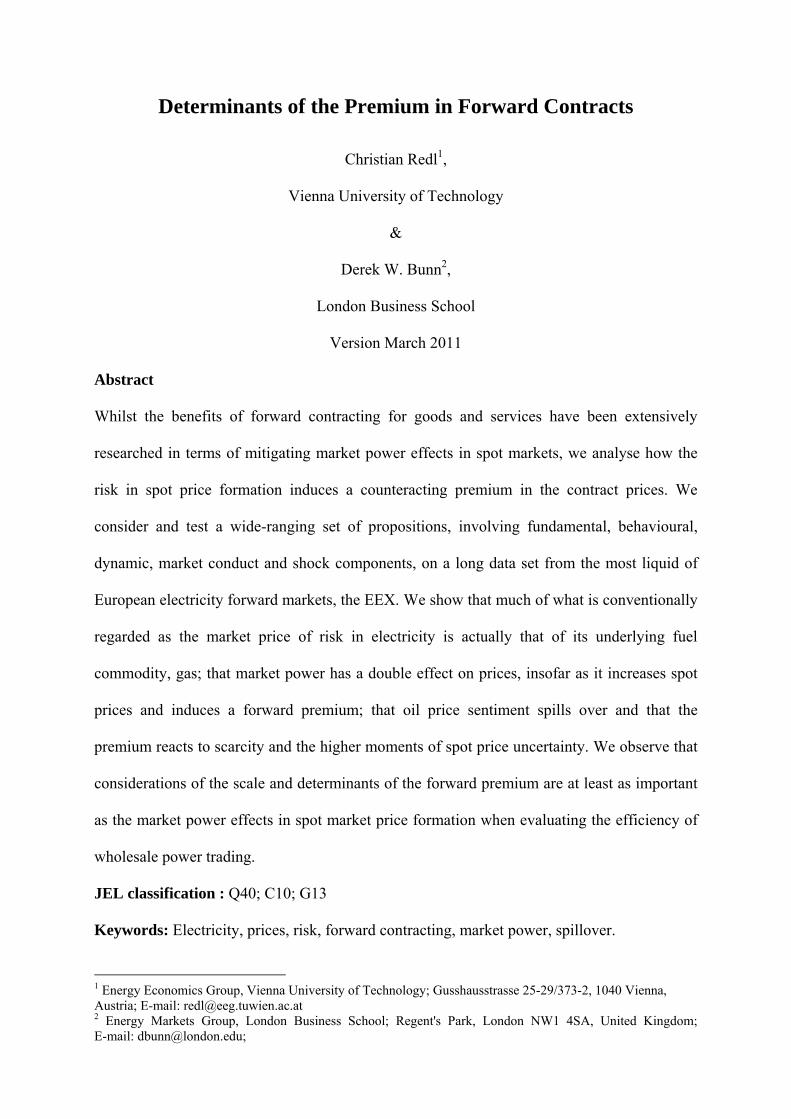
Poland have gradually reached the EEX level. Figure 1 depicts these price developments and
shows this increasing convergence over time.
8 Still, a spot price forecast covering an entire month may yield significant errors. We will deal with this issue in the following sections. 9 We later provide a detailed motivation of this assumption. 10 http://www.eex.com/en
9
Figure 1. Average yearly wholesale electricity prices for selected regional electricity markets. Source: Various power exchanges
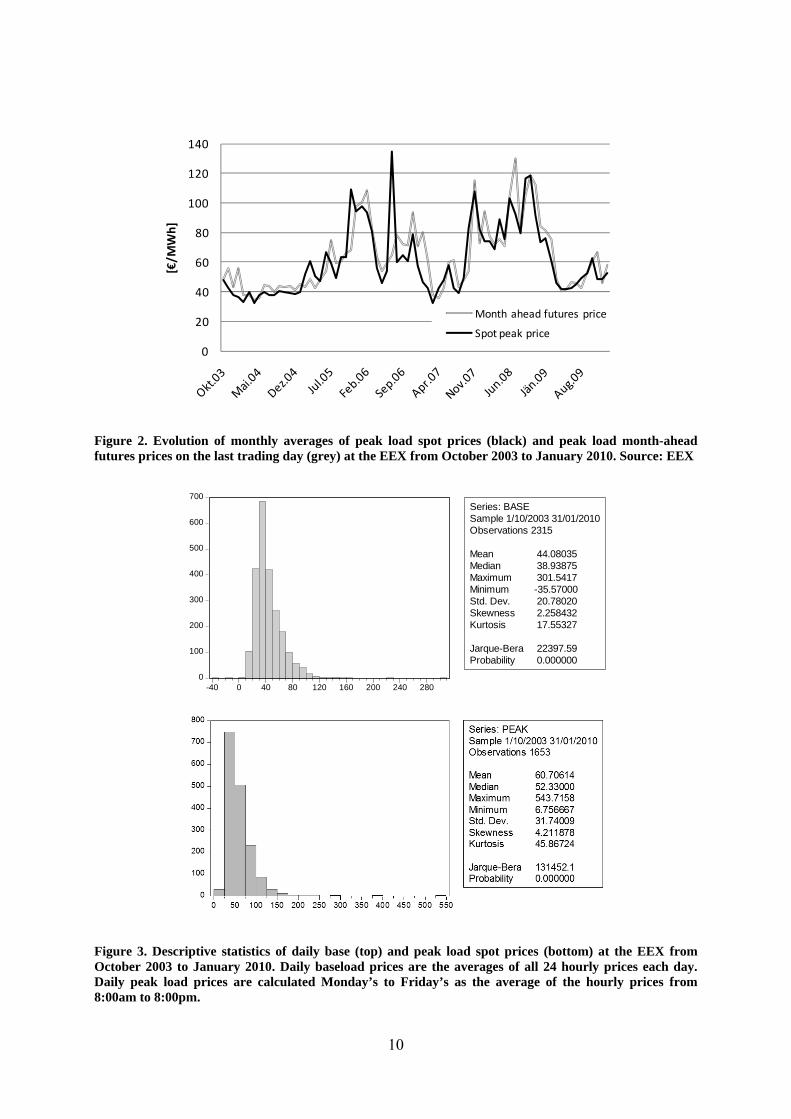
Figure 2 shows the evolution of monthly averages of spot peak load prices as well as month-
ahead peak load prices, as reported on the last trading day for delivery during the plotted
month, at the EEX from October 2003 to January 2010.11 Spot and forward prices were rising
continuously until early 2006. Since fossil fuelled power plants constitute the price setting
technologies in the EEX market, increasing power prices mainly reflected rising primary
energy prices. The increase observed during 2005 was partly due to the commencement of
carbon trading through the EU Emission Trading Scheme (EU-ETS).
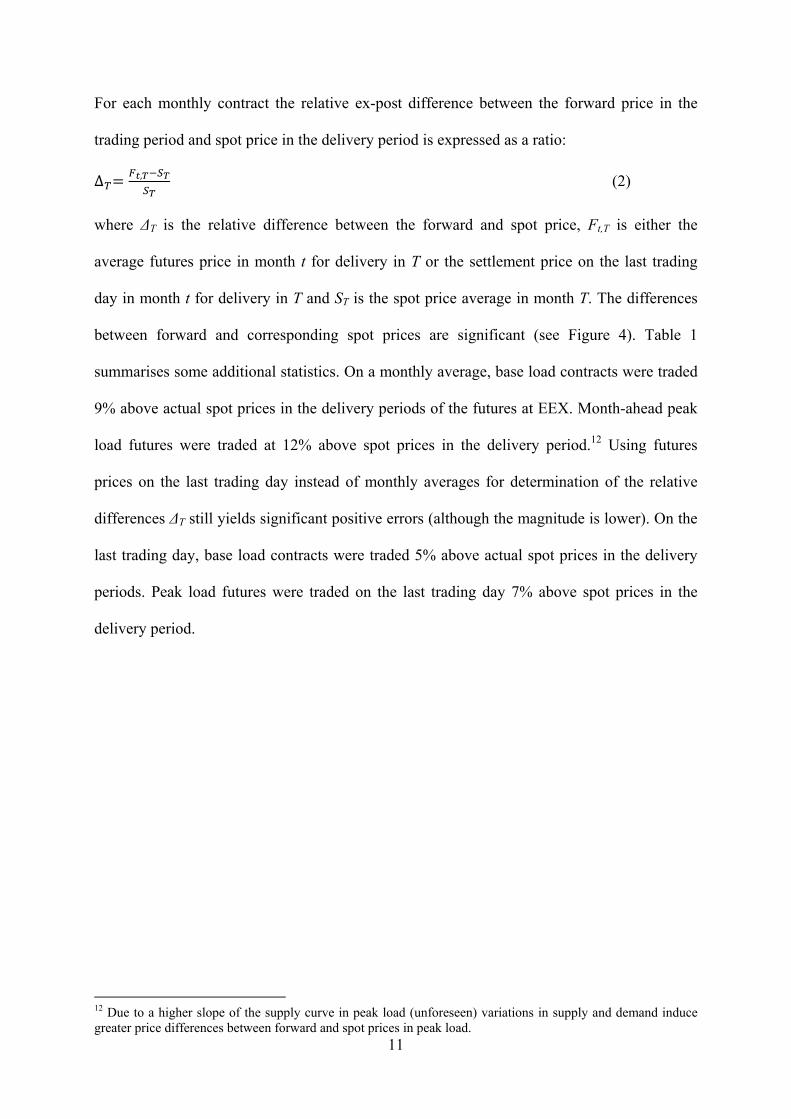
Figure 3 presents descriptive statistics for daily EEX base and peak load spot prices from
October 2003 to January 2010. The price series are non-normal, positively skewed and show a
high kurtosis. As expected, the peak load price series is more volatile than the baseload series
(in terms of both the standard deviation and the coefficient of variation). 11 In figure 2 the depicted forward price at, e.g. October 2003, was the settlement price of the month-ahead peak load futures on 30 September 2003 for a delivery during peak hours in October 2003.
0
10
20
30
40
50
60
70
80
2000 2001 2002 2003 2004 2005 2006 2007 2008 2009
[€/M
Wh]
APX
EXAA
EEX
Powernext
Belpex
OTE
PolPX
10
Figure 2. Evolution of monthly averages of peak load spot prices (black) and peak load month-ahead futures prices on the last trading day (grey) at the EEX from October 2003 to January 2010. Source: EEX
Figure 3. Descriptive statistics of daily base (top) and peak load spot prices (bottom) at the EEX from October 2003 to January 2010. Daily baseload prices are the averages of all 24 hourly prices each day. Daily peak load prices are calculated Monday’s to Friday’s as the average of the hourly prices from 8:00am to 8:00pm.
0
20
40
60
80
100
120
140
[€/M
Wh]
Month ahead futures price
Spot peak price
0
100
200
300
400
500
600
700
-40 0 40 80 120 160 200 240 280
Series: BASESample 1/10/2003 31/01/2010Observations 2315
Mean 44.08035Median 38.93875Maximum 301.5417Minimum -35.57000Std. Dev. 20.78020Skewness 2.258432Kurtosis 17.55327
Jarque-Bera 22397.59Probability 0.000000
11
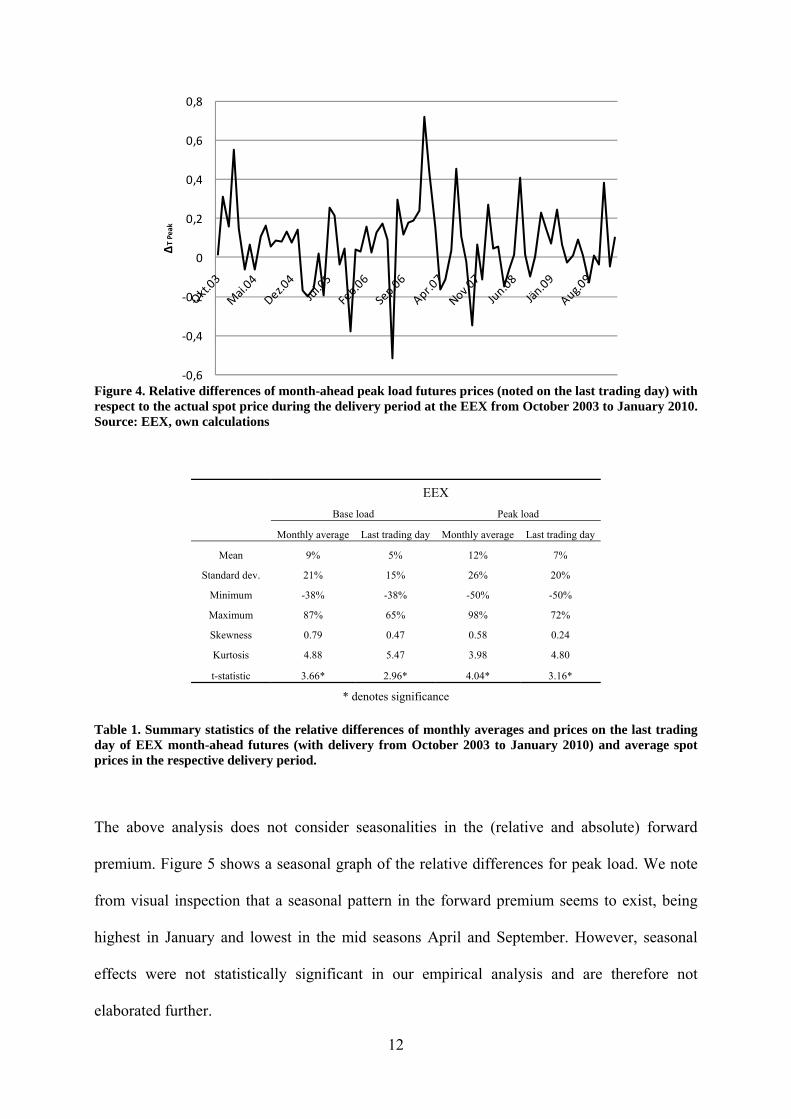
For each monthly contract the relative ex-post difference between the forward price in the
trading period and spot price in the delivery period is expressed as a ratio:
∆ , (2)
where ΔT is the relative difference between the forward and spot price, Ft,T is either the
average futures price in month t for delivery in T or the settlement price on the last trading
day in month t for delivery in T and ST is the spot price average in month T. The differences
between forward and corresponding spot prices are significant (see Figure 4). Table 1
summarises some additional statistics. On a monthly average, base load contracts were traded
9% above actual spot prices in the delivery periods of the futures at EEX. Month-ahead peak
load futures were traded at 12% above spot prices in the delivery period.12 Using futures
prices on the last trading day instead of monthly averages for determination of the relative
differences ΔT still yields significant positive errors (although the magnitude is lower). On the
last trading day, base load contracts were traded 5% above actual spot prices in the delivery
periods. Peak load futures were traded on the last trading day 7% above spot prices in the
delivery period.
12 Due to a higher slope of the supply curve in peak load (unforeseen) variations in supply and demand induce greater price differences between forward and spot prices in peak load.
12
Figure 4. Relative differences of month-ahead peak load futures prices (noted on the last trading day) with respect to the actual spot price during the delivery period at the EEX from October 2003 to January 2010. Source: EEX, own calculations
EEX
Base load Peak load
Monthly average Last trading day Monthly average Last trading day
Mean 9% 5% 12% 7%
Standard dev. 21% 15% 26% 20%
Minimum -38% -38% -50% -50%
Maximum 87% 65% 98% 72%
Skewness 0.79 0.47 0.58 0.24
Kurtosis 4.88 5.47 3.98 4.80
t-statistic 3.66* 2.96* 4.04* 3.16*
* denotes significance
Table 1. Summary statistics of the relative differences of monthly averages and prices on the last trading day of EEX month-ahead futures (with delivery from October 2003 to January 2010) and average spot prices in the respective delivery period.
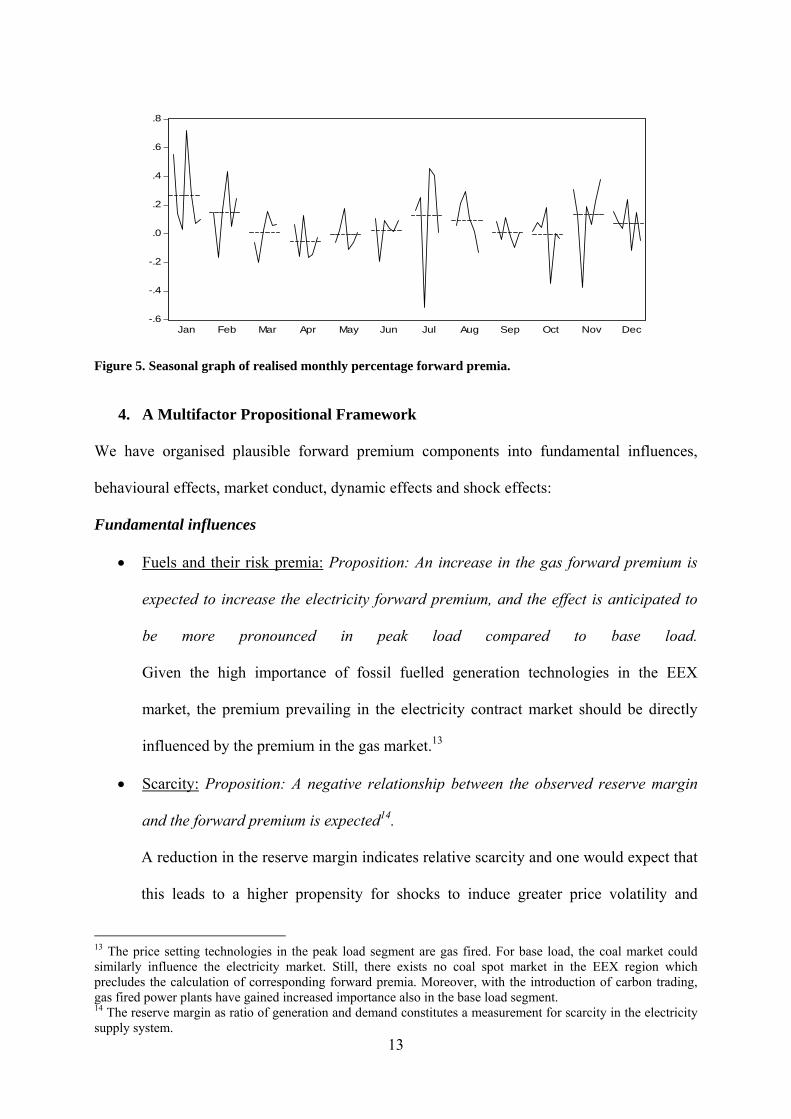
The above analysis does not consider seasonalities in the (relative and absolute) forward
premium. Figure 5 shows a seasonal graph of the relative differences for peak load. We note
from visual inspection that a seasonal pattern in the forward premium seems to exist, being
highest in January and lowest in the mid seasons April and September. However, seasonal
effects were not statistically significant in our empirical analysis and are therefore not
elaborated further.
‐0,6
‐0,4
‐0,2
0
0,2
0,4
0,6
0,8
ΔT Peak
13
Figure 5. Seasonal graph of realised monthly percentage forward premia.
4. A Multifactor Propositional Framework
We have organised plausible forward premium components into fundamental influences,
behavioural effects, market conduct, dynamic effects and shock effects:
Fundamental influences
Fuels and their risk premia: Proposition: An increase in the gas forward premium is
expected to increase the electricity forward premium, and the effect is anticipated to
be more pronounced in peak load compared to base load.
Given the high importance of fossil fuelled generation technologies in the EEX
market, the premium prevailing in the electricity contract market should be directly
influenced by the premium in the gas market.13
Scarcity: Proposition: A negative relationship between the observed reserve margin
and the forward premium is expected14.
A reduction in the reserve margin indicates relative scarcity and one would expect that
this leads to a higher propensity for shocks to induce greater price volatility and
13 The price setting technologies in the peak load segment are gas fired. For base load, the coal market could similarly influence the electricity market. Still, there exists no coal spot market in the EEX region which precludes the calculation of corresponding forward premia. Moreover, with the introduction of carbon trading, gas fired power plants have gained increased importance also in the base load segment. 14 The reserve margin as ratio of generation and demand constitutes a measurement for scarcity in the electricity supply system.
-.6
-.4
-.2
.0
.2
.4
.6
.8
Jan Feb Mar Apr May Jun Jul Aug Sep Oct Nov Dec
14
spikes. Given an adaptive expectations adjustment by market participants, a perceived
decreasing margin in the spot market may cause expected spot prices and therefore
forward prices and, correspondingly, premia to increase.15
Behavioural effects
Higher moments: Proposition: Higher central moments of the spot price distribution
(variance, skewness and kurtosis) are of importance for the risk assessment of market
actors. We postulate adaptive expectation formation with respect to the risk
assessment of the market participants, as it is plausible that spot market realisations in
the trading month of the forward contract will be used by agents as proxies for the
anticipated realisations in the delivery month.16, with adaptive heuristics being likely
to occur (e.g., Ricciardi, 2008). The influential work of Bessembinder and Lemmon
(2002) considers agents to be non-strategic, risk averse utility maximisers, but their
main result neglects higher moments beyond variance and skewness in the Taylor
series expansion. Given the increasing interest in fat tails and aversion to extreme
outcomes, it is plausible that a positive influence of the kurtosis of spot prices on the
premium could be expected. Positively skewed spot prices increase the hedging
demand of retailers given fixed retail prices. On the other hand, spot price spikes
represent opportunity costs of generators having sold forward. Both factors contribute
to a positive forward premium. Hence the regression coefficient associated with the
skewness should show a positive sign. The influence of the variance of spot prices on
the forward premium is, however, not clear cut. Bessembinder and Lemmon (2002)
predict a negative effect. It could be argued however, that, due to the convexity of the
15 It would be reasonable to suggest a nonlinear effect of the reserve margin given the convexity of the supply curve. However, our results did not differ when linear margin terms are replaced by quadratic ones. 16 In the light of adaptive expectations a further natural risk assessment parameter would be the corresponding realisation in the spot market of the same delivery month a year ago. Still, all 12-month lagged variables turned out to be statistically insignificant in our models.
15
supply curve, shocks that create high skewness and volatility are very similar and
therefore in the risk premia regressions, these two moments should have similar signs.
Spikes: Proposition: The forward premium increases due to the occurrence of spikes
in the spot market. It is plausible that recent spike episodes may induce greater risk
aversion. Dummy variables which account for the occurrence of spikes may allow a
more subtle representation of this compared to the skewness and kurtosis measures.
Different degrees of spikiness respectively thresholds can be defined (mean plus one,
1.5, two, 2.5 and three standard deviations, Weron, 2006). The relevant spot price
aggregation level for estimating spikes at the EEX is the daily base or peak load spot
price average (Phelix Base, Phelix Peak), since the underlying of monthly futures
contracts is the monthly average of the Phelix day indices. Given positively skewed
spot prices a positive influence of the spike count variable on the premium is expected.
Oil market volatility: Proposition: Increased volatility in the oil market increases the
electricity forward premium. Due to the dominance of oil prices in the energy
commodity bundle and its sentiment effect for energy commodities in general, it is
plausible that electricity market agents are influenced by activity in the oil market.17
Hence, a regression coefficient associated with oil market volatility would be expected
to show a positive sign.
Market conduct
Market power: Proposition: The exercise of market power in the spot market
positively influences the forward premium. Theory is mixed on the interaction of
market power and forward contracting. We have already referred to the work of Allaz
and Vila (1993), which suggests that forward contracting mitigates the exercise of
market power in the spot market. On the other hand, the model of Robinson and
Baniak (2002) including oligopolistic risk neutral generators and risk averse retailers
17 Even though oil fired power plants are very rarely dispatched.
16
suggests that the generators increase the spot market volatility in order to increase the
forward premium in contracts. Furthermore, it is plausible to argue, similarly to
Anderson and Hu (2008), that producers who can increase spot market prices demand
a higher premium to contract forward18 and that buyers see generator market power as
an additional risk factor which increases their willingness to pay forward premia.
The estimation of reliable forward market concentration proxy variables, which would
allow empirical insights into market power, is, however, quite elusive in the absence
of detailed contract data. On the other hand, estimated base load and peak load price
mark ups above marginal cost estimates for the spot market can be included in the
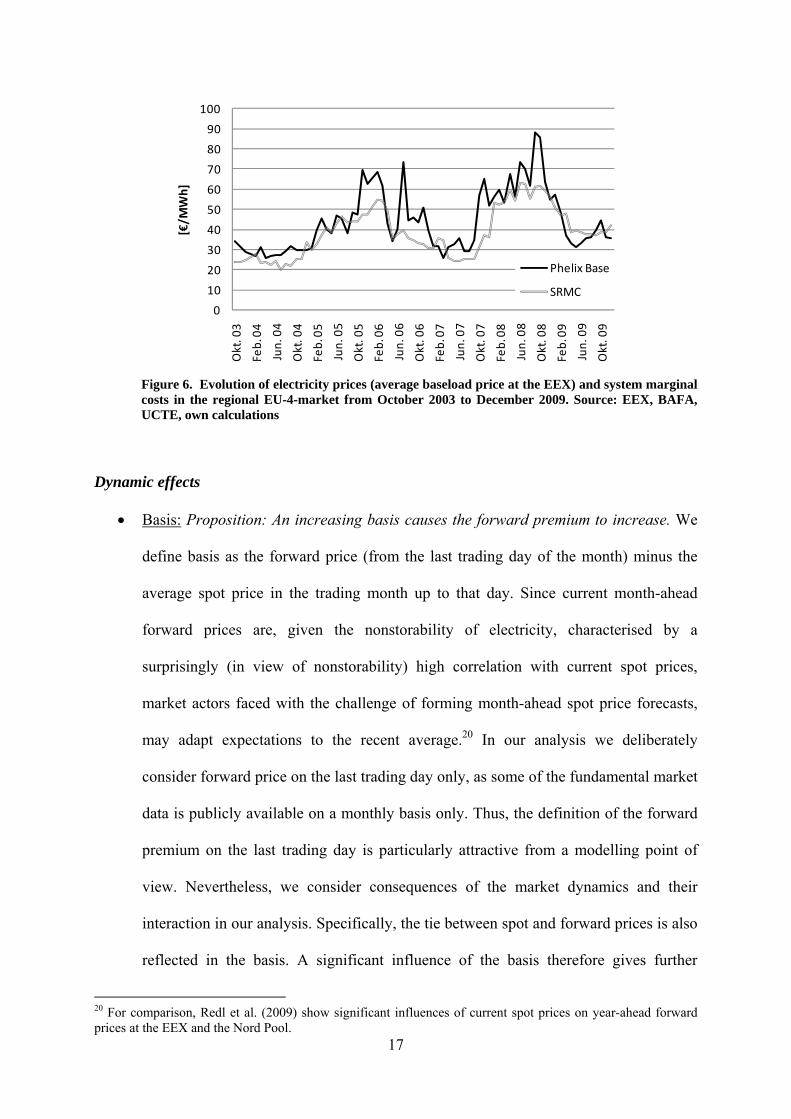
analysis. Figure 6 below depicts the evolution of EEX spot prices and estimated
monthly averages of marginal costs in the regional EU4 market from 1999-2009. This
mark up variable – especially its relative pattern compared to observed spot prices –
can be an indicator of the exercise of market power of the dominant producers.19
18 Anderson and Hu (2008) present an equilibrium model of a generator’s duopoly who compete via supply functions in the spot market. The retailer incentivises the generators to enter contracts by offering a premium. 19 We note that the marginal cost estimate is an average monthly value, which is compared to the average base or peak load price index. Start up costs or other opportunity cost considerations are, hence, not part of the monthly average cost estimate. On the other hand, brief downward excursions in the day ahead price (e.g. negative daily prices on certain days in 2009) can cause average monthly prices to decrease, which, however, is not reflected in the average SRMC estimate. Therefore, observed market prices can, at certain months, also be below the SRMC estimate.
17
Figure 6. Evolution of electricity prices (average baseload price at the EEX) and system marginal costs in the regional EU-4-market from October 2003 to December 2009. Source: EEX, BAFA, UCTE, own calculations
Dynamic effects
Basis: Proposition: An increasing basis causes the forward premium to increase. We
define basis as the forward price (from the last trading day of the month) minus the
average spot price in the trading month up to that day. Since current month-ahead
forward prices are, given the nonstorability of electricity, characterised by a
surprisingly (in view of nonstorability) high correlation with current spot prices,
market actors faced with the challenge of forming month-ahead spot price forecasts,
may adapt expectations to the recent average.20 In our analysis we deliberately
consider forward price on the last trading day only, as some of the fundamental market
data is publicly available on a monthly basis only. Thus, the definition of the forward
premium on the last trading day is particularly attractive from a modelling point of
view. Nevertheless, we consider consequences of the market dynamics and their
interaction in our analysis. Specifically, the tie between spot and forward prices is also
reflected in the basis. A significant influence of the basis therefore gives further
20 For comparison, Redl et al. (2009) show significant influences of current spot prices on year-ahead forward prices at the EEX and the Nord Pool.
0
10
20
30
40
50
60
70
80
90
100
Okt. 03
Feb. 04
Jun. 04
Okt. 04
Feb. 05
Jun. 05
Okt. 05
Feb. 06
Jun. 06
Okt. 06
Feb. 07
Jun. 07
Okt. 07
Feb. 08
Jun. 08
Okt. 08
Feb. 09
Jun. 09
Okt. 09
[€/M
Wh]
Phelix Base
SRMC
18
insight into the expectation formation of the market participants. An increasing basis is
therefore expected to increase the forward premium.
Shocks
Proposition: Margin shocks positively influence the forward premium. To be able to
account for supply and demand shocks between forward trades and future spot trades a
margin shock variable is introduced. This combined approach has been chosen to
avoid long-term trend effects of a separate consumption and generation representation.
If, ceteris paribus, consumption is unexpectedly high in the delivery month spot prices
should exceed forward prices due to a decreasing margin. On the other hand, if, ceteris
paribus, total generation rises unexpectedly spot prices should fall below forward
prices since the supply curve is shifted to the right. Hence, the regression coefficient
associated with the realised margin is expected to show a positive sign.
Table 2 summarises the above propositions on the effects of forward premia components and
respective proxy variables. Apart from the margin shock, all variables are observable for the
market participants on the forward trading day.

19
Effect on forward
premium Proxy variable
Fundamentals*
Premia in fuels + Month ahead gas forward premium
Scarcity - Reserve margin: Ratio generation/consumption in the regional market Behavioural effects*
Variance + Coefficient of variation of spot price
Skewness + Skewness of spot price
Kurtosis + Kurtosis of spot price
Spikes + Count spikes outside 1, 1.5, 2, 2.5, 3 standard deviations of mean spot
Oil volatility + Coefficient of variation of Brent oil spot price
Conduct* Spot market
power + Fundamental cost mark up estimate for regional spot market
Dynamics*
Basis + Difference of forward price and spot price average in trading month
Shocks
Margin shocks + Change in supply margin during delivery month
Table 2. Summary of forward premia determinants. * denotes that the respective variables are observable for market participants on the forward trading day.
5. Analysis of the ex post forward premium
We develop reduced form models to give insights on the above propositions. Furthermore, the
analysis assumes myopic expectations in the sense that the market participants are influenced
by current and historic events on the spot market. These events, in turn, contribute to the risk
and market assessment of the agents and, hence, to the forward premium. All parameters
except the margin shock are observable for the market participants on the last trading day of
month t.21 We analyse both base load and peak load forward contracting.
Base load
Sequentially minimising the AIC criterion, pursuing a general-to-specific model identification
characterised by all variables discussed in section 4, yields the following equation for the ex
post baseload forward premium:
21 For comparison, Douglas and Popova (2008) also partly assume adaptive expectations in their model – represented in particular by one period lagged values of variance and skewness of spot prices and gas storage levels.
20
, ,
7 ,
(3)
where Ft,T-ST is the ex post forward premium, Ft,T is the futures price on the last trading day in
month t for delivery in month T, ST is the spot price average in month T, cv(St) is the
coefficient of variation of daily spot prices in month t, cv(Brentt) is the coefficient of variation
of daily Brent spot prices in month t, FPGas t-1,t is the realised gas forward premium of a month
ahead futures for month t, Margint is the realised ratio of generation and consumption in
month t, Basist is the difference between the futures price on the last trading day in month t
for delivery in month T (Ft,T) and the spot price average in month t (St), and MarginT is the
margin shock in month T. Results for the corresponding model are shown in Table 3.
The significant positive influence of volatility in the oil market confirms the “sentiment”
importance of the oil market for energy commodities in general. Interestingly, its influence is
as important as the influence of the volatility on the electricity market itself (in terms of
statistical significance). Similarly, the economic responsiveness is very high with an average
elasticity of 2.4. Hence, a one percentage increase of the oil market volatility causes a 2.4%
change of the electricity forward premium. The volatility of electricity spot prices positively
influences the futures price and, hence, the forward premium. The influence of the spot price
volatility on the forward premium is in general agreement with the empirical literature cited in
section 2 but in previous research the sign of this measure seems to be indeterminate. In our
case the sign is positive which is opposite to Bessembinder and Lemmon (2002) but conforms
21
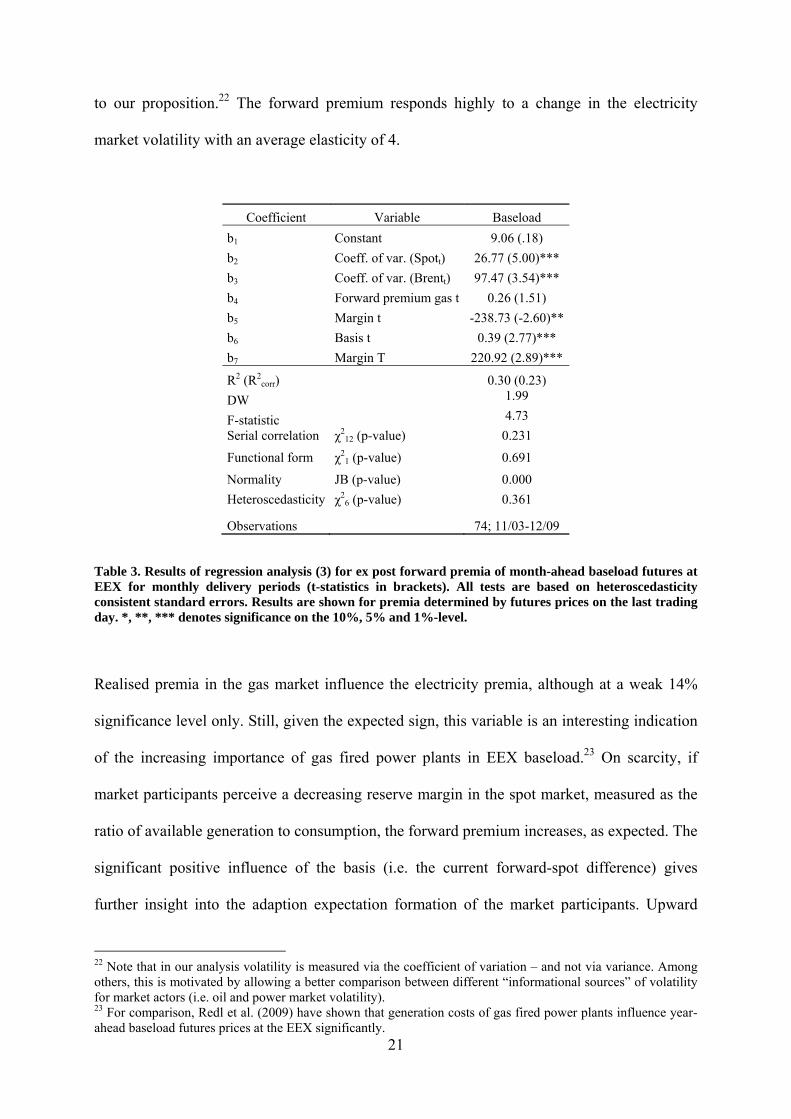
to our proposition.22 The forward premium responds highly to a change in the electricity
market volatility with an average elasticity of 4.
Coefficient Variable Baseload
b1 Constant 9.06 (.18)
b2 Coeff. of var. (Spott) 26.77 (5.00)***
b3 Coeff. of var. (Brentt) 97.47 (3.54)***
b4 Forward premium gas t 0.26 (1.51)
b5 Margin t -238.73 (-2.60)**
b6 Basis t 0.39 (2.77)***
b7 Margin T 220.92 (2.89)***
R2 (R2corr) 0.30 (0.23)
DW 1.99
F-statistic 4.73
Serial correlation χ212 (p-value) 0.231
Functional form χ21 (p-value) 0.691
Normality JB (p-value) 0.000
Heteroscedasticity χ26 (p-value) 0.361
Observations 74; 11/03-12/09
Table 3. Results of regression analysis (3) for ex post forward premia of month-ahead baseload futures at EEX for monthly delivery periods (t-statistics in brackets). All tests are based on heteroscedasticity consistent standard errors. Results are shown for premia determined by futures prices on the last trading day. *, **, *** denotes significance on the 10%, 5% and 1%-level.
Realised premia in the gas market influence the electricity premia, although at a weak 14%
significance level only. Still, given the expected sign, this variable is an interesting indication
of the increasing importance of gas fired power plants in EEX baseload.23 On scarcity, if
market participants perceive a decreasing reserve margin in the spot market, measured as the
ratio of available generation to consumption, the forward premium increases, as expected. The
significant positive influence of the basis (i.e. the current forward-spot difference) gives
further insight into the adaption expectation formation of the market participants. Upward
22 Note that in our analysis volatility is measured via the coefficient of variation – and not via variance. Among others, this is motivated by allowing a better comparison between different “informational sources” of volatility for market actors (i.e. oil and power market volatility). 23 For comparison, Redl et al. (2009) have shown that generation costs of gas fired power plants influence year-ahead baseload futures prices at the EEX significantly.
22
trends in the, to a certain extent, tied spot and forward price series yield an increasing basis.
This, in turn, results in an increasing forward premium. Hence, the dynamics of the spot
market are reflected in the forward premium. Finally, the margin shock coefficient gives the
expected sign and is statistically significant. Therefore, this variable can assess
misjudgements of future supply and demand conditions and captures some of the forecast
error part of the forward premium defined by equation (1).
Peak load
A similar procedure to the above described one yields the following equation for the ex post
peak load forward premium:
, ,
,
(4)
where Ft,T-ST is the ex post forward premium, Ft,T is the peak load futures price on the last
trading day in month t for delivery during peak hours in month T, ST is the peak load spot
price average in month T, Skew(St) is the skewness of daily spot prices in month t, Spike2sd t is
the count of spikes outside of 2 standard deviations of the mean spot price in month t,
FPGas t-1,t is the realised gas forward premium of a month ahead futures for month t, Spot
market powert is the ratio of the spot price in month t and the fundamental marginal cost
estimate for month t, Margint is the ratio of regional generation and demand in month t, Basist
is the difference between the futures price on the last trading day in month t for delivery in
month T (Ft,T) and the spot price average in month t (St), and MarginT is the margin shock in
month T. Results for the corresponding model are shown in Table 4.
Realised premia in the gas market, as expected, have a significantly positive effect on the
electricity peak load premia. The price setting technologies in peak load hours are, in fact, gas
fired power plants. The significant positive influence of gas premia confirms the importance
23
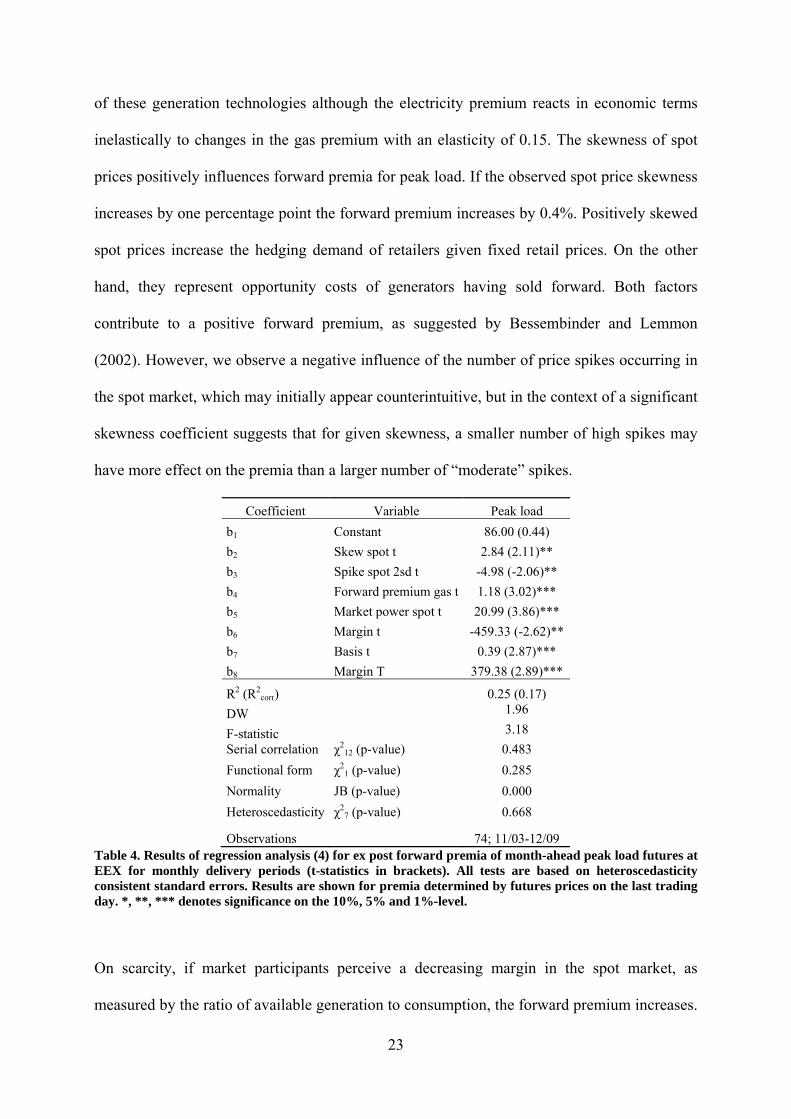
of these generation technologies although the electricity premium reacts in economic terms
inelastically to changes in the gas premium with an elasticity of 0.15. The skewness of spot
prices positively influences forward premia for peak load. If the observed spot price skewness
increases by one percentage point the forward premium increases by 0.4%. Positively skewed
spot prices increase the hedging demand of retailers given fixed retail prices. On the other
hand, they represent opportunity costs of generators having sold forward. Both factors
contribute to a positive forward premium, as suggested by Bessembinder and Lemmon
(2002). However, we observe a negative influence of the number of price spikes occurring in
the spot market, which may initially appear counterintuitive, but in the context of a significant
skewness coefficient suggests that for given skewness, a smaller number of high spikes may
have more effect on the premia than a larger number of “moderate” spikes.
Coefficient Variable Peak load
b1 Constant 86.00 (0.44)
b2 Skew spot t 2.84 (2.11)**
b3 Spike spot 2sd t -4.98 (-2.06)**
b4 Forward premium gas t 1.18 (3.02)***
b5 Market power spot t 20.99 (3.86)***
b6 Margin t -459.33 (-2.62)**
b7 Basis t 0.39 (2.87)***
b8 Margin T 379.38 (2.89)***
R2 (R2corr) 0.25 (0.17)
DW 1.96
F-statistic 3.18
Serial correlation χ212 (p-value) 0.483
Functional form χ21 (p-value) 0.285
Normality JB (p-value) 0.000
Heteroscedasticity χ27 (p-value) 0.668
Observations 74; 11/03-12/09 Table 4. Results of regression analysis (4) for ex post forward premia of month-ahead peak load futures at EEX for monthly delivery periods (t-statistics in brackets). All tests are based on heteroscedasticity consistent standard errors. Results are shown for premia determined by futures prices on the last trading day. *, **, *** denotes significance on the 10%, 5% and 1%-level.
On scarcity, if market participants perceive a decreasing margin in the spot market, as
measured by the ratio of available generation to consumption, the forward premium increases.
24
A decreasing margin is related to the increased likelihood of spikes occurring in the spot
market and, due to the convex supply curve, an increased skewness of spot prices. It is also
this close interrelation between the fundamental state of the system (margin) and higher
moments and parameters characterising the spot price distribution (skewness, price spikes)
which makes the specification of the functional form and its interpretation delicate.
Interestingly, the forward premium is positively influenced by the market power estimate. In
fact, spot price mark ups yield increases in the forward premium. This can be caused by a
higher willingness to pay of the buyers, which price generator market power as a risk factor,
and compensation demanded by dominant producers to be willing to sell forward (Anderson
and Hu, 2008). This result suggests, that any (positive) procompetitive effect of forward
markets is, in fact, counteracted to some degree by an increased risk premium. The economic
importance of this result is reinforced by the elasicity of the premium: if the mark up above
marginal costs in the spot market increases by 1% the forward premium increases by 0.9%.
We are not aware of any other study having empirically assessed this effect. Upward common
trends in the spot and forward price series yield an increasing basis. This, in turn, results in an
increasing forward premium which is reflected in a significant regression coefficient. Finally,
the scarcity shock coefficient shows the expected sign and is statistically significant. This
variable captures as in the baseload case, the forecast error part of the forward premium.
A number of specification variations were tried without revealing useful results. It seems that
the margin shock variable is sufficient to capture both demand and supply shocks. Because of
endogeniety concerns and the difficulty of specifying demand for a market which has high
interconnection to neighbours, we took an average central European temperature as a proxy,
but this proved not to be significant, nor did an analysis of the effect of temperature surprises
(actual monthly average in the delivery month minus long term ex ante monthly average). On
the supply side, although Daskalakis and Markellos (2009) found that EEX forward premia
25
can be partly explained by the volatility of CO2 spot price returns, we found that it had no
incremental value beyond being embedded in the volatility of electricity spot prices24.
6. Conclusion
We have introduced a multifactor analysis of electricity forward premia components to give
insights into some important propositions on the electricity forward premium. In general we
have shown several significant new effects:
We have controlled for the ex post nature of the analysis by including a margin shock
variable in the regressions, and this was indeed significant in both the peak and
baseload monthly ex post risk premia.
We have demonstrated that as a derived commodity, electricity translates a substantial
amount of the underling fuel’s market price of risk (i.e. much of the peak forward
premium is in fact due to the gas market).
We have shown that as part of the energy commodity trading bundle, oil market
sentiment spills over, in that increased oil price volatility increases the forward
premium.
Market power appears to have a double influence on wholesale prices – in addition to
its potential effect on spot prices, it increases the forward premium. It seems therefore
that whilst the theoretical effect of forward contracting may be to make the spot
market more competitive, generators are able to compensate for this through a higher
forward premium.25
24 Reassuringly, the inclusion of carbon price volatility resulted in an insignificant regression coefficient. Apart from the volatility of CO2 prices affecting the electricity forward premium the latter could also be influenced by the premium in the CO2 market. However, there are no month-ahead CO2 contracts traded. 25 The theoretical model of Allaz and Villa (1993) indicated an increase in physical supply of 20% compared to the no contract case, and in a similar way Green (1999) estimates, in a numerical example, price decreases of 25% when comparing fully contracted to uncontracted firms. The extensive analyses by Bushnell (2007, et. al., 2008) suggests price decreases of around 50% when firms’ contract positions are considered against a theoretical counterfactual. This contrasts with actual empirical studies reporting significant positive forward premia: Longstaff and Wang (2004) show for the PJM day ahead market premia up to 14%. Botterud et al. (2009) report
26
The effects of scarcity (reserve margin), spot volatility and skewness were significant
and consistent with propositions on the positive effects of market risk aversion.
Overall, the forward premium in electricity is a rather complex function of fundamental,
behavioural, dynamic, market conduct and shock components. It is clearly an
oversimplification in practice to analyse it only in terms of the stochastic properties of the
spot prices (variance and skewness). Only part of the risk can be attributed to the electricity
sector per se, but in that, risk aversion to scarcity, volatility and extreme events, as well as
behavioural adaptation and oil sentiment spillovers characterises agent behaviour.
Furthermore, market concentration appears to translate market power effects into the risk
premium, which may have important market monitoring implications since forward markets
have, so far, been considered to be procompetitive.26 The reserve margin plays a crucial role
since increased scarcity increases spot prices (which is amplified in the case of concentrated
markets) and, moreover, also the forward premium. Hence, consumers take a “double hit” if
the margin reduces, and if this is due to strategic withholding, then it is an important anti-trust
concern. In general, some of the insights presented here suggest that forward premia should
be considered key elements of a transaction cost analysis of market efficiency in power
trading.
Finally, the analysis purposely relied on variables which are observable for the market actors
on the forward trading day.27 As some of the fundamental market data is publicly available
only on a monthly basis, the definition of the forward premium on the last trading day is
particularly attractive for analysis. A more thorough investigation of the dynamic
interrelations between current spot and forward prices (and premia) would, however, benefit
for the Nord Pool market baseload premia from 1.3 to 4.4% for one week to six weeks ahead. Similarly, Redl et al. (2009) determine Nord Pool baseload premia of 8% for month-ahead contracts and EEX month-ahead premia of 9% for baseload and 13% for peak load. 26 See Anderson and Hu (2008) for a similar argument arising from a theoretical equilibrium model. 27 We argued that due to difficulties associated with forming month-ahead (or even longer) spot price forecasts it is very likely that the bidding behaviour on the forward market is affected by current events on the spot market.
27
from the higher granularity of daily representations or even higher frequency impact studies
of news on forward prices.
References
Allaz, B., 1992. Oligopoly, uncertainty and strategic forward transactions. International Journal of
Industrial Organization 10, 297-308.
Allaz, B., Vila, J.L., 1993. Cournot Competition, Forward Markets and Efficiency. Journal of
Economic Theory 59, 1-16.
Anderson, E.J., Hu, X., 2008. Forward contracts and market power in an electricity market.
International Journal of Industrial Organization 26, 679-694.
Benth, F.E., Cartea, A., Kiesel, R., 2008. Pricing forward contracts in power markets by the certainty
equivalence principle: Explaining the sign of the market risk premium. Journal of Banking & Finance
32, 2006-2021.
Bessembinder, H., Lemmon, M.L., 2002. Equilibrium Pricing and Optimal Hedging in Electricity
Forward Markets. The Journal of Finance 57(3), 1347-1382.
Bierbauer, M., Menn, C., Rachev, S.T., Trück, S., 2007. Spot and derivative pricing in the EEX power
market. Journal of Banking & Finance 31, 3462-3485.
Botterud, A., Kristiansen, T., Ilic, M., 2009. The relationship between spot and futures prices in the
Nord Pool electricity market. Energy Economics, In Press, doi:10.1016/j.eneco.2009.11.009.
Bowden, N., Payne, J.E., 2008. Short Term Forecasting of Electricity Prices for MISO Hubs: Evidence
from ARIMA-EGARCH Models. Energy Economics 30(6), 3186-3197.
Burger, M., Klar, B., Müller, A., Schindlmayr, G., 2004. A spot market model for pricing derivatives
in electricity markets. Quantitative Finance 4(1), 109-122.
Bushnell, J., 2007. Oligopoly equilibria in electricity contract markets. Journal of Regulatory
Economics 32, 225-245.
Bushnell, J., Mansur, E.T., and Saravia, C., 2008. Vertical Arrangements, Market Structure and
Competition: An Analysis of Restructured US Electricity Markets. American Economic Review, 98
(1) 237-266.
Christensen, B.J., Jensen, T.E., Molgaard, R., 2007. Market Power in Power Markets: Evidence from
Forward Prices of Electricity. CREATES Research Paper 2007-30. www.creates.au.dk
Daskalakis, G., Markellos, R., N., 2009. Are electricity risk premia affected by emission allowance
prices? Evidence from the EEX, Nord Pool and Powernext. Energy Policy (37). 2594-2604.
Diko, P., Lawford, S., Limpens, V., 2006. Risk Premia in Electricity Forward Markets. Studies in
Nonlinear Dynamics & Econometrics 10(3), Article 7.
28
Douglas, S., Popova, J., 2008. Storage and the electricity forward premium. Energy Economics 30(4),
1712-1727.
EC, 2007. DG Competition report on energy sector inquiry. SEC(2006) 1724, Brussels.
EC, 2008. Accompanying document to the Report on Progress in Creating the Internal Gas and
Electricity Market, COM(2008) 192 final, Brussels.
Furio, D., Meneu, V., 2010. Expectations and forward risk premium in the Spanish deregulated power
market. Energy Policy 38, 784-793.
Gjolberg, O., Johnsen, T., 2001. Electricity Futures: Inventories and Price Relationships at Nord Pool.
Discussion Paper #D-16/2001.
Green, R., 1999. The electricity contract market in England and Wales. The Journal of Industrial
Economics 47(1), 107-124.
Green, R., and Le Coq, C. 2010 The length of Contracts and Collusion. International Journal of
Industrial Organization 28, 21-29
Hadsell, L., Shawky, 2006. Electricity Price Volatility and the Marginal Cost of Congestion: An
Empirical Study of Peak Hours on the NYISO Market, 2001-2004. The Energy Journal 27-2, 157-179.
Higgs, H., Worthington, A., 2008. Stochastic price modelling of high volatility, mean-reverting, spike-
prone commodities: The Australian wholesale spot electricity market. Energy Economics 30(6), 748-
756.
Huisman, R., Huurman, C., Mahieu, R., 2007. Hourly electricity prices in day-ahead markets. Energy
Economics 29(2), 240-248.
Kaldor, N., 1939. Speculation and economic stability. The Review of Economic Studies 7, 1-27.
Kanamura, T., Ohashi, K., 2008. On transition probabilities of regime switching in electricity prices.
Energy Economics 30(3), 1158-1172.
Karakatsani, N.V., Bunn, D.W., 2008. Intra-day and regime-switching dynamics in electricity price
formation. Energy Economics 30(4), 1776-1797.
Keynes, J. M., 1930. A Treatise on Money. London: Macmillan.
Kolos, S.P., Ronn, E.I., 2008. Estimating the commodity market price of risk for energy prices.
Energy Economics 30(2), 621-641.
Longstaff, F.A., Wang, A., 2004. Electricity Forward Prices: A High-Frequency Empirical Analysis.
The Journal of Finance 59(4), 1877-1900.
Lucia, J.J., Schwartz, E.S., 2002. Electricity Prices and Power Derivatives. Evidence from the Nordic
Power Exchange. Review of Derivatives Research 5(1), 5-50.
Lucia, J.J, Torro, H., 2008. Short-term electricity futures prices: Evidence on the time-varying risk
premium. Working paper.
Mahenc, P., Salanie, F., 2004. Softening competition through forward trading. Journal of Economic
Theory 116, 282-293.
29
Ofgem, 2009. Liquidity in the GB wholesale electricity markets. Discussion Paper 62/09.
www.ofgem.gov.uk
Ofgem, 2010. Electricity and Gas Supply Market Report. Report 146/10. www.ofgem.gov.uk
Omel, 2010, Order ITC/1601/2010 www.subastascesur.omel.es/en/cesur-auctions/regulations
Redl, C., Haas, R., Huber, C., Böhm, B., 2009. Price formation in electricity forward markets and the
relevance of systematic forecast errors, Energy Economics 31(3), 356-364.
Ricciardi, V., 2008. The Psychology of Risk: The Behavioral Finance Perspective. In: Frank J.
Fabozzi, ed., Handbook Of Finance: Volume 2: Investment Management And Financial Management,
Wiley, pp. 85–111.
Robinson, T., Baniak, A., 2002. The volatility of prices in the English and Welsh electricity pool.
Applied Economics 34, 1487-1495.
Weron, R., 2006. Modeling and forecasting electricity loads and prices: a statistical approach. Wiley,
Chichester, ISBN 047005753X.
Weron, R., 2008. Market price of risk implied by Asian-style electricity options and futures. Energy
Economics 30(3), 1098-1115.
Acknowledgments
The authors are grateful for comments from Benoit Sevi, Sjur Westgaard, Ole Gjolberg and Stein-Erik
Fleten. An earlier version of this article was presented at seminars at the University of Cambridge and
at NTNU Trondheim.