Fresh Vegetable Growers' Risk Perception, Risk - AgEcon Search
1
H i C N Households in Conflict Network The Institute of Development Studies - at the University of Sussex - Falmer - Brighton - BN1 9RE
www.hicn.org
The Perception of Lethal Risks
- Evidence from a Laboratory
Experiment1
Manuel Schubert2 and Tilman Brück3
HiCN Working Paper 188
October 2014
Abstract: We run a novel experiment to explore the relationship between the perception of
real-life risks and the demand for risk reduction. Subjects play a series of loss lotteries in
which the odds are matched to the likelihood of lethal events in real life. For each risk,
subjects can pay premiums in order to reduce the likelihood of total bankruptcy. Our results
show a complex interplay of mortality perception and demand for risk reduction. We observe
that perceived annual mortality positively affects the demand for risk reduction. Moreover, we
find certain risk characteristics to affect perceived mortality, others to drive the demand for
risk reduction, and some to alter both. Our findings suggest that 30 percent of all insurance
payments are due to biased perceptions of annual mortality while perfect precaution could
lower payments by 45 percent. Implications for risk management policies are discussed.
Keywords: risk perception, lethal risks, experiment, insurance
JEL Codes: C9, D81.
1 We are thankful to Eduard Braun, Lisa Einhaus, Marcus A. Giamattei, Johann Graf Lambsdorff, Andreas Ortmann, and Anja Ullrich for providing valuable comments and feedback. We would also like to thank participants at the Interdisciplinary Wolfgang Köhler Research Center, the Development and Security seminar at DIW Berlin, and the Passau Experimental Economics Colloquium. Financial support was gratefully received from the Humboldt-University Berlin. 2University of Passau, Germany 3 Stockholm International Peace Research Institute (SIPRI), Stockholm, Sweden and Institute for the Study of Labor (IZA), Bonn, Germany
2
1. Introduction
How do people perceive and respond to lethal risks? How can public risk communication and
management be enhanced? During the last decades, a number of studies have raised these and
similar questions and contributed to our present understanding of risk perception. One of the
most replicated finding is that laypeople form biased expectations about the objective
likelihood of lethal events (e.g. Lichtenstein et al. 1978). They underestimate the likelihood of
common causes of death and overestimate the likelihood of rare causes of death. Moreover,
people’s risk perceptions are linked to exogenous anchors such as media coverage or personal
experience (Tversky and Kahneman 1974; Lichtenstein et al. 1978). The more often people
have been exposed to the consequences of a risk, the higher the perceived levels of risk.
Inspired by these early findings, a series of papers has subsequently elaborated what has been
labeled as the psychometric approach and analysed the impact of various qualitative
characteristics on perceived risk (e.g. Slovic et al. 1980; 1984; Slovic 1987). Overall results
suggest that perceived risk is quantifiable and predictable. People’s risk judgments seem to be
a function of qualitative risk characteristics, such as dreadness, knowledge, controllability or
catastrophic potential (Slovic et al. 1980). Newer studies have come to recognize the
relevance of emotions beyond psychometric drivers of risk (Sunstein 1997; Loewenstein et al.
2001). They argue that many of the real-world phenomena arise as a result of intuitive
reactions to perceived threats. But if people hold both misperceptions about objective
mortality rates and preferences to avoid emotionally “bad deaths”, should government
regulation be aligned to communicational or precautionary measures? More precisely, what
exactly drives our desire for risk reduction and perceived mortality?4 And how do we respond
to changes in perceived and actual mortality rates?
In this paper, we present the results of an experimental investigation that provides first
answers to these questions. Our study brings real-life risks into the laboratory. It focusses on
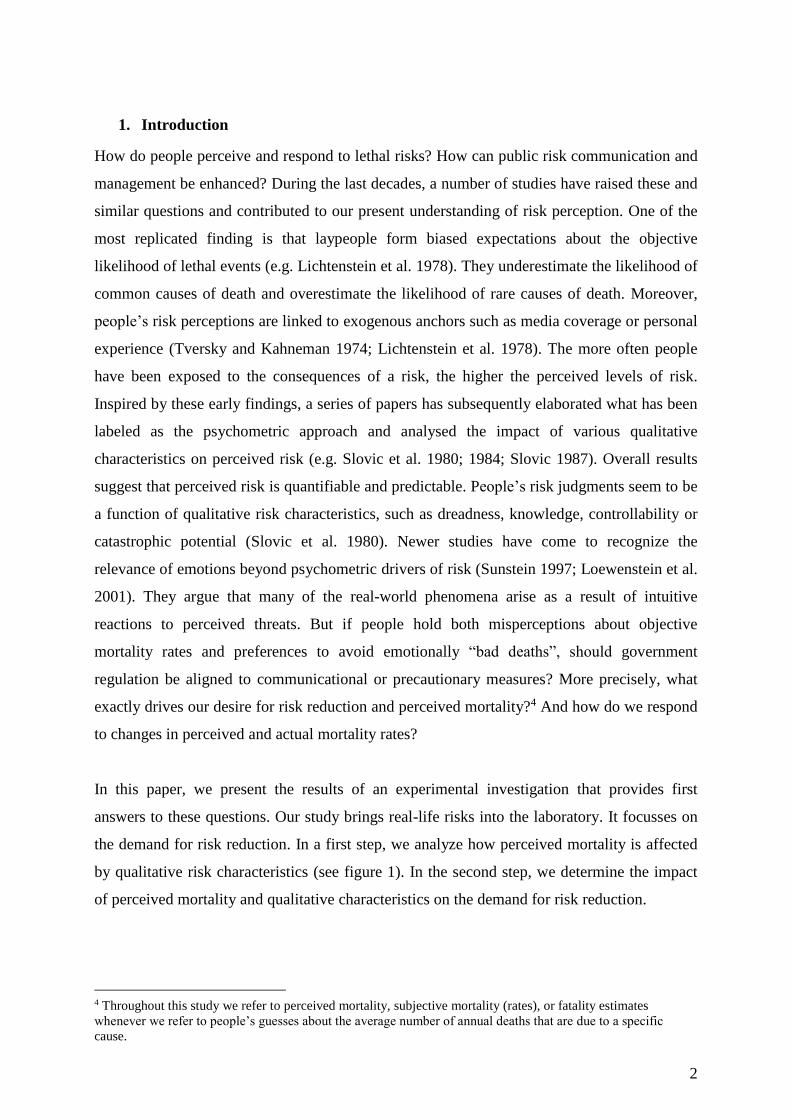
the demand for risk reduction. In a first step, we analyze how perceived mortality is affected
by qualitative risk characteristics (see figure 1). In the second step, we determine the impact
of perceived mortality and qualitative characteristics on the demand for risk reduction.
4 Throughout this study we refer to perceived mortality, subjective mortality (rates), or fatality estimates
whenever we refer to people’s guesses about the average number of annual deaths that are due to a specific
cause.
3
Figure 1: Demand for risk reduction
Our approach fundamentally differs from previous approaches to risk perception in various
ways: First, most studies have focused on the notion of “perceived risk” as dependent
variable. That is, subjects are asked to rate a series of hazards according to the risk of dying
(e.g. Slovic et al. 1980). While the term “risk” has been fraught with much controversy in the
literature (see for example Fischhoff et al. 1984; Sjöberg 1996, 1998; Slovic and Weber
2002), we explicitly focus on the desire to reduce levels of risk. Second, our study relies on
revealed rather than expressed preferences. By help of an economic experiment we are able to
observe actual behavior rather than hypothetical statements. Third, previous work has mainly
focused on links (i) and (iii) of figure 1, the relationship between qualitative risk
characteristics and perceived mortality or (presumed) demand for risk reduction. E.g., the
lower a hazard’s ratings on controllability, the more people may want to see its current risk
reduced (Slovic et al. 1984). However, less attention has been devoted to investigating the
link between perceived mortality and demand for risk reduction (link (ii)). Fourth, current
research largely neglects any kind of (direct or indirect) mediation between qualitative risk
characteristics, perceived mortality, and demand for risk reduction. We believe this draws an
incomplete picture of the cognitive and emotional reality. Social closeness to victims may
bias perceived mortality in a systematic manner, and, at the same time, may also stimulate an
individual’s willingness to pay for precaution.
We design a novel experiment that allows us to test these interdependencies. Our subjects
estimate annual mortality rates and play a series of loss lotteries in which the odds are
matched to those of lethal events in real life. For each draw, subjects can buy loss insurances,
i.e., they can pay premiums in order to reduce the likelihood of total bankruptcy. Our results
show a complex interplay of annual mortality perception and demand for risk reduction. We
4
observe that qualitative characteristics of risks largely influence levels of perceived mortality
and that mortality estimates, in turn, significantly affect the willingness to pay for risk
reduction. More importantly, we find certain risk characteristics exerting a direct, unmediated
influence on the demand for risk reduction while others exert only an indirect impact
mediated by perceived mortality. On the aggregate level we find that 30 percent of all
insurance decisions are due to biased perceptions of annual mortality. Living in a world
without deadly risks, however, would lower insurance decisions by 45 percent on average.
We discuss possible implications for drafting counter-policies.
The remainder of this paper is organized as follows: section 2 summarizes previous research
on risk perception. Section 3 presents the experimental design, procedures and theoretical
predictions. The results are illustrated and discussed in section 4. The study ends with some
concluding remarks in section 5.
2. Perception of lethal risks
Lichtenstein et al. (1978) were among the first who systematically studied how people
evaluate lethal events.5 They ask subjects to judge the frequency of death from various causes.
Their subjects exhibit general competence in risk judgments. True frequencies and estimates
strongly correlate. However, the authors also identify two kinds of judgment biases: First, the
incidence of rare causes of death is considerably overestimated while the incidence of
common causes of death is underestimated. Second, statistically identical causes of death can
be perceived extremely different depending on previous anchoring. The authors argue that
such anchoring effects are due to unrepresentative media coverage and exposure levels, or to a
lethal event’s vividness. In a series of papers, Slovic et al. (1980; 1981; 1984) delve deeper
into the psychological foundations of risk perception. They hypothesize that a large part of the
variance in risk judgments can be explained by qualitative risk characteristics. The authors
ask subjects to evaluate hazardous activities and technologies regarding a set of risk
characteristics. Perceived risk seems to be quantifiable and predictable. I.e., laypeople’s
judgments of risks are affected by qualitative characteristics of these risks, such as dreadness,
knowledge, controllability and catastrophic potential (Slovic et al. 1982).
Slovic et al. (1985) analyze the relationship between risk characteristics, perceived risk, and
desired risk reduction. Their subjects are asked how much they want to see strict regulation
employed by regulative authorities in order to reduce present levels of risk. Their findings
5 For overviews on risk perception research see e.g. Slovic et al. (1984), Sjöberg (2000a), or Slovic and Weber
(2002).
5
reveal a huge impact of a risk’s dreadness. The higher a risk’s scores on this item, the higher
the perceived risk, and the higher the desire for risk reduction among subjects. Societal and
personal exposure also slightly correlates with perceived risk and desired risk reduction.
Sjöberg (1998) asks why people demand reductions in risk. In a series of large scale studies
he observes that levels of perceived risk strongly correlate with probabilities of harm or
injury. On the other hand, the demand for risk reduction is significantly driven by the severity
of consequences.
Gregory and Mendelsohn (1993) use more sophisticated econometric techniques to reassess
the data of Slovic et al. They regress nine risk characteristics upon the dependent variables
dread and perceived risk. Their analysis corroborates some of Slovic et al.’s findings.
Expected effects on future generations, immediacy, equity, and catastrophic potential affect
subjects’ perceptions of risk and dreadness. Moreover, they find that mortality rates correlate
with perceived risk ratings. Benjamin and Dougan (1997) raise some methodological
shortcomings in Lichtenstein et al. (1978)’s early work. They criticize that Lichtenstein et al.
compare individual risk estimates against population-wide death rates disregarding other
variables, in particular, the respondent’s age and implications of scarce information. They
reestimate the original data correcting for age cohorts and costly information and find strong
support in favor of unbiased perceptions of risk. Sjöberg (2000a) runs a series of analyses and
finds psychometric characteristics to account for some 20% of the variance in perceived risk.
Adding new categories for “unnatural” and “immoral risks” significantly improves the model
fit. Moreover, Dohmen et al. (2010) observe that an individual’s general attitude towards risk
is also a strong predictor of risk taking behavior in the real-world.
Andersson and Lundborg (2007) focus more closely on aspects of self-perception in own risk
assessments. They ask their respondents to judge own road-traffic and overall mortality risks
and compare these judgments with statistical data available for the respondents’ peers. The
authors observe a systematic self-perception bias with respect to the overall risk assessment.
Subjects generally tend to underestimate their own mortality risk. Similarly, Sjöberg (2000a)
reports substantial differences in risk judgments between personal and family risk from a
representative survey among the Swedish population.

6
Table 1: Summary of previous studies
study investigated correlation important driver(s) elicitation
method
Lichtenstein et al.
(1978)
perceived mortality ↔ qualitative
characteristics
objective mortality frequencies,
common vs. rare causes, media and
personal exposure, event’s vividness
expressed
Slovic et al. (1980;
1981; 1984)
perceived risk ↔ qualitative
characteristics
dreadness, knowledge, controllability,
catastrophic potential
expressed
Slovic et al.
(1985)
perceived risk ↔ qualitative
characteristics,
demand for risk reduction ↔ perceived
risk
dreadness, societal and personal
exposure
dreadness, certainty to be fatal,
perceived risk
expressed
Sjöberg (1998) perceived risk ↔ qualitative
characteristics,
demand for risk reduction ↔ perceived
risk
probabilities of harm or injury
severity of consequences
expressed
Gregory and
Mendelsohn
(1993)
perceived risk ↔ qualitative
characteristics,
dread risk ↔ qualitative characteristics
expected mortality, effects on future
generations, immediacy, catastrophic
potential, equity
effects on future generations,
immediacy, catastrophic potential,
equity
expressed
Benjamin and
Dougan (1997)
perceived mortality ↔ qualitative
characteristics
age, costly information expressed
Sjöberg (2000a) perceived risk ↔ qualitative
characteristics
unnatural, immoral, personal vs.
family
expressed
Dohmen et al.
(2010)
lottery decision ↔ individual
characteristics
general risk attitude revealed
Andersson and
Lundborg (2007)
perceived mortality ↔ individual
characteristics
own mortality expressed
Johnson et al.
(1993)
willingness to pay
for flight insurance ↔ qualitative
characteristics
event’s vividness expressed
Sunstein (1997) death equivalents ↔ qualitative
characteristics
dreadness, controllability,
voluntariness, distributional inequity
expressed
Chanel and
Chichilinsky
(2009)
lottery decision with heavy personal
consequences ↔ qualitative
characteristics
fear, catastrophic events expressed
Loewenstein et al.
(2001)
series of statements and decisions ↔
qualitative characteristics
mental imagination (stimulated by an
event’s vividness or personal
experience)
expressed /
revealed
Johnson et al. (1993) find strong evidence that a lethal event’s vividness matters for people’s
risk perceptions. They ask their respondents to state their (hypothetical) willingness to pay for
different kinds of flight insurance policies. They find a higher willingness to pay for
insurances covering “death due to any act of terrorism” than for insurances covering “death
due to any reason”, which is a superset including the first cause of death. Sunstein (1997)
summarizes similar evidence and claims that people evaluate death differently. Deaths that are
7
dreaded or uncontrollable and deaths that incur involuntarily or are distributed inequitably
seem to be worse than others.6 He argues that assessments of lethal risks “incorporate
different social judgments about different kinds of death” (Sunstein 1997: 276). If people are
willing to pay premiums to avoid bad deaths, authorities should devise additional resources to
regulating them. In a similar vein, Chanel and Chichilinsky (2009) study the influence of fear
on decision making under risk. They confront subjects with hypothetical scenarios in which
they are kidnapped and ask them to state indifference values on detention period and
probabilities. Their results suggest that fear affects laboratory decision making. Some subjects
excessively focus on catastrophic events. Loewenstein et al. (2001) argue that such
inconsistencies arise as a result of intuitive reactions to danger. Drawing on previous research,
they show that anticipatory emotions such as fear, anxiety, and dreadness immediately affect
behavior beyond the scope of presently known heuristics and biases. In contrast to analytical
modes of thinking, anticipatory emotions are less sensitive to the expected consequences or
outcomes but largely depend on mental imagination – stimulated by an event’s vividness or
personal experience.7
Table 1 summarizes the investigated correlations and most important previous findings. Our
approach fundamentally differs from these approaches: First, many earlier studies have
focused on the notion of “perceived risk” as dependent variable. That is, subjects are asked to
rate a series of hazards according to the present risk of dying (e.g. Slovic et al. 1980). As has
been criticized, people may perceive lethal risks differently simply because they hold different
notions of “risk” (see e.g. Fischhoff et al. 1984; Sjöberg 1996, 1998; Slovic and Weber 2002
for discussions). In this study, we investigate an individual’s demand for risk reduction and
therefore avoid heterogeneous perceptions to affect behavior. Second, in contrast to previous
studies our study relies on revealed rather than expressed preferences. We are able to observe
actual decision-making in the laboratory rather than hypothetical statements. Third, previous
research has mainly focused on correlations between qualitative risk characteristics and
perceived mortality or on the link between qualitative characteristics and (presumed) demand
for risk reduction. Less attention has been devoted to investigating the link between perceived
mortality and demand for risk reduction. In this study, we run a systematic investigation of all
three links. Fourth, current research largely neglects any kind of (direct or indirect) mediation
6 See also Chilton et al. (2006) for a more recent overview of studies related to dread risks. 7 A similar approach has already been used by Slovic et al. (1979). They ask subjects to describe their mental
images of the consequences following a nuclear accident. The idea that mental visualization affects actual beliefs
and behavior also plays a major role in social psychology (see e.g. Rosenblatt et al. 1989, or Pyszcynski et al.
2006).
8
between qualitative risk characteristics, perceived mortality, and the demand for risk
reduction. Our analysis incorporates a broad scan on various forms of interdependencies
allowing us to estimate the maximum effects of risk communication and governmental
precaution on insurance decisions.
3. Experimental design, predictions and procedures
Design
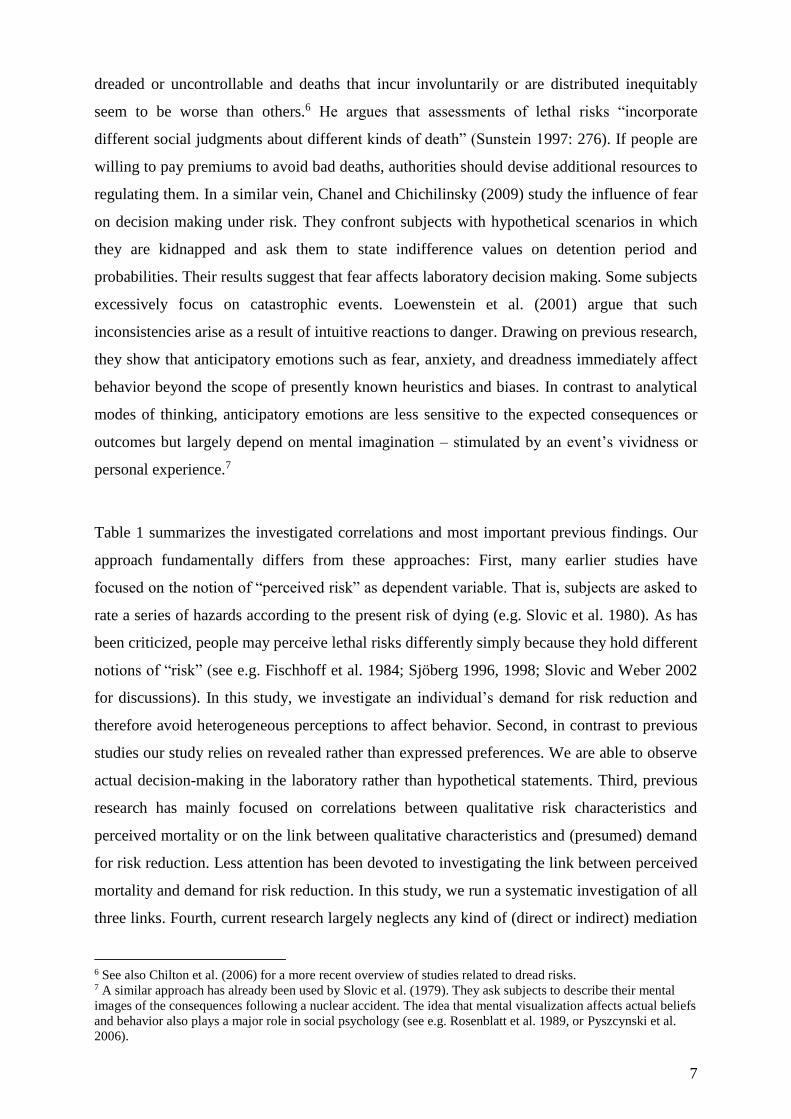
The experiment builds on four phases (see figure 2). At the beginning, subjects are endowed
with 20 EUR. Subjects pass through all phases in chronological order except for phases III
and IV whose order is randomized.
Figure 2: Sequence of play
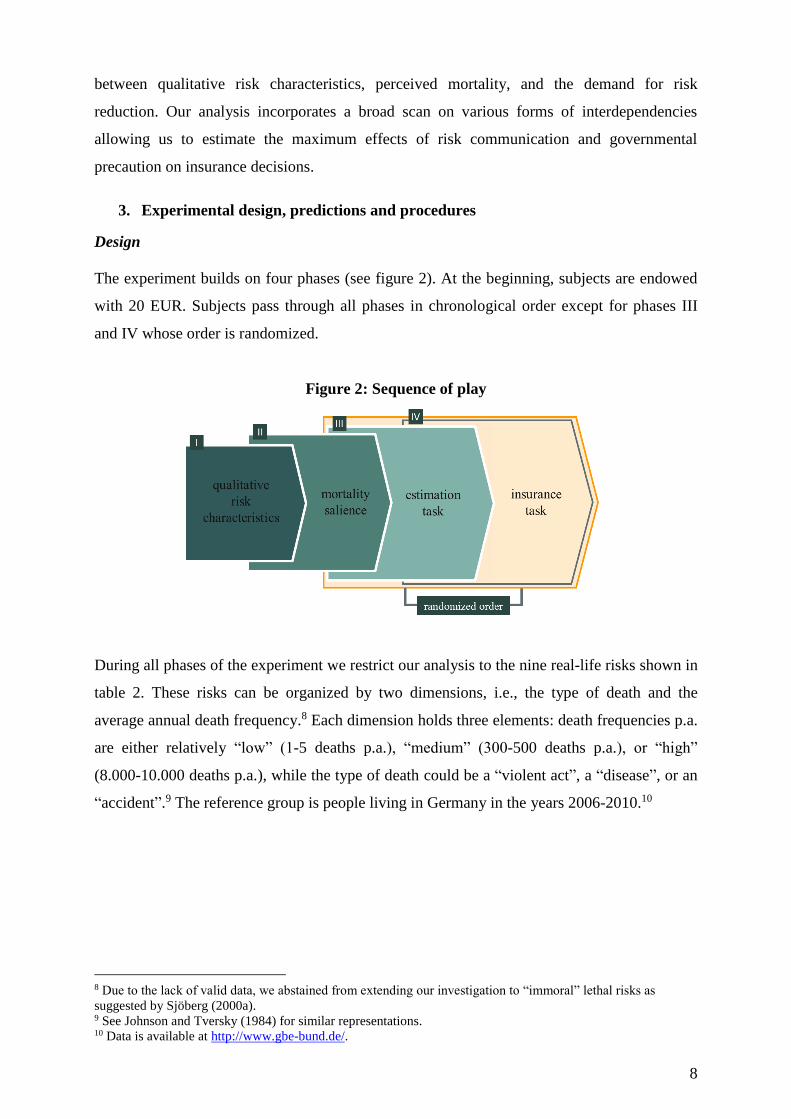
During all phases of the experiment we restrict our analysis to the nine real-life risks shown in
table 2. These risks can be organized by two dimensions, i.e., the type of death and the
average annual death frequency.8 Each dimension holds three elements: death frequencies p.a.
are either relatively “low” (1-5 deaths p.a.), “medium” (300-500 deaths p.a.), or “high”
(8.000-10.000 deaths p.a.), while the type of death could be a “violent act”, a “disease”, or an
“accident”.9 The reference group is people living in Germany in the years 2006-2010.10
8 Due to the lack of valid data, we abstained from extending our investigation to “immoral” lethal risks as
suggested by Sjöberg (2000a). 9 See Johnson and Tversky (1984) for similar representations. 10 Data is available at http://www.gbe-bund.de/.
9
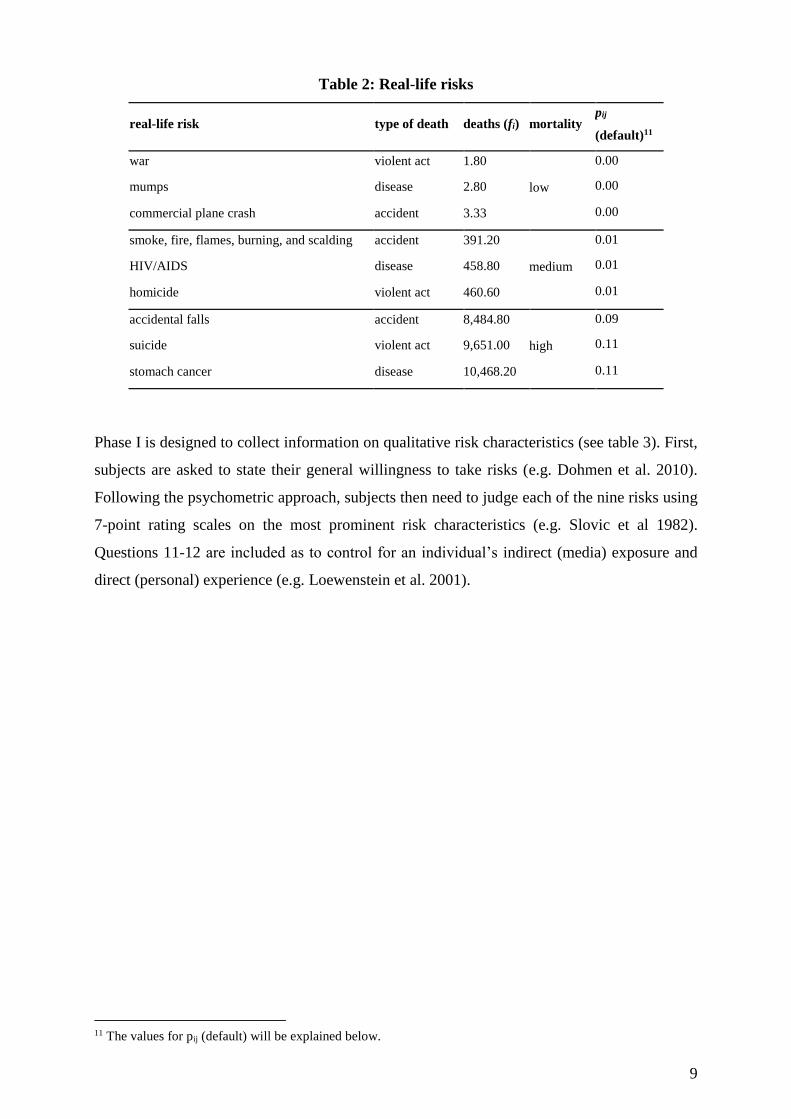
Table 2: Real-life risks
real-life risk type of death deaths (fi) mortality pij
(default)11
war violent act 1.80
low
0.00
mumps disease 2.80 0.00
commercial plane crash accident 3.33 0.00
smoke, fire, flames, burning, and scalding accident 391.20
medium
0.01
HIV/AIDS disease 458.80 0.01
homicide violent act 460.60 0.01
accidental falls accident 8,484.80
high
0.09
suicide violent act 9,651.00 0.11
stomach cancer disease 10,468.20 0.11
Phase I is designed to collect information on qualitative risk characteristics (see table 3). First,
subjects are asked to state their general willingness to take risks (e.g. Dohmen et al. 2010).
Following the psychometric approach, subjects then need to judge each of the nine risks using
7-point rating scales on the most prominent risk characteristics (e.g. Slovic et al 1982).
Questions 11-12 are included as to control for an individual’s indirect (media) exposure and
direct (personal) experience (e.g. Loewenstein et al. 2001).
11 The values for pij (default) will be explained below.

10
Table 3: Risk characteristics and coding12
1. general risk
Are you a person that is willing to take risks or do you try to avoid risks?
I am not willing to take risks at all 0 1 2 3 4 5 6 I am completely willing to take risks
2. newness
To what extent is this risk for the society old and familiar or new and novel?
new and novel 0 1 2 3 4 5 6 old and familiar
3. known by science
To what extent is this risk scientifically explored?
fully explored 0 1 2 3 4 5 6 fully unexplored
4. known by exposed
To what extent are people aware of the fact that they are exposed to this risk?
not aware 0 1 2 3 4 5 6 fully aware
5. immediacy
Do you die from the consequences of this risk immediately or is death likely to occur at some later time?
immediately 0 1 2 3 4 5 6 later
6. voluntariness
To what extent do people face this risk voluntarily or involuntarily?
involuntarily 0 1 2 3 4 5 6 voluntarily
7. control
To what extent can you control the probability of death if you are exposed to this risk?
not controllable 0 1 2 3 4 5 6 extremely controllable
8. fatal
When a person is exposed to this risk, how likely is it that this person will die?
highly likely 0 1 2 3 4 5 6 highly unlikely
9. dread
Is this a risk people have great dread for or have they learned to live with it?
great dread 0 1 2 3 4 5 6 no dread
10. catastrophic
Does this risk affect only one person at a time or many people at once?
many people 0 1 2 3 4 5 6 one person
11. indirect exposure (media coverage)
How often have you heard or read about this risk in the media (newspaper, radio, TV, internet)?
often 0 1 2 3 4 5 6 never
12. direct exposure (closeness)
Did you know someone who died by the consequences of this risk?
yes, very close relative or friend 0 1 2 3 4 5 6 no, no one that I know
As previous research on anticipatory emotions suggests, the mental imagination of an event is
an important driver of real-world decision making. For that reason, phase II confronts subjects
with own mortality. This phase is meant to activate real-world related fears which seem to be
less prevalent in normal laboratory environments. Following Rosenblatt et al. (1989), we use
two free-form questions and ask our subjects to
12 We also used reversed coded items to ensure subjects’ attention in this phase.

11
“jot down, what you think will happen to you as you physically die, and once you are
physically dead“ and to
“[…] briefly describe the emotions that the thought of your own death arouses in you”
before they can proceed to the next phase.
Phases III and IV compass the core elements of the experiment. They are designed to elicit
individual data on death estimates (phase III) and willingness to pay for risk reduction (phase
IV) for each of the nine risks. Behavior in these phases is negatively incentivized, that is
subjects can incur monetary losses.
In phase III, participants have to guess the average number of deaths in Germany during the
years 2006-2010 for each of the nine risks and, to account for effects of scarce information,
are asked how confident they are about the goodness of their guesses. To simplify the task
(and, as a result, to decrease noisiness in individuals’ estimates), subjects are provided with
three statistical anchors: first, they are informed about the average number of people living in
Germany during the years 2006-2010 (81,471,834). Second, they learn the average numbers
of death in these years (841,307). Third, subjects are provided with the average number of
people dying from breast cancer during these years (17,339). Total losses of subject j in this
phase are determined by the following function:
i iij
iij
phaseIIIjfe
feloss_total (1)
According to equation (1) subjects are punished for bad guesses. The stronger the death
estimate, eij, deviates from a risk’s annual death frequency, fi (see table 2), the higher the risk-
specific loss. Dividing the absolute difference by the absolute sum of estimates and actual
numbers normalizes the maximum loss per risk to 1 EUR. The maximum total loss in phase
III is therefore limited to 9 EUR.
In phase IV, we use graphical visualization and framing to explain the insurance task.
Subjects are instructed to imagine a virtual urn containing 81,471,834 marbles. Each marble
would represent an average resident living in Germany at the beginning of an average year.
Subjects are informed that there are two types of marbles: 80,630,527 marbles are white. They
would represent those people who are still alive at the end of an average year. The remaining
841,307 marbles are black and would represent those people who are expected to die during
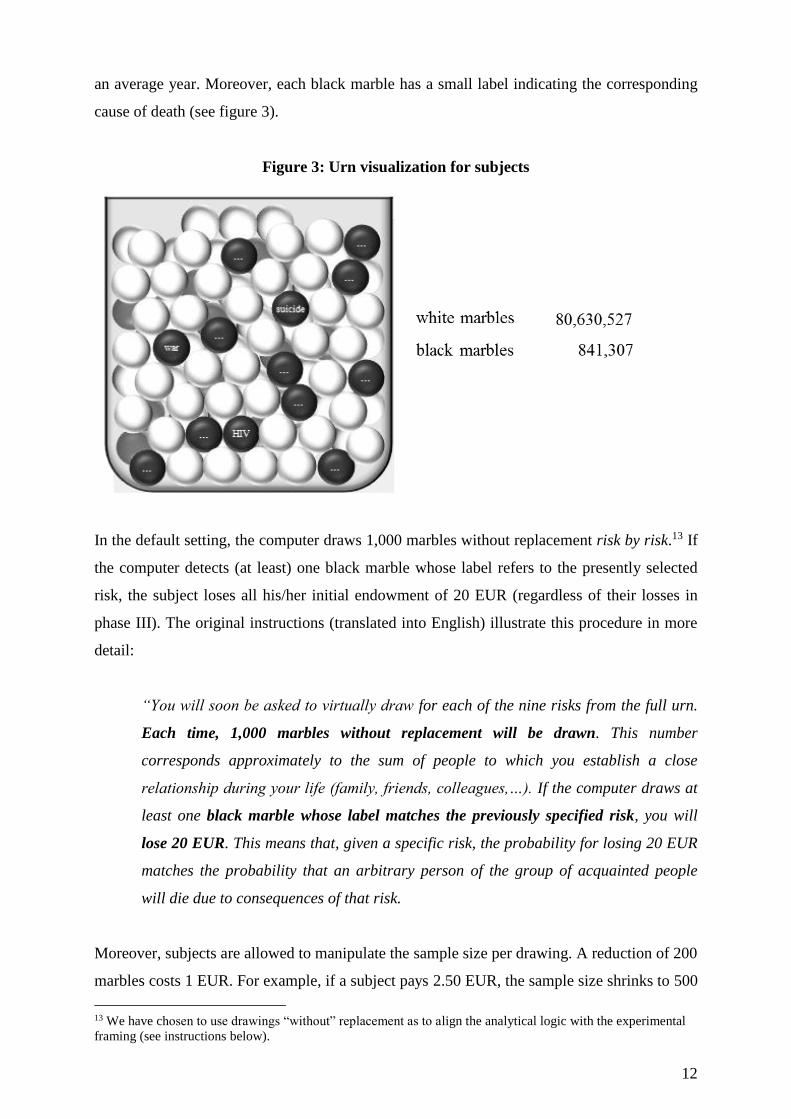
12
an average year. Moreover, each black marble has a small label indicating the corresponding
cause of death (see figure 3).
Figure 3: Urn visualization for subjects
In the default setting, the computer draws 1,000 marbles without replacement risk by risk.13 If
the computer detects (at least) one black marble whose label refers to the presently selected
risk, the subject loses all his/her initial endowment of 20 EUR (regardless of their losses in
phase III). The original instructions (translated into English) illustrate this procedure in more
detail:
“You will soon be asked to virtually draw for each of the nine risks from the full urn.
Each time, 1,000 marbles without replacement will be drawn. This number
corresponds approximately to the sum of people to which you establish a close
relationship during your life (family, friends, colleagues,…). If the computer draws at
least one black marble whose label matches the previously specified risk, you will
lose 20 EUR. This means that, given a specific risk, the probability for losing 20 EUR
matches the probability that an arbitrary person of the group of acquainted people
will die due to consequences of that risk.
Moreover, subjects are allowed to manipulate the sample size per drawing. A reduction of 200
marbles costs 1 EUR. For example, if a subject pays 2.50 EUR, the sample size shrinks to 500
13 We have chosen to use drawings “without” replacement as to align the analytical logic with the experimental
framing (see instructions below).
13
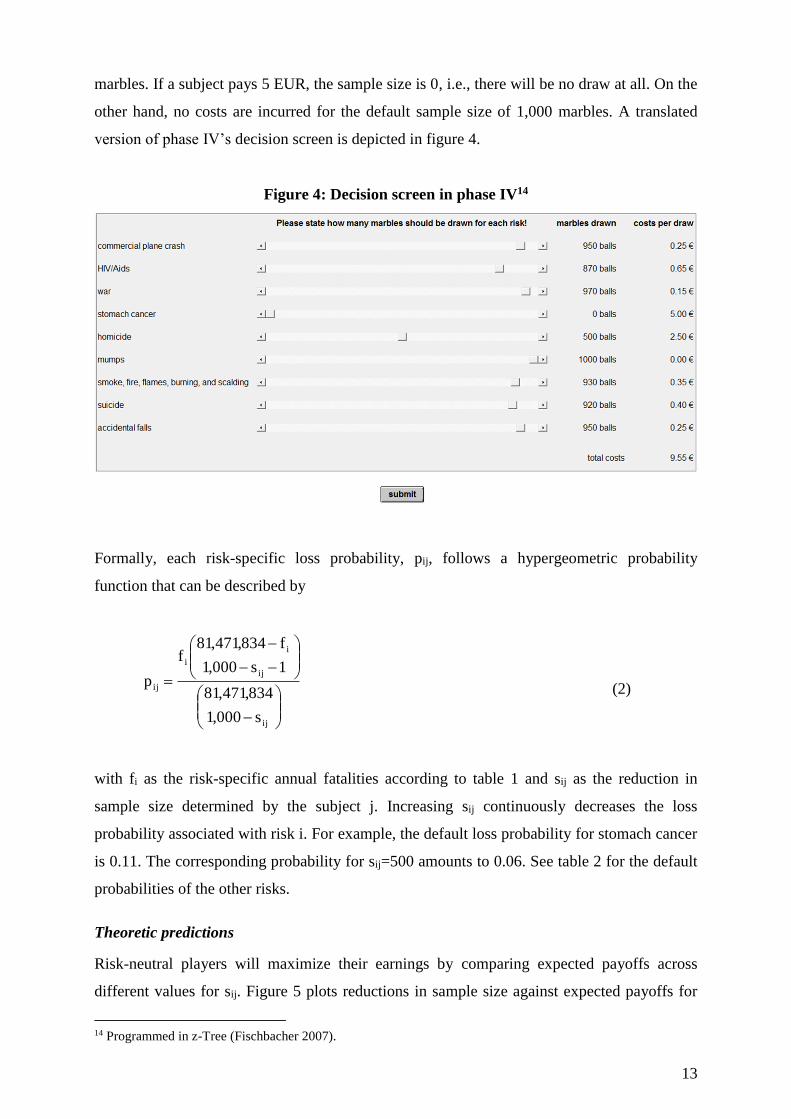
marbles. If a subject pays 5 EUR, the sample size is 0, i.e., there will be no draw at all. On the
other hand, no costs are incurred for the default sample size of 1,000 marbles. A translated
version of phase IV’s decision screen is depicted in figure 4.
Figure 4: Decision screen in phase IV14
Formally, each risk-specific loss probability, pij, follows a hypergeometric probability
function that can be described by
ij
ij
i
i
ij
s000,1
834,471,81
1s000,1
f834,471,81f
p (2)
with fi as the risk-specific annual fatalities according to table 1 and sij as the reduction in
sample size determined by the subject j. Increasing sij continuously decreases the loss
probability associated with risk i. For example, the default loss probability for stomach cancer
is 0.11. The corresponding probability for sij=500 amounts to 0.06. See table 2 for the default
probabilities of the other risks.
Theoretic predictions
Risk-neutral players will maximize their earnings by comparing expected payoffs across
different values for sij. Figure 5 plots reductions in sample size against expected payoffs for
14 Programmed in z-Tree (Fischbacher 2007).

14
all values of sij and all types of risk. As can be seen by the negative slopes, setting sij=0 is
always a strictly dominant strategy for all risks. Players maximize expected payoffs by
playing the default setting disregarding the possibility to reduce the sample size.

15
Figure 5: Expected payoffs for low, medium, and high mortality risks
j
j
j
16
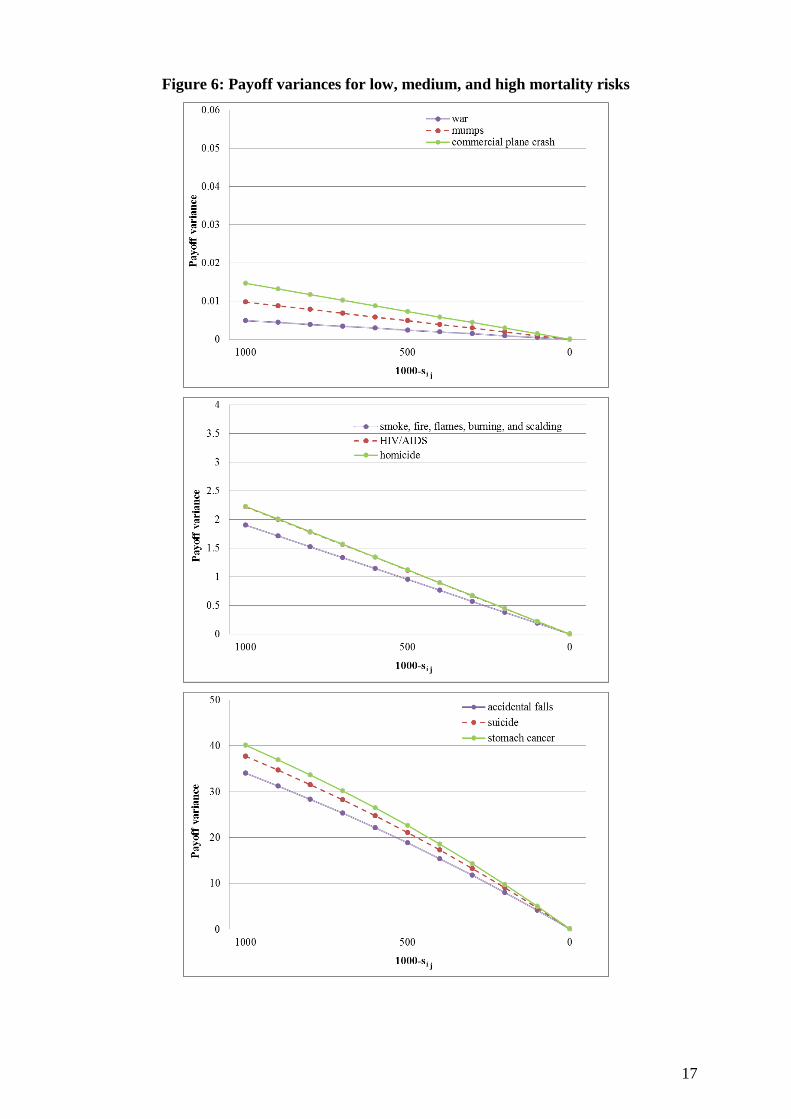
However, if players hold risk-averse preferences they may consider the variance in payoffs.
They could make their decision dependent on the extent to which payoffs can spread out
around the mean value. As can be seen in figure 6, manipulating the default sample size
substantially affects payoff variances. The higher the willingness to pay for reductions in the
sample size, the lower is the variance in payoffs. That means if subjects have preferences for
less risky payoffs, we should observe deviations from the default setting of zero insurance.
And, as indicated by the different slopes across low, medium, and high mortality risks, we
should find higher sij and thus lower sample sizes in the (presumably) highest mortality
categories.
17
Figure 6: Payoff variances for low, medium, and high mortality risks
j
j
j
18
Procedures
The entire experiment was programmed in the experimental software z-tree (Fischbacher
2007) and conducted at the Passau Experimental Laboratory (PAULA). At the beginning of
the experiment, subjects were endowed with 20 EUR. In addition, each subject received 2
EUR for showing up on time. Subjects were then informed that they could lose money during
the experiment. The accumulated losses in phases III and IV, however, could not exceed the
initial endowment of 20 EUR. Throughout the entire experiment, the nine risks were
presented in alphabetical order. As to prevent spill-over effects, the psychometric questions in
phase I were presented randomly. We also randomized the order in which phases III and IV
were played. At the very end of the experiment, standard socio-demographic information was
collected. Payoffs were disbursed by a student assistant who was blind to the purpose of the
study.
4. Results
Descriptive statistics
We ran five sessions with 93 subjects obtaining a total of 837 risk-specific observations. The
average student was 23 years old and studying in his/her third year. 38 percent (35 subjects)
were male. This proportion is in line with gender representation at advanced undergraduate
levels at the University of Passau. Each session lasted around 30 minutes. Average payoffs
were 7.56 EUR for that time with a minimum (maximum) of 2 (16.90) EUR. For comparison,
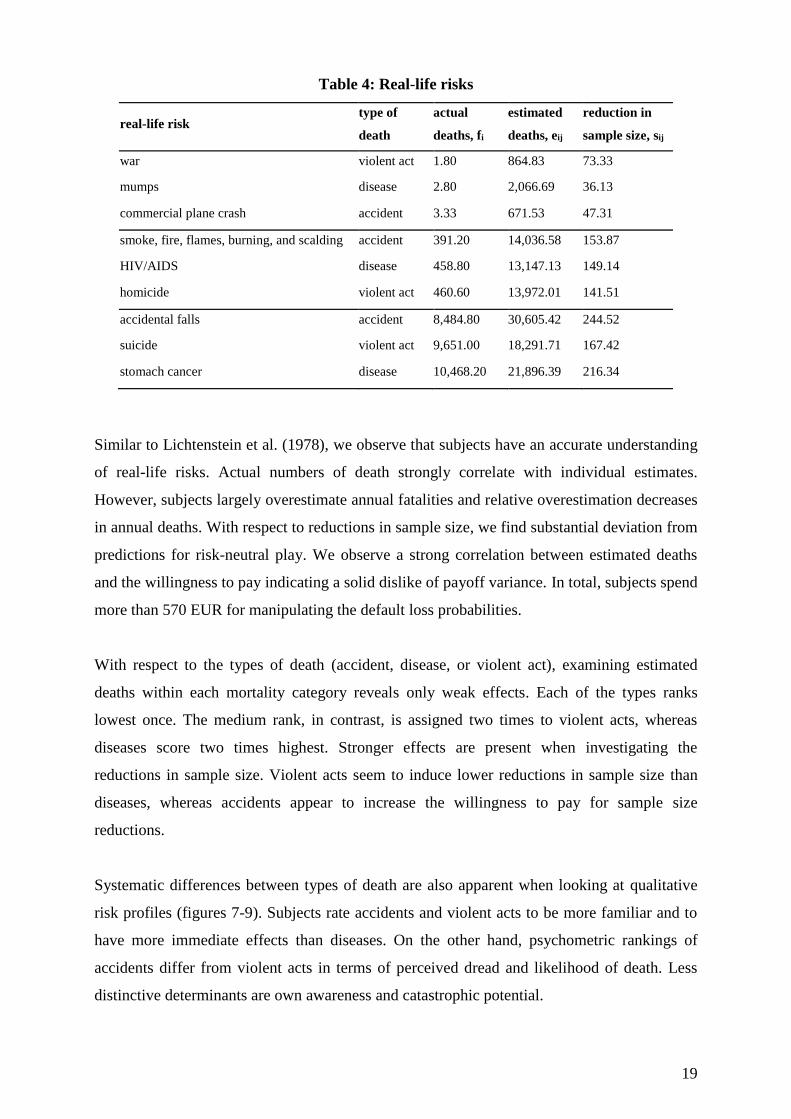
a student assistant at the University of Passau earns 7 EUR per hour. Table 4 reports risk-
specific summary statistics for phases III and IV. It depicts types of death, actual deaths p.a.,
fi, estimated deaths p.a., eij, and reductions in sample size, sij.
19
Table 4: Real-life risks
real-life risk type of
death
actual
deaths, fi
estimated
deaths, eij
reduction in
sample size, sij
war violent act 1.80 864.83 73.33
mumps disease 2.80 2,066.69 36.13
commercial plane crash accident 3.33 671.53 47.31
smoke, fire, flames, burning, and scalding accident 391.20 14,036.58 153.87
HIV/AIDS disease 458.80 13,147.13 149.14
homicide violent act 460.60 13,972.01 141.51
accidental falls accident 8,484.80 30,605.42 244.52
suicide violent act 9,651.00 18,291.71 167.42
stomach cancer disease 10,468.20 21,896.39 216.34
Similar to Lichtenstein et al. (1978), we observe that subjects have an accurate understanding
of real-life risks. Actual numbers of death strongly correlate with individual estimates.
However, subjects largely overestimate annual fatalities and relative overestimation decreases
in annual deaths. With respect to reductions in sample size, we find substantial deviation from
predictions for risk-neutral play. We observe a strong correlation between estimated deaths
and the willingness to pay indicating a solid dislike of payoff variance. In total, subjects spend
more than 570 EUR for manipulating the default loss probabilities.
With respect to the types of death (accident, disease, or violent act), examining estimated
deaths within each mortality category reveals only weak effects. Each of the types ranks
lowest once. The medium rank, in contrast, is assigned two times to violent acts, whereas
diseases score two times highest. Stronger effects are present when investigating the
reductions in sample size. Violent acts seem to induce lower reductions in sample size than
diseases, whereas accidents appear to increase the willingness to pay for sample size
reductions.
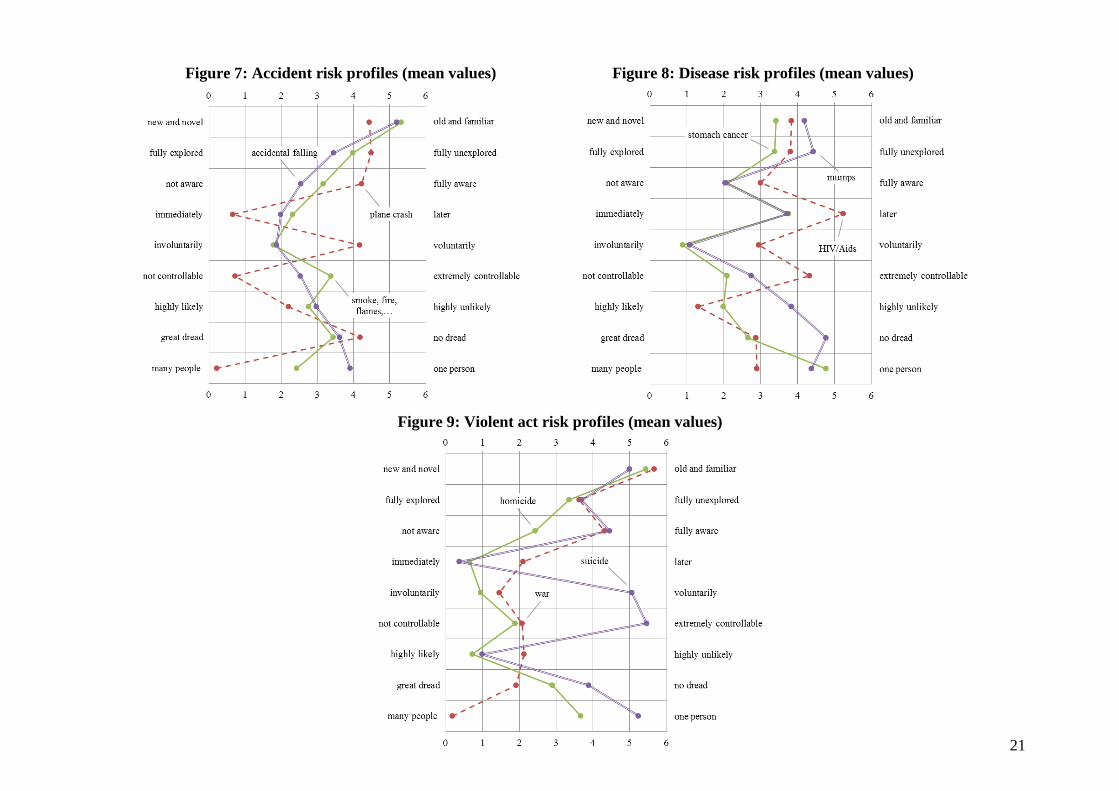
Systematic differences between types of death are also apparent when looking at qualitative
risk profiles (figures 7-9). Subjects rate accidents and violent acts to be more familiar and to
have more immediate effects than diseases. On the other hand, psychometric rankings of
accidents differ from violent acts in terms of perceived dread and likelihood of death. Less
distinctive determinants are own awareness and catastrophic potential.

20
The figures also reveal some variation within types of death. The perception of plane crashes
seems to be different from those of other accidents, such as accidental falling or burning. Also
HIV seems to slightly differ from perceptions of mumps and stomach cancer. In the category
of violent acts, suicide stands out to be different from homicide and war.
21
Figure 7: Accident risk profiles (mean values) Figure 8: Disease risk profiles (mean values)
Figure 9: Violent act risk profiles (mean values)
22
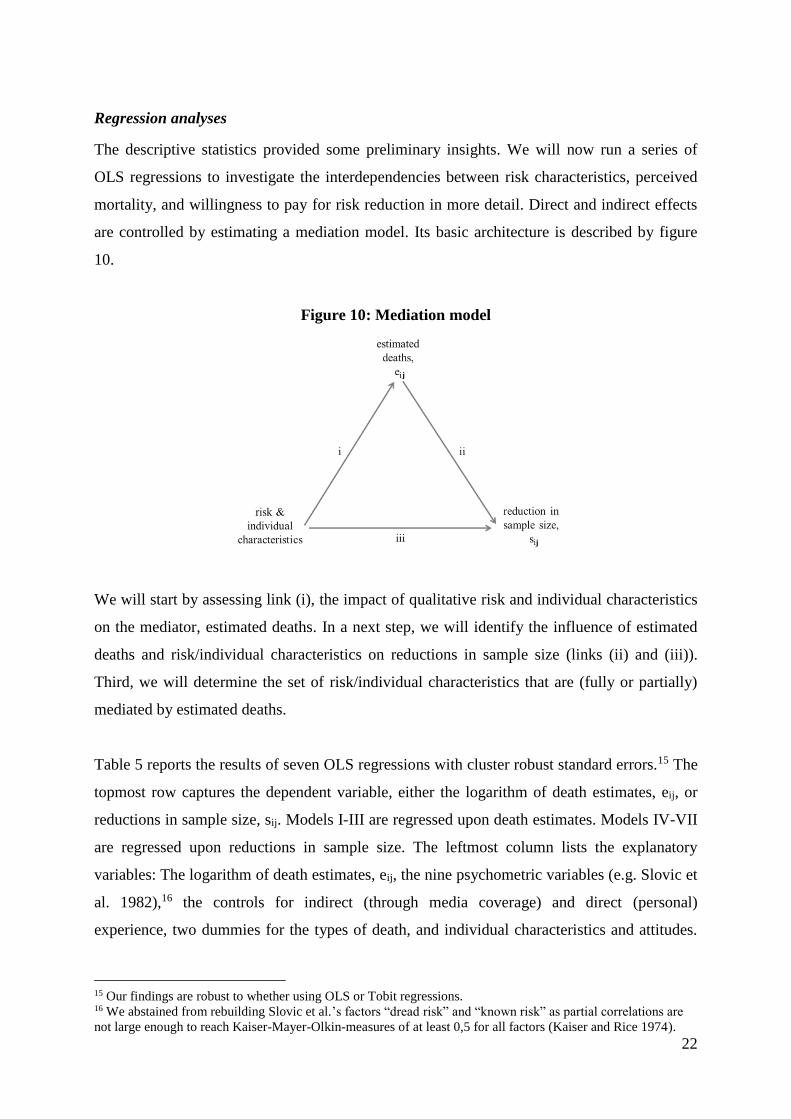
Regression analyses
The descriptive statistics provided some preliminary insights. We will now run a series of
OLS regressions to investigate the interdependencies between risk characteristics, perceived
mortality, and willingness to pay for risk reduction in more detail. Direct and indirect effects
are controlled by estimating a mediation model. Its basic architecture is described by figure
10.
Figure 10: Mediation model
We will start by assessing link (i), the impact of qualitative risk and individual characteristics
on the mediator, estimated deaths. In a next step, we will identify the influence of estimated
deaths and risk/individual characteristics on reductions in sample size (links (ii) and (iii)).
Third, we will determine the set of risk/individual characteristics that are (fully or partially)
mediated by estimated deaths.
Table 5 reports the results of seven OLS regressions with cluster robust standard errors.15 The
topmost row captures the dependent variable, either the logarithm of death estimates, eij, or
reductions in sample size, sij. Models I-III are regressed upon death estimates. Models IV-VII
are regressed upon reductions in sample size. The leftmost column lists the explanatory
variables: The logarithm of death estimates, eij, the nine psychometric variables (e.g. Slovic et
al. 1982),16 the controls for indirect (through media coverage) and direct (personal)
experience, two dummies for the types of death, and individual characteristics and attitudes.
15 Our findings are robust to whether using OLS or Tobit regressions. 16 We abstained from rebuilding Slovic et al.’s factors “dread risk” and “known risk” as partial correlations are
not large enough to reach Kaiser-Mayer-Olkin-measures of at least 0,5 for all factors (Kaiser and Rice 1974).
j
j
23
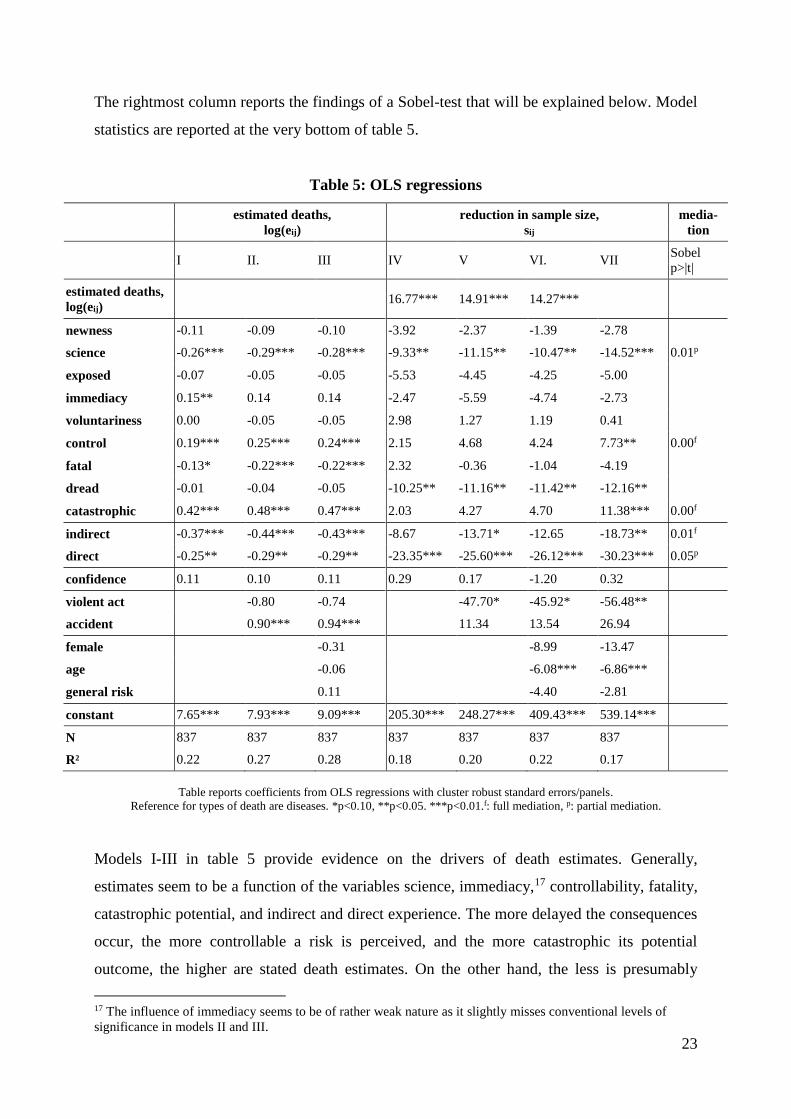
The rightmost column reports the findings of a Sobel-test that will be explained below. Model
statistics are reported at the very bottom of table 5.
Table 5: OLS regressions
estimated deaths,
log(eij)
reduction in sample size,
sij
media-
tion
I II. III IV V VI. VII
Sobel
p>|t|
estimated deaths,
log(eij) 16.77*** 14.91*** 14.27***
newness -0.11 -0.09 -0.10 -3.92 -2.37 -1.39 -2.78
science -0.26*** -0.29*** -0.28*** -9.33** -11.15** -10.47** -14.52*** 0.01p
exposed -0.07 -0.05 -0.05 -5.53 -4.45 -4.25 -5.00
immediacy 0.15** 0.14 0.14 -2.47 -5.59 -4.74 -2.73
voluntariness 0.00 -0.05 -0.05 2.98 1.27 1.19 0.41
control 0.19*** 0.25*** 0.24*** 2.15 4.68 4.24 7.73** 0.00f
fatal -0.13* -0.22*** -0.22*** 2.32 -0.36 -1.04 -4.19
dread -0.01 -0.04 -0.05 -10.25** -11.16** -11.42** -12.16**
catastrophic 0.42*** 0.48*** 0.47*** 2.03 4.27 4.70 11.38*** 0.00f
indirect -0.37*** -0.44*** -0.43*** -8.67 -13.71* -12.65 -18.73** 0.01f
direct -0.25** -0.29** -0.29** -23.35*** -25.60*** -26.12*** -30.23*** 0.05p
confidence 0.11 0.10 0.11 0.29 0.17 -1.20 0.32
violent act -0.80 -0.74 -47.70* -45.92* -56.48**
accident 0.90*** 0.94*** 11.34 13.54 26.94
female -0.31 -8.99 -13.47
age -0.06 -6.08*** -6.86***
general risk 0.11 -4.40 -2.81
constant 7.65*** 7.93*** 9.09*** 205.30*** 248.27*** 409.43*** 539.14***
N 837 837 837 837 837 837 837
R² 0.22 0.27 0.28 0.18 0.20 0.22 0.17
Table reports coefficients from OLS regressions with cluster robust standard errors/panels.
Reference for types of death are diseases. *p<0.10, **p<0.05. ***p<0.01.f: full mediation, p: partial mediation.
Models I-III in table 5 provide evidence on the drivers of death estimates. Generally,
estimates seem to be a function of the variables science, immediacy,17 controllability, fatality,
catastrophic potential, and indirect and direct experience. The more delayed the consequences
occur, the more controllable a risk is perceived, and the more catastrophic its potential
outcome, the higher are stated death estimates. On the other hand, the less is presumably
17 The influence of immediacy seems to be of rather weak nature as it slightly misses conventional levels of
significance in models II and III.
24
known about a risk, the less likely it is that a person will die from that risk, and the less
indirect or direct experience is at hand, the lower the estimated deaths p.a. Confirming the
weak preliminary evidence from the descriptive analysis, types of risk also seem to matter.
Accidents significantly increase the death estimates compared to diseases. This finding could
be the result of excessive risk communication. Subjects may have been repeatedly told that
laypeople underestimate the most deadly risks in daily life and have been educated in a way to
“correct” for this bias. Other drivers do not play a major role for estimations according to our
data. Confidence in the goodness of one’s own guess does not seem to affect death estimates.
Coefficients of socio-demographic characteristics and the general attitude toward taking risks
are insignificant. Also note that, in contrast to many previous findings, individual estimates
seem to be invariant to changes in perceived dread.
Models IV-VII investigate the relationship between psychometric and socio-demographic
drivers and the willingness to pay for risk reduction. Starting with models IV-VI, we observe
a couple of variables exerting a significant influence on the decision to reduce the default
sample size in phase IV of the experiment. First, as indicated by the significant constant
subjects generally deviate from theoretical predictions and often prefer dominated strategies
that are less risky. Second, we find that the coefficient for the logarithm of death estimates
significantly differs from zero. The higher an individual’s estimate of annual deaths, the
higher the willingness to avoid this particular risk. Thus, people do respond to perceived
changes in annual deaths (and we also know what drives their perception of annual deaths).
Third, if a risk is scientifically unexplored, subjects appear to be less willing to reduce the
sample size and, as explained earlier, report lower death estimates. These findings run counter
to intuition suggesting that people hold less strongly biased perceptions in the domain of
unknown risks. In turn, the more people believe to know about a risk, the more likely they are
to overestimate its lethal impact and the more likely they are to insure against losses induced
by that risk. Fourth, we are able to replicate earlier studies’ findings on perceived dreadness.
Dread substantially increases the willingness to pay for risk avoidance. As it does not affect
estimated deaths, our data reconfirms Loewenstein et al.’s (2001) argument that anticipatory
emotions drive behavior beyond the scope of perceived mortality. Fifth, we observe a
significant influence of direct exposure on reductions in sample size.18 The higher the social
distance to victims the lower a subject’s reductions in sample size. This extends the prominent
18 There is also some evidence supporting Lichtenstein et al.’s (1978) conjecture that indirect experience through
media coverage increases the willingness to pay for risk avoidance (model V).
25
view that high exposure levels induce unrepresentativeness biases (e.g. Lichtenstein et al.
1978). Our findings suggest that social closeness also activates the desire for strict regulation
beyond actual death frequencies. A similar phenomenon, known as “identifiable victim
effect”, has already been widely investigated in risk research (Jenni and Loewenstein 1997).
However, while the identifiable victim effect explains why people want to see strict regulation
employed for others, our data indicate that social closeness also increases the preference for
own precaution. Sixth, while the impacts of accidents and diseases do not significantly differ
from one another, we observe that violent acts decrease levels of risk avoidance compared to
diseases (see models V and VI). This finding is not easy to explain as intuitive characteristics
of violent acts such as fatality, dread and indirect/direct exposure are already controlled for.
One may argue that our student subjects falsely infer the likelihood of violent deaths from
their social environment. However, in this case we would also observe underestimation of
death statistics in models II and III. An alternative interpretation could be that subjects put
risk premiums on diseases. By reducing the sample size when being confronted with violent
acts subjects may then readjust their willingness to pay for risk reduction to its natural level.
Seventh, the willingness to reduce the sample size seems to be sensitive to a subject’s age.
Older subjects in our experiment spend significantly less money on risk avoidance than
younger subjects. One may argue that older subjects have learnt to focus more on analytical
reasoning than emotional responses. Evidence from Dohmen et al. (2010) contradicts this
conjecture. They find strong evidence in a large representative sample suggesting that age
negatively affects the willingness to take risks. Given that our sample compasses only 19
observations of subjects older than 25, we have to admit that our finding may be a mere
artifact of the student sampling. Other psychometric and socio-demographic variables seem to
be less important for risk avoidance.
We have assessed the links (i), (ii), and (iii) of figure 10 and will now turn to the question
whether death estimates fully or partially mediate the willingness to reduce the sample size in
the insurance task. Generally, mediation is prevalent if an independent variable exerts an
indirect influence on the dependent variable that is carried by a third variable, the mediator.
The indirect influence evolves from two direct effects: first, the independent variable must
significantly affect the mediator (link (i)). Second, the mediator must significantly affect the
dependent variable (link (ii)). Moreover, the independent variable is said to be partially
mediated if its direct effect on the dependent variable is significantly different from zero (link
(iii)). Otherwise, it is fully mediated by the third variable.
26
In order to determine likely candidates that could be mediated in our data, we first run another
regression upon reductions in sample size excluding the mediator (model VII, table 5).
Coefficients in model VII capture the total (direct plus indirect) effect of each independent
variable on reductions in sample size and allow us to narrow down the set of possible
variables being mediated: significant total effects can be found for nine independent variables.
These are science, controllability, dreadness, catastrophic potential, indirect/direct experience,
violent act, and age. However, according to model III the variables dreadness, violent act, and
age do not significantly affect the mediator and can therefore be excluded from further
analysis. For the remaining five variables we performed Sobel-tests to determine the
significance of the indirect effects. Results are reported in the rightmost column of table 5.
Table 5 provides evidence for three fully mediated variables. The more people can control the
probability of death due to a specific risk, the less people are affected by its consequences and
the more often people hear about this risk in the media, the higher are the death estimates
associated with it, and, in turn, the higher an individual’s willingness to pay for risk reduction.
We also find two more complex forms of interplay. The variables science and direct
experience appear to be partially mediated by death estimates. I.e., the more is known about a
risk and the lower the social distance to victims the higher is an individual’s death estimate
which also increases the willingness to pay for sample size reductions beyond the direct effect
exerted by these variables.
Risk communication versus governmental precaution
The findings of the regression analyses can contribute to the old debate over effective
measures of risk management (see e.g. Slovic et al. 1984; Sjöberg 2000b). On the general
level, the results suggest that authorities should devise resources to counter biased perceptions
if risks score high on variables indirectly affecting insurance behavior. In that case,
educational campaigns could de-bias perceptions and satisfy the public desire for safety
without reducing actual levels of risk. However, if risks have high scores on variables
exerting direct influence authorities should consider precautionary means to reduce current
levels of risk. People then want to see strict regulation regardless of actual fatalities and even
if this is costly to them.
Nonetheless, the question which technique is more effective in coping with public concerns
for safety does not only depend on direct and indirect effects but also on actual and estimated
27
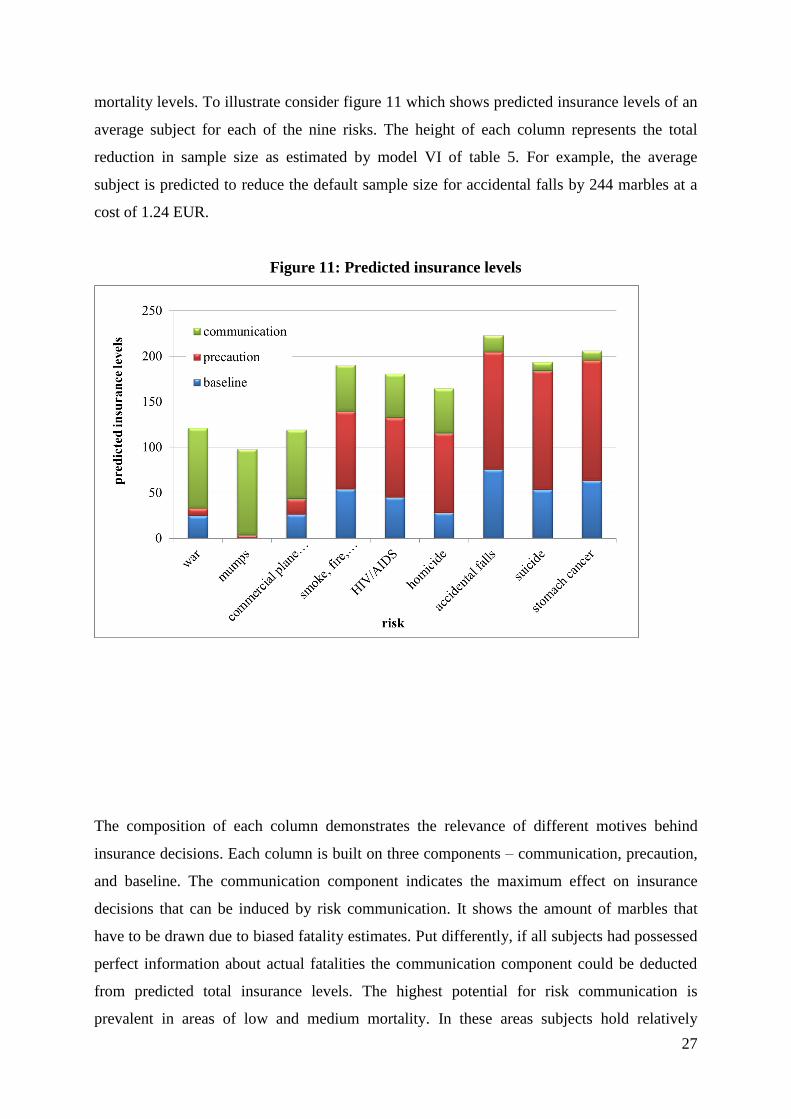
mortality levels. To illustrate consider figure 11 which shows predicted insurance levels of an
average subject for each of the nine risks. The height of each column represents the total
reduction in sample size as estimated by model VI of table 5. For example, the average
subject is predicted to reduce the default sample size for accidental falls by 244 marbles at a
cost of 1.24 EUR.
Figure 11: Predicted insurance levels
The composition of each column demonstrates the relevance of different motives behind
insurance decisions. Each column is built on three components – communication, precaution,
and baseline. The communication component indicates the maximum effect on insurance
decisions that can be induced by risk communication. It shows the amount of marbles that
have to be drawn due to biased fatality estimates. Put differently, if all subjects had possessed
perfect information about actual fatalities the communication component could be deducted
from predicted total insurance levels. The highest potential for risk communication is
prevalent in areas of low and medium mortality. In these areas subjects hold relatively
28
inaccurate perceptions of actual fatalities that strongly drive insurance behavior so that de-
biasing may prove to be a powerful tool for risk management. However, considering all nine
risks communication seems to have a less extreme impact on insurance decisions. Overall
levels could be decreased by around 30 percent if all subjects possessed accurate
understandings of annual fatalities.
The second component shows the effect on insurance decisions if precaution is nearly perfect,
i.e. if annual fatalities for each risk are reduced to a minimum of 1 dead person p.a. If all risks
had been negligible in reality the precaution component could be deducted from predicted
insurance levels. In contrast to communication, precautionary means are particularly relevant
in the domains of medium and high mortality. The higher actual fatalities p.a. the more
subjects want to see the current risks reduced. Moreover, considering the total effect
precaution seems to be a quite powerful tool for risk management. Across all nine risks
perfect precaution can reduce levels of insurance by around 45 percent.
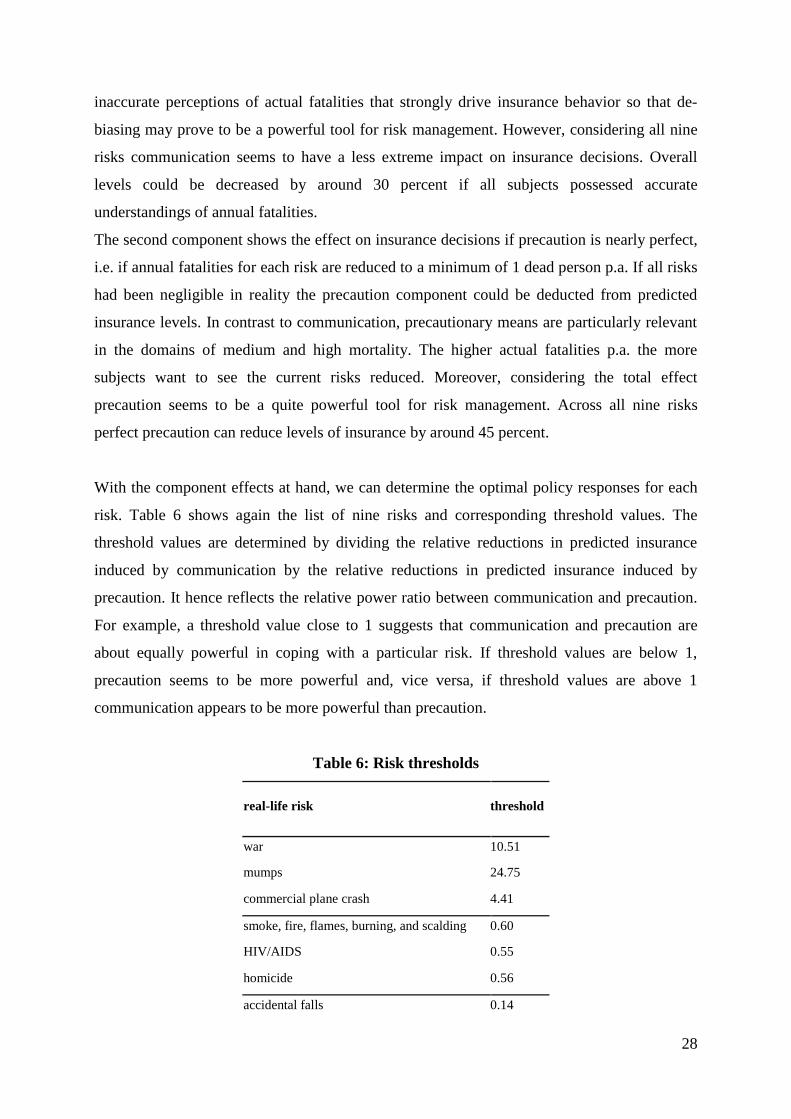
With the component effects at hand, we can determine the optimal policy responses for each
risk. Table 6 shows again the list of nine risks and corresponding threshold values. The
threshold values are determined by dividing the relative reductions in predicted insurance
induced by communication by the relative reductions in predicted insurance induced by
precaution. It hence reflects the relative power ratio between communication and precaution.
For example, a threshold value close to 1 suggests that communication and precaution are
about equally powerful in coping with a particular risk. If threshold values are below 1,
precaution seems to be more powerful and, vice versa, if threshold values are above 1
communication appears to be more powerful than precaution.
Table 6: Risk thresholds
real-life risk threshold
war 10.51
mumps 24.75
commercial plane crash 4.41
smoke, fire, flames, burning, and scalding 0.60
HIV/AIDS 0.55
homicide 0.56
accidental falls 0.14
29
suicide 0.07
stomach cancer 0.08
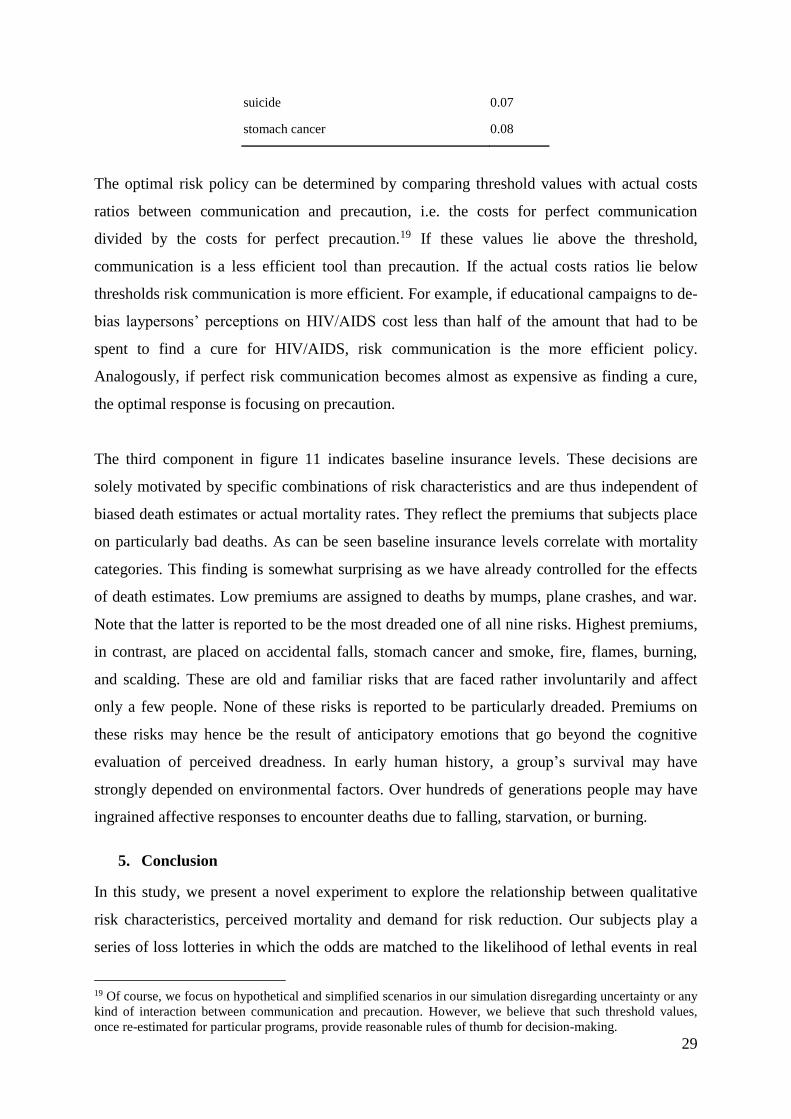
The optimal risk policy can be determined by comparing threshold values with actual costs
ratios between communication and precaution, i.e. the costs for perfect communication
divided by the costs for perfect precaution.19 If these values lie above the threshold,
communication is a less efficient tool than precaution. If the actual costs ratios lie below
thresholds risk communication is more efficient. For example, if educational campaigns to de-
bias laypersons’ perceptions on HIV/AIDS cost less than half of the amount that had to be
spent to find a cure for HIV/AIDS, risk communication is the more efficient policy.
Analogously, if perfect risk communication becomes almost as expensive as finding a cure,
the optimal response is focusing on precaution.
The third component in figure 11 indicates baseline insurance levels. These decisions are
solely motivated by specific combinations of risk characteristics and are thus independent of
biased death estimates or actual mortality rates. They reflect the premiums that subjects place
on particularly bad deaths. As can be seen baseline insurance levels correlate with mortality
categories. This finding is somewhat surprising as we have already controlled for the effects
of death estimates. Low premiums are assigned to deaths by mumps, plane crashes, and war.
Note that the latter is reported to be the most dreaded one of all nine risks. Highest premiums,
in contrast, are placed on accidental falls, stomach cancer and smoke, fire, flames, burning,
and scalding. These are old and familiar risks that are faced rather involuntarily and affect
only a few people. None of these risks is reported to be particularly dreaded. Premiums on
these risks may hence be the result of anticipatory emotions that go beyond the cognitive
evaluation of perceived dreadness. In early human history, a group’s survival may have
strongly depended on environmental factors. Over hundreds of generations people may have
ingrained affective responses to encounter deaths due to falling, starvation, or burning.
5. Conclusion
In this study, we present a novel experiment to explore the relationship between qualitative
risk characteristics, perceived mortality and demand for risk reduction. Our subjects play a
series of loss lotteries in which the odds are matched to the likelihood of lethal events in real
19 Of course, we focus on hypothetical and simplified scenarios in our simulation disregarding uncertainty or any
kind of interaction between communication and precaution. However, we believe that such threshold values,
once re-estimated for particular programs, provide reasonable rules of thumb for decision-making.
30
life. For each risk, subjects can pay premiums in order to reduce the likelihood of total
bankruptcy.
The results of the experiment confirm that subjects have quite accurate perceptions for some
lethal risks, while they exhibit inner reluctance to others. As a novelty, we are able to
differentiate between risk characteristics that directly manipulate subjects’ perceptions of
actual death frequencies and those that directly affect the willingness to pay for risk reduction.
We also find the impact of certain characteristics to be partially or fully mediated by
perceived mortality. On the aggregate level, we find that 30 percent of all insurance decisions
are the result of biased perceptions of annual mortality. Living in an (almost) peaceful world
without deadly risks, however, would lower insurance decisions by 45 percent.
Should authorities now invest in de-biasing public perceptions or spend money on precaution?
Our results suggest that indirect effects offer effective channels for risk communication while
direct effects call public authorities to employ strict regulation. In addition, communicational
measures should prove extremely useful in domains with low numbers of annual fatalities.
Once fatalities rise, the effect of risk communication becomes less dominant. In these areas,
precautionary measures are more powerful tools to satisfy the public desire for risk reduction.
31
References
Anderson, H., and P. Lundborg (2007). Perception of Own Death Risk. An Analysis of Road-
Traffic and Overall Mortality Risks. Journal of Risk and Uncertainty 34: 67-84.
Benjamin, D., and W. Dougan (1997). Individuals’ Estimates of the Risks of Death: Part I – A
Reassessment of the Previous Evidence. Journal of Risk and Uncertainty 15: 115-133.
Chanel, O., and G. Chichilnisky (2009). The Influence of Fear in Decisions: Experimental
Evidence. Journal of Risk and Uncertainty 39: 271-298.
Chilton, S., Jones-Lee, M., Kiraly, F., Metcalf, H., and W. Pang (2006). Dread Risk. Journal
of Risk and Uncertainty 33: 165-182.
Dohmen, T., Falk, A., Huffman, D., Sunde, U., Schupp, J., and G. Wagner (2010). Individual
Risk Attitudes: New Evidence from a Large, Representative, Experimentally-Validated
Survey. Journal of the European Economic Association 9 (3): 522-550.
Fischbacher, U. (2007). z-Tree: Zurich Toolbox for Ready-made Economic Experiments.
Experimental Economics 10(2): 171-178.
Fischhoff, B., Watson, S., and C. Hope (1984). Defining Risk. Policy Sciences 17: 123-139.
Gregory, R., and R. Mendelsohn (1993). Perceived Risk, Dread, and Benefits. Risk Analysis
13(3): 259-264.
Jenni, K., and G. Loewenstein (1997). Explaining the “Identifiable Victim Effect”. Journal of
Risk and Uncertainty 14: 235-257.
Johnson, E., Hershey, J., Meszaros, J., and H. Kunreuther (1993). Framing, Probability
Distortions, and Insurance Decisions. Journal of Risk and Uncertainty 7: 35-51.
Johnson, E., and A. Tversky (1984). Representations of Perceptions of Risk. Journal of
Experimental Psychology: General 113(1): 55-70.
Kaiser, H., and J. Rice (1974). Little Jiffy, Mark Iv. Educational and Psychological
Measurement 34(1): 111–117.
Lichtenstein, S., Slovic, P., Fischhoff, B., Layman, M., and B. Combs (1978). Judged
Frequency of Lethal Events. Journal of Experimental Psychology: Human Learning and
Memory 4(6): 551-578.
Loewenstein, G., Weber, E., Hsee, C., and N. Welch (2001). Risk as Feelings. Psychological
Bulletin 127(2): 267-286.
32
Pyszczynski, T., Abdollahi, A., Solomon, S., Greenberg, J., Cohen, F., and D. Weise (2006).
Mortality Salience, Martyrdom, and Military Might: The Great Satan Versus the Axis of
Evil. Personality and Social Psychology Bulletin 32: 525-537.
Rosenblatt, A., Greenberg, J., Solomon, S., Pyszczynski, T., and D. Lyon (1989). Evidence
for Terror Management Theory I. The Effects of Mortality Salience on Reactions to Those
Who Violate or Uphold Cultural Values. Journal of Personality and Social Psychology
57(4): 681-690.
Slovic, P., Lichtenstein, S. and B. Fischhoff (1979). Images of Disaster: Perception and
Acceptance of Risks from Nuclear Power. In G. Goodman and W. D. Row (eds.). Energy
Risk Management. London: Academic Press: 223-245.
Slovic, P. Fischoff, B., and S. Lichtenstein (1980). Facts and Fears: Understanding Perceived
Risk. In R. Schwing and W. Albers, Jr. (eds). Societal Risk Assessment: How Safe is Safe
Enough? New York: Plenum: 181-214.
Slovic, P., Fischhoff, B., Lichtenstein, S. and F. Roe (1981). Perceived Risk: Psychological
Factors and Social Implication. Proceedings of the Royal Society of London A376: 17-34.
Slovic, P., Fischhoff, B., and S. Lichtenstein (1984). Behavioral Decision Theory Perspectives
on Risk and Safety. Acta Psychologica 56: 183-203.
Slovic, P., Fischhoff, B., and S. Lichtenstein (1982). Why Study Risk Perception? Risk
Analysis 2(2): 83-93.
Slovic, P., Fischhoff, B., and S. Lichtenstein (1985). Characterizing perceived risk. In R.
Kates, C. Hohenemser and J. Kasperson (eds.). Perilous Progress: Managing the Hazards of
Technology. Boulder, Colorado: Westview Press: 91-125.
Slovic, P. (1987). Perception of Risk. Science 236(4799): 280-285.
Slovic, P., and E. Weber (2002). Perception of Risk Posed by Extreme Events. In Risk
Management Strategies in an Uncertain World. Columbia/Wharton Roundtable, Palisades,
New York.
Sjöberg. L. (1996). A Discussion of the Limitations of the Psychometric and Cultural Theory
Approaches to Risk Perception. Radiation Protection Dosimetry 68(3/4): 219-225.
Sjöberg (1998). Why Do People Demand Risk Reduction? In S. Lydersen, G. Hansen, and H.
Sandtorv (eds.). ESREL-98: Safety and Reliability. Trondheim: A. A. Balkema: 751-758.
Sjöberg, L. (2000a). Factors in Risk Perception. Risk Analysis 20(1): 1-11.

33
Sjöberg, L. (2000b). The Methodology of Risk Perception Research. Quality & Quantity 34:
407-418.
Sunstein, C. (1997). Bad Deaths. Journal of Risk and Uncertainty 14: 259-282.
Tversky, A., and D. Kahneman (1974). Judgment under Uncertainty. Heuristics and Biases.
Science 185(4157): 1124-1131.