Determinants of the degree of the presence of related ...
41
1 Determinants of the degree of the presence of related directors on the board of a bank Thu Ha Tran Université de Limoges, LAPE, 5 rue Félix Eboué, 87031 Limoges Cedex, France February, 2018 Abstract We investigate the determinants of the presence of directors who are related to either controlling shareholders or minority shareholders on the bank’s board of directors. Working on a sample of 96 banks with concentrated ownership structure across 17 countries in Europe, we find that the relative voting power of the ultimate owner, the excess control rights of the ultimate owner and the degree of economic freedom in a country increase the proportion of directors who are related to controlling shareholders on the board. On the other hand, we find that the relative voting power of the ultimate owner impacts negatively on the presence of minority directors meanwhile the relative control rights of other controlling shareholder vis-à-vis the largest ultimate owner, the quality of corporate governance and the level of shareholder protection increase the presence of minority director on the bank’s board of directors. We also find that the power of banking supervisory agency of a country has a negative relationship with the presence of minority directors on the bank’s board of directors. This indicates that minority shareholders count on the banking supervisory agency to oversee banks’ performance and thus, in countries having high levels of supervisory power, minority shareholders are less motivated to participating in supervising banks’ controlling parties.
Transcript of Determinants of the degree of the presence of related ...
1
Determinants of the degree of the presence of related
directors on the board of a bank
Thu Ha Tran
Université de Limoges, LAPE, 5 rue Félix Eboué, 87031 Limoges Cedex, France
February, 2018
Abstract
We investigate the determinants of the presence of directors who are related to either controlling
shareholders or minority shareholders on the bank’s board of directors. Working on a sample of
96 banks with concentrated ownership structure across 17 countries in Europe, we find that the
relative voting power of the ultimate owner, the excess control rights of the ultimate owner and
the degree of economic freedom in a country increase the proportion of directors who are related
to controlling shareholders on the board. On the other hand, we find that the relative voting power
of the ultimate owner impacts negatively on the presence of minority directors meanwhile the
relative control rights of other controlling shareholder vis-à-vis the largest ultimate owner, the
quality of corporate governance and the level of shareholder protection increase the presence of
minority director on the bank’s board of directors. We also find that the power of banking
supervisory agency of a country has a negative relationship with the presence of minority directors
on the bank’s board of directors. This indicates that minority shareholders count on the banking
supervisory agency to oversee banks’ performance and thus, in countries having high levels of
supervisory power, minority shareholders are less motivated to participating in supervising banks’
controlling parties.
2
1. Introduction
After the financial crisis 2007-2008, considering the failures and weaknesses in corporate
governance mechanisms in financial firms as a major cause of the crisis (Kirkpatrick, 2009),
the Basel Committee on Banking Supervision emphasized on the crucial role of the board of
directors to reform corporate governance of banking system (Basel Committee on Banking
Supervision, 2015). Correspondingly, many countries including the US, the European countries,
etc. have adopted the Code of Best Practices on Corporate Governance in which increasing the
presence of independent directors on the board is considered as a “good governance” mechanism
to curtail the agency conflicts between insiders and minority shareholders and thus, strengthening
bank performance.
Therefore, increasing the number of independent directors on the board is regarded as an approach
to enhance the effectiveness of the bank’s board of directors. However, there are two important
aspects of this approach which have not been examined thoroughly by previous studies.
First, the independence of independent directors from the company, controlling shareholders and
other stakeholders is ambiguous. Crespí-Cladera and Pascual-Fuster (2014) investigate the
characteristics of firms that declare board directors as independents, although the directors are not
strictly independent, and what are the consequences in terms of firm performance. Using data of
the Spanish listed firms, they find weak evidence of a negative relation between misclassification
and a firm’s future operating performance. Some other researchers even looked deeper into the
relationship between directors and controlling shareholders to find the impact of the presence of
independent directors on firm performance. Dahya et al (2008) find a positive relation between the
presence of independent directors who are strictly independent from ultimate controlling
shareholders and corporate value of nonfinancial firms. Using data of companies listed on the
Hong Kong stock exchange, Cheung et al. (2013) show lower market valuations of firms having
directors related to controlling shareholders on the board. Moreover, Barry et al. (2018) developed
the concept of “minority directors” who seat on the board of directors but are related to minority
shareholders. Their findings show that the increase in the presence/importance of directors who
are related to controlling shareholders on the bank’s board reduces bank performance and increases
bank risk taking. On the contrary, the increase in the presence of directors who are related to
minority shareholders helps banks with concentrated ownership to reduce bank risk taking and

3
increase bank performance. Overall, the results of previous studies indicate that in many cases,
independent directors may be not strictly independent from controlling shareholders or minority
shareholders of firms, and their impact on firm performance is not clear. However, the presence of
directors who are related to either controlling shareholders or minority shareholders is an important
factor affecting the effectiveness of the board of directors.
Second, the role which ownership structure plays in determining the effectiveness of the board of
directors is significantly important. In fact, because there always exist the conflicts of interest
between insiders and minority shareholders, all parties have desire to appoint their representatives
on the board in order to protect their own benefits. However, in theory, the agency conflicts are
different between firms having dispersed ownership structures and firms having concentrated
ownership structures. In dispersed ownership firms, the agency conflict is between managers and
minority shareholders as managers have incentives to maximize their own benefits at the cost of
shareholders, while dispersed shareholders might not have incentives to monitor managers
(Shleifer and Vishny, 1997). In contrast, in concentrated ownership firms, the agency conflict is
between controlling and minority shareholders. The controlling shareholders have incentives and
ability to monitor managers to increase the benefits of all shareholders (Jensen and Meckling,
1976; Shleifer and Vishny, 1986). However, the controlling shareholders also have ability to
extract private benefits of control through perks or transfer of assets on no-market terms to related
parties (Grossmand and Hart, 1988; Bebchuk, 1999; Shleifer and Wolfenzon, 2002). Therefore,
the different ownership structures lead to different types of agency conflicts and thus, it impacts
the motivations as well as the ability of each party to appoint representatives on the board that will
defend their interest.
Taking into account the fact that the independence of independent directors is not strictly accurate,
we focus on the presence of directors who are related to either controlling shareholders or minority
shareholders as a factor affecting the effectiveness of the bank’s board of directors. Moreover, we
concentrate on banks having at least one controlling shareholder (who holds 10% or more of banks’
total outstanding shares) for two following reasons. First, most of the previous studies focused on
the US listed firms which having dispersed ownership structures, whereas the agency conflicts in
firms having concentrated ownership structures are not examined accurately. Second, most of the
European banks have highly concentrated ownership. Identifying the determinants of the presence
4
of related directors in concentrated ownership banks would help the European financial policy-
makers to impose appropriate policies in order to create an effective structure of the board which
increases bank performance without increasing bank risk taking. Therefore, the main objective of
this paper is to find down what are the determinants of the presence of related directors on the
board of a bank having concentrated ownership structure.
From the results of previous papers, we consider bank financial characteristics and ownership
structure are potential determinants of the presence of related directors on the board. In addition,
according to De Haan and Vlahu (2016), the regulation environment might be either the
complementary mechanism or the substitute mechanism for the internal governance mechanisms.
It means that institutional characteristics such as the laws on corporate governance, the level of
shareholder protection, the strength of supervisory power, individualism, and the level of economic
freedom would impact the presence of related directors on the board of a bank. Therefore, in this
study, we examine the impacts of three groups of potential determinants including bank financial
characteristics, bank ownership structure, and institutional environment on the presence of related
directors on the bank’s board of directors.
Furthermore, regarding ownership structure as a potential dominant determinant, we examine
whether the impact of ownership structure on the presence of related directors is adjusted by
different institutional environment. In other words, we investigate whether the number of directors
who are related to either controlling shareholders or minority shareholders is dependent on the
interaction between bank ownership structure and the institutional environment where a bank is
located. This result would be important for policy-makers to improve the accurateness of corporate
governance guidelines based on the unique characteristics of each individual country.
Working on the data of 96 European listed banks which have at least one controlling shareholder,
we find that ownership structure is dominant determinant of the presence of related directors on
the bank’s board of directors. The results show that the relative voting power and the excess control
rights of the largest ultimate owner impact positively on the presence of directors related to
controlling shareholders meanwhile the relative power of other controlling shareholders vis-à-vis
the largest ultimate owner will help to enhance the presence of minority directors.
Regarding the institutional characteristics, we find that the level of economic freedom of a country
impacts positively on the presence of directors related to controlling shareholders while the quality
5
of corporate governance and shareholder protection affect positively and significantly on the
presence of minority directors. We also find that the power of banking supervisory agency of a
country has a negative relationship with the presence of minority directors on the bank’s board of
directors. This indicates that minority shareholders count on the banking supervisory agency to
oversee banks’ performance and thus, in countries having high levels of supervisory power,
minority shareholders are less motivated to participating in supervising banks’ controlling parties.
Our paper is organized as follows. Section 2 presents the data, variables, and also methodology
used in this study. Section 3 reports the results of the paper. Section 4 presents the further
investigation and robustness tests of our results. We conclude in the last section.
2. Data and methodology
2.1 Sample and data sources
Using data of all active listed banks provided by BvD Bankscope database, our raw sample consists
of 145 banks including bank holding companies, commercial banks and investment banks from 17
European countries (Austria, Belgium, Denmark, Finland, France, Germany, Greece, Ireland,
Italy, Luxembourg, Netherland, Norway, Portugal, Spain, Sweden, Switzerland, and the United
Kingdom).
The data of the board of directors and ownership structure are collected manually from bank
corporate governance reports, bank annual reports as well as extracting from Bloomberg and
Amadeus database. There are 118 banks having sufficient information about ownership structures
and board of directors. We only keep banks which have at least one shareholder holding 10% or
more of total outstanding shares. Our final sample consists of 96 banks. On average, our final
sample covers more than 71% of total assets of all publicly traded banks provided by BvD
Bankscope. The number of banks by country is shown in table 1.
In this study, we also utilize market data from Bloomberg database and macroeconomic data from
the World Bank to calculate necessary indices. In addition, the financial data is winsorized at the
1% and 99% levels.
[Insert Table 1 here]
6
2.2. Definition of variables
2.2.1 Identifying related directors
Building of control chains
Following previous studies (La Porta et al., 1999, 2002; Caprio et al., 2007; Lepetit et al., 2015),
we use the threshold of ownership control at 10% to build control chains and to distinguish between
minority (shareholders hold less than 10% of the total outstanding shares) and controlling
shareholders (shareholders hold at least 10% of the total outstanding shares). For each bank, we
collect the list of shareholders and their voting rights in order to identify the direct controlling
shareholders. If a controlling shareholder is an individual, a family, a government or a widely held
company, we define him as the direct ultimate owner of the bank. If controlling shareholders are
controlled by other entities, we continue building the control chains to identify all indirect ultimate
owners. Therefore, we can find almost all direct/indirect ultimate owners for each banks. We
category the ultimate owners as Individual/Family, Public authority/State/Government, widely
held industrial firms, widely held banks, or widely held financial institutions.
To determine the control rights and cash flow rights of a direct/indirect shareholder in the control
chain, we follow the method of La Porta et al. (1999). According to this method, the direct control
rights or cash flow rights of a shareholder is defined as the percentage of shares owned directly by
this shareholder. The indirect control rights for each shareholder are defined as the percentage of
shares held by the shareholder at the first level in the control chain, which is controlled by the
ultimate owner through the intermediate entities in the chain of control. The indirect cash flow
rights are computed as the product of the percentages of shares held by the shareholders along the
indirect control chain linking the ultimate controlling owner to the bank. The aggregate control
rights/cash flow rights of a shareholder are the sum of their direct and indirect voting rights/cash
flow rights held in the bank.
Identifying related directors
After having identified direct minority shareholders, direct and indirect controlling shareholders,
we identify board members that are related to them. We use for that information on director’s
biography. We consider a director to be related to minority shareholder when: (1) he is an
employee of the minority shareholder of the bank; (2) he is one of the minority shareholder of the
bank; (3) he has the same family name as one of the minority shareholder of the bank; (4) he is

7
employee of a government agency if one of the minority shareholders of the bank is state. A
director is considered as related to a controlling shareholder if: (1) he is an employee of the
direct/indirect controlling shareholder of the bank; (2) he is one of controlling shareholder or he is
a shareholder in at least one of the firms controlled by the controlling shareholder in the control
chain of the bank; (3) he has the same family name as the direct/indirect controlling shareholder
of the bank; (4) he is employee of a government agency if one of controlling shareholders is state.
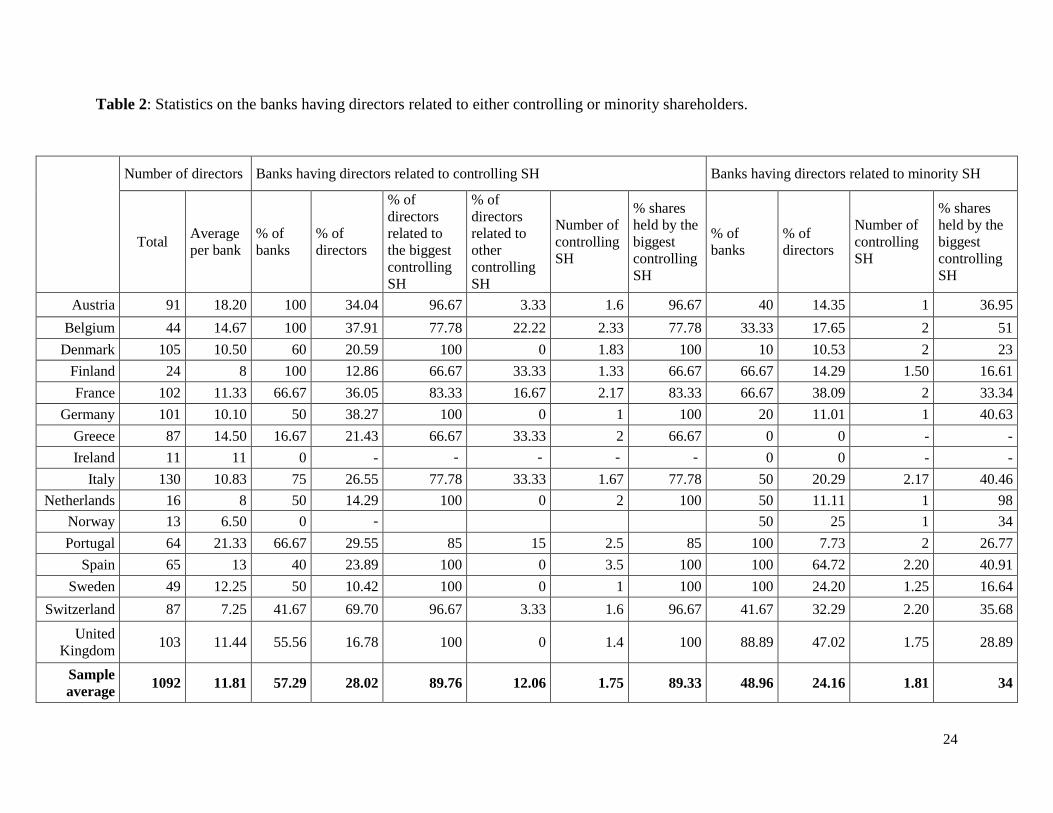
The percentage of directors related to minority shareholders (pct_Minority) or controlling
shareholders (pct_Controlling) is the number of directors related to minority/controlling
shareholders divided by the board size. In our sample, 57.29% of banks have directors related to
controlling shareholders on their board, and 48.96% of banks have minority directors on their
board. In banks having directors who are related to controlling shareholders, they represent 28.02%
of the board. Among them, 89.76% are on average related to the biggest ultimate owner of the
bank, and there is only 12.06% of directors related to other controlling shareholders. Minority
directors, when present, represent on average 24.16% of the board. Our statistics indicate that in
banks having directors related to controlling shareholders, the biggest ultimate owner hold on
average 89.33% of the share, whereas in banks having directors related to minority shareholders,
the proportion of the biggest ultimate owner is around 34% of the share (see Table 2).
Table 3 further provides statistics on the four different criteria used to determine if a director is
related to a shareholder. We find that on average around 80 to 84% of directors identified as being
related to either minority or controlling shareholders are related through being employed by one
of them. Directors that are shareholders of the bank or in the control chain represent around 15-
16% of the cases of related directors, while the two other criteria of relatedness account for less
than 4% of all cases.
[Insert Tables 2, 3 here]
2.2.2 Ownership structure variables
In order to investigate the impact of ownership structure on the presence of related directors, we
use three ownership structure variables including: the relative voting power of the largest ultimate
owner, the excess control rights of the largest ultimate owner and the relative power of other
controlling shareholders vis-à-vis the largest ultimate owner.
Relative voting power of the largest ultimate owner

8
The real voting power of a controlling shareholder is affected by the possibility of coalition
between other controlling shareholders (i.e. the other controlling shareholders) (Attig, et al., 2008).
If the probability of coalition between other controlling shareholders in a bank is high, the real
voting power of the largest ultimate owner will be relatively decreased, thus the presence of
director related to the largest ultimate owner will also be limited.
We specify a proxy to measure the relative voting power of the largest ultimate owner by
estimating his “Banzhaf Power Index” (uo_BPI). This index takes into account voting rights of the
largest ultimate owner, and the probability of coalition between other controlling shareholders to
become decisive in a bank. We use the algorithms for voting power analysis provided by Dennis
Leech at the University of Warwick. This index varies from 0 to 1, the higher the index is, the
higher relative voting power has the largest ultimate owner.
Thus in this study, by taking into account the possibility of coalition between other controlling
shareholders, we suppose that the higher relative voting power of the largest ultimate owner is, the
higher the presence of directors related to controlling shareholders on the board is (i.e. a positive
relation between uo_BPI and pct_Controlling), but the lower the presence of directors related to
minority shareholders on the board is (i.e. a negative relation between uo_BPI and pct_Minoirty).
Excess control rights of the largest ultimate owner.
Previous studies (e.g. Claessens et al. (2002), Lin et al. (2011)) show that the possibility of
expropriation by controlling shareholders is higher in the pyramidal ownership structure in which
controlling shareholders have greater control rights than cash flow rights. In this kind of ownership
structure, while controlling shareholders having excess control rights can enhance their control,
the potential losses from their expropriation can largely shift to other shareholders having no/less
excess control rights. In banks having pyramidal structure, controlling shareholders might extract
private benefits by nominating directors related to them on the board.
We define excess control rights of the ultimate owner as the difference between aggregate control
rights and cash flow rights. We suppose that controlling shareholders having excess control rights
have incentives to increase the presence of directors related to them on the board, then a positive
relation between ExcessCR and pct_Controlling; and also a negative relation between ExcessCR
and pct_Minority.
9
The relative power of other controlling shareholders (other than the largest ultimate owner) vis-
à-vis the largest ultimate owner.
The presence of other controlling shareholders might increase the probability of a coalition among
them in order to become a decisive party, and thus it can reduce risk of expropriation by the largest
ultimate owner. We examine the governance role of the other controlling shareholders by their
relative power vis-à-vis the biggest ultimate owner that is computed by the ratio of control rights
of other controlling shareholders (i.e. control rights of controlling shareholders except the biggest
ultimate owner) to control rights of the biggest ultimate owner. In theory, the presence of other
controlling shareholders decreases the possibility that the largest ultimate owner nominate more
of their representatives on the board. Therefore, we expect a negative relation between the presence
of other controlling shareholders and the presence of directors who are related to controlling
shareholders. Correspondingly, we expect a positive relation between the presence of minority
directors and the presence of other controlling shareholders.
2.2.3 Institutional variables
To measure the country-level characteristics which can impact the presence of related directors on
the board, we use several indices including the Corporate Governance index (CG), the Shareholder
Protection index (RADI), the Supervisory Power index (SupPow), the Individualism index
(Individualism), and the index of Economic Freedom (EcoFreedom).
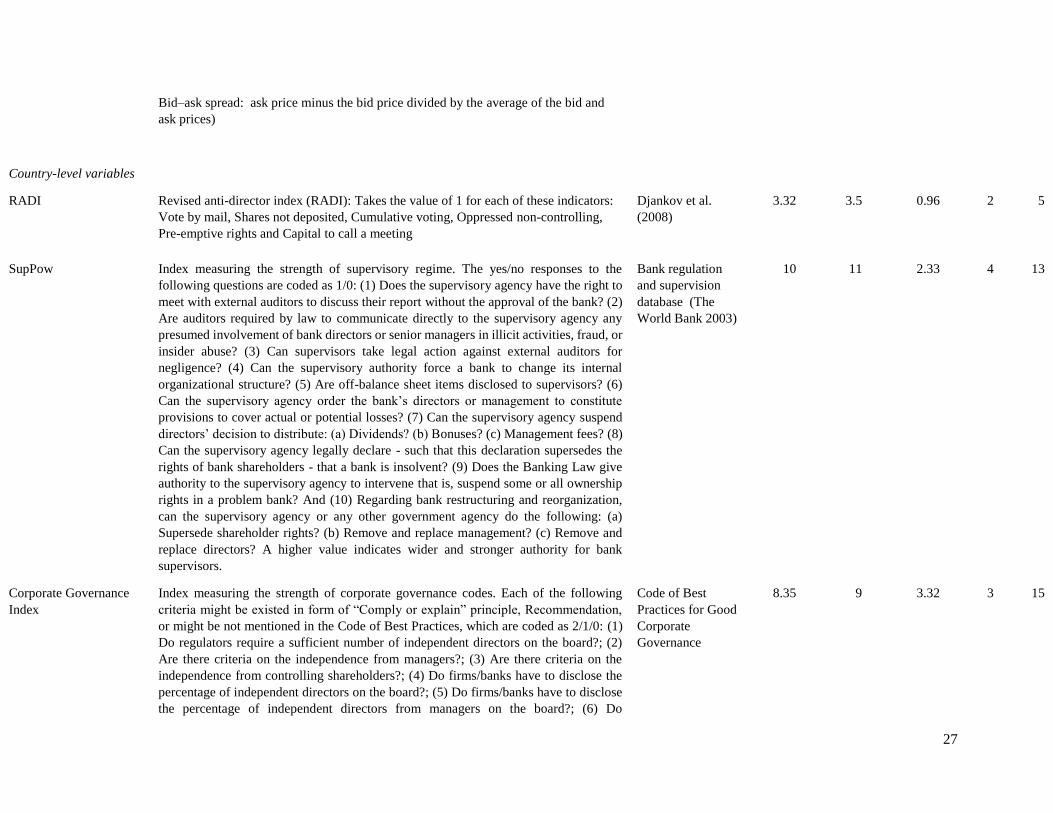
Corporate Governance index
Based on “Code of Best Practices for Corporate Governance”, we compute the Corporate
Governance index to measure the quality of corporate governance of each country in the sample.
This index indicates (i) whether or not there are clear requirements and criteria on the presence of
independent directors on the board according to ownership structure; (ii) whether or not there is
requirement on the disclosure information on the ownership and board structure1. This index
ranges in principle from 0 to 18; in our sample, it has the median of 9, with a minimum of 3
(Germany, Switzerland), and a maximum of 15 (Spain). There is heterogeneity in countries in our
sample regarding the quality of corporate governance requirement. We expect that a better
corporate governance environment can limit the presence of directors related to controlling
1 The detailed questions used to construct this index are given in Table 4.

10
shareholders to reduce the risk of minority shareholder expropriation and thus, increase the
presence of minority directors on the board.
Shareholder protection index
We use the revised anti-director rights index (RADI) from Djankov et al, (2008) to capture the
shareholder protection level of each country. This index varies from 0 with the weakest protection
to 5 with the strongest protection. In a country having a strong shareholder protection, there are
specific regimes to insure the execution of the rights of minority shareholders (e.g. nomination
directors to board positions). A strong shareholder protection regime might be a complementary
for internal governance mechanisms (e.g. minority directors). Therefore, we expect a negative
impact of RADI on the presence of directors related to controlling shareholders on the board
(pct_Controlling), but a positive impact on the presence of directors related to minority
shareholders on the board (pct_Minority).
Supervisory power index
We use the supervisory power index (SupPow) (The World Bank 2003) to measure the strength of
the supervisory regime of each country. This index ranges from 0 to 16. A high supervisory power
index indicates wider and stronger authority for bank supervisors. In strict supervisory systems,
supervisors can issue fines against, or even dismiss, bank directors without formal proceedings, or
mandate new board elections. Therefore, a strong supervisory regime can substitute internal
governance mechanisms to reduce agency conflicts between insiders and minority shareholders.
Therefore, we expect a negative impact of supervisory power on the presence of minority directors
on the board, and a positive impact of it on the presence of directors related to controlling
shareholders.
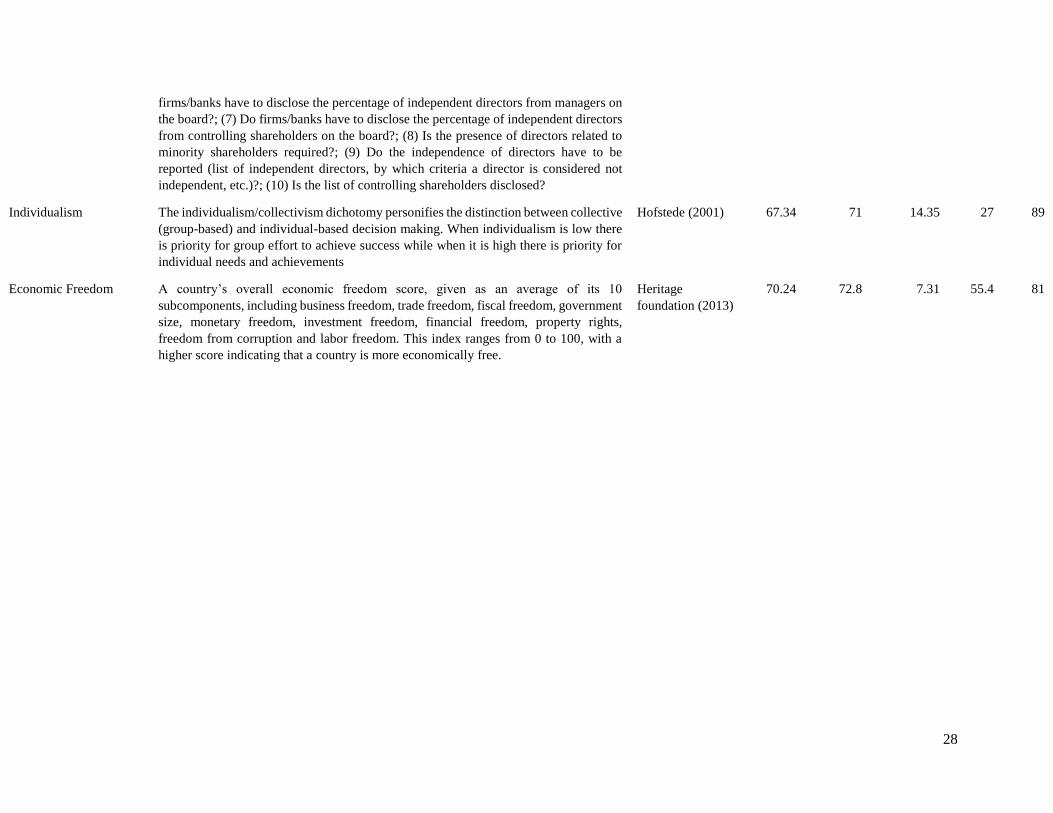
Individualism index
We use the individualism index (Individualism) (Hofstede, 2001) to measures the distinction
between collective (group-based) and individual-based decision making of a country. Individuals
in a country having a high level of individualism are likely to challenge authority and encourage a
reduction of agency conflict between insiders and minority shareholders. However, individuals in
a collectivist culture are likely to protect the well-being of the group. We suppose that in an
individual-based country, minority shareholders have more incentives to protect their own benefits
by being more active in choosing members of the board. Therefore, we expect that the

11
individualism impact positively on presence of minority directors, and negatively on the presence
of directors related to controlling shareholders on the board.
Economic Freedom
We use the Economic Freedom Index of The Heritage Foundation to take into account the degree
of economic freedom of a country. This index comprises 10 subcomponents of economic freedom,
including business freedom, trade freedom, fiscal freedom, government size, monetary freedom,
investment freedom, financial freedom, property rights, freedom from corruption and labor
freedom. This index ranges from 0 to 100. A higher score indicates that a country is more
economically free. Our sample has the median of 70.45 in which Greece has the lowest score at
55.4, and Switzerland has the highest score at 81.0. Individuals in an economically free society are
free to work, produce, consume, and invest in any way they please, with their freedom at once both
protected and respected by the state. Thus we expect that the degree of economic freedom has the
positive impacts on the presence of both directors related to controlling and minority shareholders
on the board.
2.2.4 Bank characteristic variables
We consider bank characteristics such as board size, bank size, capital ratio, loan ratio, deposit
ratio, operating ratio, opacity level as the potential determinants of the presence of related
directors.
Board size (BoardSize) is calculated as the natural logarithm of the number of directors on the
board. We expect a positive relation between board size and the presence of related directors to
both controlling and minority shareholders on the board, as larger board gives more opportunities
to diversify board structure, and then shareholders have opportunities to nominate related directors
on the board.
Bank size (Size) is measured by the logarithm of total assets of banks. We expect the impact of
bank size on the percentage of directors related to controlling shareholders to be negative, and its
impact on the presence of minority directors to be positive. The large bank can use board structure
by reducing the presence of directors related to controlling shareholders, and increasing the
presence of minority directors, as an effective internal governance mechanism, to increase their
reputation, and then to attract investors.

12
Capital ratio (Capital) is calculated as the ratio of total equity to total assets of the bank. Operating
ratio (Operating) is defined as the ratio of total operating expenses to total operating income. We
calculate loan ratio (Loan) and deposit ratio (Deposit) as the ratio of total loan or total deposit to
total assets of the bank.
To measure the opacity of banks in the sample, we use market data to compute the opacity index
(Opacity). Following Anderson et al., (2009) we calculate the natural logarithm of the average
daily trading volumes during the fiscal year, and bid-ask spread as the difference of ask price and
bid price over the average of bid and ask prices. We rank each of these proxies from the value of
1 (for banks with high trading volume, or small bid-ask spread) to the value of 10 (for banks with
low trading volumes, or high bid-ask spreads). Then we take the average of these two proxies to
capture the opacity level of each bank, with the most transparent bank has a value of 1 and the
most opaque bank has a value of 10. Higher opacity indicates that there is higher information
asymmetry between insiders and minority shareholders. Therefore, in banks having a high opacity
level, controlling shareholders have more possibilities to nominate their representatives to the
board. Thus, we expect a positive relation between opacity and the presence of directors related to
controlling shareholders, and a negative relation between opacity and the presence of minority
directors on the board.
[Insert Table 4 here]
2.3 Methodology
In order to investigate the impacts of ownership structure, bank internal characteristics, and
institutional characteristics on the presence of related directors on the board, we estimate the
following equation:
𝑝𝑐𝑡_𝑅𝑒𝑙𝑖𝑗 = α + 𝛽1 ∗ 𝑂𝑤𝑛𝑒𝑟𝑠ℎ𝑖𝑝𝑖𝑗 + 𝛽2 ∗ 𝐼𝑛𝑠𝑡𝑖𝑡𝑢𝑡𝑖𝑜𝑛𝑎𝑙𝑗 + ∑ βk ∗ Xi8k=3 + 𝜀𝑖𝑗
Where subscripts i denotes the bank i (i =1, 2, 3, … 96); j denotes the country j (j= 1, 2, …, 17);
𝛽𝑘 (k= 1, 2, …, 8) are the parameters to be estimated; 𝜀 is the idiosyncratic error term.
𝑝𝑐𝑡_𝑅𝑒𝑙𝑖𝑗 denote the presence of directors related to either controlling shareholders
(pct_Controlling) or to minority shareholders (pct_Minority) of the bank i in 2013.
𝑂𝑤𝑛𝑒𝑟𝑠ℎ𝑖𝑝𝑖𝑗 represent the bank ownership structure variables: relative voting power of the largest
ultimate owner (uo_BPI), the excess control rights of the largest ultimate owner (ExcessCR), the

13
relative power of other controlling shareholders vis-à-vis the biggest ultimate owner
(ControlOther). We find high correlations between ownership variables (see Table A1 in
Appendix), thus we estimate the regressions with each ownership variable respectively.
𝐼𝑛𝑠𝑡𝑖𝑡𝑢𝑡𝑖𝑜𝑛𝑎𝑙𝑗 represent the institutional characteristics: quality of corporate governance (CG),
shareholder protection (RADI), supervisory power (SupPow), individualism (Individualism),
economic freedom (EcoFreedom). We also run the regressions with each of the institutional
variables separately because of high correlations between these variables.
𝑋𝑖 are the bank-characteristic variables of the bank i including board size, bank size, loan ratio,
deposit ratio, operating ratio, opacity.
The dependent variables in this study are in percentage, which is bounded from 0% to 100%.
Therefore we employ the Tobit Model to conduct our estimations. After each regression, we
calculate the LM-statistic (presented detail at the bottom of each table of results) to test the tobit
specification, against the alternative of a model that is non-linear in the regressors, and contains
an error term that is heteroskedastic and non-normally distributed. The results of the tests show
that we cannot reject the null hypothesis, it means that the tobit specification is suitable for our
regression model.
After examining the correlation among our variables (Table A1 in Appendix), we orthogonalize
the variables which have potential multicollinearity problems (Table 4).
3. Results
3.1. Univariate analysis
Table 5 shows the univariate statistics of our sample based on ownership structure, bank
characteristic variables and institutional environment.
On the one hand, the results of mean tests indicate that the presence of directors who are related to
controlling shareholders, varies systematically with the relative voting power as well as with the
excess control rights of the largest ultimate owner. It means that, banks having ultimate owner
with high level of relative voting power are more likely to have high percentage of related directors
to controlling shareholders. Banks having the ultimate owner with high levels of the excess control
rights also are more likely to recruit directors who are related to controlling shareholders. In
addition, in term of the institutional environment, the mean tests imply that lower quality of

14
corporate governance, or lower shareholder protection, or stronger supervisory power is associated
with more directors related to controlling shareholders on the board.
On the other hand, the mean tests show that the percentage of minority directors is more likely to
be low in banks having high relative voting power of the largest ultimate owner, high level of
opacity or high strength of supervisory power. Moreover, the differences in means of the presence
of minority directors on the board between two groups of banks based on shareholder protection
are statistically significant. This result indicates that higher shareholder protection would lead to
more minority directors on the board of a bank.
Therefore, the results of the mean tests indicate that the ownership structure and the institutional
environment are potential determinants of the presence of related directors on the bank’s board of
directors.
[Insert Table 5 here]
3.2. Empirical results
We examine separately the determinants of the presence of directors who are related to controlling
shareholders and the determinants of the presence of directors who are related to minority
shareholders.
3.2.1 The determinants of the presence of directors related to controlling shareholders on the
bank’s board
Table 6 presents the impacts of ownership structure, bank internal characteristics and institutional
characteristics on the presence of directors who are related to controlling shareholders on the board
of directors.
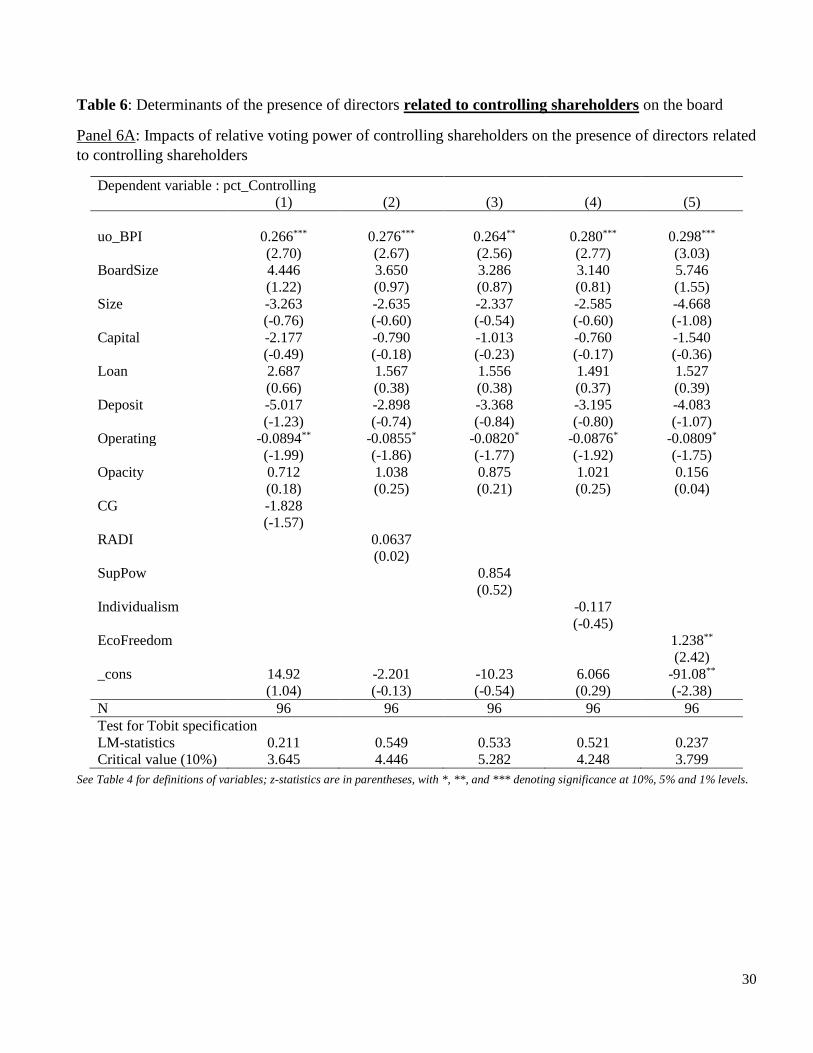
We find that the relative voting power as well as the excess control rights of the largest ultimate
owner have positive and significant impacts on the presence of directors related to controlling
shareholders on the board. This results are consistent with the theory. First, when the largest
ultimate owner has more voting power, he would take advantage of his voting power to nominate
more representatives on the board. Second, when the largest ultimate owner has higher excess
control rights, he has more desire to expropriate minority shareholders based on the divergence
between control and cash-flow rights and thus, they are motivated to assign representatives who
are related to them into the board.

15
In addition, the results show an insignificant relationship between of the presence of related
directors to controlling shareholders and the relative power of other controlling shareholders. In
theory, when the power of other controlling shareholders is high in comparison with the power of
the largest ultimate owner, the other controlling shareholders would be able to create a coalition
to reduce the relative voting power of the largest ultimate owner and thus, reduce the presence of
directors who related to controlling shareholders on the board. However, the result proves that the
relative power of other controlling shareholders would not prevent the controlling shareholders
from appointing more representatives on the board.
Regarding the institutional characteristics, we find that there is a positive and significant impact
of the degree of economic freedom on the presence of directors related to controlling shareholders
on the board. This result is not surprising since the private property rights is an essential part of
economic freedom. In countries having high degrees of the economic freedom, the right to control
and benefit from property is firmly protected by laws. Therefore, controlling shareholders would
have more ability to introduce their representatives into the board of directors.
Our results also show that there are insignificant impacts of the bank financial characteristics on
the presence of directors related to controlling shareholders on the board of directors.
[Insert Table 6 here]
3.2.2 Determinants of the presence of directors who related to minority shareholders on the board
of directors
Table 7 presents the impacts of ownership structure, bank internal characteristics and institutional
characteristics on the presence of directors who related to minority shareholders on the board.
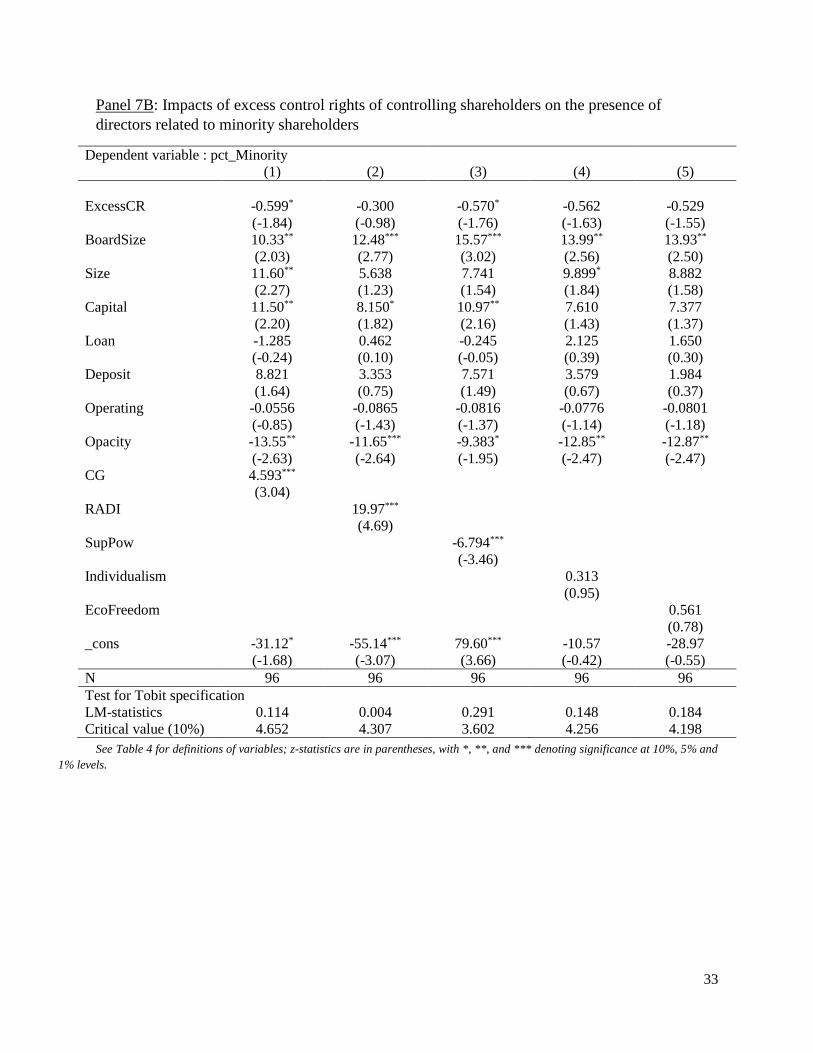
The results show that the relative voting power of the largest ultimate owner has a negative and
significant impact on the presence of minority directors. It means that banks, in which the largest
ultimate owner has high relative voting power, are likely to have less minority directors on the
board. This finding is consistent with the hypothesis that when the largest ultimate owner has a
relatively high voting power, he is able to limit the number of seats of minority directors in order
to maintain his decisive power over the board. We also find that the relative power of other
controlling shareholders increases significantly the number of minority directors on the board. This
can be explained by the fact that in banks having other controlling shareholders, the conflict of

16
interest between the controlling shareholders is high and therefore, minority directors would play
more important role in the decision making process of the board.
In addition, we find that the coefficient of the variable measuring the degree of opacity is negative
and significant at 5% confidence level. In theory, the information asymmetry between controlling
shareholders and minority shareholders in opaque banks would prevent minority shareholders from
exercising their rights to choose the members of board of directors. Our results are in line with this
hypothesis, showing that banks having high levels of opacity are less likely to have minority
directors on the board.
Regarding to the impact of institutional environment, we find that banks in countries having high
quality of corporate governance as well as high levels of shareholder protection are more likely to
have minority directors on the board. First, in these countries, corporate governance code often
provides detailed recommendations about the board structure. Consequently, it increases the
presence of minority directors. Second, because of the high level of shareholder protection,
minority shareholders have more rights to challenge banks’ controlling parties and thus, they are
more active in choosing the member of the board of directors.
It is surprising that the regression result shows a negative coefficient (statistically significant at
1% confidence level) of the supervisory power. This result seems to be “logically inconsistent”
because it indicates that, in countries where banking authorities have strong power to supervise
banks’ performance, the bank’s board is less likely to have minority directors. However, in theory,
in a strict financial supervisory system where banking supervisors are able to dismiss bank
directors or mandate new board elections, the supervisory regime can substitute bank’s internal
governance mechanisms to reduce agency conflicts between insiders and minority shareholders.
Therefore, minority shareholders would be less motivated to participate in supervising banks’
controlling parties. Consequently, the presence of minority directors on the bank’s board
decreases.
The regression results also indicate that bank financial characteristics impact insignificantly on the
presence of minority directors on the bank’s board.
To summarize, our results prove that ownership structure is a dominant determinant of the presence
of related directors on the bank’s board of directors. The relative voting power of the largest
ultimate owner impacts positively on the presence of directors related to controlling shareholders

17
but negatively on the number of minority directors on the board. While the excess control rights
of the largest ultimate owner increase the presence of directors related to controlling shareholders,
the relative power of other controlling shareholders vis-à-vis the biggest ultimate owner in bank’s
ownership structure will help to enhance the presence of minority directors. Our findings also show
that, the level of economic freedom of a country impacts positively on the presence of directors
related to controlling shareholders but the quality of corporate governance of that country affects
positively and significantly on the presence of minority directors. We also find that the power of
banking supervisory agency of a country has a negative relationship with the presence of minority
directors on the bank’s board of directors. This indicates the fact that minority shareholders count
on the banking supervisory agency to oversee banks’ performance and thus, in countries having
high levels of supervisory power, minority shareholders are less motivated to participating in
supervising banks’ controlling parties.
[Insert Table 7 here]
4. Further investigations
Our main results indicate that ownership structure plays an important role on determining the
presence of related directors on the bank’s board of directors. In this section, we investigate how
the impact of ownership structure on the presence of related directors is shaped under different
institutional environment. In other words, we empirically examine the interaction effects between
ownership structure and institutional characteristics on the presence of related directors on the
board of a bank. Therefore, we estimate the following model:
𝑝𝑐𝑡_𝑅𝑒𝑙𝑖𝑗 = α + 𝛽1 ∗ 𝑂𝑤𝑛𝑒𝑟𝑠ℎ𝑖𝑝𝑖𝑗 + 𝛽2 ∗ 𝑂𝑤𝑛𝑒𝑟𝑠ℎ𝑖𝑝𝑖𝑗 ∗ 𝑑_𝐼𝑛𝑠𝑡𝑖𝑡𝑢𝑡𝑖𝑜𝑛𝑎𝑙𝑗
+ 𝛽3 ∗ 𝑑_𝐼𝑛𝑠𝑡𝑖𝑡𝑢𝑡𝑖𝑜𝑛𝑎𝑙𝑗 + ∑ βk ∗ Xi6k=4 + 𝜀𝑖𝑗
Where d_Institutional is the institutional environment dummy variable. This dummy variable
alternatively represents for one of the five institutional characteristics including: corporate
governance dummy variable (d_CG), shareholder protection dummy variable (d_RADI),
supervisory power dummy variable (d_SupPow), individualism dummy variable
(d_Individualism) and economic freedom dummy variable (d_EcoFree). This dummy variable
takes the value of one if the institutional variable of country j is larger than the sample median,
and zero otherwise.

18
𝑝𝑐𝑡_𝑅𝑒𝑙𝑖𝑗 denotes the presence of directors related to either controlling shareholders
(pct_Controlling) or minority shareholders (pct_Minority) of the bank i in 2013.
𝑂𝑤𝑛𝑒𝑟𝑠ℎ𝑖𝑝𝑖𝑗 alternatively represents one of the bank ownership structure variables: relative
voting power of the largest ultimate owner (uo_BPI), the excess control rights of the largest
ultimate owner (ExcessCR), the relative power of other controlling shareholders vis-à-vis the
biggest ultimate owner (ControlOther).
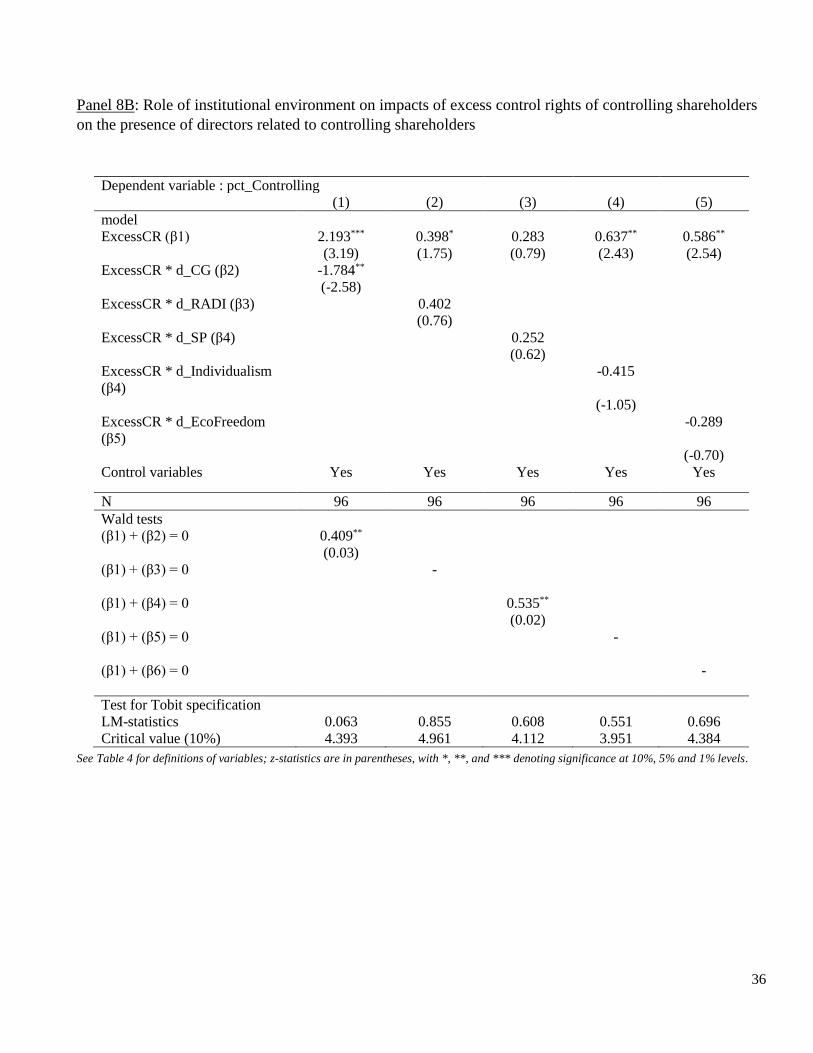
Table 8 shows the impact of the interaction between ownership structure and institutional
characteristics on the presence of directors related to controlling shareholders.
Table 9 shows the impact of the interaction between ownership structure and institutional
characteristics on the presence of directors related to minority shareholders.
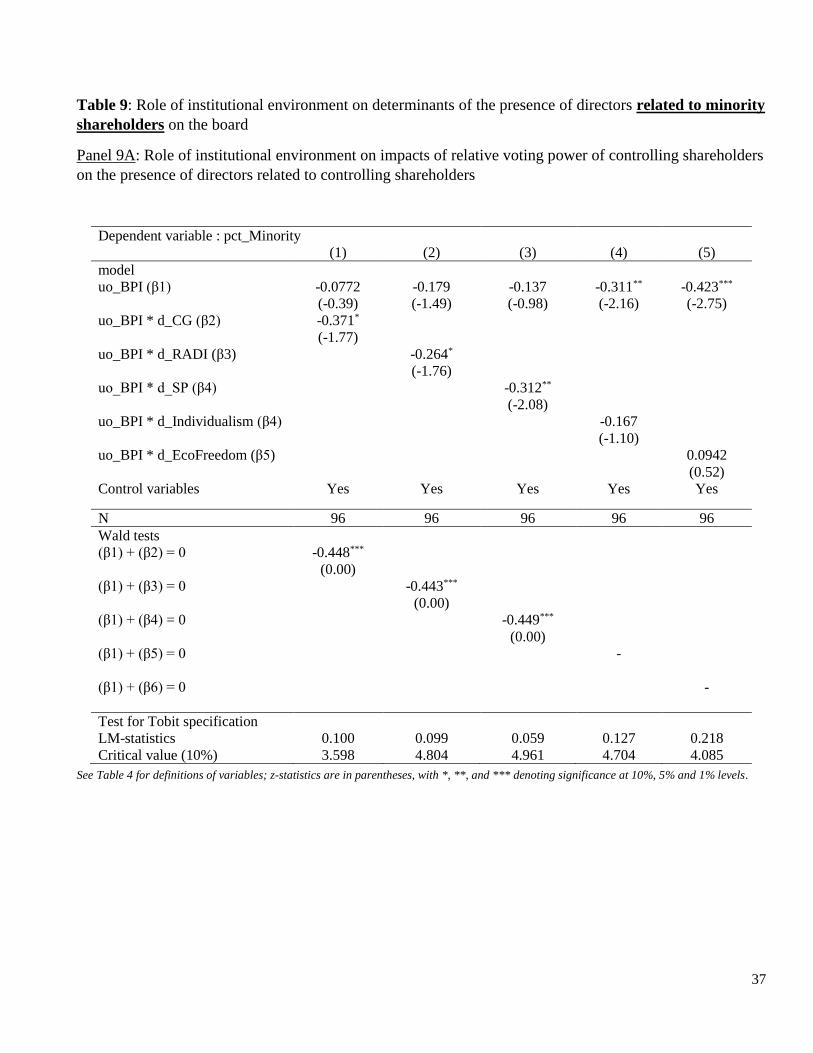
In the previous section of this study, we have showed that, the relative voting power of the largest
ultimate owner impacts greatly on the presence of related directors on the bank’s board of directors.
The higher relative voting power that the largest ultimate owner has, the higher possibility that he
will take advantage of his voting power to appoint the board members. Therefore, the relative
voting power of the largest owner affects positively on the presence of directors related to
controlling shareholders while it impacts negatively on the presence of minority directors on the
bank’s board. However, in this section, we find that the relationship between the relative voting
power of the largest ultimate owner and the presence of related directors varies significantly under
different institutional environments.
The results in Table 8 show that the relative voting power of the largest ultimate owner impacts
positively and significantly (at 1% confidence level) on the presence of directors related to
controlling shareholders but it happens only in the countries having high levels of supervisory
power. In the countries where the power of banking supervisory authority is low, this impact is
insignificant.
In addition, the regression results in Table 9 indicate that, in the countries having high levels of
supervisory power, the relative voting power of the largest ultimate owner impacts negatively and
significantly (at 1% confidence level) on the presence of minority directors. However, in the
countries having low supervisory power, this impact is insignificant.
19
Therefore, we find that the impacts of the relative voting power of the largest ultimate owner on
the presence of related directors is only significant in high supervisory environments. This
relationship is insignificant in countries where the banking supervisory agency has low power.
This result, interestingly, confirm our finding in the previous section about the motivation of
minority shareholders to participate in supervising banks’ controlling parties. In countries having
high levels of supervisory power, minority shareholders count on the financial supervisory
authority to oversee bank performance. Therefore, they are less motivated to participate in
choosing members of the board of directors. As a consequence, the presence of minority directors
on the bank’s board decreases while the presence of directors related to controlling shareholders
increases. In contrast, when minority shareholders believe that the banking supervisory agencies
have low power to oversee banks’ controlling parties, they will be more active in choosing
members of the board in order to protect their own interests. As a result, the presence of minority
directors on the board increases.
[Insert Tables 8, 9 here]
Then, we conduct several robustness checks to verify the strength of our results. First, we examine
whether the results varies differently by year. We use data of 2012 and average data from 2011 to
2013 to re-conduct our regressions. The results are unchanged. Second, we replace our dependent
variable by the dummy variable d_Controlling (d_Minority) that takes the value of 1 for banks
having directors related to controlling (minority) on the board, and 0 for otherwise, and then we
use logit regression instead of the tobit model to check the strength of the results. We find that
there is no significant difference for ownership structure variables and institutional variables.
Therefore, the results are robust2.
5. Conclusion
The purpose of this study is to examine the determinants of the presence of directors related to
controlling shareholders as well as of the presence of minority directors on the bank’s board of
directors. Using a sample of 96 banks from 17 European countries, we find that ownership
structure is dominant determinant of the presence of related directors on the board. While some of
institutional characteristics such as the level of economic freedom, the quality of corporate
2 The results of robustness tests are available on request.

20
governance, shareholder protection and supervisory power impact significantly on the presence of
related directors, there is none of bank financial characteristics affecting significantly the presence
of related directors on the bank’s board of directors.
Our findings indicate that minority shareholders count on the banking supervisory agency to
oversee banks’ performance and thus, in countries having high levels of supervisory power,
minority shareholders are less motivated to participating in supervising banks’ controlling parties.
However, strengthening the quality of corporate governance guidelines would be considered as a
suitable method for policy-makers to increase the presence of minority directors on the bank’s
board of directors.

21
References
Anderson, R. C., Duru, A. & Reeb, D. M., 2009. Founders, heirs, and corporate opacity in the
United States. Journal of Financial Economics, p. 205–222.
Attig, N., Guedhami, O. & Mishra, D., 2008. Multiple large shareholders, control contests, and
implied cost of equity. Journal of Corporate Finance, Volume 14, pp. 721-737.
Barry, T. A., Lepetit, L., Strobel, F. & Tran, T. H., 2018. Better than independent: the role of
minority directors on bank boards. Working paper.
Basel Committee on Banking Supervision, 2015. Corporate governance principles for banks,
Basel, Switzerland: s.n.
Bebchuk, L. A. & Roe, M. J., 1999. A theory of path dependence in corporate ownership and
governance. Stanford Law Review, pp. 127-170.
C.Jensen, M. & H.Meckling, W., 1976. Theory of the firm: Managerial behavior, agency costs and
ownership structure. Journal of Financial Economics, 3(4), pp. 305-360.
Caprio, G., Laeven, L. & Levine, R., 2007. Governance and bank valuation. Journal of Financial
Intermediation, 16(4), pp. 584-617.
Cheung, Y.-L., Chung, C.-W., Tan, W. & Wang, W., 2013. Connected board of directors: A
blessing or a curse?. Journal of Banking & Finance, 37(8), pp. 3227-3242.
Claessens, S., Djankov, S., Fan, J. P. H. & Lang, L., 2002. Disentangling the incentive and
entrenchment effects of large shareholdings. Journal of Finance, 57(6), pp. 2741-2771.
Crespí-Cladera, R. & Pascual-Fuster, B., 2014. Does the independence of independent directors
matter?. Journal of Corporate Finance.
Dahya, J., Dimitrov, O. & J.McConnell, J., 2008. Dominant shareholders, corporate boards, and
corporate value: A cross-country analysis. Journal of Financial Economics, 87(1), pp. 73-100.
De-Haan, J. & Vlahu, R., 2016. Corporate governance of banks: a survey. Journal of Economic
Surveys, 30(2), pp. 228-277.
Djankov, S., La Porta, R., Lopez-de-Silanes, F. & Shleifer, A., 2007. The law and economics of
self -dealing. Journal of Financial Economics, Volume 88, pp. 430-465.
Grossman, S. J. & Hart, O. D., 1988. One share-one vote and the market for corporate control.
Journal of Financial Economics, Volume 20, pp. 175-202.
Hofstede, G., 2001. Culture’s consequences: Comparing values, behaviors, institutions, and
organizations across nations. Thousand Oaks, California: Sage Publications.
Kirkpatrick, G., 2009. The corporate governance lessons from the financial crisis. Financial
Market Trends , Issue 2009/1 OECD.

22
La-Porta, R., Lopez-De-Silanes, F. & Shleifer, A., 1999. Corporate Ownership Around the World.
Journal of Finance.
La-Porta, R., Lopez-De-Silanes, F. & Shleifer, A., 2002. Government ownership of banks. Journal
of Finance, 57(1), pp. 265-301.
Lepetit, L., Saghi-Zedek, N. & Tarazi, A., 2015. Excess control rights, bank capital structure
adjustments, and lending. Journal of Financial Economics, 115(3), pp. 574-591.
Lin, C., Ma, Y. & Xuan, Y., 2011. Ownership structure and financial constraints: Evidence from
a structural estimation. Journal of Financial Economics.
Shleifer, A. & Vishny, R. W., 1986. Large shareholders and corporate control. Journal of Political
Economy, 94(3), pp. 461-488.
Shleifer, A. & Vishny, R. W., 1997. A survey of corporate governance. Journal of Finance, 52(2),
pp. 737-783.
Shleifer, A. & Wolfenzon, D., 2002. Investor protection and equity markets. Journal of Financial
Economics, pp. 3-27.

23
Table 1: Number of controlled banks in the sample by country
Country Number of
listed banks
Number of
controlled banks in
the sample
Total assets of sample
banks divided by total
assets of all listed
banks in Bankscope
(%)
Austria 6 5 99.91
Belgium 4 3 98.98
Denmark 28 10 97.95
Finland 4 3 81.36
France 9 9 100
Germany 13 10 32.01
Greece 7 6 99.15
Ireland 2 1 45.27
Italy 19 12 11.57
Luxembourg 2 0 0.00
Netherlands 5 2 93.16
Norway 2 2 100
Portugal 4 3 93.97
Spain 7 5 48.11
Sweden 5 4 99.99
Switzerland 16 12 54.93
United Kingdom 12 9 45.75
Total 145 96 70.71
24
Table 2: Statistics on the banks having directors related to either controlling or minority shareholders.
Number of directors Banks having directors related to controlling SH Banks having directors related to minority SH
Total Average
per bank
% of
banks
% of
directors
% of
directors
related to
the biggest
controlling
SH
% of
directors
related to
other
controlling
SH
Number of
controlling
SH
% shares
held by the
biggest
controlling
SH
% of
banks
% of
directors
Number of
controlling
SH
% shares
held by the
biggest
controlling
SH
Austria 91 18.20 100 34.04 96.67 3.33 1.6 96.67 40 14.35 1 36.95
Belgium 44 14.67 100 37.91 77.78 22.22 2.33 77.78 33.33 17.65 2 51
Denmark 105 10.50 60 20.59 100 0 1.83 100 10 10.53 2 23
Finland 24 8 100 12.86 66.67 33.33 1.33 66.67 66.67 14.29 1.50 16.61
France 102 11.33 66.67 36.05 83.33 16.67 2.17 83.33 66.67 38.09 2 33.34
Germany 101 10.10 50 38.27 100 0 1 100 20 11.01 1 40.63
Greece 87 14.50 16.67 21.43 66.67 33.33 2 66.67 0 0 - -
Ireland 11 11 0 - - - - - 0 0 - -
Italy 130 10.83 75 26.55 77.78 33.33 1.67 77.78 50 20.29 2.17 40.46
Netherlands 16 8 50 14.29 100 0 2 100 50 11.11 1 98
Norway 13 6.50 0 - 50 25 1 34
Portugal 64 21.33 66.67 29.55 85 15 2.5 85 100 7.73 2 26.77
Spain 65 13 40 23.89 100 0 3.5 100 100 64.72 2.20 40.91
Sweden 49 12.25 50 10.42 100 0 1 100 100 24.20 1.25 16.64
Switzerland 87 7.25 41.67 69.70 96.67 3.33 1.6 96.67 41.67 32.29 2.20 35.68
United
Kingdom 103 11.44 55.56 16.78 100 0 1.4 100 88.89 47.02 1.75 28.89
Sample
average 1092 11.81 57.29 28.02 89.76 12.06 1.75 89.33 48.96 24.16 1.81 34

25
Table 3: Statistics on the presence of related directors to either controlling or minority shareholders according to different criteria.
Relatedness to controlling shareholders Relatedness to minority shareholders
Employee of
SH (%)
Direct /
Indirect SH
of the bank
(%)
Same family
name with
SH (%)
Politician /
Employee of
government
agency (%)
Employee of
SH (%)
Direct /
Indirect SH
of the bank
(%)
Same family
name with SH
(%)
Politician /
Employee of
government
agency (%)
Austria 100 0 0 0 100 0 0 0
Belgium 88.89 0 0 11.11 100 0 0 0
Denmark 100 0 0 0 100 0 0 0
Finland 100 0 0 0 100 0 0 0
France 100 0 0 0 77.78 7.04 15.19 0
Germany 77.50 22.50 0 0 100 0 0 0
Greece 100 0 0 0 - - - -
Ireland - - - - - - - -
Italy 79.63 20.37 0 0 82.50 17.50 0 0
Netherlands 100 0 0 0 100 0 0 0
Norway - - - - 100 0 0 0
Portugal 100 0 0 0 77.78 0 22.22 0
Spain 35 65 0 0 2.50 97.50 0 0
Sweden 50 50 0 0 100 0 0 0
Switzerland 100 0 0 0 60 40 0 0
United
Kingdom 40 60 0 0 29.45 63.51 7.03 0
Sample
average 83.64 15.56 0 0.79 80.71 16.11 3.17 0

26
Table 4: Variable definitions, data sources and summary statistics
Variables Definition Source Mean Median Standard
Deviation
Min. Max
Dependent variables (percentage of related directors to shareholders)
Pct_Controlling Percentage of related directors to controlling shareholders having at least 10% of
control rights. (%) Bloomberg, annual
reports
18.48 10 22.84 0 92.31
Pct_Minority Percentage of related directors to minority shareholders having less than 10% of
control rights. (%)
17.48 8.92 23.71 0 100
Ownership structure variables
Uo_BPI Relative voting power of the biggest ultimate owner (measured by Bazhaf Power Index)
Bankscope,
Amadeus, Annual
reports
64.94 99.42 38.53 8.91 100
ExcessCR The difference between the control rights and the cash flow rights of the biggest
controlling shareholders.
8.93 0 17.75 0 74.08
ControlOther The ratio of control rights of other controlling shareholders (except the biggest
ultimate owner) to the control rights of the biggest ultimate owner.
0.32 0 0.58 0 2.84
Bank-level control variables
BoardSize Natural logarithm of the number of directors on the board Bloomberg 2.33 2.39 0.47 1.09 3.22
Size Natural logarithm of Total Assets (orthogonalized on BoardSize) Bankscope
ibid
ibid
ibid
ibid
16.79 16.67 2.61 9.88 21.65
Capital Total equity divided by total assets (%) 13.67 6.99 17.40 0.83 55.28
Loan The ratio of gross loans to total assets (%) 47.14 51.61 25.60 0.59 89.67
Deposit The ratio of deposits to total assets (%)(orthogonalized on Loan) 55.46 58.20 22.70 1/72 91.72
Operating The ratio of total operating expenses to total operating income (%) 1.80 1.43 1.49 -0.83 9.06
Opacity The average of the rank from 1 to 10 of two indicators about Opacity (Trading
volume: the natural logarithm of the average trading volume during the fiscal year.
Bloomberg 5.92 6.0 2.59 1 10
27
Bid–ask spread: ask price minus the bid price divided by the average of the bid and
ask prices)
Country-level variables
RADI Revised anti-director index (RADI): Takes the value of 1 for each of these indicators:
Vote by mail, Shares not deposited, Cumulative voting, Oppressed non-controlling,
Pre-emptive rights and Capital to call a meeting
Djankov et al.
(2008)
3.32 3.5 0.96 2 5
SupPow Index measuring the strength of supervisory regime. The yes/no responses to the
following questions are coded as 1/0: (1) Does the supervisory agency have the right to
meet with external auditors to discuss their report without the approval of the bank? (2)
Are auditors required by law to communicate directly to the supervisory agency any
presumed involvement of bank directors or senior managers in illicit activities, fraud, or
insider abuse? (3) Can supervisors take legal action against external auditors for
negligence? (4) Can the supervisory authority force a bank to change its internal
organizational structure? (5) Are off-balance sheet items disclosed to supervisors? (6)
Can the supervisory agency order the bank’s directors or management to constitute
provisions to cover actual or potential losses? (7) Can the supervisory agency suspend
directors’ decision to distribute: (a) Dividends? (b) Bonuses? (c) Management fees? (8)
Can the supervisory agency legally declare - such that this declaration supersedes the
rights of bank shareholders - that a bank is insolvent? (9) Does the Banking Law give
authority to the supervisory agency to intervene that is, suspend some or all ownership
rights in a problem bank? And (10) Regarding bank restructuring and reorganization,
can the supervisory agency or any other government agency do the following: (a)
Supersede shareholder rights? (b) Remove and replace management? (c) Remove and
replace directors? A higher value indicates wider and stronger authority for bank
supervisors.
Bank regulation
and supervision
database (The
World Bank 2003)
10 11 2.33 4 13
Corporate Governance
Index
Index measuring the strength of corporate governance codes. Each of the following
criteria might be existed in form of “Comply or explain” principle, Recommendation,
or might be not mentioned in the Code of Best Practices, which are coded as 2/1/0: (1)
Do regulators require a sufficient number of independent directors on the board?; (2)
Are there criteria on the independence from managers?; (3) Are there criteria on the
independence from controlling shareholders?; (4) Do firms/banks have to disclose the
percentage of independent directors on the board?; (5) Do firms/banks have to disclose
the percentage of independent directors from managers on the board?; (6) Do
Code of Best
Practices for Good
Corporate
Governance
8.35 9 3.32 3 15
28
firms/banks have to disclose the percentage of independent directors from managers on
the board?; (7) Do firms/banks have to disclose the percentage of independent directors
from controlling shareholders on the board?; (8) Is the presence of directors related to
minority shareholders required?; (9) Do the independence of directors have to be
reported (list of independent directors, by which criteria a director is considered not
independent, etc.)?; (10) Is the list of controlling shareholders disclosed?
Individualism The individualism/collectivism dichotomy personifies the distinction between collective
(group-based) and individual-based decision making. When individualism is low there
is priority for group effort to achieve success while when it is high there is priority for
individual needs and achievements
Hofstede (2001) 67.34 71 14.35 27 89
Economic Freedom A country’s overall economic freedom score, given as an average of its 10
subcomponents, including business freedom, trade freedom, fiscal freedom, government
size, monetary freedom, investment freedom, financial freedom, property rights,
freedom from corruption and labor freedom. This index ranges from 0 to 100, with a
higher score indicating that a country is more economically free.
Heritage
foundation (2013)
70.24 72.8 7.31 55.4 81

29
Table 5: Univariate mean test of potential determinants of related directors on the board
Pct_Controlling Pct_Minority
Ownership structure
uo_BPI Low (N=48) 7.571305 21.30409
High (N=48) 20.19934 6.334853
t-statistic of the mean test -3.1392*** 3.4312***
ExcessCR Low (N=66) 9.517166 13.67904
High (N=30) 23.49527 14.12843
t-statistic of the mean test -3.2303*** -0.0900
PresenceMLS PresenceMLS=0 (N=55) 13.39809 13.37556
PresenceMLS=1 (N=44) 14.53893 14.41497
t-statistic of the mean test -0.2670 -0.2223
Bank characteristics
Board Size Low (N=45) 13.36508 11.88272
High (N=51) 14.34436 15.52838
t-statistic of the mean test -0.2312 -0.7888
Size Low (N=48) 13.75087 9.65879
High (N=48) 14.01977 17.98016
t-statistic of the mean test -0.0636 -1.8298*
Capital Low (N=48) 14.22383 12.38461
High (N=48) 13.54682 15.25433
t-statistic of the mean test 0.1601 -0.6214
Operating Low (N=48) 14.97785 17.55589
High (N=48) 12.7928 10.08306
t-statistic of the mean test 0.5175 1.6376*
Loan Low (N=45) 14.13497 17.67101
High (N=51) 13.66505 10.42106
t-statistic of the mean test 0.1109 1.5843
Deposit Low (N=47) 12.72111 18.26702
High (N=49) 15.00202 9.55346
t-statistic of the mean test -0.5402 1.9190**
Opacity Low (N=44) 13.63895 22.85679
High (N=52) 14.0938 6.172508
t-statistic of the mean test -0.1072 3.8680***
Institutional environment
d_CG Low (N=25) 20.85833 7.765368
High (N=71) 11.43004 15.9512
t-statistic of the mean test 1.9983** -1.5728
d_RADI Low (N=43) 18.13231 6.42463
High (N=53) 10.43966 19.81906
t-statistic of the mean test 1.8418* -3.0145***
d_SupPow Low (N=39) 8.082242 26.41949
High (N=57) 17.85585 5.198408
t-statistic of the mean test -2.3354** 5.0864***
d_Individualism Low (N=47) 17.00959 11.41203
High (N=49) 10.88858 16.12866
t-statistic of the mean test 1.4637 -1.0246
d_EcoFreedom Low (N=55) 13.45141 11.67388
High (N=41) 14.4674 16.6977
t-statistic of the mean test -0.2378 -1.0806
See Table 4 for definitions of variables; *, **, and *** denote significance at 10%, 5% and 1% levels.
30
Table 6: Determinants of the presence of directors related to controlling shareholders on the board
Panel 6A: Impacts of relative voting power of controlling shareholders on the presence of directors related
to controlling shareholders
Dependent variable : pct_Controlling
(1) (2) (3) (4) (5)
uo_BPI 0.266*** 0.276*** 0.264** 0.280*** 0.298***
(2.70) (2.67) (2.56) (2.77) (3.03)
BoardSize 4.446 3.650 3.286 3.140 5.746
(1.22) (0.97) (0.87) (0.81) (1.55)
Size -3.263 -2.635 -2.337 -2.585 -4.668
(-0.76) (-0.60) (-0.54) (-0.60) (-1.08)
Capital -2.177 -0.790 -1.013 -0.760 -1.540
(-0.49) (-0.18) (-0.23) (-0.17) (-0.36)
Loan 2.687 1.567 1.556 1.491 1.527
(0.66) (0.38) (0.38) (0.37) (0.39)
Deposit -5.017 -2.898 -3.368 -3.195 -4.083
(-1.23) (-0.74) (-0.84) (-0.80) (-1.07)
Operating -0.0894** -0.0855* -0.0820* -0.0876* -0.0809*
(-1.99) (-1.86) (-1.77) (-1.92) (-1.75)
Opacity 0.712 1.038 0.875 1.021 0.156
(0.18) (0.25) (0.21) (0.25) (0.04)
CG -1.828
(-1.57)
RADI 0.0637
(0.02)
SupPow 0.854
(0.52)
Individualism -0.117
(-0.45)
EcoFreedom 1.238**
(2.42)
_cons 14.92 -2.201 -10.23 6.066 -91.08**
(1.04) (-0.13) (-0.54) (0.29) (-2.38)
N 96 96 96 96 96
Test for Tobit specification
LM-statistics 0.211 0.549 0.533 0.521 0.237
Critical value (10%) 3.645 4.446 5.282 4.248 3.799
See Table 4 for definitions of variables; z-statistics are in parentheses, with *, **, and *** denoting significance at 10%, 5% and 1% levels.
31
Panel 6B: Impacts of excess control rights of controlling shareholders on the presence of
directors related to controlling shareholders
Dependent variable : pct_Controlling
(1) (2) (3) (4) (5)
model
ExcessCR 0.506** 0.466** 0.466** 0.465** 0.506**
(2.55) (2.21) (2.30) (2.27) (2.52)
BoardSize 2.661 1.792 1.016 1.685 3.581
(0.71) (0.46) (0.26) (0.42) (0.94)
Size -3.642 -2.748 -2.139 -2.745 -4.561
(-0.84) (-0.62) (-0.49) (-0.62) (-1.04)
Capital -2.954 -1.056 -1.626 -1.047 -1.631
(-0.66) (-0.23) (-0.36) (-0.23) (-0.37)
Loan 0.599 -0.872 -0.713 -0.890 -1.193
(0.15) (-0.21) (-0.17) (-0.22) (-0.30)
Deposit -5.808 -2.866 -4.032 -2.926 -4.087
(-1.40) (-0.72) (-0.99) (-0.73) (-1.05)
Operating -0.0936** -0.0869* -0.0806* -0.0875* -0.0808*
(-2.06) (-1.86) (-1.72) (-1.87) (-1.73)
Opacity 4.392 4.997 4.222 5.001 4.618
(1.18) (1.30) (1.09) (1.30) (1.25)
CG -2.333*
(-1.97)
RADI -0.00232
(-0.00)
SupPow 1.832
(1.12)
Individualism -0.0272
(-0.10)
EcoFreedom 1.183**
(2.30)
_cons 32.67** 12.13 -7.143 14.05 -72.23*
(2.54) (0.79) (-0.37) (0.69) (-1.92)
N 96 96 96 96 96
Test for Tobit specification
LM-statistics 0.271 0.772 0.720 0.767 0.458
Critical value (10%) 4.197 4.508 4.414 3.741 4.754
See Table 4 for definitions of variables; z-statistics are in parentheses, with *, **, and *** denoting significance at 10%, 5% and 1%
levels

32
Table 7: Determinants of the presence of directors related to minority shareholders on the board
Panel 7A: Impacts of relative voting power of controlling shareholders on the presence of
directors related to minority shareholders
Dependent variable : pct_Minority
(1) (2) (3) (4) (5)
uo_BPI -0.378*** -0.299*** -0.314** -0.397*** -0.379***
(-3.18) (-2.80) (-2.62) (-3.14) (-2.98)
BoardSize 8.371* 11.72*** 13.33*** 12.65** 12.30**
(1.79) (2.84) (2.79) (2.53) (2.40)
Size 11.13** 5.743 7.660 9.525* 8.634
(2.26) (1.30) (1.55) (1.84) (1.60)
Capital 11.25** 8.705** 10.29** 7.557 7.434
(2.24) (2.02) (2.09) (1.49) (1.44)
Loan -4.064 -1.797 -2.522 -0.641 -1.131
(-0.78) (-0.39) (-0.50) (-0.12) (-0.21)
Deposit 9.512* 4.620 7.408 4.729 2.861
(1.83) (1.08) (1.50) (0.93) (0.56)
Operating -0.0416 -0.0725 -0.0697 -0.0621 -0.0660
(-0.66) (-1.22) (-1.19) (-0.94) (-1.00)
Opacity -7.889 -6.780 -4.892 -6.245 -6.729
(-1.51) (-1.52) (-0.99) (-1.18) (-1.27)
CG 4.532***
(3.03)
RADI 19.61***
(4.75)
SupPow -5.911***
(-3.03)
Individualism 0.400
(1.26)
EcoFreedom 0.555
(0.79)
_cons -13.42 -39.49** 84.51*** 2.295 -10.61
(-0.71) (-2.18) (3.90) (0.09) (-0.21)
N 96 96 96 96 96
Test for Tobit specification
LM-statistics 0.107 0.001 0.255 0.155 0.186
Critical value (10%) 4.659 4.242 5.422 4.499 4.163
See Table 4 for definitions of variables; z-statistics are in parentheses, with *, **, and *** denoting significance at 10%, 5% and
1% levels.
33
Panel 7B: Impacts of excess control rights of controlling shareholders on the presence of
directors related to minority shareholders
Dependent variable : pct_Minority
(1) (2) (3) (4) (5)
ExcessCR -0.599* -0.300 -0.570* -0.562 -0.529
(-1.84) (-0.98) (-1.76) (-1.63) (-1.55)
BoardSize 10.33** 12.48*** 15.57*** 13.99** 13.93**
(2.03) (2.77) (3.02) (2.56) (2.50)
Size 11.60** 5.638 7.741 9.899* 8.882
(2.27) (1.23) (1.54) (1.84) (1.58)
Capital 11.50** 8.150* 10.97** 7.610 7.377
(2.20) (1.82) (2.16) (1.43) (1.37)
Loan -1.285 0.462 -0.245 2.125 1.650
(-0.24) (0.10) (-0.05) (0.39) (0.30)
Deposit 8.821 3.353 7.571 3.579 1.984
(1.64) (0.75) (1.49) (0.67) (0.37)
Operating -0.0556 -0.0865 -0.0816 -0.0776 -0.0801
(-0.85) (-1.43) (-1.37) (-1.14) (-1.18)
Opacity -13.55** -11.65*** -9.383* -12.85** -12.87**
(-2.63) (-2.64) (-1.95) (-2.47) (-2.47)
CG 4.593***
(3.04)
RADI 19.97***
(4.69)
SupPow -6.794***
(-3.46)
Individualism 0.313
(0.95)
EcoFreedom 0.561
(0.78)
_cons -31.12* -55.14*** 79.60*** -10.57 -28.97
(-1.68) (-3.07) (3.66) (-0.42) (-0.55)
N 96 96 96 96 96
Test for Tobit specification
LM-statistics 0.114 0.004 0.291 0.148 0.184
Critical value (10%) 4.652 4.307 3.602 4.256 4.198
See Table 4 for definitions of variables; z-statistics are in parentheses, with *, **, and *** denoting significance at 10%, 5% and
1% levels.
34
Panel 7C: Impacts of the relative power of other controlling shareholders vis-à-vis the biggest
ultimate owner on the presence of directors related to minority shareholders
Dependent variable : pct_Minority
(1) (2) (3) (4) (5)
model
ControlOther 13.77* 14.95** 14.34** 13.69* 14.38*
(1.92) (2.47) (2.04) (1.81) (1.89)
BoardSize 8.913* 12.14*** 14.10*** 12.51** 13.03**
(1.84) (2.94) (2.91) (2.43) (2.47)
Size 12.36** 6.876 8.752* 10.81** 9.592*
(2.41) (1.56) (1.75) (2.01) (1.73)
Capital 8.818* 6.495 8.456* 5.318 4.989
(1.73) (1.53) (1.72) (1.02) (0.95)
Loan -0.818 1.054 0.119 2.239 1.930
(-0.16) (0.24) (0.02) (0.41) (0.36)
Deposit 6.657 2.507 5.700 1.634 0.137
(1.29) (0.61) (1.18) (0.32) (0.03)
Operating -0.0621 -0.0849 -0.0871 -0.0801 -0.0818
(-1.00) (-1.49) (-1.54) (-1.23) (-1.25)
Opacity -12.96** -10.45** -8.439* -12.04** -12.01**
(-2.57) (-2.53) (-1.80) (-2.37) (-2.36)
CG 4.442***
(2.93)
RADI 20.94***
(5.15)
SupPow -6.741***
(-3.49)
Individualism 0.269
(0.84)
EcoFreedom 0.710
(1.01)
_cons -37.89** -65.12*** 71.20*** -15.72 -47.68
(-2.04) (-3.80) (3.36) (-0.63) (-0.93)
N 96 96 96 96 96
Test for Tobit specification
LM-statistics 0.025 0.050 0.529 0.124 0.056
Critical value (10%) 5.041 5.719 4.170 5.051 4.471
See Table 4 for definitions of variables; z-statistics are in parentheses, with *, **, and *** denoting significance at 10%, 5% and
1% levels

35
Table 8: Role of institutional environment on determinants of the presence of directors related to
controlling shareholders on the board
Panel 8A: Role of institutional environment on impacts of relative voting power of controlling shareholders
on the presence of directors related to controlling shareholders
Dependent variable : pct_Controlling
(1) (2) (3) (4) (5)
model
uo_BPI (β1) 0.518*** 0.358*** 0.148 0.365*** -5.274
(3.07) (3.05) (1.18) (3.20) (-0.55)
uo_BPI * d_CG (β2) -0.308*
(-1.88)
uo_BPI * d_RADI (β3) -0.192
(-1.45)
uo_BPI * d_SP (β4) 0.419***
(2.53)
uo_BPI * d_Individualism (β4) -0.170
(-1.57)
uo_BPI * d_EcoFreedom (β5) -5.322
(-0.42)
Control variables Yes Yes Yes Yes Yes
N 96 96 96 96 96
Wald tests
(β1) + (β2) = 0 0.211**
(0.03)
(β1) + (β3) = 0 -
(β1) + (β4) = 0 0.567***
(0.00)
(β1) + (β5) = 0 -
(β1) + (β6) = 0 -
Test for Tobit specification
LM-statistics 0.152 0.578 0.419 0.288 0.392
Critical value (10%) 4.824 4.354 4.683 4.902 3.475
See Table 4 for definitions of variables; z-statistics are in parentheses, with *, **, and *** denoting significance at 10%, 5% and 1% levels.
36
Panel 8B: Role of institutional environment on impacts of excess control rights of controlling shareholders
on the presence of directors related to controlling shareholders
Dependent variable : pct_Controlling
(1) (2) (3) (4) (5)
model
ExcessCR (β1) 2.193*** 0.398* 0.283 0.637** 0.586**
(3.19) (1.75) (0.79) (2.43) (2.54)
ExcessCR * d_CG (β2) -1.784**
(-2.58)
ExcessCR * d_RADI (β3) 0.402
(0.76)
ExcessCR * d_SP (β4) 0.252
(0.62)
ExcessCR * d_Individualism
(β4)
-0.415
(-1.05)
ExcessCR * d_EcoFreedom
(β5)
-0.289
(-0.70)
Control variables Yes Yes Yes Yes Yes
N 96 96 96 96 96
Wald tests
(β1) + (β2) = 0 0.409**
(0.03)
(β1) + (β3) = 0 -
(β1) + (β4) = 0 0.535**
(0.02)
(β1) + (β5) = 0 -
(β1) + (β6) = 0 -
Test for Tobit specification
LM-statistics 0.063 0.855 0.608 0.551 0.696
Critical value (10%) 4.393 4.961 4.112 3.951 4.384
See Table 4 for definitions of variables; z-statistics are in parentheses, with *, **, and *** denoting significance at 10%, 5% and 1% levels.
37
Table 9: Role of institutional environment on determinants of the presence of directors related to minority
shareholders on the board
Panel 9A: Role of institutional environment on impacts of relative voting power of controlling shareholders
on the presence of directors related to controlling shareholders
Dependent variable : pct_Minority
(1) (2) (3) (4) (5)
model
uo_BPI (β1) -0.0772 -0.179 -0.137 -0.311** -0.423***
(-0.39) (-1.49) (-0.98) (-2.16) (-2.75)
uo_BPI * d_CG (β2) -0.371*
(-1.77)
uo_BPI * d_RADI (β3) -0.264*
(-1.76)
uo_BPI * d_SP (β4) -0.312**
(-2.08)
uo_BPI * d_Individualism (β4) -0.167
(-1.10)
uo_BPI * d_EcoFreedom (β5) 0.0942
(0.52)
Control variables Yes Yes Yes Yes Yes
N 96 96 96 96 96
Wald tests
(β1) + (β2) = 0 -0.448***
(0.00)
(β1) + (β3) = 0 -0.443***
(0.00)
(β1) + (β4) = 0 -0.449***
(0.00)
(β1) + (β5) = 0 -
(β1) + (β6) = 0 -
Test for Tobit specification
LM-statistics 0.100 0.099 0.059 0.127 0.218
Critical value (10%) 3.598 4.804 4.961 4.704 4.085
See Table 4 for definitions of variables; z-statistics are in parentheses, with *, **, and *** denoting significance at 10%, 5% and 1% levels.

38
Panel 9B: Role of institutional environment on impacts of relative power of other controlling
shareholders vis-à-vis the biggest ultimate owner on the presence of directors related to controlling
shareholders
Dependent variable : pct_Minority
(1) (2) (3) (4) (5)
model
ControlOther (β1) 23.42* 17.97** 25.35** 9.368 13.94
(1.74) (2.06) (2.05) (0.72) (1.21)
ControlOther * d_CG (β2) -12.82
(-0.85)
ControlOther * d_RADI (β3) -5.311
(-0.49)
ControlOther * d_SP (β4) -15.17
(-1.08)
ControlOther * d_Individualism (β4) 6.313
(0.41)
ControlOther * d_EcoFreedom (β5) 0.764
(0.05)
Control variables Yes Yes Yes Yes Yes
N 96 96 96 96 96
Test for Tobit specification
LM-statistics 0.024 0.020 0.0001 0.053 0.085
Critical value (10%) 3.783 4.154 3.856 4.811 5.232
See Table 4 for definitions of variables; z-statistics are in parentheses, with *, **, and *** denoting significance at 10%, 5% and
1% levels

39
Appendix
Figure A1. Example of a control chain
We have two minority shareholders: B5 and B6
We have three controlling shareholders:
- One direct controlling shareholder: B4, with 20% of control rights.
- Two indirect ultimate owners: D1 and D3, with respectively 40% (20% + 20%) and 30% of
control rights.
Coalitions are possible between D1 and D3, and between B4 and D1 to obtain a total control rights
of at least 51%.
B1 (20%) B2 (30%) B3 (20%)
C1 (10%) C2 (40%) C3 (40%)
D1
(50%)
D2
(10%)
D3
(40%)
Bank A
B4 (20%) B5 (5%)
D1 (30%)
B6 (5%)

40
Appendix 1
The Banzhaf Power Index (BPI)
A coalition is any group of players that join forces to vote together. The total number of votes
controlled by a coalition is called the weight of the coalition. A winning coalition is one with
enough votes to win. A losing coalition is one without enough votes to win. A player whose
desertion of a winning coalition turns it into a losing one is called a critical player. A player’s
power is proportional to the number of times the player is critical. The quota is the minimum
number of votes needed to pass a decision. The BPI for Player P is computed through five steps.
We provide an example using the chain of control presented in Appendix 1. Voting rights of B4,
D3, D1 are 20, 30 and 40, respectively. The quota is 51.
STEP 1: We determine all WINNING coalitions:
Winning Coalitions Explanation
{D1, D3}
{B4, D1}
Shareholder D1 and D3 together have enough control rights to win.
Shareholder B4 and D1 together have enough control rights to win.
There are 2 winning coalitions having two players.
{B3, D1, D3} The coalition containing all 3 ultimate owners wins.
STEP 2: Critical players are determined for each winning coalition. We count the number of votes
the coalition has without a particular Player, and if the coalition has no longer enough votes to
win, then that Player is critical. In our example, the critical players are underlined:
In {B4, D1}, both are critical since the coalition loses if either shareholder leaves.
In {D1, D3}, both are critical since the coalition loses if either shareholder leaves.
In {B4, D1, D3}, only D1 is critical since the coalition still wins if B4 leaves or if D3 leaves (but
not if D1 leaves).
STEP 3: We determine the number of times all players are critical: 5 (underlined above).
STEP 4: We determine the number of times Player P is critical: D1 is critical 3 times, D3 is critical
1 time, B4 is critical 1 time.
STEP 5: BPI(P) is the number of times Player P is critical (from STEP 4) divided by the number
of times all players are critical (from STEP 3):
BPI(D1) = 3/5 = 0.6; BPI(D3) = 1/5 =0.2; BPI(B4) = 1/5 = 0.2.
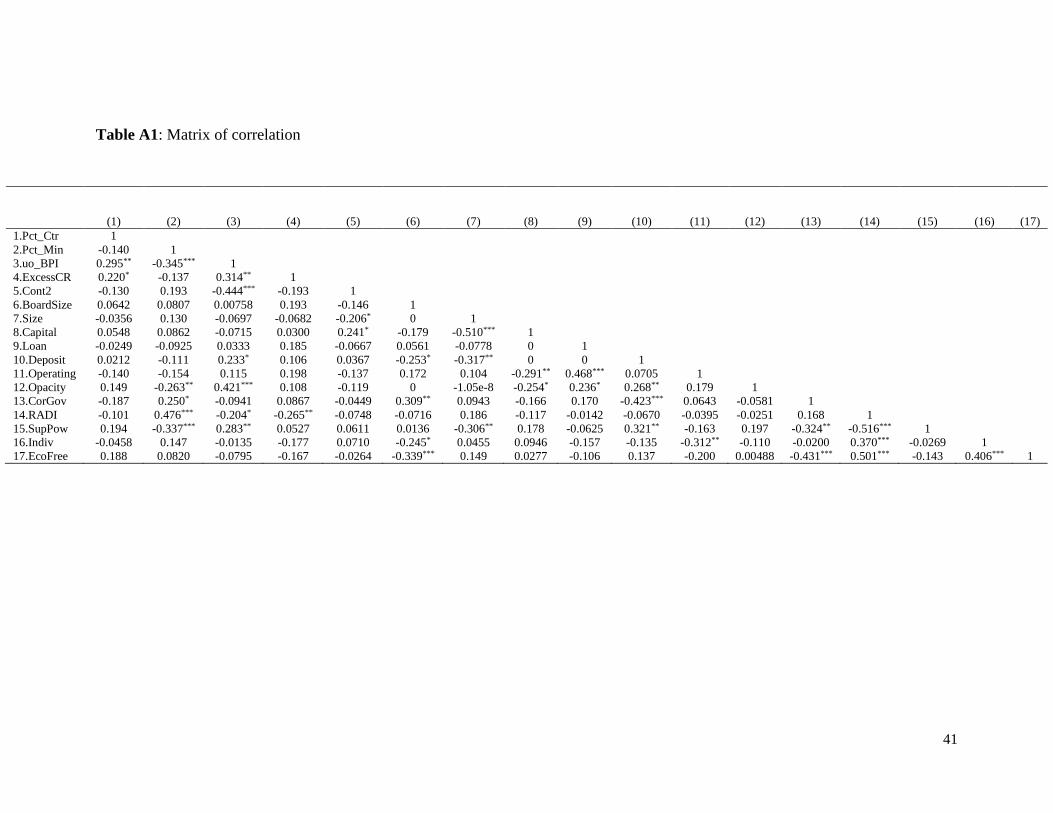
41
Table A1: Matrix of correlation
(1) (2) (3) (4) (5) (6) (7) (8) (9) (10) (11) (12) (13) (14) (15) (16) (17)
1.Pct_Ctr 1
2.Pct_Min -0.140 1
3.uo_BPI 0.295** -0.345*** 1
4.ExcessCR 0.220* -0.137 0.314** 1
5.Cont2 -0.130 0.193 -0.444*** -0.193 1
6.BoardSize 0.0642 0.0807 0.00758 0.193 -0.146 1
7.Size -0.0356 0.130 -0.0697 -0.0682 -0.206* 0 1
8.Capital 0.0548 0.0862 -0.0715 0.0300 0.241* -0.179 -0.510*** 1
9.Loan -0.0249 -0.0925 0.0333 0.185 -0.0667 0.0561 -0.0778 0 1
10.Deposit 0.0212 -0.111 0.233* 0.106 0.0367 -0.253* -0.317** 0 0 1
11.Operating -0.140 -0.154 0.115 0.198 -0.137 0.172 0.104 -0.291** 0.468*** 0.0705 1
12.Opacity 0.149 -0.263** 0.421*** 0.108 -0.119 0 -1.05e-8 -0.254* 0.236* 0.268** 0.179 1
13.CorGov -0.187 0.250* -0.0941 0.0867 -0.0449 0.309** 0.0943 -0.166 0.170 -0.423*** 0.0643 -0.0581 1
14.RADI -0.101 0.476*** -0.204* -0.265** -0.0748 -0.0716 0.186 -0.117 -0.0142 -0.0670 -0.0395 -0.0251 0.168 1
15.SupPow 0.194 -0.337*** 0.283** 0.0527 0.0611 0.0136 -0.306** 0.178 -0.0625 0.321** -0.163 0.197 -0.324** -0.516*** 1
16.Indiv -0.0458 0.147 -0.0135 -0.177 0.0710 -0.245* 0.0455 0.0946 -0.157 -0.135 -0.312** -0.110 -0.0200 0.370*** -0.0269 1
17.EcoFree 0.188 0.0820 -0.0795 -0.167 -0.0264 -0.339*** 0.149 0.0277 -0.106 0.137 -0.200 0.00488 -0.431*** 0.501*** -0.143 0.406*** 1