Determinants of Tax Revenue in Ethiopia (Johansen Co ......underground economy, in which Ethiopia is...
30
Determinants of Tax Revenue in Ethiopia (Johansen Co-Integration Approach) Workineh Ayenew Mossie, Lecturer, Department of Economics, Wachemo University, Address: Email: [email protected], Telephone: +251919188128 ABSTRACT In Ethiopia various efforts aimed at obtaining optimal fiscal policies with emphasis on the role of taxation as an instrument of economic development has been implemented. Despite such effort, the country’s economy rely substantially on loans and grants (24 % of GDP) to finance its investment requirement. This implies that the tax revenue of the country is at low level. Therefore, this study aimed to empirically examine the major determinants of tax revenue in Ethiopia for the period ranging from 1975-2013, using Johansen maximum likelihood co-integration approach. The result revealed that in the long run real GDP per capita income, foreign aid and industrial value added share of GDP positively and significantly affect tax revenue as percentage of GDP. However, inflation exerted a negative and significant influence. Whereas, in the short run only the level of real GDP per capita income, industrial value added share of GDP and inflation rate are statistically significant in determining tax revenue percentage of GDP. Real GDP per capita income and inflation have negative effect, whereas industrial Value added share of GDP has positive effect. Moreover, the coefficients of the lagged error correction term (ECM (-1)) is significant and negative as expected, which imply the existence of economic or government forces that restore the long run equilibrium from short run shocks. Finally, the study recommends measures such as a boost in per capita income growth, structural transformations, introduction of new tax bases and efficient utilization of foreign aid inflow have to be considered by the concerned bodies so as to bring efficient tax administration and enhance revenue growth. KEYWORDS: Tax Revenue, Ethiopia, Johansen Co-Integration Approach, Error correction 1. INTRODUCTION Economic development is one macroeconomic goal of each country in the world. Especially, in most developing economies the issue of economic development is still to be answered. While most developing countries are resource blessed, they face a problem of fiscal deficit, which make them
Transcript of Determinants of Tax Revenue in Ethiopia (Johansen Co ......underground economy, in which Ethiopia is...
Determinants of Tax Revenue in Ethiopia
(Johansen Co-Integration Approach)
Workineh Ayenew Mossie, Lecturer, Department of Economics, Wachemo University,
Address: Email: [email protected], Telephone: +251919188128
ABSTRACT
In Ethiopia various efforts aimed at obtaining optimal fiscal policies with emphasis on the role of
taxation as an instrument of economic development has been implemented. Despite such effort,
the country’s economy rely substantially on loans and grants (24 % of GDP) to finance its
investment requirement. This implies that the tax revenue of the country is at low level. Therefore,
this study aimed to empirically examine the major determinants of tax revenue in Ethiopia for the
period ranging from 1975-2013, using Johansen maximum likelihood co-integration approach.
The result revealed that in the long run real GDP per capita income, foreign aid and industrial
value added share of GDP positively and significantly affect tax revenue as percentage of GDP.
However, inflation exerted a negative and significant influence. Whereas, in the short run only the
level of real GDP per capita income, industrial value added share of GDP and inflation rate are
statistically significant in determining tax revenue percentage of GDP. Real GDP per capita
income and inflation have negative effect, whereas industrial Value added share of GDP has
positive effect. Moreover, the coefficients of the lagged error correction term (ECM (-1)) is
significant and negative as expected, which imply the existence of economic or government forces
that restore the long run equilibrium from short run shocks. Finally, the study recommends
measures such as a boost in per capita income growth, structural transformations, introduction of
new tax bases and efficient utilization of foreign aid inflow have to be considered by the concerned
bodies so as to bring efficient tax administration and enhance revenue growth.
KEYWORDS: Tax Revenue, Ethiopia, Johansen Co-Integration Approach, Error correction
1. INTRODUCTION
Economic development is one macroeconomic goal of each country in the world. Especially, in most
developing economies the issue of economic development is still to be answered. While most
developing countries are resource blessed, they face a problem of fiscal deficit, which make them
depend on foreign assistance to finance their development program. Therefore, better mobilization of
internal resources could help to reduce the fiscal deficit, and to better control the process of economic
development and reduce poverty. In least developed countries, efficient utilization of resources
remains poor so far and governments in these economies play greater role in stabilization of the
economy through various policy measures such as fiscal policy.
Implementation of fiscal policy, i.e. raising tax revenue is one means of transferring resources from
the private to the public sector(Wawire, 2011). Most governments in developing countries are aiming
at stimulating and guiding their economic and social development. According to Chaudhry and
Munir, 2010 governments often use different methods of raising resources like, borrowing, receipt of
aid, printing of money and taxation to stimulate their economic performance, of which taxation is the
most important source of government revenue. A progressively falling level of Official Development
Assistance (ODA), for most aid dependent countries also necessitate an efficient internal resource
mobilization system. For that matter, over the last few decades, many developing countries had taken
various reform programs like the introduction of value added tax (VAT) to increase the tax revenue
of the countries though the level of taxation is still remain poor (Haque, 2009).
Tax revenue instability might result in public spending instability which is of deep concern for Sub-
Saharan African (SSA) countries. This instability along with global economic crisis has brought into
a sharp focus on the importance of addressing the structural factors that depress economic and social
development (Fatás and Mihov, 2003).
Aggrey (2013) stated that
Being able to rely on domestic sources of funding in the form of taxes will allow African
states to reduce their dependency on official development assistance to fund development.
It will give African states the room to determine their own development priorities and fund
them accordingly without having to mollify donors who attach conditions to development
aid that often reflects the interests of the donor rather than the recipient (P.5) (emphasis
added).
Wilford (1978a), also emphasized that developing countries ought to increasingly mobilize their own
internal resources to enhance economic growth, through tax revenue generation. Fiscal imbalance
remains the problem of most developing countries for the past several decades. The reason is
attributed to rapid expansion of government expenditure and low revenue collection (Ansari, 1982).
Low tax to GDP ratio is a common feature of most SSA countries. According to UNDP (2014) half
of SSA countries rose 16.8% of GDP from tax revenue which is below the UN standard, 20% to
achieve the millennium development goal (MDGs). Ethiopia’s tax to GDP ratio in 2010 was 12.2%.
It was the lowest of its neighboring countries such as Kenya (17.7%) and Rwanda (14.1%) (Tilahun,
2014). This is to mean that tax revenue has different characteristics of an economy across nations.
This difference is attributed to determinants that are unique to different countries due to socio-
economic and political situations. In addition, most African economies, including Ethiopia are
characterized by large hard-to-tax sectors, such as small enterprises, small farms and a high level of
underground economy, in which Ethiopia is not the exception (Emerta, 2010; Dioda, 2012).
Global economic crisis coupled with uncertainty and instability of aid flows has given due attention
for governments to look for stable and sustainable modes of development finance (Bhushan and
Samy, 2012).In addition, excessive reliance on foreign financing may in the long run lead to problems
of debt sustainability, which together insist on LDCs to rely substantially on domestic revenue
mobilization (Gupta, 2007). One way of mobilizing domestic resource is achieved through raising of
revenue from taxation.
In Ethiopia, the total tax revenue as percentage of GDP is very low compared to its tax capacity.
According to International Monetary Fund (2013) over the period 1999/2000 - 2011/12 the average
tax revenue was 4.8% of GDP, derived from international transactions. The same report posited that
income tax were 3.7% of GDP and SSA’s average were 4.79% of GDP. Whereas, domestic tax on
goods and services stood at 2.4% of GDP, and SSA’s average were 7.2%. This is lower even to its
neighbors like Kenya (8.5%), Uganda (6.89%), and Tanzania (6.23%) of GDP. This shows that the
percentage share of tax revenue to GDP of Ethiopia is still lower than Sub-Saharan standard.
In Ethiopia various efforts aimed at obtaining optimal fiscal policies with emphasis on the role of
taxation as an instrument of economic development has been implemented ( Geda and Shimeles,
2005). Despite such effort, the country’s economy rely substantially on loans and grants (24 % of
GDP) to finance its investment requirement. Furthermore, for the period 2001 to 2010, the average
share of tax revenue, and total revenue and grants in GDP were 11.2 and 19.6 percent, respectively
(Bayu, 2015). This implies that the tax revenue of the country is at low level. The role of tax revenue
is imperative in bringing economic development, where its working or efficiency is determined by
different socio economic and political factors. Furthermore, the ability to generate adequate fiscal
revenue is determined by different socio economic and political factors, which may have different
effects on tax revenue either negatively or positively. Therefore, examining the effects of tax revenue
on economic performance, depends on identifying the factors affecting tax revenue and hence
understanding the rationale for low level of tax revenue pose remedial mechanisms to correct
prevailing problems of tax revenue.
It is infrequent to find country-specific time series studies on the issue as most empirical studies
performed to investigate the determinants of tax revenue rely largely on cross-sectional and panel
data set (Gupta, 2007; Mahdavi, 2008; Ghani, 2012; Leothold, 1991). In panel data set, it is not easy
to distinguish country-specific behavior of tax revenue determinants, and hence country-level time
series analysis is more appealing. Moreover, the above studies pointed that, factors affecting tax
revenue vary across countries which necessitate the need for country level analysis of tax revenue.
To the knowledge of the researcher, a study on the determinants of tax revenue in Ethiopia is scant.
Only a little has been dealt with the issue of tax revenue performance in Ethiopia. Few studies in the
literature like, studies by Geda and Shimeles (2005) attempted to investigate the tax performance of
Ethiopia. However, Geda and Shimeles studied only the tax performance of Ethiopia across regimes,
they did not try to show what specific factors contribute to the tax revenue generation of Ethiopia. On
the other hand, Bayu (2015) investigated the determinants of tax buoyancy (the ratio of percentage
change of tax revenue to percentage change of GDP), he did not attempted to search for determinants
that would impact tax revenue generation in Ethiopia. The study also did not incorporate policy
variables like, inflation and sectoral variables like, agriculture value added share of GDP and
industrial share of GDP. Therefore, it is invaluable to investigate the determinants of tax revenue in
Ethiopia with a special emphasis on the effect of sectoral share of the economy. The major objective
of this study is aims to:
Show trends and performances of Tax revenue in Ethiopia
Examine the long run and the short run effect of the determinants of tax revenue in Ethiopia.
2. REVIEW OF THE RELATED LITERATURE
Several studies have been undertaken to assess tax performance across different countries. Those
studies use tax share of GDP or tax ratio as the dependent variable with a combination of explanatory
variables; Such as, real per capita GDP, economic structure, foreign aid share of GDP, the total stock
of debt to GDP, as potential determinants of revenue performance. Because of the sensitivity to the
set of countries and the sample period taken, empirical findings have been mixed and several
empirical studies i.e. Leuthold (1991), Stotsky and WoldeMariam (1997) have looked into
determinants of resource mobilization at regional level. Existing literatures about the poor level of
economic development, and meager performance of tax revenue in most African economies is
attributed to the widespread corruption levels and poor institutional setups. Hence, economic structure
has been one of the main factors, which results in poor tax performance in both developing countries
(Ghura, 1998) and developed countries (Tanzi & Davoodi, 2000).
Tanzi and Davoodi (2000) make an effort to empirically evaluate the effect of variables such as; real
per capita income and the agriculture share in GDP. Accordingly, the result posited that agriculture
had a significant negative effect on government tax revenue. Whereas, per capita income exert a
positive impact on tax revenue. Gupta (2007) studies the determinants of tax revenue efforts in 105
developing countries using panel data set over time period of 25 years. According to Gupta, several
structural factors like, previous year per capita GDP, the share of agriculture in GDP and trade
openness are significant and strong determinants of revenue performance. He also looked at the effect
of foreign aid on revenue mobilization; aid have positive but weak relation with tax revenue
performance. His findings imply a strong negative and significant relationship between agriculture's
share, and revenue performance,
Ahmed and Mohammed (2010) on the determinants of tax buoyancy of 25 developing countries from
1998-2008, revealed that growth in manufacturing sector has a positive impact on growth of tax
revenue. Unlike the previous studies, this study found positive and significant impact on the service
sector on tax buoyancy due to the development of the service sector in 1990s. Ghani (2012) studied
a cross country analysis of tax performance using a panel data set that covers 104 countries over the
period 1996-2005. Accordingly, similar to Gupta (2007), Ghani found that per capita GDP, has a
significant positive contribution on tax to GDP ratio across countries. Pessino and Fenochietto (2010)
studied the determinants of tax revenue efforts and tax capacity of 96 developing countries. They
have found that per capita GDP, and education (measured by education expenditure %of GDP) have
exert a positive and significant influence on tax revenue % of GDP. The study also indicated that
inflation (CPI), and ease of tax collection (agriculture value added percentage of GDP) have
detrimental effect on tax revenue (%GDP) performance of developing countries.
Besides, the above panel data analyses, there are few studies which examine the issue in a single-
country framework; Rajan (1996) tried to investigate the stability of the determinants of personal
income tax which is influenced by drastic changes in the political scenario during the study period.
To this end a multivariable linear time series regression equation has been estimated and the analysis
reveal that the variables such as literacy rate, and per capita GDP have a positive impact on personal
income tax. Theoretically, it has been believed that foreign aid leads to a decline in public savings
through lowering tax revenues, and most developing countries are associated with inefficient
utilization of aid inflow, due to high corruption in these countries (Mahdavi, 2008). However,
efficient allocation of aid on the productive investment projects would result promising level of tax
revenue in the long run (Pack & Pack, 1990) cited in (Osei et al., 2003). But, Abeba (2002) found
that both foreign loan and foreign grant have no significant impact on the government tax revenue
both in the long run and in the short run.
Applying Johansen co-integration and Error Correction Model (ECM), Teera (2003) has also found
that aid has stimulating effect on tax revenue in the long run, but it has negative effect in the short run
in Uganda. Tax revenue is highly responsive to manufacturing share of GDP and GDP per capita in
the long run, though the effect of GDP per capita is negative with coefficient of -0.96.
Karagöz (2013) studied the determinants of tax revenue in turkey with special emphasis on sectoral
composition of the economy from 1970 to 2010 using Johansen co integration approach. The study
measured tax revenue as a ratio to GDP and using a linear model, estimation results unveil that tax
revenue is significantly affected by agriculture share in GDP, industrial share in GDP, While
industrial share of GDP affects tax revenue to GDP share positively by 18.6%, agriculture results in
a detrimental effect on it (-43.7%) in the long run.
Muibi and Sinbo (2013) attempts to examine the macroeconomic determinants of tax revenue in
Nigeria for the period 1970 to 2011 and applied Johnson co integration approach and error correction
model. The study has revealed that in Nigeria, the level and growth rate of economic activity affect
tax revenue positively. The study also revealed that any past deviation in tax revenue will be corrected
towards long run steady state by 47% speed of adjustment in period under consideration. Applying
similar methodology, Bayu (2015) studied in the analysis of tax buoyancy and its determinants in
Ethiopia from 1974 to 2010. The result posited that in the long run, industrial value added share of
GDP has positive effect but insignificant on tax buoyancy in Ethiopia. However, the effect of official
development assistance is negative both in the long run (-6.53) and in the short run (-2.098). The
study noted that 48.7 percent of the deviation in tax revenue is adjusted each year towards its long
run equilibrium.
Aggrey (2013) attempted to empirically investigate the factors affecting tax revenue in Ghana from
1988 to 2008. Employing ARDL model, real GDP exerts a negative and significant influence both in
the long run and in the short run. It revealed that 1% increase in real GDP results in reduction in tax
revenue to GDP ratio by 5.3564%. The study also pointed out that any short run shock can be
converged to its long run equilibrium by 46 percent each year. Similarly Basirat et al. (2014) applied
ARDL model to examine the effect of economic variables on total tax revenues for Iran economy for
a period of 1974 to 2011. The finding showed that the value-added of industry sector with coefficient
of 1.0841 had a positive and significant effect on total tax revenues. On the other hand, the value-
added of agriculture sector with coefficient of 1.1801 had a significant negative impact on total tax
revenues. The study revealed that the speed at which tax revenue adjusts to its long run steady state
(i.e. measured by error correction term) is 57% annually.
Research Gap
Much of the earliest studies in the empirical literature are focusing on cross country comparison of
tax effort. However, each of these countries on which studies pay much focus have different capacities
in raising tax revenue. In addition, these countries have different level of economic development
along with the difference in natural resource endowments. Even within sub Saharan African countries,
Ethiopia’s tax performance is very low compared to its neighbors; like, Kenya and Uganda. Studies
concentrating on sub Saharan Africa have used panel data analysis to identify major determinants of
tax effort in the region. Despite this, these factors influencing tax revenue do not fully explain the
variation in tax performance among countries under consideration. This is because each countries
have unique features from others. The literature has shown that factors affecting tax revenue has put
the bases on which elasticity and buoyancy of tax revenue is established. However, much has not
been dealt on tax revenue efforts, particularly in Ethiopia.
As highlighted by the above analyses of recent econometric studies, there is no clear pattern of the
significance of all the various potential determinants of tax performance in developing countries.
Although, some results vary according to the period analyzed and the sample of countries chosen, in
general, indicators like GDP per capita, degree of financial deepening, higher degree of openness,
urbanization rate, external debt, industrial share of GDP, and literacy rate have significant influence
on tax revenue, and are usually associated with a higher level of taxation. Moreover, inflation, and
share of agriculture to GDP are negatively associated with tax revenue. Most studies on the
determinants of tax revenue are panel analysis, which implying previous researchers give a little room
for a single country time series analysis. This review also asserted that the existing literature on
Ethiopia’s tax revenue determinants is virtually scant. Thus, the present study investigates the
determinants of tax revenue from the context of Ethiopia by including the most recent data applying
Johansen co -integration approach.
In general, due to high empirical relationship, in this study variables such as real GDP per capita,
inflation rate, education and foreign aid are used as the main variable in the model. Also, to capture
the effects of sectoral composition of the economy on tax revenue, agriculture value added share of
GDP and industrial value added share of GDP are also included in the empirical model.
3. DATA SOURCE, MODEL SPECIFICATION AND METHODOLOGY
In this study a time series data ranging from 1975 - 2013 were used to analyze the determinants of
tax revenue in Ethiopia. The choice of time were dictated by data availability. All data’s were
secondary and gathered from different local and international organizations like; Ministry of Finance
and Economic Development (MoFED), National Bank of Ethiopia (NBE), and the Ethiopian
Economic Association (EEA) database, and World Bank (World Development indicators (WDI)).
3.2. Model Specification
The assessment of actual and potential tax performance of any country is a matter of judgment that
should be based on a consideration of the stage of development and structure of the economy and
should also take account of national traditions and relevant special circumstances (Chelliah, 1971).
Therefore, to analyze statistically the determinants of tax revenue in Ethiopia, an estimate of a model
will help to see the functional relation of tax revenue to economic development and structure of the
economy.
Various studies included different variables while analyzing the determinants of tax revenue across
the world. For instance, Teera (2003) tried to estimate the tax share of Uganda, by incorporating
import share of GDP, gross domestic product per capita, foreign aid (%GDP), Manufacturing value
added (%GDP), agriculture value added (%GDP) and population density as tax correlates. Whereas,
Chaudhry and Munir (2010) included the following variables in estimating tax revenue in Pakistan:
Tax base (agriculture value added (%GDP), manufacturing value added (%GDP), service value added
(%GDP), per capita income, and openness), economic policy variables (exchange rate, inflation and
monetization or M2), foreign aid, political stability, remittance and social variables (urbanization,
literacy rate). Karagöz (2013) extends the model, including total stock of debt, agriculture value added
(%GDP), industry value added (%GDP), money supply (M2 %GDP), urbanization rate and openness.
Sinbo and Muibi (2013) studied the macroeconomic determinants of tax revenue in Nigeria by
incorporating; real GDP, openness, exchange rate, inflation and external debt.
However, in developing the tax model including all variables is impossible due to unavailability of
data and small sample size problem. Therefore, following empirical literatures, this study attempts to
empirically investigate the effect of policy variable (inflation), tax base (agriculture value added share
of GDP, industrial value added share of GDP and real GDP per capita income), education and foreign
aid on tax revenue percentage of GDP. Therefore, in this study the model is specified as: TRt = f
(AGRIt, CPIt, INDUt, RGDPPCt, ODAt, EDUt,); Where, TR is tax revenue as percentage of GDP at
period t. Specifically, the log transformation of the model is as follows:
LTRt = α +β1LAGRIt + β2LCPIt + β3LINDUt + β4LRGDPPCt + β5LODAt + β6LEDUt+ εt……… (1)
Where, α is intercept term and β1, β2,………………………………β6 are long run coefficients.
LTRt = Natural logarithm of tax revenue (%GDP) at time t
LRGDPPCt = Natural logarithm of gross domestic product per capita at time t
LEDUt = Natural logarithm of government expenditure on education (%GDP) at time t
LCPIt = Natural logarithm of consumer price index at time t
LODAt = Natural logarithm of net official development assistance at time t
LINDUt = Natural logarithm of industrial value added (%GDP) at time t
LAGRIt = Natural logarithm of agriculture value added (%GDP) at time t
Service value added as percentage of GDP, urbanization, foreign debt and import share GDP could
also be included in the model. However, due to multicollinearity problem this specification has not
been applied.
All variables in the model are transformed into logarithm form and hence log linear form of the model
is used for tax revenue model as opposed to linear model. This is because log linear model is preferred
to the linear model in that it helps to control the size of data and results in consistent and reliable
estimates (Gebeyehu, 2013). Furthermore, log linear model produces better results than linear form
of the model; i.e., logs are used in economics because the estimated coefficients in log regressions
have a good interpretation. Economists often think in terms of elasticity’s, and log regressions have
coefficients that estimate elasticity’s. It helps to interpret as percentage change instead of as a
marginal effect (Benoit, 2011).
Follow the description and expected sign of variables in table 1
3.3. Method of Data Analysis
The study employed both descriptive and econometric analysis. While the descriptive analysis helps
to capture the trend analysis, econometric analysis is employed to capture the short run and long run
relationship between tax revenue and its determinants. The Stationarity of the data used in the analysis
is first checked using Augmented Dickey Fuller (ADF) test. The study has also employed diagnostic
tests like, multicollinearity test, heterosckedasticity test, stability test, autocorrelation test and RESET
test. The study used Error Correction Mode (ECM) for short run analysis and applied Johansen Co-
Integration Method for long run equilibrium analysis.
4. RESULTS AND DISCUSSIONS
4.1. Results of Descriptive Analysis
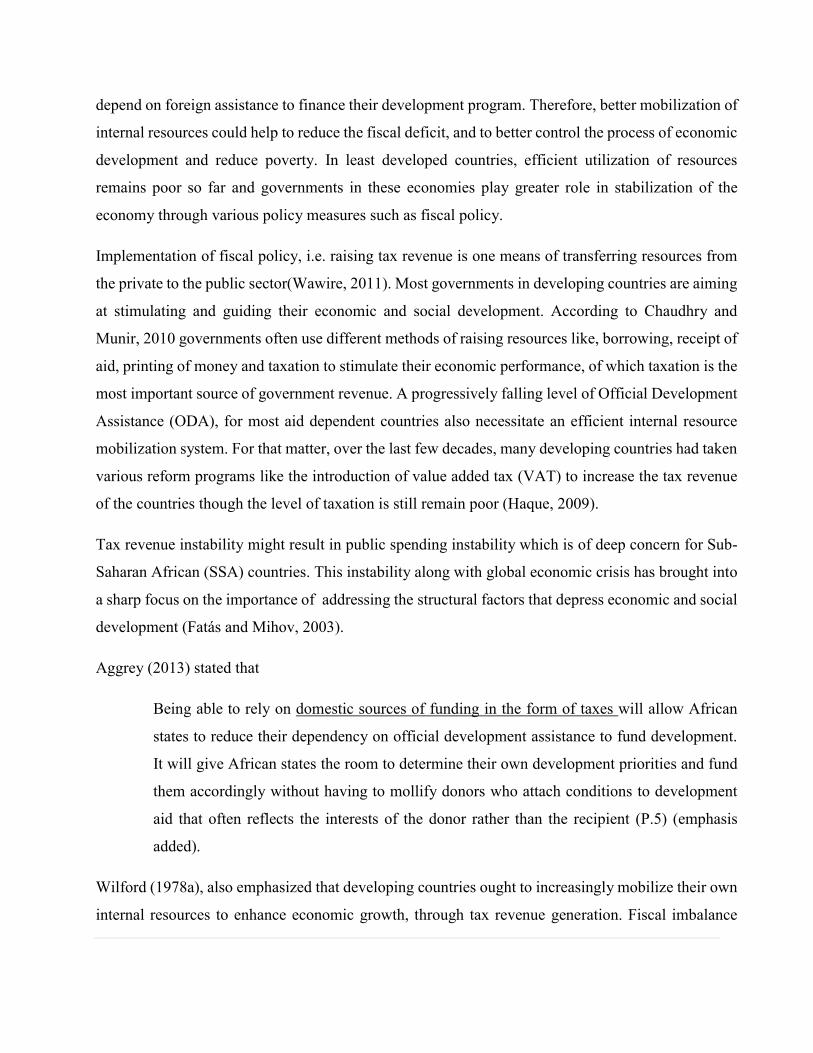
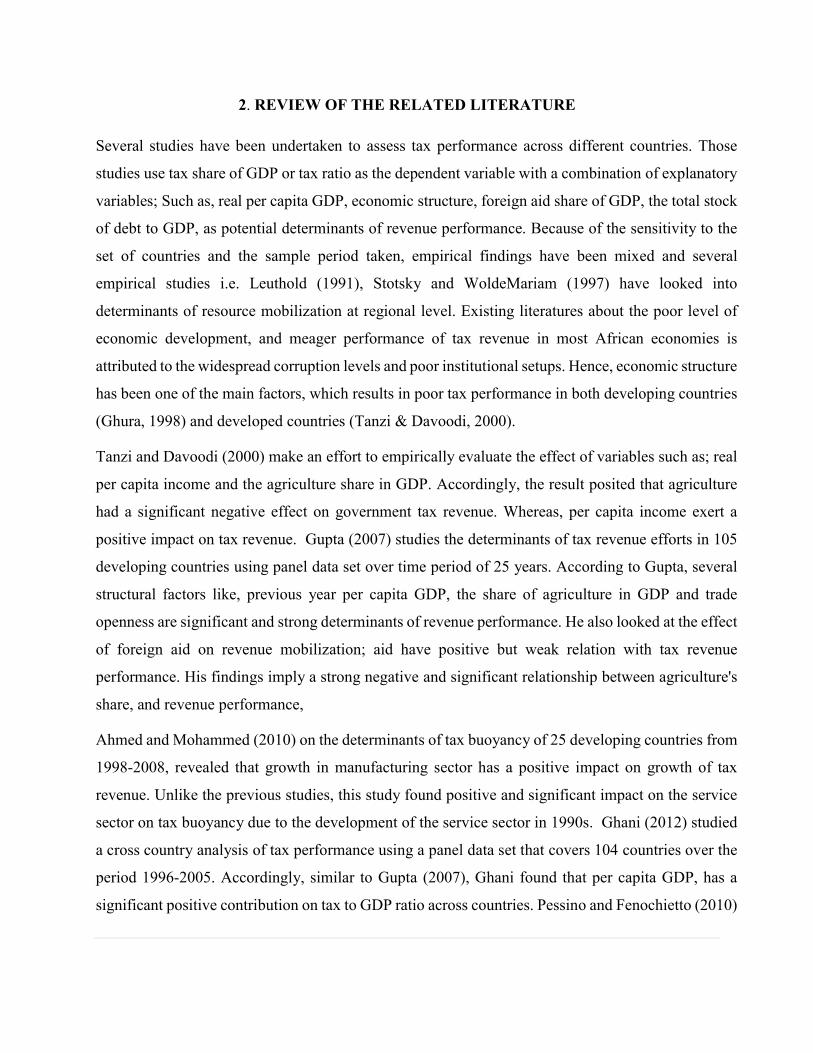
Industry Value Added
The industrial sector is among determinants affecting tax revenue in Ethiopia. The industrial share of
GDP has registered a sustainable growth with only slight fluctuations from 1975 to 1985. The
maximum share 12.6% was recorded in 1985, which might be due to low agricultural sector
performance associated with the drastic drought that had hampered the sector leading to low GDP
record. Though in the early periods of the EPRDF regime, industrial share of GDP has been growing,
the unexpected Eritrean aggression in 1998/99 has resulted in abrupt fall in industrial value added.
The industrial share of GDP stood at 12%, for the period 1992 to 2013; since 1992 the average annual
growth rate of the share was 4.7%, which imply that the industrial sector has gained a strong
momentum of growth since recent years see figure 4.1. According to AEO (2014), the industrial sector
was the highest performer in 2012/13 by registering 18.5% annual growth rate, which was buoyed by
the construction boom and expansion in mining and manufacturing subsectors
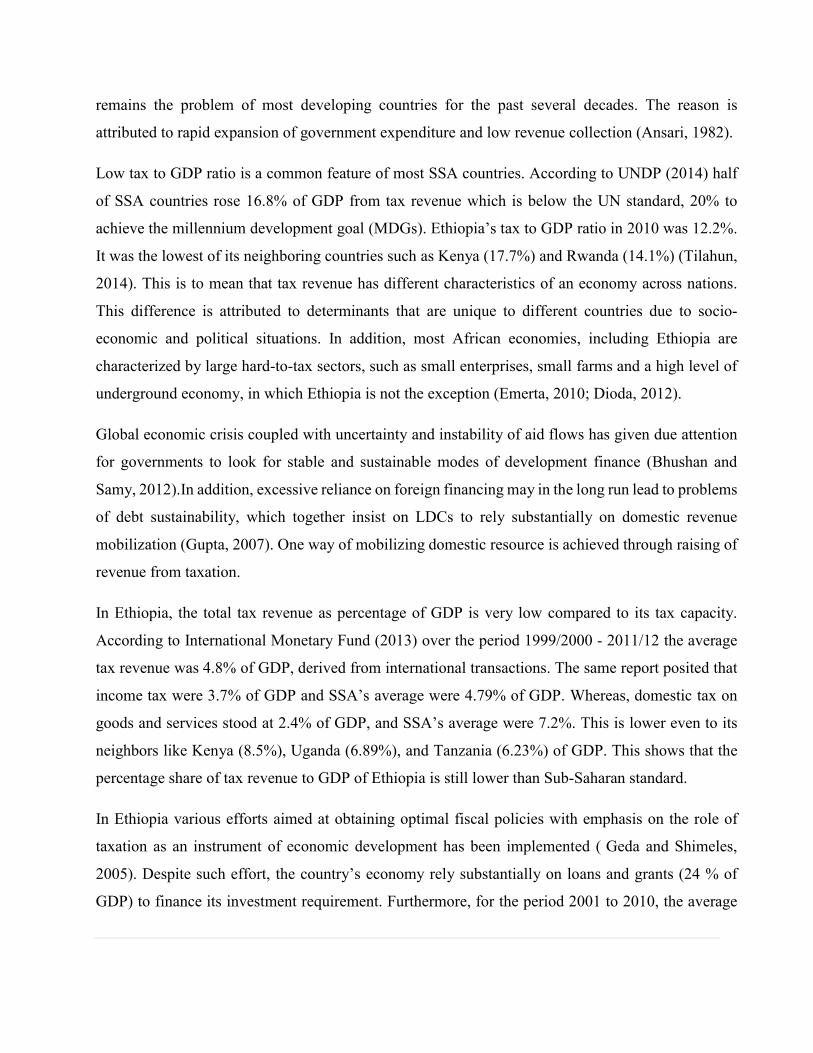
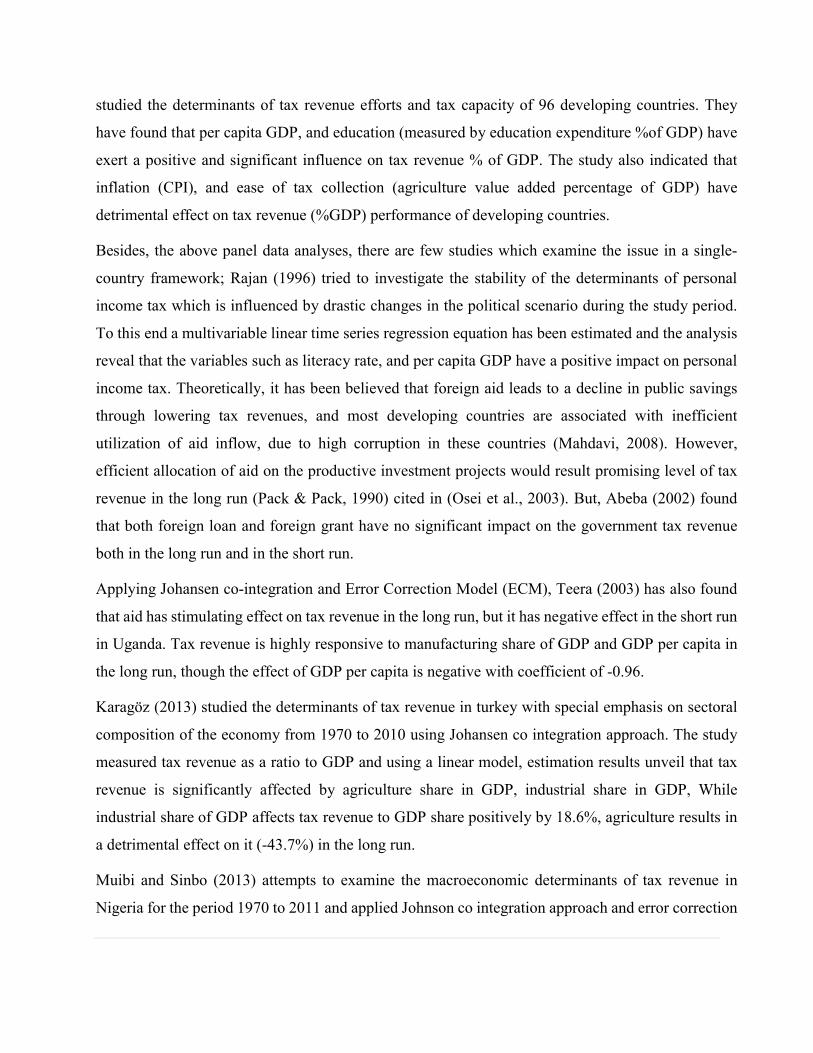
Agriculture and Tax Revenue
Agriculture remains as the pillar of Ethiopian economy from time antiquity. It constitutes the lion’s
share of export items, input for industries, source of employment and as a sources of food. The
development of the Ethiopian economy heavily depended upon the rate of agricultural growth, and
the rate of agricultural growth in Ethiopia in turn depends on the efficiency of subsistence production
system. Agriculture share of GDP was the highest during the Derg regime, compared to the current
regime. The share remained above 50%, except for 1985 and 1986. Only during 1985 devastating
drought, agricultural production shares fall 47% of GDP. From figure 4.2 we observe that tax revenue
and agricultural value added are less dependent, indicating tax bases are not dependent only on one
sector.
Real GDP per capita income
Increase in per capita income is a desirable macroeconomic goal, which aims at raising the standard
of living of the society. Increase in real GDP per capita income enhance the capacity of inhabitants
of a country to pay their tax liability. In countries like Ethiopia, where income tax share significant
part of direct tax, increase in income of each individual contributes much to tax revenue. Also, with
economic growth the demand for public services expanded and the purchasing ability of peoples will
improve. Besides, economic development is associated with broadening the tax base which helps to
increase domestic product per capita income.
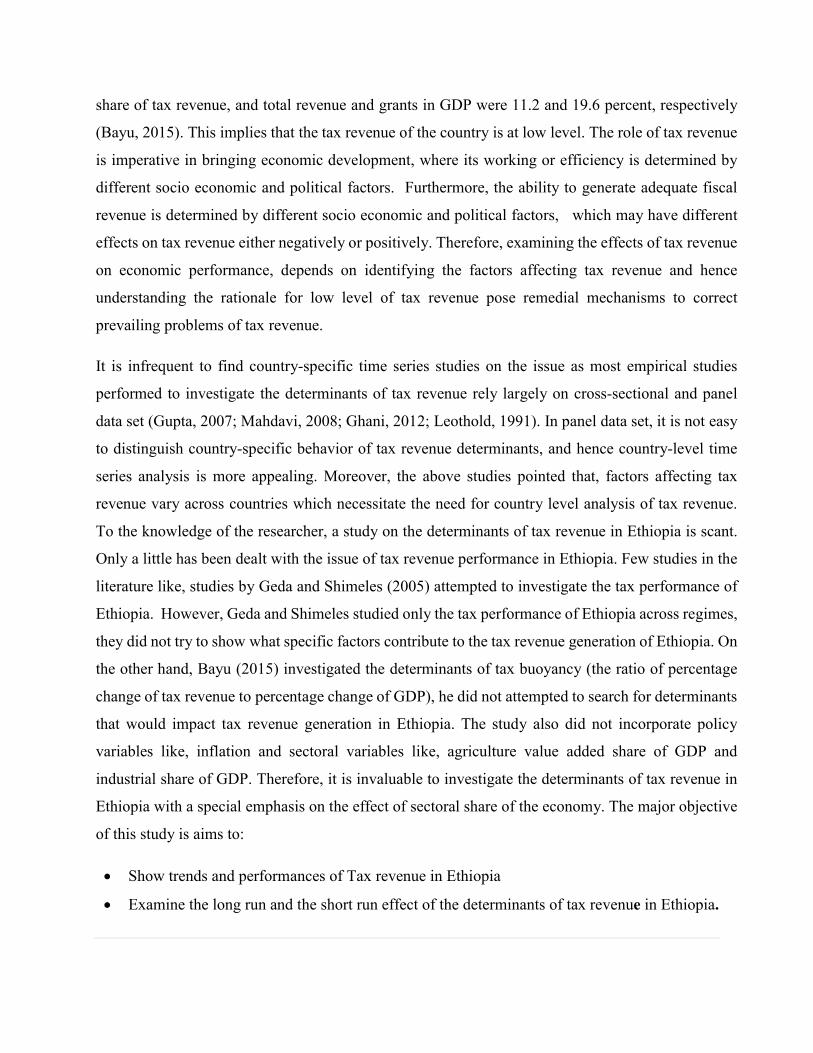
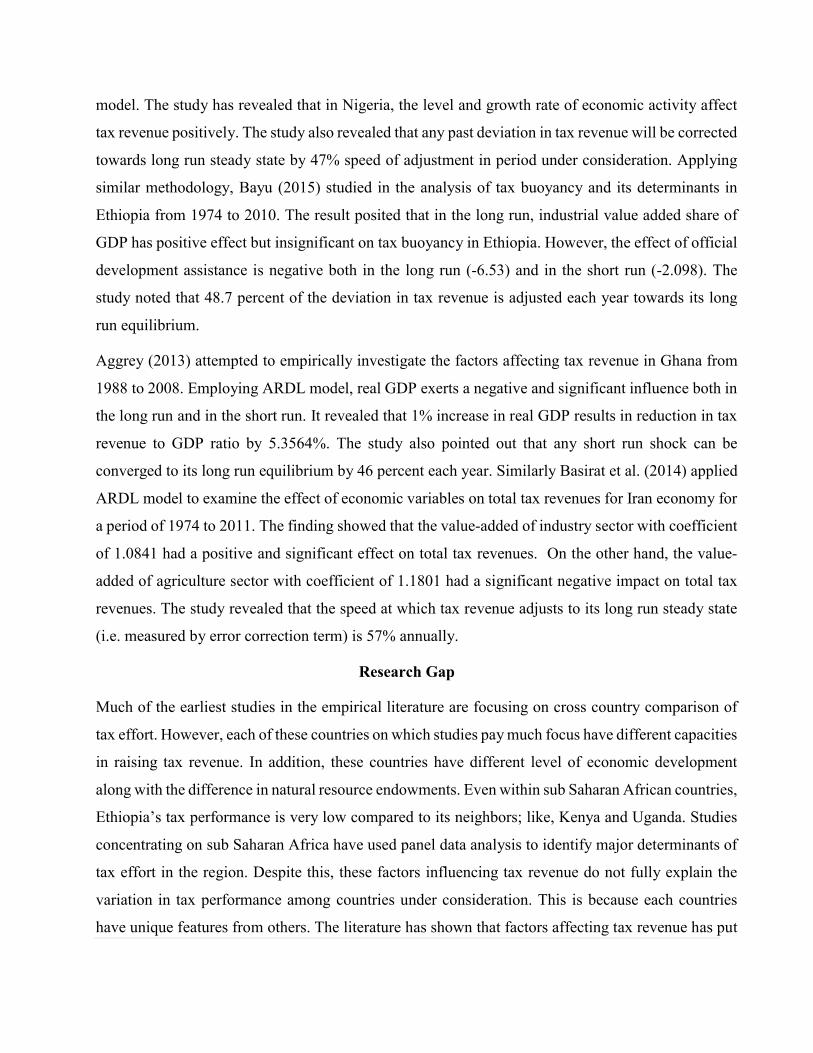
As depicted in figure 4.4, the annual growth rate of tax revenue to GDP ratio had been declining from
1975 to 1991. It declined from 25.6 percent in 1977 to -26.8 percent in 1992. This frequent ups and
downs in the growth rate of tax revenue (%GDP) was because of the ineffective economic and tax
reform programs that had been brought by the Derg regime. Similarly, the growth rate of real GDPPC
was consistently declining till 1985 (-12.2%), which is due to the harsh drought during the period,
but growth rate of real GDPPC get back to 10.8% in 1987 associated with increase in agricultural
production due to good harvesting season. Since 2004 real GDPPC growth rate secured almost stable
growth. Despite frequent ups and downs, growth rate of tax revenue (%GDP) and real GDPPC follow
a similar trend over time, which help to deduce that RGDPPC will have a positive effect on tax
revenue in the long run.
4.2. Econometrics Estimation Results and Interpretations
4.2.1. Results of Unit Root Test
Test for Stationarity is a prerequisite for consistent and valid inference of time series models and co-
integration analysis. Unit root implies that the time series data are non-stationary. The results of using
non-stationary time series may be spurious. It may imply as if a relationship is existed among
variables, when no relationship is actually existed.
Therefore, so as to get consistent and reliable estimates of the model, a non- stationary data must
be converted into stationary by differencing. In this study, the Augmented Dickey Fuller (ADF)
test is employed to test the Stationarity of the variables and the test result is given in table 2. The
test has shown that all variables are stationary at first difference; i.e., I (1). Therefore, Johansen
maximum likelihood approach can be applied to test the presence of co-integrating relationship
among variables.
4.2.2. Optimal Lag Selection Results
The need for optimal lag is aroused because of the sensitivity of Johansen co-integration analysis to
the number of lags included in the model. It appears that, in general, too few lags results in rejection
of the null hypotheses too easily, while too many lags decrease the power of the test (Verbeek, 2004).
This indicates that there is some optimal lag length. Therefore, selection of optimal lag length helps
to avoid loss of initial values. As shown in the table 3 the selected optimal lag length is one. This is
because all lag selection criteria’s (i.e., LR, FPE, AIC, SIC and HQ) suggest an optimal lag of one at
5% level of significance.
However, one cannot conclude as the optimal lag is one only looking the selection criteria. Hence, to
further confirm the relevance of the chosen optimal lag length for all variables, a test of lag exclusion
[Wald lag exclusion test] is conducted see table 4. It shows that the inclusion of a single lag length
for each variable individually and for all the system jointly is significant for all variables at 1% level
of significance.
4.2.3. Johansen Co-Integration Analysis
The Johansen method is used for the test of co-integration as it is superior over the Engle-Granger
method in allowing for the test of more than one co-integrating vectors (Verbeek, 2004). Theories
state that econometric analysis with non-stationary variables makes no sense. The only exception is
if a regression of one non-stationary variable over another non-stationary variable yield a stationary
series and if so, it is known as co-integrating regression.
The trace test tests the null hypothesis of r co-integrating vectors against the alternative hypothesis of
k co-integrating vectors, where k is the number of endogenous variables, for r=0,1,2…,k-1. Whereas,
the maximum Eigen-value, tests the null hypothesis of r co-integrating vectors against the alternative
hypothesis of r+1 co-integrating vectors. Accordingly, in this study both trace test and maximum
Eigen value test indicate the presence of one co-integrating vectors at 5% critical value. This is
because both tests failed to reject the null of at most one co integrating equations. Hence, there is a
unique co-integrating vector in the system. The result is shown in table 5.
One co-integrating equation is justified based on Johansen co-integrating coefficients, hence only the
first column of alpha ( ) coefficients in table 6 and first row of beta ( ) coefficients in table 7 are
important. When the variables are out of long-run equilibrium, there are economic forces, captured
by the adjustment coefficients that push the model back to long-run equilibrium. The speed of
adjustment toward equilibrium is determined by the magnitude of α coefficients. While the negative
coefficients show convergence, a positive coefficient implies deviation from long run equilibrium.
As reported in table 6, the adjustment coefficients of LTR, LCPI, and LINDU are negative, which
indicate the speed of adjustment towards their long run equilibrium. This implies that 79.8, 16.35,
and 7.4 percent of the disequilibrium error for the above variables is corrected in one time period,
respectively.
Once we check the existence of one co-integrating relationship between the variables in the tax
revenue model, the presence of weak exogeneity can be tested. Weak exogeneity helps to identify the
endogenous and exogenous variables entering into the model. Rejection of weak exogeneity implies
that the variables under investigation are endogenous (Maddala, 2001). This requires imposing zero
restriction on the first column of coefficients. The results, using the likelihood ratio (LR) test as
shown in table 8 confirm that only the dependent variable rejects weak exogeneity at 1% level of
significance; i.e., all variables other than the dependent variable (LTR) are exogenous at any
conventional level of significance. Therefore, the long run relationship can be formulated by taking
LTR as endogenous and all other variables as exogenous variable.
Once the long run relationship is defined, the next task is to formulate test of significance on the long
run parameters. This test requires imposing restriction on coefficients, which is known as exclusion
test. It helps to determine variables which are statistically significant in the co-integrating vector. The
result of the test alongside their respective probability values are reported on table 9.
As can be seen in table 9, real GDP per capita income, inflation, industrial value added share of GDP
and official development assistance have significant effect on tax revenue percentage of GDP in the
long run. Whereas, agricultural value added share of GDP and Education are not significant
determinants of tax revenue in the long run. The long run relationship derived from the co-integrating
vector normalized with respect to LTR can be represented as:
LTR= 1.56 + 0.11 LAGRI +0.38 LRGDPPC - 0.68 LCPI + 0.42 LINDU+ 0.97 LODA + 0.12 LEDU
(0.647) (0.000***) (0.000***) (0.006***) (0.024**) (0.227)
In the long run real GDP per capita income, industrial value added share of GDP and official
development assistance have a significant and positive effect on tax revenue percentage of GDP.
Conversely inflation has a negative and significant effect on tax revenue in the long run. Whereas,
agriculture value added share of GDP and education have insignificant effect on tax revenue
percentage of GDP in the long run.
The long run model shows that tax revenue is positively and significantly influenced by gross
domestic product per capita income in the long run. The result is interpreted as a 1% increase
in real GDP per capita income results in a raise in tax revenue percentage of GDP by 0.38 %,
citrus paribus; i.e., tax revenue as percentage of GDP does not increase as much as the raise
in real GDP per capita, which might be due to tax evasion and income tax rate is constant for
incomes greater than 5000 birr. It is not progressive for incomes of above 5000 birr. The result
of this study is in line with the findings of Chelliah (1971);Gupta (2007) and Karagöz (2013).
Moreover, the empirical result is also in agreement with the descriptive analysis. The result
lends support to argue that with economic development especially at the initial stages of
development, the demand for public services will increase and as a result, tax revenue increase
to finance the raising demand for expenditure.
Inflation measured by consumer price index (CPI) found to have significant long run effect
on tax revenue in Ethiopia. A 1% increase in inflation, results in 0.68% of reduction in tax
revenue, which is strong effect that could put the government under stress, if inflationary
pressure is hiking. This is attributed to the increase in cost of living associated with the loss
of purchasing power of money, which could ultimately reduce real value of tax collected.
According to Tanzi (1989) in developing countries, there exists a sizable time lag between the
actual tax collection and the transaction to be taxed, in which tax at time of payment is small
in real value as tax obligations become lower (i.e. Olivera -Tanzi Effect) Furthermore, with
skyrocketing price, tax evasion will increase and informal economy might be expanded, and
consumers may switch to spend on items which are less likely to be taxed. The result of this
study is congruent with the findings of Ghura (1998) and Agbeyegbe, Stotsky and
WoldeMariam (2004).
Industrial value added share of GDP also has positive and significant long run effect on tax
revenue, in the study period. The result is as expected and has the coefficient of 0.420426,
which can be interpreted as a 1% increase in the share of industry to GDP will boost tax
revenue approximately by 0.42 %, other things kept constant. Industrial sector is positively
related with tax revenue as predicted in theory that manufacturing enterprises are producing
items that are easier to tax meanwhile, business owners typically keep better and organized
records of their activities. The result lend support to argue that increase in the share of
industrial sector to GDP would contribute more to tax revenue through increasing corporate
income tax. The finding is consistent with the results of Teera (2003) for Ugandan economy
and Basirat et al. (2014) for Iran economy.
Foreign aid also matter in domestic revenue mobilization. ODA is found to exert a statistically
significant effect on tax revenue in the long run, at 5% significance level. The sign of ODA
coefficient is positive contrary to priori expectations. The result revealed that a 1% increase
or decrease in the net ODA, results in 0.97% increase or decrease in tax revenue in the long
run. The result support the hypothesis that official development assistance has stimulating
effect on domestic revenue mobilization (i.e., increase tax effort). Gupta et al. (2003) stated
that if foreign aid is primarily in the form of loans, then the tax burden of future loan
repayment will be higher so that this will give incentive to enhance domestic tax effort. The
result shows that foreign aid is a stimulating factor for tax revenue, rather than serving as a
substitute to tax revenue to finance fiscal deficit. The result of this study is consistent with
Teera (2003) of Uganda, and Gupta (2007).
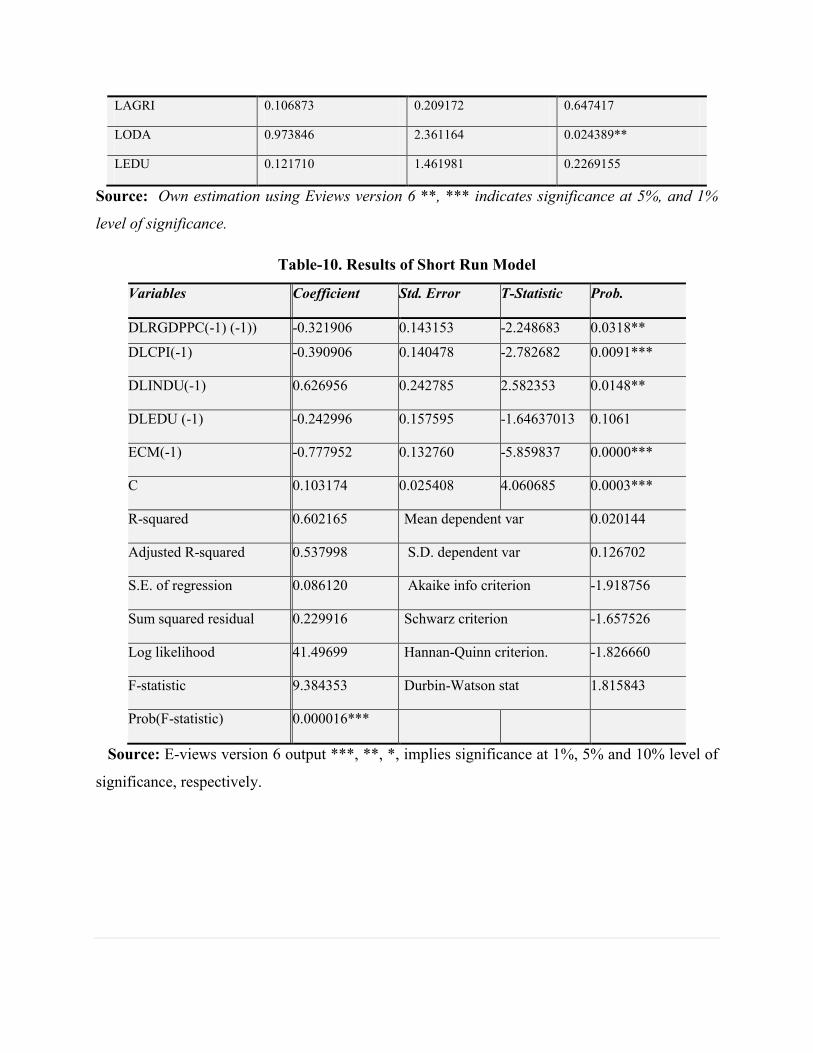
4.3. Vector Error Correction Model (VECM)
The short run dynamics of the long run model is estimated using vector error correction model.
Variables entering in the short run model are in difference and the coefficient of differenced variables
presented in table 10, represent short run dynamics. The coefficient of lagged error correction term
ECM (-1) captures the speed of adjustment of the dependent variable towards its long run steady state.
In this study, due to its insignificance official development assistance and agriculture value added
share of GDP are excluded in the short run model to get parsimonious short run model. Table 10
shows that real GDP per capita income and industry value added share of GDP at their difference
have a statistically significant effect on tax revenue in the short run, at 5% level of significance.
Inflation is significant at 1% level of significance. The coefficients of variables in the model are
jointly different from zero, as the overall significance (i.e. F statistic) is significant at 1% critical
value. The model is also free from serial correlation; i.e., Durbin statistics is 1.82. The model is also
well fitted model, the explanatory power of the model as measured by R2 is 0.602165, which implies
that 60.22% of the variation in tax revenue is explained by the variation in the variables included in
the model.
The vector error correction term represents a deviation from the long run equilibrium which is
corrected gradually through a series of short run partial adjustments. Its coefficient is negative as
expected and less than one in absolute value, which is statistically significant at 1% critical value,
which implies the existence of co-integration among variables and hence, the presence of stable long-
run relationship. A stable co-integrating relationship adjusts the short-run deviations by the extent of
the error correction term. The result in table 10 shows that 77.8% of dis-equilibrium in tax revenue is
corrected in the first year.
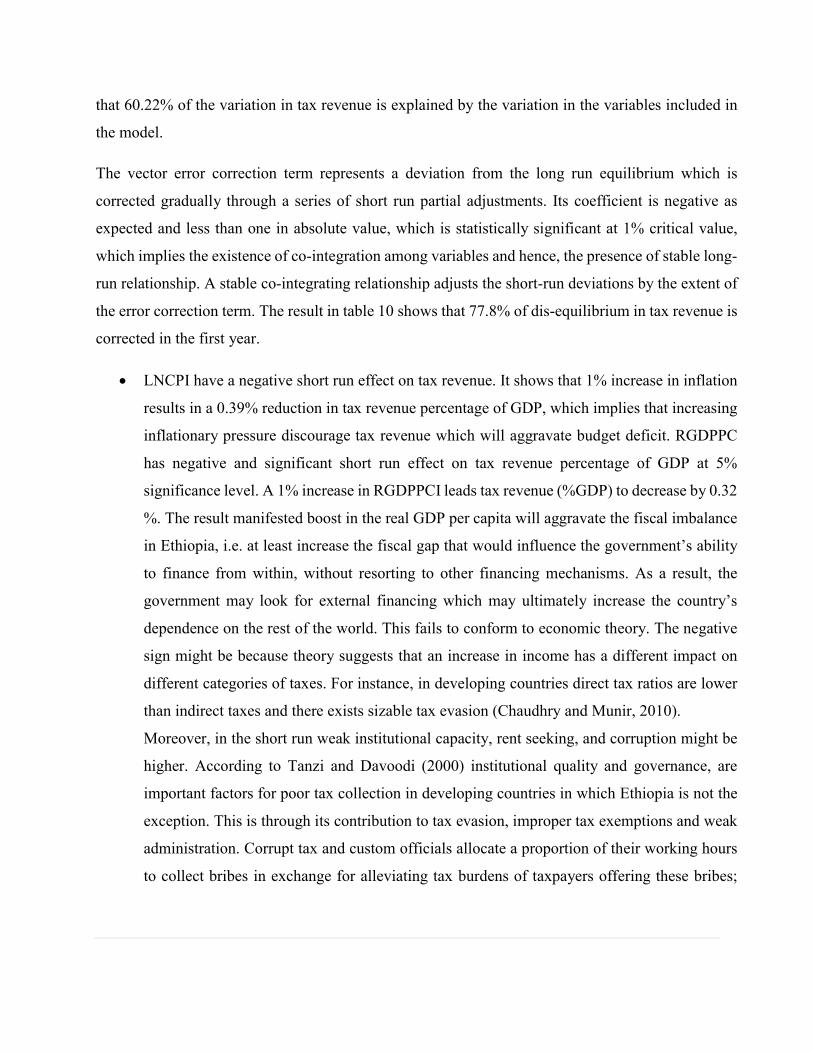
LNCPI have a negative short run effect on tax revenue. It shows that 1% increase in inflation
results in a 0.39% reduction in tax revenue percentage of GDP, which implies that increasing
inflationary pressure discourage tax revenue which will aggravate budget deficit. RGDPPC
has negative and significant short run effect on tax revenue percentage of GDP at 5%
significance level. A 1% increase in RGDPPCI leads tax revenue (%GDP) to decrease by 0.32
%. The result manifested boost in the real GDP per capita will aggravate the fiscal imbalance
in Ethiopia, i.e. at least increase the fiscal gap that would influence the government’s ability
to finance from within, without resorting to other financing mechanisms. As a result, the
government may look for external financing which may ultimately increase the country’s
dependence on the rest of the world. This fails to conform to economic theory. The negative
sign might be because theory suggests that an increase in income has a different impact on
different categories of taxes. For instance, in developing countries direct tax ratios are lower
than indirect taxes and there exists sizable tax evasion (Chaudhry and Munir, 2010).
Moreover, in the short run weak institutional capacity, rent seeking, and corruption might be
higher. According to Tanzi and Davoodi (2000) institutional quality and governance, are
important factors for poor tax collection in developing countries in which Ethiopia is not the
exception. This is through its contribution to tax evasion, improper tax exemptions and weak
administration. Corrupt tax and custom officials allocate a proportion of their working hours
to collect bribes in exchange for alleviating tax burdens of taxpayers offering these bribes;
thus forcing them out of business or into the informal sector. These activities lower tax
revenue for the public treasury.
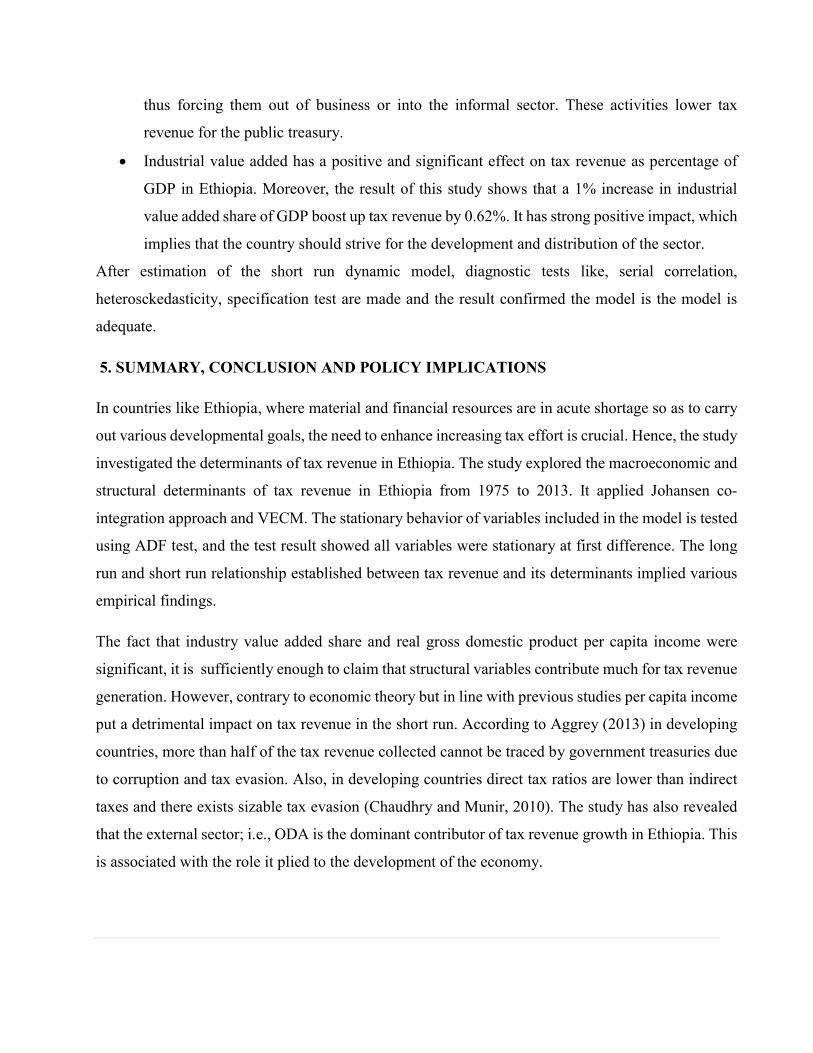
Industrial value added has a positive and significant effect on tax revenue as percentage of
GDP in Ethiopia. Moreover, the result of this study shows that a 1% increase in industrial
value added share of GDP boost up tax revenue by 0.62%. It has strong positive impact, which
implies that the country should strive for the development and distribution of the sector.
After estimation of the short run dynamic model, diagnostic tests like, serial correlation,
heterosckedasticity, specification test are made and the result confirmed the model is the model is
adequate.
5. SUMMARY, CONCLUSION AND POLICY IMPLICATIONS
In countries like Ethiopia, where material and financial resources are in acute shortage so as to carry
out various developmental goals, the need to enhance increasing tax effort is crucial. Hence, the study
investigated the determinants of tax revenue in Ethiopia. The study explored the macroeconomic and
structural determinants of tax revenue in Ethiopia from 1975 to 2013. It applied Johansen co-
integration approach and VECM. The stationary behavior of variables included in the model is tested
using ADF test, and the test result showed all variables were stationary at first difference. The long
run and short run relationship established between tax revenue and its determinants implied various
empirical findings.
The fact that industry value added share and real gross domestic product per capita income were
significant, it is sufficiently enough to claim that structural variables contribute much for tax revenue
generation. However, contrary to economic theory but in line with previous studies per capita income
put a detrimental impact on tax revenue in the short run. According to Aggrey (2013) in developing
countries, more than half of the tax revenue collected cannot be traced by government treasuries due
to corruption and tax evasion. Also, in developing countries direct tax ratios are lower than indirect
taxes and there exists sizable tax evasion (Chaudhry and Munir, 2010). The study has also revealed
that the external sector; i.e., ODA is the dominant contributor of tax revenue growth in Ethiopia. This
is associated with the role it plied to the development of the economy.
One significant conclusion of this study come across was the existence of lower tax revenue
performance in the country throughout the study period. This gave birth to the availability of fiscal
gap (fiscal deficit) for a long period, though it was declining with the current fascinating economic
growth and falling level of unanticipated spending. Therefore, if better tax administration is
maintained, there exists a space to significantly augment the tax performance. This study concluded
that a mere increase in industrial value added share of GDP may not be a guarantee for increasing
tax revenue, because the study revealed that tax revenue was inelastic to the change in industry value
added, though its response was significant both in the long run and in the short run.
Equally important issue in tax revenue performance was price instability. Inflation remained
significant determinants of tax revenue in Ethiopia. Coupled with policy changes and worst drought
that has resulted in acute shortage of agricultural food production, since recent years the country come
to face higher inflation. This made tax payers to put their tax liability a side and began to worry about
satisfaction of their daily consumption, owing to loss of purchasing power of money. Therefore, the
effect of price instability has been deteriorated tax revenue collection in Ethiopia.
To sum up, a number of variables affect tax revenue in Ethiopia as evidenced in the empirical findings
of this study. This study examined a different relationship between tax revenue and its determinants,
these relationships are indicative of the role of policies pursued by the country that have a strong
influence on a tax revenue generation. Empirical findings of the study revealed that industrial
development, macroeconomic condition and external sector are the main policy instruments to
augment tax revenue in Ethiopia. The most noteworthy achievement of this study is that the result of
sectoral composition of the economy is congruent with the broad and pro poor economic policy of
Ethiopia. That means the industrial sector contributes a lot to tax revenue in the long run. Finally, the
study concludes that tax revenue performance in Ethiopia is disappointing; i.e., although, it shows
promising trend since a recent past, tax to GDP ratio remained low wandering around 10 percent
during the study period, in which raising tax revenue level shall be at the heart of policy makers.
This study showed that the share of tax revenue to GDP is very low, implying domestic resource
mobilization is at an infant stage in Ethiopia. Hence, improving the efficiency of tax administration,
broadening tax bases like, boost in industrial sector shall be given due attention by policy makers.
Strategies that will increase economic growth should be facilitated. Per capita GDP found to have
positive contribution in the long run. Therefore, along with extending the current fascinating
economic growth, factors that would reduce the growth in tax revenue has to be challenged.
Moreover, due to the significant effect of industrial value added share of GDP on tax revenue in the
long run, the country has to do with a paradigm shift from the agriculture to the development of the
industrial sector, while maintaining the inter relationship between the two sectors. Likewise, the
government has to take care of enacting policies that can promote industrial production and it has to
strive forward to bring small industries into medium and large industries.
Evidenced in this study, foreign aid inflow has positively contributed to domestic revenue
mobilization. Therefore, the country has to efficiently utilize aid inflows to the enhance tax revenue
growth. Hence, the allocation of foreign aid inflow should be efficient and devoted to items that the
country can gain more tax revenue. Macroeconomic instability erodes the purchasing power of the
people and reduce the value of revenue collected in real terms. Hence, individuals may not avail to
pay tax; i.e., they attempted to evade from the tax authority and underreport their actual earning which
will understate the amount that would otherwise be collected. Therefore, the government of Ethiopia
shall regulate the macroeconomic situation of the country and find new tax items along with
formalizing the underground economy.
Finally, this study recommended measures that boost per capita income growth, structural
transformations, introduction of new tax bases have to be considered so as to bring efficient tax
administration and enhance revenue growth.
Table-1. Description of explanatory variables
Independent
Variables
Variable Descriptions
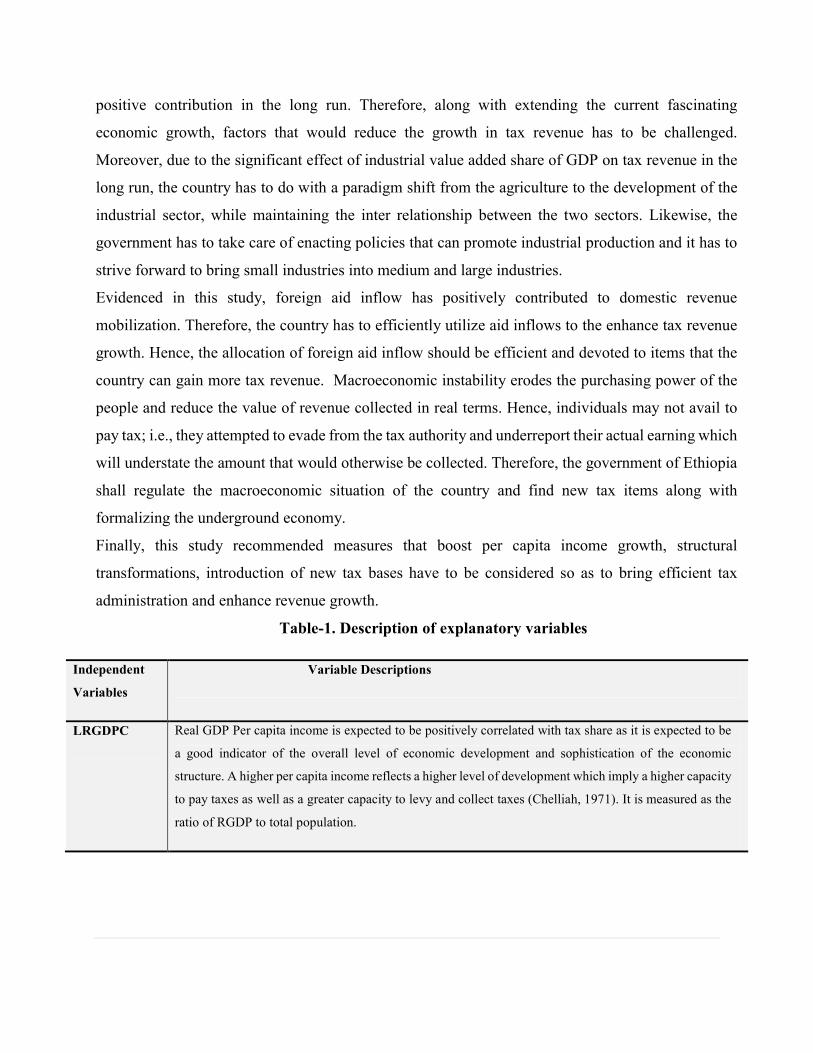
LRGDPC Real GDP Per capita income is expected to be positively correlated with tax share as it is expected to be
a good indicator of the overall level of economic development and sophistication of the economic
structure. A higher per capita income reflects a higher level of development which imply a higher capacity
to pay taxes as well as a greater capacity to levy and collect taxes (Chelliah, 1971). It is measured as the
ratio of RGDP to total population.
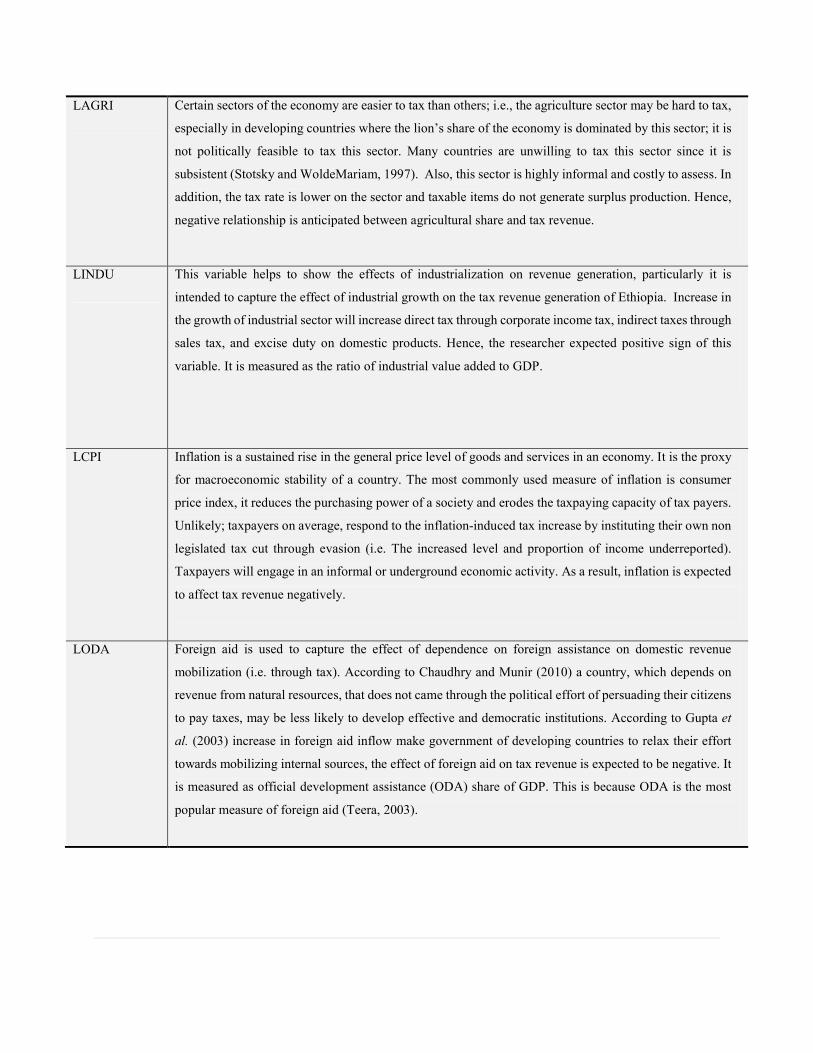
LAGRI Certain sectors of the economy are easier to tax than others; i.e., the agriculture sector may be hard to tax,
especially in developing countries where the lion’s share of the economy is dominated by this sector; it is
not politically feasible to tax this sector. Many countries are unwilling to tax this sector since it is
subsistent (Stotsky and WoldeMariam, 1997). Also, this sector is highly informal and costly to assess. In
addition, the tax rate is lower on the sector and taxable items do not generate surplus production. Hence,
negative relationship is anticipated between agricultural share and tax revenue.
LINDU This variable helps to show the effects of industrialization on revenue generation, particularly it is
intended to capture the effect of industrial growth on the tax revenue generation of Ethiopia. Increase in
the growth of industrial sector will increase direct tax through corporate income tax, indirect taxes through
sales tax, and excise duty on domestic products. Hence, the researcher expected positive sign of this
variable. It is measured as the ratio of industrial value added to GDP.
LCPI Inflation is a sustained rise in the general price level of goods and services in an economy. It is the proxy
for macroeconomic stability of a country. The most commonly used measure of inflation is consumer
price index, it reduces the purchasing power of a society and erodes the taxpaying capacity of tax payers.
Unlikely; taxpayers on average, respond to the inflation-induced tax increase by instituting their own non
legislated tax cut through evasion (i.e. The increased level and proportion of income underreported).
Taxpayers will engage in an informal or underground economic activity. As a result, inflation is expected
to affect tax revenue negatively.
LODA Foreign aid is used to capture the effect of dependence on foreign assistance on domestic revenue
mobilization (i.e. through tax). According to Chaudhry and Munir (2010) a country, which depends on
revenue from natural resources, that does not came through the political effort of persuading their citizens
to pay taxes, may be less likely to develop effective and democratic institutions. According to Gupta et
al. (2003) increase in foreign aid inflow make government of developing countries to relax their effort
towards mobilizing internal sources, the effect of foreign aid on tax revenue is expected to be negative. It
is measured as official development assistance (ODA) share of GDP. This is because ODA is the most
popular measure of foreign aid (Teera, 2003).
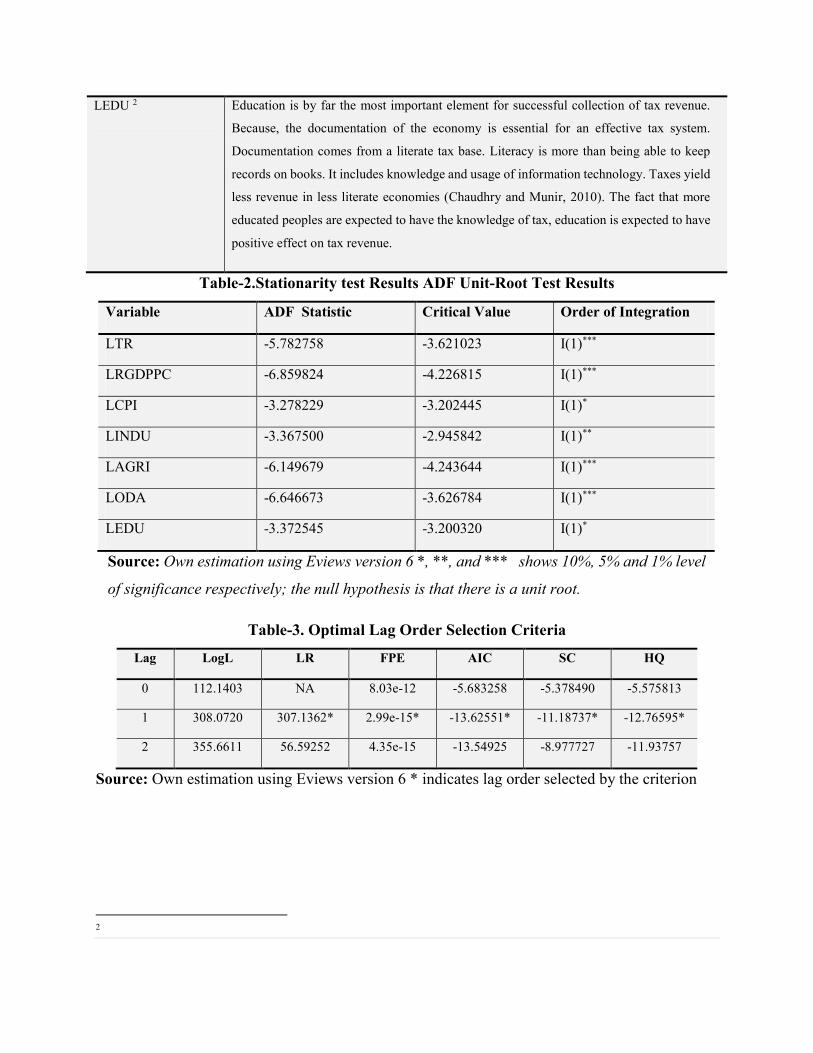
LEDU 2 Education is by far the most important element for successful collection of tax revenue.
Because, the documentation of the economy is essential for an effective tax system.
Documentation comes from a literate tax base. Literacy is more than being able to keep
records on books. It includes knowledge and usage of information technology. Taxes yield
less revenue in less literate economies (Chaudhry and Munir, 2010). The fact that more
educated peoples are expected to have the knowledge of tax, education is expected to have
positive effect on tax revenue.
Table-2.Stationarity test Results ADF Unit-Root Test Results
Source: Own estimation using Eviews version 6 *, **, and *** shows 10%, 5% and 1% level
of significance respectively; the null hypothesis is that there is a unit root.
Table-3. Optimal Lag Order Selection Criteria
Lag LogL LR FPE AIC SC HQ
0 112.1403 NA 8.03e-12 -5.683258 -5.378490 -5.575813
1 308.0720 307.1362* 2.99e-15* -13.62551* -11.18737* -12.76595*
2 355.6611 56.59252 4.35e-15 -13.54925 -8.977727 -11.93757
Source: Own estimation using Eviews version 6 * indicates lag order selected by the criterion
2
Variable ADF Statistic Critical Value Order of Integration
LTR -5.782758 -3.621023 I(1)***
LRGDPPC -6.859824 -4.226815 I(1)***
LCPI -3.278229 -3.202445 I(1)*
LINDU -3.367500 -2.945842 I(1)**
LAGRI -6.149679 -4.243644 I(1)***
LODA -6.646673 -3.626784 I(1)***
LEDU -3.372545 -3.200320 I(1)*
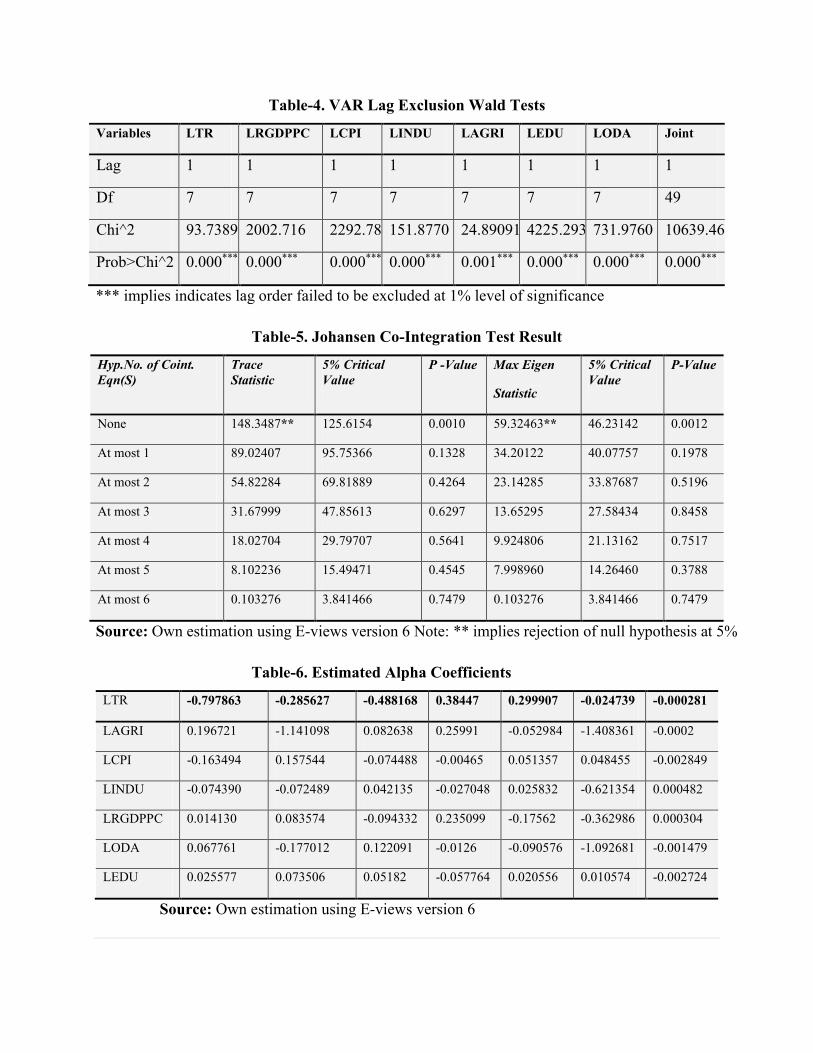
Table-4. VAR Lag Exclusion Wald Tests
Variables LTR LRGDPPC LCPI LINDU LAGRI LEDU LODA Joint
Lag 1 1 1 1 1 1 1 1
Df 7 7 7 7 7 7 7 49
Chi^2 93.738982002.716 2292.786151.8770 24.89091 4225.293 731.9760 10639.46
Prob>Chi^2 0.000*** 0.000*** 0.000*** 0.000*** 0.001*** 0.000*** 0.000*** 0.000***
*** implies indicates lag order failed to be excluded at 1% level of significance
Table-5. Johansen Co-Integration Test Result
Hyp.No. of Coint. Eqn(S)
Trace Statistic
5% Critical Value
P -Value Max Eigen
Statistic
5% Critical Value
P-Value
None 148.3487** 125.6154 0.0010 59.32463** 46.23142 0.0012
At most 1 89.02407 95.75366 0.1328 34.20122 40.07757 0.1978
At most 2 54.82284 69.81889 0.4264 23.14285 33.87687 0.5196
At most 3 31.67999 47.85613 0.6297 13.65295 27.58434 0.8458
At most 4 18.02704 29.79707 0.5641 9.924806 21.13162 0.7517
At most 5 8.102236 15.49471 0.4545 7.998960 14.26460 0.3788
At most 6 0.103276 3.841466 0.7479 0.103276 3.841466 0.7479
Source: Own estimation using E-views version 6 Note: ** implies rejection of null hypothesis at 5%
Table-6. Estimated Alpha Coefficients
LTR -0.797863 -0.285627 -0.488168 0.38447 0.299907 -0.024739 -0.000281
LAGRI 0.196721 -1.141098 0.082638 0.25991 -0.052984 -1.408361 -0.0002
LCPI -0.163494 0.157544 -0.074488 -0.00465 0.051357 0.048455 -0.002849
LINDU -0.074390 -0.072489 0.042135 -0.027048 0.025832 -0.621354 0.000482
LRGDPPC 0.014130 0.083574 -0.094332 0.235099 -0.17562 -0.362986 0.000304
LODA 0.067761 -0.177012 0.122091 -0.0126 -0.090576 -1.092681 -0.001479
LEDU 0.025577 0.073506 0.05182 -0.057764 0.020556 0.010574 -0.002724
Source: Own estimation using E-views version 6
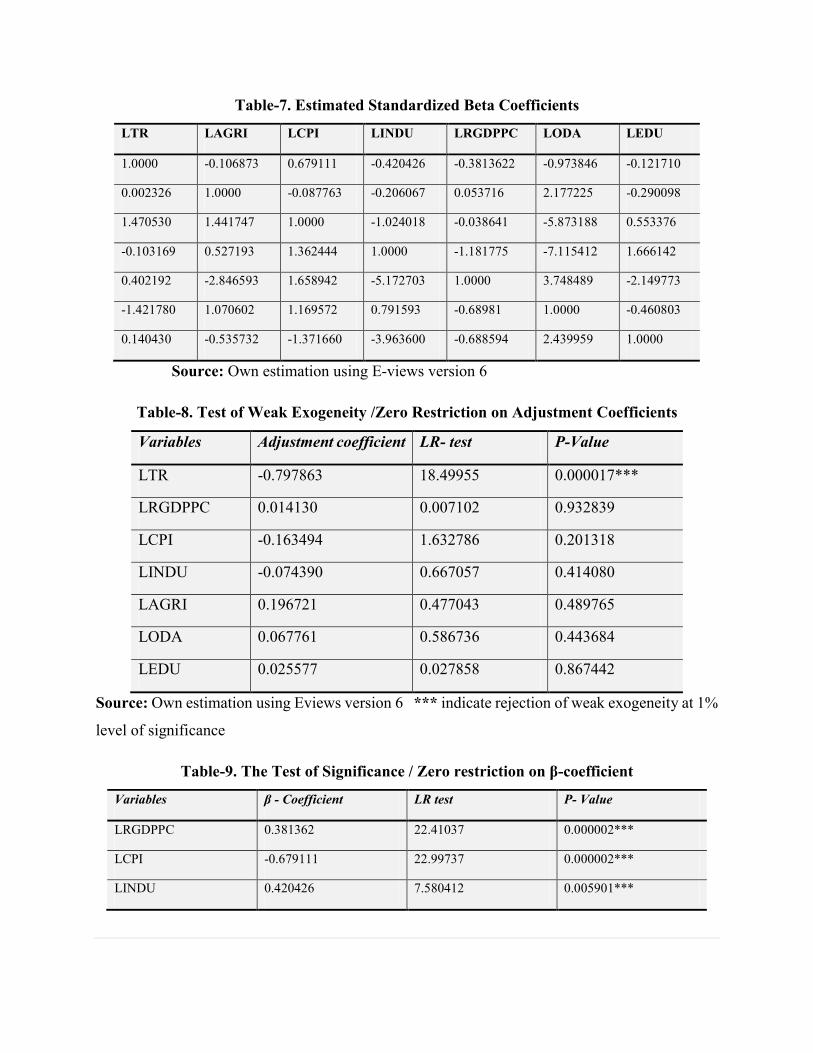
Table-7. Estimated Standardized Beta Coefficients
LTR LAGRI LCPI LINDU LRGDPPC LODA LEDU
1.0000 -0.106873 0.679111 -0.420426 -0.3813622 -0.973846 -0.121710
0.002326 1.0000 -0.087763 -0.206067 0.053716 2.177225 -0.290098
1.470530 1.441747 1.0000 -1.024018 -0.038641 -5.873188 0.553376
-0.103169 0.527193 1.362444 1.0000 -1.181775 -7.115412 1.666142
0.402192 -2.846593 1.658942 -5.172703 1.0000 3.748489 -2.149773
-1.421780 1.070602 1.169572 0.791593 -0.68981 1.0000 -0.460803
0.140430 -0.535732 -1.371660 -3.963600 -0.688594 2.439959 1.0000
Source: Own estimation using E-views version 6
Table-8. Test of Weak Exogeneity /Zero Restriction on Adjustment Coefficients
Variables Adjustment coefficient LR- test P-Value
LTR -0.797863 18.49955 0.000017***
LRGDPPC 0.014130 0.007102 0.932839
LCPI -0.163494 1.632786 0.201318
LINDU -0.074390 0.667057 0.414080
LAGRI 0.196721 0.477043 0.489765
LODA 0.067761 0.586736 0.443684
LEDU 0.025577 0.027858 0.867442
Source: Own estimation using Eviews version 6 *** indicate rejection of weak exogeneity at 1%
level of significance
Table-9. The Test of Significance / Zero restriction on β-coefficient
Variables β - Coefficient LR test P- Value
LRGDPPC 0.381362 22.41037 0.000002***
LCPI -0.679111 22.99737 0.000002***
LINDU 0.420426 7.580412 0.005901***
LAGRI 0.106873 0.209172 0.647417
LODA 0.973846 2.361164 0.024389**
LEDU 0.121710 1.461981 0.2269155
Source: Own estimation using Eviews version 6 **, *** indicates significance at 5%, and 1%
level of significance.
Table-10. Results of Short Run Model
Variables Coefficient Std. Error T-Statistic Prob.
DLRGDPPC(-1) (-1)) -0.321906 0.143153 -2.248683 0.0318**
DLCPI(-1) -0.390906 0.140478 -2.782682 0.0091***
DLINDU(-1) 0.626956 0.242785 2.582353 0.0148**
DLEDU (-1) -0.242996 0.157595 -1.64637013 0.1061
ECM(-1) -0.777952 0.132760 -5.859837 0.0000***
C 0.103174 0.025408 4.060685 0.0003***
R-squared 0.602165 Mean dependent var 0.020144
Adjusted R-squared 0.537998 S.D. dependent var 0.126702
S.E. of regression 0.086120 Akaike info criterion -1.918756
Sum squared residual 0.229916 Schwarz criterion -1.657526
Log likelihood 41.49699 Hannan-Quinn criterion. -1.826660
F-statistic 9.384353 Durbin-Watson stat 1.815843
Prob(F-statistic) 0.000016***
Source: E-views version 6 output ***, **, *, implies significance at 1%, 5% and 10% level of
significance, respectively.
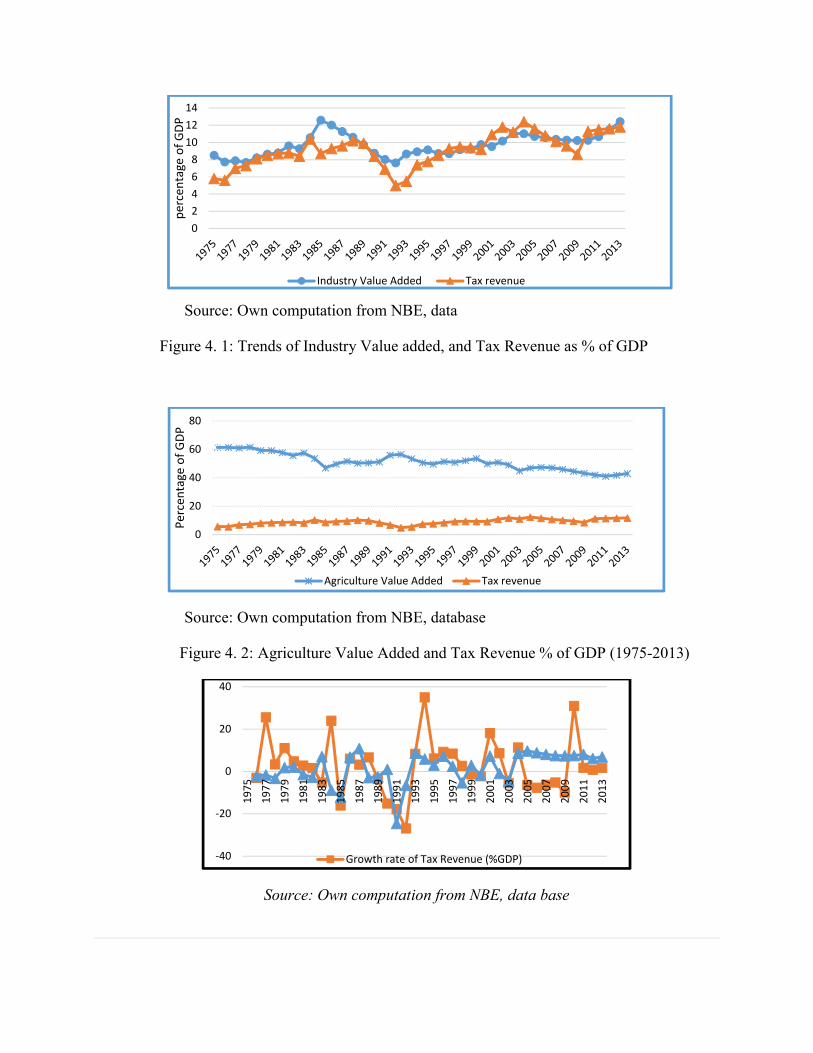
Source: Own computation from NBE, data
Figure 4. 1: Trends of Industry Value added, and Tax Revenue as % of GDP
Source: Own computation from NBE, database
Figure 4. 2: Agriculture Value Added and Tax Revenue % of GDP (1975-2013)
Source: Own computation from NBE, data base
0
2
4
6
8
10
12
14
per
cen
tage
of
GD
P
Industry Value Added Tax revenue
0
20
40
60
80
Per
cen
tage
of
GD
P
Agriculture Value Added Tax revenue
-40
-20
0
20
40
19
75
19
77
19
79
19
81
19
83
19
85
19
87
19
89
19
91
19
93
19
95
19
97
19
99
20
01
20
03
20
05
20
07
20
09
20
11
20
13
Growth rate of Tax Revenue (%GDP)
Notes
1 Author’s calculation from National Bank data base
2 According to Pessino and Fenochietto (2010), education can be measured by literacy rate, labor force with secondary education
as (percentage of total), and secondary education enrolment ratio. However, when data on none of those measurement is available,
it is possible to use total government expenditure on education as percentage of GDP as a proxy for education. Similarly,
Wondewesen (2011) used expenditure on education as a proxy for education. Hence, for the same argument in this study the
researcher used expenditure on education (%GDP) as a proxy for education
REFERENCES
Abeba, S., (2002), Macroeconomic impacts of external assistance in Ethiopia, 1960-1999.
Unpublished Master’s Thesis (Economic Policy Analysis), Addis Ababa University, Addis Ababa.
Ahmed, Q. M., & Mohammed, S. D. (2010), Determinant of tax buoyancy: Empirical evidence
developing countries. European Journal of Social Sciences 13 (3).
Agbeyegbe, T., Stotsky,J.G., and WoldeMariam, A., (2004), Trade Liberalization, Exchange Rate
Changes and Tax Revenue in Sub Saharan Africa. IMF Working Paper, Wp04/178,1-32.
Aggrey, J., (2013), Determinants of tax revenue: Evidence from Ghana. Master’s Thesis,
University of Cape Coast.
Ansari, M.M., (1982), Determinants of tax ratio: A cross-country analysis. Economic and Political
Weekly, 17(25): 1035-1042.
Bayu, T., (2015), Analysis of tax buoyancy and its determinants in Ethiopia. Journal of Economics
and Sustainable Development, 6(3): pp 1- 14.
Basirat, M., F. Aboodi and A. Ahangari, (2014), Analyzing the effect of economic variables on
total tax revenues in Iran. Asian Economic and Financial Review, 4(6): 755-767.
Benoit, K., (2011), Linear regression models with logarithmic transformations. London: London
School of Economics.
Bhushan, A. and Y. Samy, (2012) Aid and taxation: Is Sub-Saharan Africa different? North South
Institute Research Report.
Chaudhry, I.S. and F. Munir, (2010), Determinants of low tax revenue in Pakistan. Pakistan Journal
of Social Sciences, 30(2): 439-452.
Chelliah, R.J., (1971), Trends in taxation in developing countries. IMF Staff Papers,18(2):254-
325.
Crane, S.E. and F. Nourzad, (1986), Inflation and taxation: An empirical analysis. Review of
Economics and Statistics, 68(2): 217-223.
Emerta, A., (2010), The underground economy and tax evasion in Ethiopia: Implications for tax
policy. Macroeconomic Division Ethiopian Economic Policy Research Institute (EEPRI)
/Ethiopian Economic Association EEA.
Fatás, A. and I. Mihov, (2003), The case for restricting fiscal policy discretion. Quarterly Journal
of Economics Oxford University Press, 118: pp.1419-1144.Gebeyehu,W.,(2013). Causal links
among saving, investment and growth and determinants of saving in Sub-Saharan Africa: Evidence
from Ethiopia. Ethiopian Journal of Economics, 19(2), Ethiopian Economic Association, Addiss
Ababa, Ethiopia.
Geda, A., and Shimeles, A. (2005), Taxes and tax reform in Ethiopia, 1990-2003. United Nations
University World Institute for Development Research Paper No. 2005/65.
Ghani, Z., (2012), A cross country analysis of tax performance with special focus on Pakistan’s
tax effort. Master’s Degree Project, Swedish Business School at Orebro University.
Ghura, D., 1998. Tax revenue in Sub-Sahara Africa: Effects of economic policies and corruption.
Washington, D.C: International Monetary Fund WP/98/135.
Gupta, A.S., (2007), Determinants of tax revenue efforts in developing countries. International
Monetary Fund Working Paper No. 184.
Gupta, A.S., B. Clements, A. Pivovarsky and E.R. Tiongson, (2003), Foreign aid and revenue
response: Does the composition of aid matter? IMF Working Paper No. 03/176.
Haque, A., (2009), Determinants of low tax efforts of developing countries. Available from
http://sydney.edu.au/law/parsons [Accessed December14,2015].
International Monetary Fund, 2013. The federal democratic republic of Ethiopia, Article IV
consultation. IMF Country Report No. 13/308.
Karagöz, K., 2013. Determinants of tax revenue: Does sectorial composition matter? Journal of
Finance, Accounting and Management, 4(2): 50-63.
Maddala, G.S., (2001), Introduction to econometrics. 3rd Edn., New York: OHIO State University:
John Wiley and Sons Ltd.
Mahdavi, S., (2008), The level and composition of tax revenue in developing countries.
International Review of Economics and Finance, 17: 607-617.
Ministry of Finance and Economic Development, (2011), Macroeconomic performance on
Ethiopian economy. Annual Reports.
Pessino, C. and Fenochietto, R., (2010), Determining countries tax effort. Hacienda Pública
Española/Revistade Economía Pública: 195 (4): pp. 65-87. Instituto de Estudios Fiscales.
Rajan, E. M. (1996), Personal income taxation in India. PhD Dissertation, Pondicherry University,
India.
Stotsky, J.G. and WoldeMariam, A., (1997), Tax effort in Sub-Saharan Africa. IMF Working
Paper No. WP/97/107.
Tanzi, V., (1989), The impact of macroeconomic policies on the level of taxation and fiscal balance
in developing countries. IMF Staff Papers, 36: 633-656.
Tanzi, V. and H.R. Davoodi, (2000), Corruption, growth, and public finance. IMF Working Paper,
WP/00/182. Washington, D.C.
Teera, J.M., (2003), Determinants of tax revenue share in Uganda. Centre for Public Economics,
Working Paper No. 09b–03.
Tilahun, A., (2014), Determinants of tax compliance behavior in Ethiopia: The case of Bahir Dar
city taxpayers. Journal of Economics and Sustainable Development, 5(15): pp 1-7.
United Nation Development Program, (2014), Global value chains and Africa’s industrialization,
Thematic Edition. African Economic Outlook,pp 1-182.
Wawire, N.H.W., (2011), Determinants of value added tax revenue in Kenya. Journal of Finance,
Accounting and Management, 4(2): 50-63.
Wilford, W.T., (1978a), Taxation and economic development: Twelve critical studies. In. Toye, J.
F. J (Eds). Estimates of revenue elasticity and buoyancy in central America 1954-1974. London:
Frank Cass & Co.Ltd. pp: 83-100.
Wondwosen, W., (2011), The impact of foreign capital inflows on economic growth, savings, and
investment in Ethiopia. Master’s Thesis, Addis Ababa University. Addis Ababa.