DETERMINANTS OF PRIVATE EQUITY EXIT STRATEGIES IN …
68
DETERMINANTS OF PRIVATE EQUITY EXIT STRATEGIES IN SOUTH AFRICA by Ntiamoah Agyapong Thesis submitted in fulfilment of the requirements for the degree of Master of Management in Finance & Investment in the FACULTY OF COMMERCE LAW AND MANAGEMENT WITS BUSINESS SCHOOL at the UNIVERSITY OF THE WITWATERSRAND Supervisor: Prof. Kalu Ojah
Transcript of DETERMINANTS OF PRIVATE EQUITY EXIT STRATEGIES IN …

DETERMINANTS OF PRIVATE EQUITY EXIT
STRATEGIES IN SOUTH AFRICA
by
Ntiamoah Agyapong
Thesis submitted in fulfilment of the requirements for the degree of
Master of Management in Finance & Investment
in the
FACULTY OF COMMERCE LAW AND MANAGEMENT
WITS BUSINESS SCHOOL
at the
UNIVERSITY OF THE WITWATERSRAND
Supervisor: Prof. Kalu Ojah

ii
DECLARATION
I, Ntiamoah Agyapong, declare that the research work reported in this dissertation is my own,
except where otherwise indicated and acknowledged. It is submitted for the degree of Master
of Management in Finance and Investment at the University of the Witwatersrand,
Johannesburg. This thesis has not, either in whole or in part, been submitted for a degree or
diploma to any other universities.
………………………………………….
Ntiamoah Agyapong
Signed at…………………………………………………………………………………..
On the……………………………..Day of………………………………………….2016

iii
ABSTRACT
The objective of this paper is to study the exit behaviour of private equity investments held by
independent private equity firms in South Africa. As this is an exploratory study we examine
empirical hypotheses previously tested by other authors. Firstly, we test whether portfolio
companies within high technology sectors are more likely to achieve an initial public offering
(IPO) exit relative to other exits. Secondly, we test the effect of the lending rate on the
likelihood of a secondary sale. Lastly, we consider the relative preference of IPO compared to
acquisition (M&A) and other exit modes. As South Africa is considered to be a bank-centered
financial system (Levine, 2002), private equity investments within the market would be
expected to experience poor IPO activity as suggested by the literature (Black and Gilson,
1998).The research is quantitative in nature and involves the use of statistical modelling,
multinomial logistic regression was applied, using panel data, which assumes that the effect of
explanatory variables on the choice of exit varies across observations (private equity firms) and
over time. From the multinomial logit model it was found that; 1) High technology firms were
more likely to be exited by means of M&A rather than IPO; 2) An increase in the lending rate
was found to increase the likelihood of a Secondary sale which is contrary to previous research
(Sousa, 2010); and 3) M&A was found to be the most likely mode of exit assuming all
explanatory variables were at their mean, while IPO was the least likely mode of exit.

iv
DEDICATION
This research report is dedicated to
God Almighty,
My parents: Mr Kwame Agyapong and Mrs Bernice Agyapong,
and
My siblings: Adwoa Agyapong and Kwadjo Agyapong.

v
ACKNOWLEDGEMENTS
I would like to record my thanks and gratitude to everyone who assisted and encouraged me
during my master’s program and in the completion of this research. All their help and
understanding contributed to the successful completion of this difficult task. Particularly, I
would like to thank the following people:
Prof. Kalu Ojah: My supervisor, whose extreme support and constant guidance provided me
with the inspiration to complete the research. His professional and expert
knowledge was critical in making this research possible.
My family: Thanks to my parents; Kwame, Bernice, and my siblings; Adwoa and
Kwadjo, for believing in me throughout the entire program. Especially my
mother for always being there for me and never giving up on me.
My friends: Thanks to all my friends, who helped me in one way or the other; assistance,
advice and encouragement.

vi
Table of Contents
DECLARATION .................................................................................................................. ii
ABSTRACT ........................................................................................................................ iii
DEDICATION ..................................................................................................................... iv
ACKNOWLEDGEMENTS .................................................................................................. v
CHAPTER 1: INTRODUCTION .......................................................................................... 1
1.1. CONTEXT OF THE STUDY ............................................................................................................... 1
1.2. PROBLEM STATEMENT ................................................................................................................... 3
1.3. RESEARCH OBJECTIVES ................................................................................................................. 4
1.4. RESEARCH QUESTIONS ................................................................................................................... 4
1.5. Hypotheses ............................................................................................................................................ 5
1.6. LIMITATIONS ..................................................................................................................................... 6
1.7. ASSUMPTIONS ................................................................................................................................... 6
1.8. OUTLINE OF REMAINING SECTIONS ............................................................................................ 6
CHAPTER 2: LITERATURE REVIEW ............................................................................... 7
2.1. WHAT IS PRIVATE EQUITY? ........................................................................................................... 7
2.2. THE PRIVATE EQUITY MARKET ................................................................................................... 7
2.2.1. The main private equity markets ....................................................................................................... 7
2.2.2. Market participants ........................................................................................................................... 8
2.2.3. Market dynamics ............................................................................................................................ 10
2.3. OVERVIEW OF EXISTING LITERATURE .................................................................................... 10
2.4. THE INVESTMENT PROCESS ........................................................................................................ 11
2.4.1. Deal origination .............................................................................................................................. 11
2.4.2. Screening and selection .................................................................................................................. 12
2.4.3. Contracting ..................................................................................................................................... 12
2.4.4. Use of convertible securities ........................................................................................................... 13
2.4.5. Syndication ..................................................................................................................................... 13
2.4.6. Staging of finance ........................................................................................................................... 14
2.4.7. Pre-planned exits ............................................................................................................................ 14
2.4.8. Monitoring ...................................................................................................................................... 15
2.4.9. Exit.................................................................................................................................................. 15
2.4.10. Partial exits ..................................................................................................................................... 16

vii
2.5. THE IMPORTANCE OF THE EXIT ................................................................................................. 16
2.6. INVESTMENT DURATION ............................................................................................................. 17
2.7. EXIT MODES ..................................................................................................................................... 18
2.7.1. Initial public offering ...................................................................................................................... 18
2.7.2. M&A (Acquisition)......................................................................................................................... 18
2.7.3. Secondary sale ................................................................................................................................ 19
2.7.4. Buyback .......................................................................................................................................... 19
2.7.5. Write-offs ........................................................................................................................................ 19
2.8. FACTORS AFFECTING CHOICE OF EXIT .................................................................................... 20
2.8.1. Industry focus of Portfolio Company ............................................................................................. 20
2.8.2. Quality of Portfolio Company ........................................................................................................ 20
2.8.3. Type of private equity firm ............................................................................................................. 21
2.8.4. Market conditions ........................................................................................................................... 21
2.9. CHALLENGES TO IPO EXIT IN SOUTH AFRICA ........................................................................ 22
2.9.1. Market structure .............................................................................................................................. 22
2.9.2. Lack of a vibrant venture capital industry ...................................................................................... 23
2.10. EXIT OPPORTUNITIES IN EMERGING MARKETS ..................................................................... 23
CHAPTER 3: METHODOLOGY ....................................................................................... 24
3.1. RESEARCH DESIGN ........................................................................................................................ 24
3.2. POPULATION AND SAMPLE ......................................................................................................... 25
3.3. DATA COLLECTION ........................................................................................................................ 26
3.4. THE RESEARCH INSTRUMENT .................................................................................................... 27
3.5. DATA ANALYSIS ............................................................................................................................. 31
CHAPTER 4: RESULTS AND DISCUSSION ................................................................... 32
4.1. PRESENTATION AND DISCUSSION OF REULTS .......................................... 32
4.1.1. Analysis of correlation matrix ............................................................................... 32
4.1.3. Trend analysis ...................................................................................................... 34
4.1.4. Investment duration and undrawn commitments ................................................... 35
CHAPTER 5: CONCLUSION ............................................................................................ 45
5.1. PURPOSE OF THE STUDY ................................................................................ 45
5.2. KEY FINDINGS .................................................................................................. 45
5.3. CONCLUSION OF THE STUDY ........................................................................ 46
5.4. SUGGESTIONS FOR FUTURE RESEARCH ..................................................... 46
REFERENCES ................................................................................................................... 48
APPENDIX A ..................................................................................................................... 55

viii
LIST OF TABLES
Table 1.1 Summary of hypothesis testing ......................................................................... 5,38
Table 3.1 Sampled private equity firms ............................................................................... 26
Table 3.2 Funds under management at 31 December 2012 .................................................. 27
Table 4.1 Correlation matrix ............................................................................................... 32
Table 4.2 Sample exit transactions by mode of exit ............................................................. 34
Table 4.3 Investment level variables .................................................................................... 37
Table 4.4 Macroeconomic variables .................................................................................... 37
Table 4.5 Summary of results of hypothesis testing for the sampled exit transactions .......... 39
Table 4.6 Coefficients and marginal effects of Secondary exit ............................................. 41
Table 4.7 Coefficients and marginal effects of M&A exit .................................................... 42
Table 4.8 Coefficients and marginal effects of Buyback exit ............................................... 42
Table 4.9 Coefficients and marginal effects of IPO exit ....................................................... 43
Table 4.10 Predicted probabilities of exit modes ................................................................. 44
Table A.1 Private equity exit transactions ............................................................................ 55
Table A.2 Multinomial logits of explanatory variables ........................................................ 59
Table A.3 Marginal effects of explanatory variables ............................................................ 60

ix
LIST OF FIGURES
Figure 1.1 Private equity funds under management in South Africa ...................................... 3.
Figure 4.1 Exits by year ..................................................................................................... 35.
Figure 4.2 Average investment duration and undrawn commitments .................................. 36.

1
CHAPTER 1: INTRODUCTION
1.1. CONTEXT OF THE STUDY
Against a backdrop of reduced performance from traditional asset classes in developed
markets, the higher returns available in emerging markets provide an attractive investment
opportunity in which to deploy capital (Wilton and Reed, 2013). African private equity has
benefited greatly from these current market conditions. For instance, private equity fund raising
activity in 2011 generated approximately USD1.7 billion in commitments which is a significant
increase from USD151 million in 2002 (Ernst and Young, 2012b). The increasing importance
of the asset class continues to attract the interest of academics and practitioners alike.
Due to the specifics of private equity, investments in portfolio companies must be exited within
a specific time frame in order to maximize returns (Cumming and Johan, 2009). This process
of divestment is one of important activities which occur at various stages in the private equity
investment process but can be considered to be the most important. The exit is a fundamental
core event of the private equity investment model; it aims to maximise the value of the
investment and at the same time, secure optimal opportunities for the firm to grow after venture
capitalist have left the firm (Klonowski, 2010). The exit has also been linked to the growth of
the industry as a whole; due to its facilitating of the recycling of non-financial contributions to
new portfolio companies as well as increasing the reputation of the managers which has an
impact on the value of successive funds raised by the firm (Black and Gilson, 1998; Gompers,
1996).
However, achieving exits within emerging markets context continues to be a challenge due to
liquidity constraints. It has been found that even the most advanced emerging markets fail to
provide viable outlets for private equity portfolio companies (Leeds and Sunderland, 2003). In
addition to this, being dominated by bank centered financial systems suggests that the African
market would be expected to exhibit poor IPO activity (Black and Gilson, 1998; Levine, 2002)
and thus potentially limiting the use of this exit method. Based on these factors it would be
interesting to compare the exit behavior of private equity investments in Africa with those of a
more developed stock market centered economy such as the United States of America (USA).

2
Recent studies of exit behavior have focused mainly on developed markets such as Canada,
USA and Germany (Cumming and MacIntosh, 2003a; Baumeister and Muelke, 2010).
Emerging markets such as China, India and Singapore have also been studied to a lesser extent,
with data limitations being a common theme amongst these studies (Wang and Sim, 2001;
Prahl, Cannarsi and Zeisberger, 2011). The African private equity industry is no exception in
this regard with very little market data available to the general investment community. It is
believed that this lack of information causes a perception gap amongst international investors
and ultimately reduces the attractiveness of the continent as an investment destination (Ernst
& Young, 2012a). Consequently the main aim of this research is to contribute towards the level
of market knowledge regarding the African private equity industry with specific focus on South
Africa. We chose to study South Africa for two reasons. Firstly, South Africa has the highest
private equity penetration rate in Africa (EMPEA, 2012). Secondly, the South African financial
services sector is also generally regarded as the most advanced on the continent and thus
increasing the prospect of data availability.
Even though the South African private equity industry has been in existence for over 20 years,
the most complete set of market data at our disposal begins from the year 2001. The market
has shown significant growth over this period with total assets under management increasing
from R35.9 billion in 2001 to R126.4 billion in 2012. The majority of this growth in assets
under management is concentrated between 2005 and 2008, which also mirrors the industry’s
growth trend in other emerging markets (Dickinson, 2008). Figure 1.1 presents the growth in
total assets under management; sourced from the Southern African Venture Capital and Private
Equity Association (SAVCA) survey of South Africa covering the 2012 calendar year.

3
Figure 1.1 Private equity funds under management in South Africa
Source: (KPMG and SAVCA 2013) Southern African Venture Capital and Private Equity Industry Performance Survey of South Africa
covering the 2012 calendar year.
1.2. PROBLEM STATEMENT
The literature on the South African private equity market is not as extensive as that of more
advanced private equity markets in the USA and other developed nations. Previous research
efforts were mainly concerned with the level of return generated by the asset class (Missankov,
Van Dyke, Van Biljon, Hayes and Van Der Veen, 2008), the rationale for syndication amongst
local private equity firms (Bent, Williams and Gilbert, 2004) and evolution of the venture
capital industry (Lingelbach, Murray and Geilbert, 2009). Additionally, the suitability of the
venture capital type of private equity financing compared to the leverage buyout type is another
area of academic debate. To this effect (Ojah and Mokoaleli-Mokoteli, 2010) suggest that
venture capital finance is actually the right kind of private equity for the African market and
would possibly address the shortfalls of the current state of micro finance for SMMEs1 within
the South African and African market.
This study aims to contribute towards the literature by taking a look at exit behavior of
independent private equity firms given the available dataset. We do not distinguish between
venture capital and private equity as the firms sampled tend to engage in all stages of financing.
1 Small, Medium and Micro Enterprises.

4
Therefore we use the term private equity to refer to both leverage buyout type deals as well as
venture capital type deals.
1.3. RESEARCH OBJECTIVES
The objective of this study is to study the exit behavior of independent private equity firms in
South Africa. As this is an exploratory study we examine empirical hypothesis previously
tested by other authors. Firstly, we test whether portfolio companies within high technology
sectors are more likely to achieve an IPO exit relative to other exits. Secondly, we test the effect
of the lending rate on the likelihood of a secondary sale. Lastly, we consider the relative
preference of IPO compared to M&A. As a bank centered financial system (market) South
Africa which lacks a more vibrant venture capital industry would be expected to experience
poor IPO activity (Black and Gilson, 1998).
1.4. RESEARCH QUESTIONS
The study hopes to answer the following questions as a means of streamlining the research
objectives:
1. Are portfolio companies within high technology sectors more likely to achieve
an IPO exit relative to other exits?
2. Does the lending rate influence the likelihood of a secondary sale exit?
3. As a Bank centered market does the South African market experience poor IPO
activity as suggested by the literature?

5
1.5. Hypotheses
The following hypotheses were tested as part of this study;
Hypothesis 1: Industry of Portfolio Company
H1: Portfolio companies within high technology sectors are more likely to achieve an IPO exit
relative to other exits.
Hypothesis 2: Debt capital markets
H2: Lower lending rates will increase the likelihood of a secondary sale.
Hypothesis 3: Market structure
H3: As a bank-centered market we expect investments in South Africa to exhibit low IPO
activity, with M&A being the most preferred mode of exit.
Table 4.5 below presents the results of the hypotheses tested.
Table 1.1 Summary of hypothesis testing
Null hypothesis Alternative hypothesis
Hypothesis 1 High technology portfolio
companies are less likely to be
exited by IPO relative to other exit
modes.
High technology portfolio
companies are more likely to be
exited by IPO relative to other exit
modes.
Hypothesis 2 Lower lending rates will not
increase the likelihood of a
secondary sale exit.
Lower lending rates will increase
the likelihood of a secondary sale
exit.
Hypothesis 3 As a bank-centered market which
lacks a vibrant venture capital
industry, South Africa is expected
to experience high IPO activity,
with IPO being a more probable
mode of exit relative to M&A exit.
As a bank-centered market, which
lacks an active venture capital
industry, South Africa is expected
to experience low IPO activity, with
M&A being the most probable
mode of exit relative to IPO exit.

6
1.6. LIMITATIONS
The results derived from the analysis of the data used in this study will be considered indicative
of the explanatory power of the determinants of exit identified in this study. It is important to
note the following limitations:
The dataset used in this study consist of 69 transactions which is relatively smaller than
datasets used in other studies which have in excess of 100 transactions (Cumming and
MacIntosh, 2001; Sousa, 2010).
Transaction dates, in some instances, lack the level of detail required to ascertain the .exact
day on which the transaction too place. In such cases the transactions were assumed to take
place on the last day of the month or year indicated.
Due to a lack of information the study does not include other explanatory variables tested
by other authors.
1.7. ASSUMPTIONS
The main assumptions of the study are as follows:
The financial data downloaded is accurate and reliable.
Given that the funds included in our sample account for over 75% of Assets under
management by independent private equity firms in South Africa as at 31 December 2012,
it is representative of the South African private equity market.
This study uses panel data and assumes that the effect of the explanatory variables on the
dependent variables may vary across the observations (private equity firms) and across
time.
1.8. OUTLINE OF REMAINING SECTIONS
In the following section a literature review is presented. Hypotheses are then developed along
with a detailed description of the research undertaken in the methodology chapter. Empirical
findings are presented and discussed in chapter 4. Chapter 5 concludes the report with
suggestions for future research.

7
CHAPTER 2: LITERATURE REVIEW
2.1. WHAT IS PRIVATE EQUITY?
Institutionally, private equity is the provision of capital and management expertise given to
companies to create value and, consequently, generate big capital gains after the deal. Usually,
the holding period of these investments is defined as medium or long (Caselli, 2010). The
literature further identifies venture capital as a sub category of private equity. Venture capital
is typically concerned with financing high growth, high-risk, often high-technology firms that
need capital to finance product development or growth and must, by nature of their business,
obtain this finance in the form of equity rather than debt (Black and Gilson, 1998). Private
equity therefore can be regarded as a broader term which also encompasses later stage
investments as well as buyouts and turnaround investments (Cumming and Johan, 2009).
Throughout this report we use the term private equity as a broader term and venture capital for
specific reference to the venture capital industry. This excludes angel finance, the informal
private equity market, which is generally not regarded as an institutional level investment
(Meyer and Mathonet, 2005).
2.2. THE PRIVATE EQUITY MARKET
2.2.1. The main private equity markets
The literature suggests that the USA has the most developed private equity market in the world.
Other countries have also openly sought to replicate the success that the USA has achieved
with its venture capital industry (Black and Gilson, 1998). For example, one way that the
European market has sought growth is through the creation of local and regional exchanges
such as AIM in the United Kingdom, EASDAQ in Brussels and Euro.NM which are dedicated
to regional markets in Germany, France, Belgium, Holland and Italy (Povaly, 2006). These
exchanges were created to provide exit opportunities for smaller high-growth venture capital
backed companies. The USA and Europe are regarded as the most advanced and largest private
equity markets in the world. Other established markets include Canada and Japan.
8
Emerging market private equity has witnessed significant growth over the past decade and
continues to attract significant capital flows from investors in search of higher returns. Some
of the larger markets include Brazil, India, China and Singapore. The literature appears to
suggest a change in the global perception towards emerging market private equity. Earlier
papers such as Leeds and Sunderland (2003) acknowledged the opportunity to generate high
returns in emerging markets but also highlighted the significant challenges faced by private
equity firms within emerging markets related to issues such as identifying exit opportunities to
realize investments. However, a more recent work by Wilton and Reed (2013) illustrates the
continued success that the International Finance Corporation (IFC) has had with investing in
emerging markets. The authors show that emerging market private equity provides attractive
returns when compared to developed markets. Additionally, the authors also argue that exit
opportunities are possible within emerging markets where the manager is seen as a genuine
“hands-on” partner who provides valuable contributions to grow and improve the business. As
a result of the continued change in perceptions regarding emerging markets the private equity
industry in these markets continues to grow and attract international investors.
2.2.2. Market participants
The main participants in the private equity market can be categorised as issuers, intermediaries
and investors (Fenn, Liang and Prowse, 1995). Issuers are generally companies for whom debt
financing or public equity financing is not accessible. Intermediaries are the private equity
firms while the investors are all institutional and private investors that invest in the private
equity asset class.
Issuers
Issuers in the private equity market are generally private companies for whom access to debt
or public equity capital is not feasible (Fenn, Liang and Prowse, 1995). These firms are
generally too risky to seek debt finance and also lack adequate public information to access
public equity markets. Issuers may be at various stages in their life cycle. They may be broadly
classified as new ventures, middle-market private companies and public companies.

9
New ventures
New ventures consist of early stage venture capital projects which usually have high risk of
failure due to their unproven technology or business model. Later stage venture capital projects
on the other hand typically have a proven technology or business model but require capital to
add capacity or to update their equipment to sustain their already fast growth.
Middle market
Middle market companies are usually larger, more established and more profitable than new
ventures. They also tend to be in the retail and manufacturing sectors as opposed to the high
technology sectors. These firms seek private equity finance to effect a change in ownership or
capital structure or to finance an acquisition for expansion purposes. Included in the middle
market are companies that are in financial distress. The companies have usually triggered
default provisions on their current loans. In addition to the financial resources, these companies
will also obtain advisory services from the private equity firm to assist in restructuring the
organization.
Public companies
Public companies that issue private equity are not necessarily in distress. Some of the reasons
these firms issue private equity include; raising funds to effect acquisitions confidentially,
raising funds for complex merger and acquisition activity that may be more suitable for the
private market relative to the public market. The ease of raising funds in the private markets
relative to the public markets is also another reason. Finally, temporary interruptions of access
to public equity may require public firms to seek finance in private markets. These temporary
interruptions may be caused by analysts’ views towards a sector.
Intermediaries
Intermediaries in the private equity market are mainly limited partnerships. These consist of
professional private equity managers working as a team to fulfil the role of the general partner
which is responsible for the day to day running of the fund. Institutional investors invested in
the fund will act as limited partners who do not take part in the day to day operations of the
fund.

10
Investors
The private equity market consist of a broad base of investors which has grown over time.
These investors include corporate pension funds, public pension funds, endowments and
foundations, bank holding companies, wealthy families and individuals, insurance companies
and investment banks (Fenn, Liang and Prowse, 1995). For each investor group the largest
investors tend to invest both directly and through limited partnerships. They typically begin by
investing through limited partnerships and later broaden their scope by initially co-investing
alongside partnerships to gain experience in structuring, monitoring and exiting deals and
ultimately proceeding with their own direct investment programs.
2.2.3. Market dynamics
The private equity market is characterised by boom and bust cycles, particularly in venture
capital. Boom periods are often driven by technological changes, such as personal computers
becoming a consumer product, the rise of the biotech industry in the 1980s, or the internet
revolution during the 1990s (Meyer and Mathonet 2005). The most recent market bust was
witnessed during the recent credit crisis in 2008 (Bain and Company, 2010). During the period
2000 to 2007 there was a liquidity surge in the private equity market with private equity
investors taking advantage of the relatively lower cost of credit during this time period which
fuelled the boom in the market leading to the credit crunch in 2008 (Sousa, 2010). During 2008
increasing loan defaults by over indebted companies lead to tightening of debt covenants and
higher costs of credit, leading to a fall in leverage buyout deal activity in the private equity
market.
2.3. OVERVIEW OF EXISTING LITERATURE
The literature on private equity shows that numerous studies have been carried out on areas of
industry practice such as financing, syndication, monitoring and advising of portfolio
companies (Bergemann and Hege, 1998; Hellmann, 1998; Lockett and Wright, 2001;
Cumming and Johan, 2009). As a specialist financial intermediary, the private equity firm will
provide both financial and non-financial resources to its portfolio companies. Financial
resources are typically provided to portfolio companies in order to facilitate new product
development, working capital enhancements and acquisitions. The introduction of non-

11
financial resources assists in defining the firm’s strategy, professionalising the business
operations and also developing financial and governance policies. This advisory role has been
extensively documented by Gorman and Sahlman (1989), Thompson (2008) and Cumming and
Johan (2009).
Exit behavior still remains a relatively less researched area of the industry with the majority of
research being dedicated to the initial public offering (IPO) and long run performance of
companies whose shares are sold at an IPO (Ritter, 1991; Jain and Kini, 1994; Loughram and
Ritter, 1995; Pagano, Panetta and Zingales, 1998). However, a few studies have also considered
the interaction between more than one exit mode. Cumming and MacIntosh (2003a) is a
comprehensive study of this nature, as it studies the interaction between all exit modes.
2.4. THE INVESTMENT PROCESS
2.4.1. Deal origination
A private equity firm can either source deals through its own networks or receive business
proposals and applications for finance from private companies. The role of the private equity
firm will be to review and quickly make a decision on the merits of the proposals. However,
the good opportunities rarely come through the door or email (Thompson, 2008). As a result
the private equity manager will source better deals through its personal networks. This process
of deal generation is critical for the overall performance of the portfolio as suggested by
(Klonowski, 2010). The importance of deal generation can be explained in three ways. Firstly,
the quality of investments made by the private equity firm depends on the quality of its deal
generation. Well networked private equity firms will have access to better quality deals and
this influences the quality of the investments the firm ultimately makes. Secondly, access to
good quality investments before other private equity firms will provide a competitive edge as
the firm would have the opportunity to form a sound relationship with the management and
founders of the portfolio company, conduct due diligence in an orchestrated manner, and
negotiate a transaction with the most favorable terms. Thirdly, the continuation of strong deal
flow is essential for the going concern of the private equity firm.

12
2.4.2. Screening and selection
Each year venture capital firms receive hundreds of business proposals before deciding which
projects and teams to support (Sahlman, 1990). In addition to this sheer volume there is also
the diversity of issuers in the market, as they may be at various stages of development (Fenn,
Liang and Prowse, 1995). As part of the limited partnership agreement the private equity firm
will develop an investment strategy which will indicate the sector and stage of development
the private equity firm will target and thus influencing the screening and selection of originated
deals (Cumming and Johan, 2009). However, the literature also suggests that managers may
sometimes deviate from their investment objective in response to major changes in market
conditions (Cumming, Fleming and Schwienbacher, 2005). For example, managers have been
found to invest more in early stage high technology projects in times of low liquidity in the
market in order to postpone the exit. Whereas later stage investments would be pursued in times
of high liquidity in order to quickly realise returns. Specifically, the authors find that an
increase in liquidity of 100 IPOs in a year reduces the likelihood of investing in new early-
stage projects by approximately 1.5% to 2.3%.
2.4.3. Contracting
Private equity contracts govern the relationship between the private equity firms and their
portfolio companies. The management of the portfolio company act as agents to the private
equity firm in terms of applying best effort to implement the value creation plan. The private
equity firm also acts as an agent to the portfolio company by providing the required financial
and non-financial resources to achieve the growth objectives of the company. As a result of
this principal agent relationship between the private equity firms and the management of their
portfolio companies there is a risk of agency costs (Cumming and Johan, 2009). Agency costs
are actions that one party to a contract may take which are beneficial to their interest but at the
detriment of the other party. (Sahlman, 1990) identifies three main control mechanisms that
the private equity firm may use to minimise the potential agency costs which are; 1) Financing
by means of convertible securities 2) Syndication of investments and 3) Staging of financing.

13
2.4.4. Use of convertible securities
The empirical literature has generally supported the view that convertible preferred equity is
the best form of finance for venture capital and private equity (Bascha and Walz, 2000). One
of the reasons identified in the literature is that convertible preferred equity is perceived as a
more flexible investment security as it allows the owner/manager to remain in control of the
daily operations of the business and leaves the private equity firm with the option to convert
its interest into equity and effectively gain control over the exit, if required. This is particularly
important from a venture capital perspective as the businesses are usually involved with high
technology which the venture capital firm may not have adequate expertise in. However as the
majority of the literature has been based on the U.S. market, this view ignores the effect of the
tax legislation in the U.S. and the bias that this creates towards convertible preferred equity
(Gilson and Schizer, 2003).
2.4.5. Syndication
One of the ways in which a private equity firm may invest is through syndication. Syndicates
are a form of inter-firm alliance in which two or more private equity firms invest together in a
portfolio company and share a joint pay-off. The literature identifies benefits associated with
syndication at the fund level as well as at the portfolio company level. At the fund level
portfolio diversification has been found to be the main benefit of syndication (Lockett and
Wright, 2001; Manigart, Meuleman, Wright, Bruining, Landstr¨om, Desbri`eres, Hommel,
2006). The literature suggests that by working with more established and well networked firms
a private equity firm may gain access to better and larger deals in diverse industries and
geographies. At the portfolio company level syndication has been suggested to lead to
improved decision making throughout the investment process (Learner, 1994; Brander, Amit
and Antweiler, 2002). By syndicating the private equity firm will be able to share in industry
specific knowledge and skills of its syndicate which should improve portfolio company
selection and screening as well as add more value to the portfolio company throughout the
investment process. Where the portfolio company is exited by means of an IPO, syndication
has also been found to increase the level of certification and reduce underpricing at IPO
(Chahine, Wright and Filatotchev, 2007).
Recent literature also considers the costs of syndication to the private equity firm and how these
costs react to a change in the level of experience of the private equity firm. Casamatta and

14
Haritchabalet (2007) suggests that although the private equity firm may enhance value by
sharing its investment with other private equity firms it also creates indirect competition for
the deal and must forego part of the projects surplus. This cost is suggested to increase along
with the experience of the private equity firm. Secondly, syndicating and sharing ownership of
a portfolio company can weaken the incentive of the private equity firm to apply best effort as
they become over reliant on their syndicate partners. This cost decrease as the private equity
firm gains experience.
2.4.6. Staging of finance
Staging ensures that financial resources are invested by means of instalments, with each
successive instalment being done after specific business targets have been hit (Caselli, 2010).
Gompers (1995) finds that staging the capital infusions into a portfolio company allows the
private equity firm time to gather information as well as monitor the performance of the
portfolio company. This allows the private equity firm the option to abandon unsuccessful
projects at any time.
2.4.7. Pre-planned exits
Private equity firms may, in some cases, pre-plan their exits from a portfolio company.
Cumming and Johan (2009) argue that the pre-planned exit, particularly in the case of M&A,
need not be disclosed to the entrepreneur as this typically involves the sale of the entire business
and removal of the entrepreneur as CEO. Consequently, the need for control over the eventual
exit is expected to influence security design and allocation of control rights. Bascha and Walz
(2000) show that by using convertible securities the private equity firm has the flexibility to
achieve the optimal exit decision. The authors argue that the use of convertible securities allows
the private equity firm an option to gain control over the exit decision in the case where the
private equity firm and management disagree on the optimal exit mode.

15
2.4.8. Monitoring
Monitoring of investments commences after the private equity firm has concluded the deal to
finance its investee company. Klonowski (2010) suggests that once the investee firm has been
funded, venture capitalists focus on maintaining the operational efficiency of the business,
developing the business according to the pre-agreed upon business plan, achieving operational
and financial milestones and performing operational reviews and audits. The managing and
monitoring of investments must ensure the creation of value and the control of any
opportunistic behavior of the financed portfolio company (Caselli, 2010). For venture capital
firms specifically, Sapienza (1992) suggests that more frequent and open communication
between the lead investor and the CEO and the less conflict of perspective between the
capitalist and CEO leads to greater value add during the monitoring stage. For the buyout
market Acharya, Gottschalg, Hahn and Kehoe (2013) suggests that the abnormal performance
from buyout deals are driven by changes in operating performance of the portfolio company
and human capital factors such as deal partner skill. Changes in operational performance are
brought about by operational improvement implemented by the private equity firm. Deal
partner skill is derived from their previous experience. Deal partners with a strong operational
background (e.g. ex-accountants or ex-industry-managers) generate significantly higher
performance in organic deals. In contrast, partners with a background in finance (e.g. ex-
bankers or ex-accountants) more successfully follow an M&A-driven or inorganic strategy.
2.4.9. Exit
There are various ways through which a private equity firm may exit its investment in a
portfolio company. Cumming and Macintoch (2003a) give a good account of general exit
behavior. They propose an optimal investment duration for private equity portfolio companies.
The authors suggest that the greatest value add by the private equity firm to its portfolio
companies occurs at the initial stages of investment when key decisions, such as the selection
of management, are taken. Over time the marginal value added by staying invested in the
portfolio company is expected to decrease as the management of the portfolio company gains
experience. Therefore, at some point the private equity firm will no longer be able to generate
a positive marginal value add by staying invested in the company and would look to exit the
investment. They also hypothesized that higher quality firms would be exited in decreasing
order of likelihood by IPO, acquisition, secondary sales, buyback and write-off. Their results

16
showed that the IPO was the preferred mode of exit for high value companies whiles write-offs
were associated with the least valuable companies. Although inconclusive their results
generally supported the order amongst the remaining modes of exit. Ideally, where a portfolio
company has performed well against its business plan and achieved high profitability the
private equity firm will seek the most lucrative exit. In these circumstances, the portfolio
company is likely to have already lured interested buyers or been approached by investment
bankers promising a successful IPO (Klonowski, 2010).
2.4.10. Partial exits
There are also instances where the private equity firm may seek a partial as opposed to a full
exit. A full exit in an IPO involves a sale of all of the private equity firm’s holding within one
year of the IPO; a partial exit involves sale of only part of the Private equity firm’s holdings
within that period. A full acquisition exit involves the sale of the portfolio company for cash.
In a partial acquisition exit, the private equity firm receives shares in the acquirer, which are
often illiquid, instead of cash. In the case of a buyback exit or secondary sale, a partial exit
entails a sale of only a part of the private equity firm’s holdings. A partial write-off involves a
write down of the investment below cost. The literature reviewed suggests that there is a
signaling effect associated with partial exits (Leland and Pyle, 1997; Lin and Smith 1997;
Cumming and Macintosh, 2003b). By retaining a partial interests in its portfolio company the
private equity firm signals the quality of the investment as private equity investors would not
hold on to bad investments.
2.5. THE IMPORTANCE OF THE EXIT
The importance of the exit is very clear from the literature. The ability of the private equity
firm to exit its investments can be linked to the overall viability of the private equity investment
model. Black and Gilson (1998) suggest that the exit facilitates efficiency in the relationships
that the private equity firm has with its portfolio company and its investors. Firstly, the realized
proceeds from exit provides investors with a reliable measure of the private equity firm’s
performance. Secondly, distribution of exit proceeds allows investors to reallocate funds to
better performing private equity firms. In its relationship with the portfolio company the skills
and expertise of the private equity firm become less relevant over time as the management of

17
the portfolio company gains experience. Therefore it is required that the private equity firm
reallocates its financial and non-financial resources to new portfolio companies and thus
becoming a repeat investor. There are also reputational benefits associated with exit. Gompers
(1996) suggests that less experienced private equity firms will look to boost their reputation by
using the IPO as an exit mode. Based on the literature it is clear that the exit is crucial for both
the ability of the private equity firms to attract future investors as well as the recycling of funds
through the industry as a whole.
2.6. INVESTMENT DURATION
Throughout the literature there seems to be a link between investment duration and choice of
exit mode. Firstly, Gompers (1996) suggests that less experienced private equity managers
were more likely to exit their portfolio companies prematurely using the IPO. Cumming and
Macintosh (2001) also make findings in support for this grandstanding hypothesis. Write-offs
have also been found to be associated with short investment durations (Cumming and
Macintosh, 2003a and Schmidt, Steffen and Szabo, 2007). The literature suggest that private
equity managers are able to distinguish between good and bad investments and will thus
quickly identify and write-off bad investments in their portfolio. There also appears to be a
relationship between investment duration and the level of funds available for investment in the
market as suggested by (Cumming and Macintosh, 2001). In a study of 112 exits in the USA
and 134 exits in Canada between 1992 and 1995 the authors find that greater levels of capital
in the industry was associated with shorter investment duration. The authors argue that these
findings demonstrate the time constraint associated with monitoring of portfolio companies by
private equity firms. An increase in the level of funds available for new investments results in
an increase in the opportunity cost of staying invested in the current portfolio companies for
too long. This suggest that duration will be shorter when there is a greater amount of capital
for investment.

18
2.7. EXIT MODES
2.7.1. Initial public offering
The IPO involves the sale of the portfolio company’s shares to the public. It is worth noting
that in most cases the private equity firm will not sell all or even part of its interest at an IPO.
Rather, securities will be sold into the market over a period of months or even years after the
IPO (Cumming and Macintosh 2003b). The implication is that the IPO will not necessarily
guarantee liquidity although it may attract a higher valuation for the portfolio company. The
literature on IPOs also suggest that it is a mode of exit for the best performing companies
(Wang and Sim, 2001; Schwienbacher, 2002; Schmidt, Steffen and Szabo, 2007). As a result
it is generally regarded as the most profitable mode of exit. From a contracting perspective
Black and Gilson (1998) argue that the IPO is the only exit that provides an entrepreneur and
private equity firm the opportunity to contract implicitly over control. This means that the IPO
allows a successful entrepreneur to regain control of their company once the private equity firm
disposes of its interest to the public without explicitly contracting for this return of control.
Therefore, given the right market conditions the IPO will be attractive to both the private equity
firm and the management of the portfolio company.
2.7.2. M&A (Acquisition)
In an acquisition the entire portfolio company is acquired by a strategic investor. This would
typically involve the replacement of current management and shareholders. As we know that
the IPO is an exit mode for the best performing portfolio companies, it is not surprising that
the returns generated from acquisitions are not as high as for IPOs (Bygrave and Timmons,
1992; Wall and Smith, 1997; Bienz and Leite, 2008). However, there are also benefits to the
acquisition exit. Acquisitions are attractive to private equity firms because of their strong
pricing potential and instant liquidity (Klonowski, 2010). The pricing potential of acquisitions
lies in the synergies that the strategic acquirer may unlock from the portfolio company.
Additionally, strategic acquirers will tend to use newly acquired entrepreneurial subsidiaries
for research and development purposes. Therefore a strategic acquirer would, in most cases, be
prepared to pay a premium. The instant liquidity of the acquisition exit steams from the fact

19
that the private equity firm will typically receive cash, after any escrow2 arrangements, for their
interest in an acquisition exit.
2.7.3. Secondary sale
In a secondary sale the private equity firm sells its interest in the portfolio company to another
private equity firm or other strategic investor while other shareholders remain invested.
Although this exit method has previously been regarded as an exit of last resort, recent
academic research appears to suggest something different. (Achleitner, Bauer, Figge and Lutz,
2012) find, in a study of 1100 leveraged buyouts closed between 1995 and 2008 in North
America and Europe, that the level of returns on secondary sale exits were comparable to that
of the initial public offering and thus concluding that the secondary sale is not an exit of last
resort.
2.7.4. Buyback
In a buyback the private equity firm will exit from its investment by selling its stake back to
the portfolio company. This usually occurs when the portfolio company has extra cash or when
it can borrow money from a bank (Wang and Sim, 2001). An important thing to realize about
the buyback is that it does not raise any new capital for the portfolio company. Cumming and
Macintosh (2003a) suggest that buybacks are usually triggered by the exercise of put and call
options held by either the private equity firm or the portfolio company. As a result buyback
exits indicate a failure to achieve performance targets or secure other lucrative exits.
2.7.5. Write-offs
Essentially a write off is a failure. Private equity firms are often required to write-down or
write–off poorly performing portfolio companies. The literature suggests that the time taken to
write-down or write-off investments can be an indication of manager skill. Cumming and
Macintosh (2003a) find that shorter holding periods were associated with high probabilities of
write-offs as private equity managers would quickly write-off bad investments in order to
signal their ability to distinguish between good and bad investments. Schmidt, Steffen and
2 Purchasers in a trade sale may often require that a portion of the purchase price be held in Escrow for a period
of time following the transaction as part of the warranties provided by the private equity firm as a seller
(Klonowski 2010).

20
Szabo (2007) also find strong support for this hypothesis in a study of 675 management buyout
(MBO) and leveraged buyout (LBO) exits over the period 1990 through 2005 in Europe and
USA.
By far the most important of the exit methods identified above are the IPO and Acquisition
(Black and Gilson, 1998). This is due mainly to the level of returns generated by these modes
of exit exceeding the other modes. As a result the majority of the literature dealing with exits
tends to focus on these two exit modes. Aside from the different levels of return generated by
each type of exit, various other factors can also influence choice of exit.
2.8. FACTORS AFFECTING CHOICE OF EXIT
2.8.1. Industry focus of Portfolio Company
It has been found that Portfolio companies in the high technology sectors are more likely to be
exited by IPO as compared to those in other sectors (Gompers, 1995). The literature suggests
a few reasons for this. Firstly, portfolio companies in high technology sectors have been found
to be relatively more successful compared to those in other sectors. Secondly, these companies
have also usually invested significantly in research and development, which has been found to
be one of the key determinants of the amount of capital that a company can raise at IPO (Deeds,
Decoralis and Coombs, 1997). The idea here is that although the company has no products in
the market its research could potentially lead to scientific breakthroughs. These conditions are
particularly prevalent in bio-technology firms. Consequently they require significant capital
investment in order to achieve their potential (Pagano, Panetta and Zingales, 1998). Hence an
exit by IPO would be very attractive for such a company.
2.8.2. Quality of Portfolio Company
The literature suggests that higher quality firms are more likely to be exited by IPO relative to
acquisition, secondary sale and buyback. Cumming and Macintosh (2003a) find that an
increase in the quality of a portfolio company, as captured by its market/book ratio, increased
the likelihood of exit by IPO relative to acquisition, secondary sale and buyback. This appears
to be consistent with the view that only high performing firms are taken public (Schwienbacher,
2002).

21
2.8.3. Type of private equity firm
The literature draws a distinction between independent and captive private equity firms.
Cumming and Johan (2009) point to the corporate structure, compensation and investment
focus as the main differences between independent and captive private equity firms.
Independent private equity firms are structured to be autonomous from their limited partners.
This means the limited partners have little influence on the day to day operations of the general
partner. Alternatively, captive private equity firms are a part of a greater corporate structure
with funds being sourced from their corporate parent. As a result of this autonomy, independent
private equity firms contract with limited partners in a manner that clearly lays out all rights
and responsibilities of both parties over the life of the fund. The general partner is also
adequately compensated to ensure that he is fully incentivised to apply best effort. Investment
professionals at captive private equity firms are compensated like normal employees and
therefore are not as adequately incentivised. Captive private equity firms also tend to invest
only in sectors or technologies that their corporate parent operates in or sectors in which the
government has identified market failures.
The strategic objectives that influence the investment behavior of private equity captives, such
as the development of new technology, also leads them to prefer M&A exits relative to IPO in
order for the their corporate parent to invest in the technology it has developed (Cumming and
Johan, 2009). In summary, independent private equity firms are expected to perform better as
well as achieve more IPOs than corporate and government captives.
2.8.4. Market conditions
The literature also suggests that prevailing market conditions in the debt and equity capital
markets will influence the choice of exit. Brzeszczynski (2012) finds that the number of IPOs
in emerging markets is linked to stock market phases with a higher number of IPOs during
periods of rising stock market prices. Of course the decision is not simultaneous with a time
lag allowing for the time it takes to decide and prepare a company for exit by IPO. Conditions
in the debt capital markets also appear to have an influence on the choice of exit. Sousa (2010),
in a study of 759 private equity exits in Europe from January 2000 to June 2007, finds that the
greater access to credit contributed to creating a ‘window of opportunity’ for the use of the

22
secondary sale and thus explaining its increased use over the sample period. He also finds that
secondary sales were more likely to occur after periods of low stock market returns.
2.9. CHALLENGES TO IPO EXIT IN SOUTH AFRICA
2.9.1. Market structure
Black and Gilson (1998) suggests that stock market centered economies, which are
characterised by large corporations and small banks which play a limited role in corporate
governance, are likely to exhibit higher IPO activity compared to bank centered economies
which are characterised by fewer larger banks which play a central governance role. The
authors argue that stock market centered economies such as the USA provide the entrepreneur
and venture capitalist the opportunity to contract implicitly over control. This means that
although the entrepreneur cannot demand the retention of control over their company at the
time of seeking venture financing they have the opportunity, if successful, at exit to regain
control over their company once the private equity firm exits by means of IPO. The authors
conclude that the entrepreneur’s preference for the IPO will increase the likelihood of this
method being used in stock market centered economies. The empirical literature has generally
supported this hypothesis with authors finding higher probability of IPO exits in stock market
centered economies, usually the USA or the UK, compared to bank centered economies in
Europe (Schwienbacher, 2002; Espenlaub, Khurshed and Mohamed, 2010). However, there
have also been exceptions. Schmidt, Steffen and Szabo (2007), in a study of 672 private equity
exits in Europe and America, find that investments in Europe were more likely to be exited by
IPO compared to those in USA. Even after controlling for sample size to ensure that the
European transactions were not over represented in the total sample, they still fail to find
support for the market structure hypothesis proposed by (Black and Gilson, 1998). Levine
(2002) constructs a broad cross-country dataset to compare bank-centered and market centered
economies. In terms of this dataset South Africa is classified as a bank centered economy. The
importance of this dataset is that it provides a very broad cross-country comparison with a total
of 48 countries which extends the comparison beyond the usual market-centered economies
such as the USA and UK and bank-centered economies such as Germany and Japan.

23
2.9.2. Lack of a vibrant venture capital industry
In addition to South Africa being classified as a bank centered economy it also lacks a vibrant
venture capital industry. The rise and subsequent fall of the South African venture capital
industry is well presented by (Lingelbach, Murray and Gilbert 2009). The authors suggests that
the weakening of embedded relations between public and private actors within the post-
apartheid South African economy prevents coproduction, the transformation of inputs from
individuals in different organisations into goods and services, from taking place. As a result
this prevents the emergence of a vibrant venture capital industry. Consequently, the South
African private equity industry is dominated by Leverage Buyout type funds which typically
invest in mature companies which have the capacity to assume debt. The literature suggests
that such later stage investments are less likely to be exited by IPO compared to early stage
investments (Das, Jagannathan and Sarin, 2002).
Therefore it would appear that by being bank centered as well as lacking a vibrant venture
capital industry would be expected to significantly decrease the likelihood of the IPO exit
within the market.
2.10. EXIT OPPORTUNITIES IN EMERGING MARKETS
Lerner, Ledbetter, Speen, Leamon and Allen (2016) suggest that the ability to enter and exit an
investment and to realise suitable returns is of critical importance to investors especially in
emerging markets where public markets are underdeveloped. However, they find that exit
opportunities in emerging markets are no worse than those in developed markets with investors
potentially benefiting from a greater reliance on the IPO exit.
The authors identify two differences between exit opportunities in emerging markets and
developed markets. The first is the type of exit. IPOs comprise 49% of exits in emerging
markets compared to developed markets where they account for 10% of exits. The second
difference is the holding period. Emerging markets show shorter holding periods compared to
developed markets.

24
CHAPTER 3: METHODOLOGY
In order to answer the research questions we use revealed preference data to predict the
aggregate behaviour of South African private equity firms based on objectively measured
explanatory variables as in (Ben-Akiva and Lerman, 1985). This chapter proceeds by laying
out the research design, data population, and the collection methods used. This is then followed
by a discussion of the research instrument used.
3.1. RESEARCH DESIGN
This study is quantitative in nature and involves the use of statistical modelling to determine
the behaviour of private equity firms at exit. Cumming and Johan (2009) characterise the
relationship between the private equity firm and limited partners of the fund as one where the
private equity firm, as a general partner, is fully responsible for the day to day running of the
fund and is compensated by a fixed management fee as well as a performance fee. They also
find that approximately 77%3 of the general partner’s compensation is liked to his carried
interest4 in the fund. It would suffice to say that the private equity firm is incentivised to act in
a manner that maximises the overall wealth of the fund investors. With this in mind the choice
of exit mode deployed is clearly dependent on the level of wealth maximisation the private
equity firm expects to derive from the exit. Brooks (2008) describes such a choice as being
discrete, as the private equity firm in this case does not view exits in any particular order but
rather aims to always select the route that maximises wealth in a particular exit situation. This
is also in line with the empirical pecking order which states that the private equity firm will
look to deploy the exit mode that maximises returns (Bygrave and Timmons, 1992; Gompers,
1996; Wall and smith, 1997). To model this discrete choice the study uses panel data consisting
of exit events performed by private equity firms predominantly within the South African
market and other African markets to a lesser extent over the sample period of 1995 to 2012.
3 This was based on an informal survey of venture capital firms with, at least, $200 million in capital under management. 4 Sahlman (1990) describes this as the overall return on capital committed after taking annual management fees into account but before any annual bonus to general partners.

25
3.2. POPULATION AND SAMPLE
3.2.1. Unit of measure
The unit of measure in this study is an exited private equity investment. Due to the limited
nature of our data no distinction is made between full and partial exits.
3.2.2. Population
The population of interest in this study consist of independent private equity firms operating in
South Africa. The literature draws a distinction between independent and captive private equity
firms in terms of which Investment professionals of independent private equity firms are
adequately compensated for their role as fund managers whereas those of captive private equity
firms are compensated like normal employees. Based on this it would appear that independent
private equity firms would be expected to exhibit the most efficient behaviour in order to
maximise the wealth of private investors and thus serve as a good reference point for the
analysis of exit behaviour for the purpose of this study.
3.2.3. Sample selection
Due to the confidential nature of private equity data, this study has tried to balance the need for
representative data with its availability. A population of 74 Private equity firms was obtained
from the Southern African Venture Capital and Private Equity Association (SAVCA) website.
Based on these firms we identified a total of 64 exit transactions from 11 independent private
equity firms. Five additional transactions performed by private equity firms not listed on the
SAVCA website (AKA Capital and African Agricultural Capital) were also identified during
the research process. This resulted in a total sample of 69 exit transactions performed by 13
independent private equity firms within the period of analysis, from 1995 to 2012. Thirteen of
the sampled exit transactions were performed in other African markets. Table 3.1 presents the
sampled private equity firms as well as their year of establishment and assets under
management as at 31 December 2012.

26
Table 3.1 Sampled private equity firms
Private equity firm Year
established
Fund size or Funds
invested to date (USDm)
start-ups
investment
4DI Capital 2009 n/a YES
Actis 2004 1922 NO
African Agricultural Capital 2005 n/a n/a
AKA 2001 n/a n/a
Aureos 2001 536 NO
Brait 1991 2604 NO
Capitalworks 2006 177 NO
ECP 2000 2413 NO
Ethos 1984 1815 NO
Horizon 1992 35 NO
Kingdom Zeipher 1990 200 n/a
Medu 2003 136 NO
Sphere 2001 36 NO Source: Financial Mail 2012
3.3. DATA COLLECTION
Transaction data was obtained from S&P CapitalIQ5 and official private equity firm websites.
The annual private equity market review published by the SAVCA was also used as a source
of overall market analytics.
For the purpose of this study the sample selected consists of private equity exits by independent
private equity firms over the period of 1995 to 2012. The process of data collection began with
the identification of all registered private equity firms as reported by the SAVCA. As at 31
December 2012 the SAVCA had 74 members. Table 3.2 provides a breakdown of members of
the SAVCA by type and their portion of funds under management. Independent private equity
firms dominate the market with approximately 49% of total funds under management.
Government and financial services captives each contribute 24% with other captives and
investment holding companies making up 2% and 1%, respectively. Transaction level data
gathered includes; investment duration, private equity firm experience (years), Industry focus
of portfolio company and the country headquarters of the portfolio company.
5 S&P Capital IQ is a provider of multi-asset class and real time data, research and analytics.

27
Table 3.2 Funds under management at 31 December 2012
SAVCA members Number of firms Funds under management
(ZAR bn)
Captives Other 6 3.0
Captives Government 6 30.4
Captives Financial Services 13 29.8
Investment holding company 2 1.5
Independents 47 61.7
TOTAL 74 126.4
Source: (KPMG and SAVCA 2013) Venture Capital and Private Equity Industry Performance Survey of South Africa as at the 2012 calendar
year.
3.4. THE RESEARCH INSTRUMENT
As part of the study we aim to determine the probability of occurrence of an exit mode given a
set of objectively identified explanatory variables. In order to estimate the probability of a
qualitative dependent variable a logistic regression as described in Brooks (2008) shall be used.
A major drawback of the basic logit model is its inability to handle more than one dependent
variable. As there are several exit modes to be considered simultaneously in the model it is
required that a generalisation of the simple logit model is used. Furthermore, due to the utility
maximisation objective of the private equity firm at exit the dependent variables in this case
can be regarded as unordered responses6. To cater for all these specifics the multinomial logit
model, first developed by Theil (1969), has been selected as the best possible form of logistic
regression to be used. The approach utilised in this research is very similar to Cumming and
MacIntosh (2003a), except that we do not have sufficient information to include a variable
representing firm quality.
Wang and SIM (2001) also supplemented logistic regression with a case study. This is
considered superior to a survey as it can explain casual links in real life interventions that may
be too complex for a survey (Yin, 1994). Unfortunately the intimate level of detail required for
a case study was unobtainable in this case. For the purpose of implementing our model we first
6 As explained earlier the private equity firm does not view exits in any particular order but rather selects an exit mode based on its ability to maximise returns within a given exit scenario.

28
identify the dependent variable as one of the following exit modes: IPO, M&A, Secondary sale
and Buyback. We did not identify any write-offs in our data.
We then identify the independent variables as Investment duration, private equity firm
experience, Industry focus, Country of headquarters, exchange rate, GDP growth rate, Inflation
rate and lending interest rate. The logit regression model equations for estimating the utilities
associated with each exit mode are as follows;
VIPO, = β0 + β1IDit + β2PEExt + β3IFit + β4CHit + β5RDERt + β6GDPRt + β7IRt + β8LRt + εt
VM&A = β0 + β1IDit + β2PEExt + β3IFit + β4CHit + β5RDERt + β6GDPRt + β7IRt + β8LRt + εt
VSS = β0 + β1IDit + β2PEExt + β3IFit + β4CHit + β5RDERt + β6GDPRt + β7IRt + β8LRt + εt
VBB = β0 + β1IDit + β2PEExt + β3IFit + β4CHit + β5RDERt + β6GDPRt + β7IRt + β8LRt + εt
Where;
VIPO is the utility associated with the IPO exit.
VM&A is the utility associated with the M&A exit.
VSS is the utility associated with the secondary sale exit.
VBB is the utility associated with the buyback exit.
β0 is the intercept.
β1-8 is the beta coefficient associated with each explanatory variable.
IDit is the investment duration for an investment i at time t. This variable is captured in
years from date of original investment to date of exit.
PEExt is the experience of private equity firm x at time t. The variable is captured as
the number of years from date of establishment of the firm to date of original investment
into a portfolio company.
IFit is a dummy variable indicating the industry focus of investment i at time t. The
variable is captured as “1” for an investment within a high technology sector and “0”
for investments in other sectors.

29
CHit is a dummy variable indicating the location of the headquarters of investment i at
time t. The variable is captured as “1” for investments made within the South African
market and “0” for investments made in other African markets.
RDERt is the exchange rate at time t. The variable is captured as the average rand:
dollar (ZAR: USD) exchange rate during the year of exit.
GDPRt is the GDP growth rate at time t. The variable is captured as the GDP growth
rate of South Africa during the year of exit.
IRt is the inflation rate at time t. The variable is captured as the annual % change of
the CPI in South Africa during year of exit.
LRt is the lending rate at time t. The variable is captured as the lending rate in South
Africa during the year of exit.
εt is the error term from the logistic regression at time t.
In order to determine the probability of selection associated with each exit mode the following
equations must be solved;
𝑃𝑟(𝐼𝑃𝑂) =𝑒𝑥𝑝(𝑉𝐼𝑃𝑂)
exp( 𝑉𝐼𝑃𝑂)+exp( 𝑉𝑀&𝐴)+exp( 𝑉𝑆𝑆)+exp (𝑉𝐵𝐵) (3.1)
𝑃𝑟(𝑀&𝐴) =𝑒𝑥𝑝(𝑉𝑀&𝐴)
exp( 𝑉𝐼𝑃𝑂)+exp( 𝑉𝑀&𝐴)+exp( 𝑉𝑆𝑆)+exp (𝑉𝐵𝐵) (3.2)
𝑃𝑟(𝑆𝑆) =𝑒𝑥𝑝(𝑉𝑆𝑆)
exp( 𝑉𝐼𝑃𝑂)+exp( 𝑉𝑀&𝐴)+exp( 𝑉𝑆𝑆)+exp (𝑉𝐵𝐵) (3.3)
𝑃𝑟(𝐵𝐵) =𝑒𝑥𝑝(𝑉𝐵𝐵)
exp( 𝑉𝐼𝑃𝑂)+exp( 𝑉𝑀&𝐴)+exp( 𝑉𝑆𝑆)+exp (𝑉𝐵𝐵) (3.4)
Where Pr(IPO), Pr(M&A) , Pr(SS) and P(BB) are probabilities of exit by IPO, M&A,
Secondary sale and Buyback. VIPO, VM&A, VSS and VBB are the utilities associated with each exit
mode. In order to estimate the model one of the sets of coefficients must be normalised to zero
and thereby serve as a reference category for all other probabilities to be estimated by reference
to this exit mode. In our case M&A has been selected as the base category and therefore no
coefficients are estimated for this category. It is also common to replace the equations 3.1 to
3.4 with a single general equation to represent the probability of any alternative;

30
𝑃𝑟(𝑖) =𝑒𝑥𝑝(𝑉𝑖)
∑ exp (𝑉𝑗)𝑗=𝐼𝑃𝑂,𝑀&𝐴,𝑆𝑆,𝐵𝐵 (3.5)
Where (𝑖) indicates the alternative for which probability is being computed. This formation
implies that the probability of choosing an alternative increases monotonically with an increase
in the systematic utility of that alternative and decreases with increases in the systematic utility
of each of the other alternatives (Koppelman and Bhat, 2006).
3.4.1. Sample size dependent efficiency of logistic regressions
Logistic regression tends to overestimate beta coefficients for sample sizes less than 500. This
effect however is negligible for single studies and is more pronounced where results of multiple
studies are pooled together for total analysis. Peduzzi, Contcato, Kemper, Holford and
Feinstein (1996) suggest a minimum of 10 events per independent variable for running logistic
regressions. Our dataset satisfied this requirement.
The following preliminary tests were performed to ensure the validity and accuracy of the
results from the analysis.
3.4.2. Multicollinearity
The panel data utilised for this study was tested for multicollinearity.
3.4.3. Independence of irrelevant alternatives (IIA)
The independence of irrelevant alternatives is one of the main assumptions of the multinomial
logit model which was first explored by Arrow (1951). This choice axiom applied to the
multinomial logit model dictates that if alternative “a” is a preferred choice from a set of “a”
and “b” alternatives, the existence and subsequent inclusion of alternative “c” into the set
will not improve the probability of selecting “b” within the set of “a”, “b” and “c”. The
independence of irrelevant alternatives assumption was tested using the Hausman-McFadden
test (Hausman and Mcfadden, 1984).

31
3.5. DATA ANALYSIS
Correlation analysis, trend analysis and Hypothesis testing are conducted using stata 12.0 to
determine the effects of the explanatory variables on the dependent variables, and the
relationships that exist among them.
3.5.1. Hypotheses Testing
Hypothesis testing is carried out on equations 3.1 to 3.4.
Hypothesis 1: Industry of Portfolio Company
H1: Portfolio companies within high technology sectors are more likely to achieve an IPO
exit relative to other exits.
Hypothesis 2: Debt capital markets
H2: Lower lending rates will increase the likelihood of a secondary sale exit.
Hypothesis 3: Market structure
H3: As a bank-centered market we expect investments in South Africa to exhibit low IPO
activity, with M&A being the most preferred mode of exit.

32
CHAPTER 4: RESULTS AND DISCUSSION
4.1. PRESENTATION AND DISCUSSION OF REULTS
The empirical analysis and results are based on the 69 transactions sampled over the period
1995 to 2012. The transaction data collected is tabulated in Appendix A. The natural log of
investment duration and private equity firm experience were included as part of the explanatory
variables to make the model more stable. The results of the correlation test are presented in
Table 4.1.
4.1.1. Analysis of correlation matrix
An analysis of the correlation between test variables is presented below. Review of the
correlation matrix suggests that the explanatory variables are not significantly correlated. As
the multinomial logit is a non-linear model any correlations identified do not strictly suggest a
direct linear relationship between the variables.
Table 4.1 Correlation matrix
Investment
duration
(years)
Log of
Investment
duration
(years)
Private
equity
firm
experience
(years)
Log of
private
equity
firm
experience
(years)
Industry
focus
(dummy)
Country
headquarters
(dummy)
Investment duration
(Years) 1.00
(LN) Investment
duration (years) 0.95 1.00
Private equity firm
experience (years) 0.02 0.00 1.00
(LN) Private equity
firm experience
(years)
0.10 0.06 0.89 1.00
Industry focus
(dummy) 0.10 0.14 -0.07 -0.10 1.00
Country of
headquarters
(dummy)
0.16 0.18 0.39 0.52 0.06 1.00
Exchange rate 0.06 0.12 0.02 -0.07 0.09 -0.15
GDP growth rate -0.02 -0.08 0.32 0.38 -0.05 0.28
Inflation Rate -0.11 -0.08 -0.19 -0.27 0.11 -0.12

33
Lending interest rate -0.18 -0.13 -0.17 0.01 0.06 0.16
Table 4.1 Correlation matrix (continued)
Exchange
rate
GDP
growth rate
Inflation
rate
Lending
interest
rate
Exchange rate 1.00
GDP growth rate -0.31 1.00
Inflation rate 0.37 -0.25 1.00
Lending interest rate -0.28 -0.20 0.46 1.00
The Macroeconomic variable of importance for the purpose of this study is the lending rate.
The lending rate is not expected to have any relationship with the investment level variables
identified. The correlation of -0.02 between investment duration and GDP growth rate suggests
that the sampled private equity firms achieved quicker exits in years of high GDP growth rate.
Based on the correlation matrix above there does not appear to be any multicollinearity between
the test variables.
4.1.2. Descriptive analysis
Table 4.2 presents an analysis of the sampled transactions by mode of exit. Out of the total
number of transactions 13 were executed outside of South Africa but still within Sub-Saharan
Africa. M&A showed the greatest frequency with 40 transactions followed by Buybacks
totalling 15 as well as 10 Secondary sale transactions and 4 IPOs.
Based on our sample, investments exited by M&A were associated with the longest average
investment duration of 5.6 years. The quickest form of exit over the sample period was the
buyback which had an average investment duration of 4.5 years. Secondary sales and IPOs fall
in between with 5.1 years and 4.9 years, respectively. The sample data suggests that M&A exits
are performed by the most experienced firms, with an average of 8.4 years of experience at
date of divestment. The IPO is associated with private equity firms of the lowest years of
experience of 4.9 years. This set of results appears to provide support for the grandstanding
hypothesis proposed by (Gompers, 1996). In terms of the grandstanding hypothesis, younger
venture capital firms will exit their portfolio companies prematurely using the IPO in order to
boost their reputation in the industry.

34
The sample consists of 20 technology firms, of which 12 were exited by means of M&A, 5 by
buyback, 2 by Secondary sale and 1 by IPO. It is interesting to observe that only one out of the
20 high technology firms was exited by means of IPO. This appears to provide anecdotal
evidence for hypothesis 3 as the majority (95%) of the high-technology portfolio companies
were exited using other exit modes besides the IPO.
Table 3.2 Sample exit transactions by mode of exit
Exit mode
Number of
portfolio
companies
Average
investment
duration
High
Technology
industry
PE firm
experience
IPO 4 4.92 1 4.94
M&A 40 5.57 12 8.44
Secondary sale 10 5.07 2 6.38
Buyback 15 4.53 5 7.27
Total 69 5.23 20 7.68
4.1.3. Trend analysis
Figure 4.1 presents the total number of exits per year by mode of exit over the sample period.
The sample data shows a gradual increase in the total number of exits from the late 1990s
through to the early 2000s. A total of 12 exit transactions were identified between 1995 and
2002. We do not observe any IPO transactions within this period although it coincides with the
global dot-com boom. This may be due to limitations of our dataset. The majority of exit
transactions occur between the years 2003 and 2007 with a total of 42 transactions identified
during this period. We see a decline in the number of transactions in 2008 with only 2 exit
transactions identified. According to Bain & Company (2010), higher cost of credit during the
global credit crisis limited deal activity, specifically as it relates to buyouts (M&A and
Secondary). After 2008 the number of exits continues on an increasing trend with 4 exits in
2009, 5 in 2010, 7 in 2011 and 4 in 2012. The most frequent exit mode, M&A, seems to closely
follow the trend described above with peaks in 2004 and 2011 with 6 and 7 transactions
respectively. IPO exits are identified in 2004, 2007, 2008 and 2009 with only one transaction
each year. Secondary sales in our sample occur between the year 2000 and 2007. We observe
1 transaction in 2000, 5 in 2003, 1 in 2005 and 3 in 2007. Buybacks appear to be more evenly
distributed across the sample period with at least 1 buyback in 11 out of the total 18 years under
review.

35
Figure 4.1 Exits by year
Source: S&P CapitalIQ7
.
4.1.4. Investment duration and undrawn commitments
Figure 4.2 presents average investment duration and total undrawn commitments over the
period 2001 to 2012. The graph shows that average investment duration appears to increase
during lower levels of undrawn commitments and decrease at peak levels of undrawn
commitments. There is a clear upwards trend in both indicators from the year 2001 up to about
2005 after which average investment duration declines rapidly from 7.1 years in 2005 to 4.7
years in 2006 and 4.9 years in 2007 whereas the level of undrawn commitments reaches its
peak at R25.3bn in 2006 and R31.6bn in 2007. As undrawn commitments begin to decrease in
2008 the average investment duration also begins to increase from 4.9 years in 2007 to 6.2
years in 2008. This trend appears to be consistent with empirical findings of Cumming and
Macintosh (2001) which suggests that when a private equity firm’s opportunity cost of staying
invested in a portfolio company increases, evidenced by increases in the level of funds available
for investment in the market, investment duration will be shorter as the private equity firm has
incentive to exit its portfolio companies sooner in order to invest the undrawn commitments.
7 S&P Capital IQ is a provider of multi-asset class and real time data, research and analytics.

36
Figure 4.2 Average investment duration and undrawn commitments
Source: (KPMG and SAVCA 2013) Venture Capital and Private Equity Industry Performance Survey of South Africa as at the 2012
calendar year.
4.1.5. Multinomial logit result
In order to test the study’s hypotheses, we have employed a multinomial logit model. The
dependent variables in our model are the exit modes; IPO, M&A, Secondary sale and Buyack.
The multinomial logit model estimates j-1 binary logits, where there are ‘J’ outcomes with one
of the outcomes representing the base category. By design, STATA uses the most frequent
mode of exit as the base category. Therefore, M&A was used as the reference category, with
results presenting the other three modes of exit which will then be interpreted relative to M&A.
The explanatory variables used in this study consist of investment level variables and
macroeconomic variables. Table 4.3 presents investment level variables which consist of
investment duration, private equity firm experience, industry focus of portfolio company and
country headquarters of portfolio company. Table 4.4 presents the macroeconomic variables
which consist of the exchange rate (Rand/US dollar), GDP growth rate, inflation rate and
lending rate.
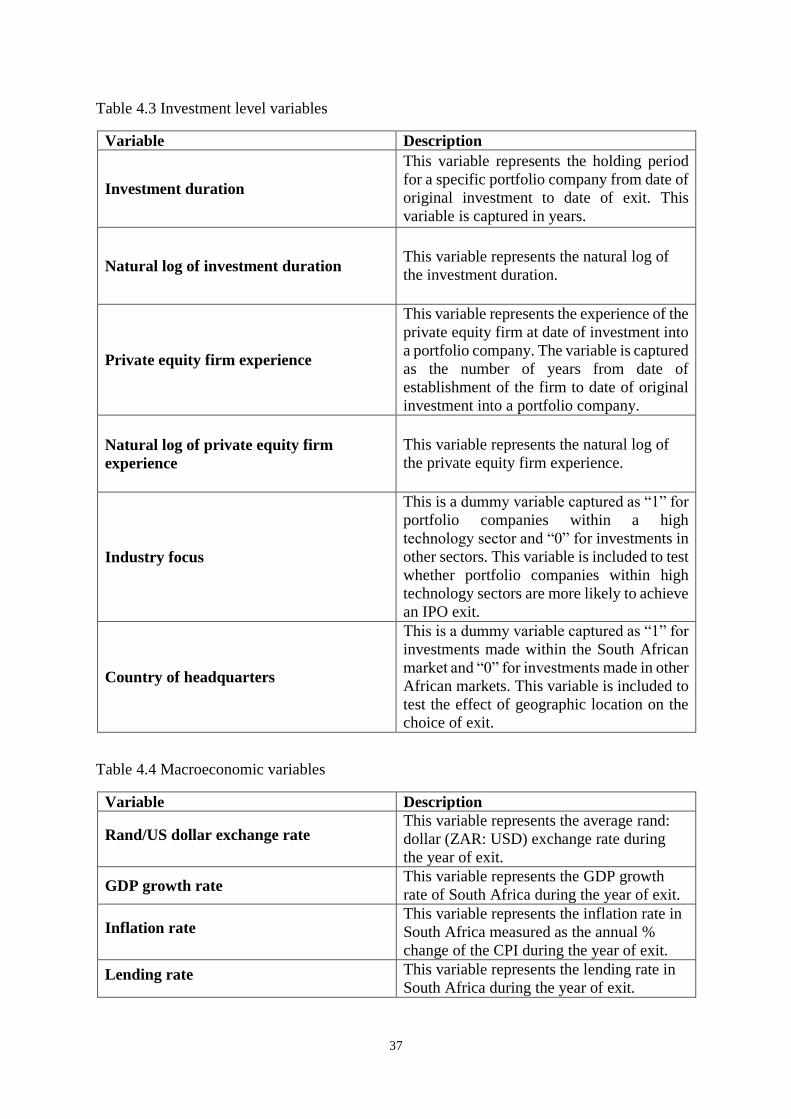
37
Table 4.3 Investment level variables
Variable Description
Investment duration
This variable represents the holding period
for a specific portfolio company from date of
original investment to date of exit. This
variable is captured in years.
Natural log of investment duration This variable represents the natural log of
the investment duration.
Private equity firm experience
This variable represents the experience of the
private equity firm at date of investment into
a portfolio company. The variable is captured
as the number of years from date of
establishment of the firm to date of original
investment into a portfolio company.
Natural log of private equity firm
experience
This variable represents the natural log of
the private equity firm experience.
Industry focus
This is a dummy variable captured as “1” for
portfolio companies within a high
technology sector and “0” for investments in
other sectors. This variable is included to test
whether portfolio companies within high
technology sectors are more likely to achieve
an IPO exit.
Country of headquarters
This is a dummy variable captured as “1” for
investments made within the South African
market and “0” for investments made in other
African markets. This variable is included to
test the effect of geographic location on the
choice of exit.
Table 4.4 Macroeconomic variables
Variable Description
Rand/US dollar exchange rate This variable represents the average rand:
dollar (ZAR: USD) exchange rate during
the year of exit.
GDP growth rate This variable represents the GDP growth
rate of South Africa during the year of exit.
Inflation rate This variable represents the inflation rate in
South Africa measured as the annual %
change of the CPI during the year of exit.
Lending rate This variable represents the lending rate in
South Africa during the year of exit.

38
Hypotheses
The hypotheses for this study are limited to independent private equity firms operating within
the South African market. The hypotheses tested are summarised in Table 4.5 below.
Table 1.1 Summary of hypothesis testing
Null hypothesis Alternative hypothesis
Hypothesis 1 High technology portfolio
companies are less likely to be
exited by IPO relative to other exit
modes.
High technology portfolio
companies are more likely to be
exited by IPO relative to other exit
modes.
Hypothesis 2 Lower lending rates will not
increase the likelihood of a
secondary sale exit.
Lower lending rates will increase
the likelihood of a secondary sale
exit.
Hypothesis 3
As a bank-centered market which
lacks a vibrant venture capital
industry, South Africa is expected
to experience high IPO activity,
with IPO being a more probable
mode of exit relative to M&A exit.
As a bank-centered market, which
lacks an active venture capital
industry, South Africa is expected
to experience low IPO activity, with
M&A being the most probable
mode of exit relative to IPO exit.

39
Summary of Multinomial estimates
In the summary results below, each coefficient can be interpreted as the change in the relative
log odds of a portfolio company being exited through the identified exit mode relative to the
M&A exit mode. The p-value measures the statistical significance of the relationship. Table
4.6 below presents a summary of the results of the hypothesis testing for the sampled private
equity exit transactions. See appendix B and C for full model results.
Table 4.5 Summary of results of hypothesis testing for the sampled exit transactions
Hypothesis H1 H2 H3
Exit mode IPO Secondary sale M&A
Variable Industry focus Lending rate All
Coefficient -48.04 0.39 See table 4.8
Marginal effect -0.00 0.05 See table 4.8
t-statistic -18.87*** 2.47*** See table 4.8
Predicted
probability 0.01 0.08 0.73
Decision Accept Reject Accept
Findings
Companies in the
High technology
sector are relatively
more likely to be
exited by M&A as
opposed to IPO.
An increase in the
lending rate appears
to suggest an
increase in the
likelihood of the
Secondary sale.
Predicted
probabilities suggest
that M&A is the most
likely method of exit.
*, **, *** significance at the 90%, 95% and 99% levels respectively.
Hypothesis 1: The effect of the Industry focus of the portfolio company on the likelihood of an
IPO exit
We hypothesised that portfolio companies within high technology sectors would be more likely
to be exited by IPO as opposed to other exit modes. The industry focus variable has a coefficient
of -48.04 and an associated p-value of 0.00. The coefficient of -48.04 suggest that being in the
high technology sector is associated with a 48.04 decrease in the log likelihood of the portfolio
company being exited by means of IPO relative to M&A. This relationship is significant at the

40
95% confidence level. Although this does not provide support for hypothesis 1 it appears to
partly support hypothesis 3, as it shows the low likelihood of the IPO exit relative to M&A
even amongst high technology firms which are typically induced to seek IPO exits as they
require significant equity investment to access their growth opportunities (Pagano, Panetta and
Zingales, 1998).
Hypothesis 2: The effect of the lending rate on the likelihood of the Secondary sale
The coefficient of 0.39, for the lending rate variable, presented in Table 4.6 suggests that a one
unit increase in the lending rate would result in a 0.39 increase in the relative log odds of a
secondary sale exit compared to M&A while holding all other variables constant. The lending
rate variable also has a marginal effect of 0.0500 on the Secondary sale with an associated p-
value of 0.014. This means that a one percent increase in the lending rate is expected to result
in a 5% increase in the likelihood of a Secondary sale exit. This relationship is significant at
the 95% confidence level. These results do not provide support for Hypothesis 2. These
findings are also contrary to other research findings that suggests that greater accessibility to
credit markets, evidenced by loosening of covenants and reduction of credit spreads, were
directly related to increased use of the Secondary sale exit (Sousa, 2010).
Based on the model’s results the private equity firm experience, GDP growth rate and lending
rate are the only significant relationships predicted by the data with respect to secondary sales.
The private equity firm experience variable has a marginal effect of -0.0419 on the Secondary
sale with an associated p-value of 0.064. This means that a 1 unit (1 year) increase in the private
equity firm experience is expected to result in a 4.2% decrease in the likelihood of a secondary
sale. This result is significant at the 90% confidence level. It suggests that more experienced
private equity firms are less likely to pursue secondary sale exits. Due to the limited dataset
used for this study, the natural log of private equity firm experience was also used as an
explanatory variable as it approximates a log normal distribution of the data points.

41
Table 4.7 Coefficients and marginal effects of Secondary exit
Independent variable Secondary sale
Coefficient t-statistic Marginal effect t-statistic
Investment duration -0.73 -0.71 -0.07 -0.66
Ln-investment duration 3.74 0.73 0.39 0.80
Private equity firm
experience -0.71 -2.88*** -0.04 -1.85*
Ln Private equity firm
experience 3.26 2.29** 0.14 1.02
Industry focus -1.40 -1.34 -0.14 -1.40
Country of headquarters -1.98 -1.13 -0.21 -1.34
Exchange rate -0.17 -0.42 0.02 0.54
GDP growth rate 0.93 2.71*** 0.10 2.54***
Inflation rate 0.23 0.86 -0.00 -0.19
Lending rate 0.39 1.78* 0.05 2.47***
*, **, *** significance at the 90%, 95% and 99% confidence levels respectively.
The GDP growth rate has a marginal effect of 0.0958 on the Secondary sale with an associated
p-value of 0.011. This means that a 1 unit (1%) increase in the GDP growth rate is expected to
result in a 9.6% increase in the likelihood of a Secondary sale. This relationship is perhaps
better understood from the perspective of the buyer. Although the motives for the secondary
sale are still relatively less understood compared to the M&A and IPO, Kitzmann and Schiereck
(2009) argue that secondary buyouts create value through other sources such as limitation of
agency costs and are not merely an exit of last resort. Assuming that the motive for value
creation is in place, it would be intuitive to expect that the buyer would seek investments in
growing markets and thus explaining the identified relationship between the GDP growth rate
and the likelihood of the Secondary sale exit.

42
Tables 4.8, 4.9 and 4.10 present the coefficients and marginal effects of the M&A, Buyback
and IPO exit modes below.
Table 4.8 Coefficients and marginal effects of M&A exit
Independent variable M&A
Coefficient t-statistic Marginal effect t-statistic
Investment duration 0.17 0.26 0.06 0.65
Ln-investment duration 0.36 0.12 -0.20 -0.43
Private equity firm
experience 0.78 2.84*** 0.12*** 4.61
Ln private equity firm
experience -5.11 -2.66*** 0.72*** -3.76
Industry focus -0.00 -0.00 0.09 0.85
Country of headquarters -0.27 -0.24 0.10 0.54
Exchange rate 0.95 1.86 0.11 1.59
GDP growth rate 0.07 0.25 0.05 -1.28
Inflation rate -0.76 -2.60*** 0.09*** -2.53
Lending rate 0.30 1.60 0.00 0.18
*, **, *** significance at the 90%, 95% and 99% confidence levels respectively.
Table 4.9 Coefficients and marginal effects of Buyback exit
Independent variable Buyback
Coefficient t-statistic Marginal effect t-statistic
Investment duration -0.18 -0.26 0.00 0.02
Ln-investment duration -0.36 -0.12 -0.18 -0.45
Private equity firm
experience -0.78 -2.84*** -0.08 -2.46**
Ln private equity firm
experience 5.11 2.66*** 0.57 2.44***
Industry focus 0.00 0.00 0.05 0.52
Country of headquarters 0.28 0.24 0.10 0.73
Exchange rate -0.95 -1.86** -0.12 -2.03**

43
GDP growth rate -0.07 -0.25 -0.04 -1.17
Inflation rate 0.76 2.60*** 0.10 2.70***
Lending rate -0.30 -1.60 -0.06 -2.31**
*, **, *** significance at the 90%, 95% and 99% confidence levels respectively.
Table 4.10 Coefficients and marginal effects of IPO exit
Independent variable IPO
Coefficient t-statistic Marginal effect t-statistic
Investment duration -7.94 -4.10*** -9.92 -3.74***
Ln-investment duration 69.39 7.05*** 0.00 5.87***
Private equity firm
experience -19.27 -22.72*** 0.00 -12.47***
Ln private equity firm
experience 136.91 19.98*** 0.00 12.11***
Industry focus -48.04 -18.87*** -0.00 -9.94***
Country of headquarters -115.80 -20.50*** -0.00 -9.85***
Exchange rate -17.13 -17.28*** 7.62 -11.90***
GDP growth rate 0.61 0.50 0.00 0.49
Inflation rate 12.12 18.19*** 0.00 11.89***
Lending rate 8.86 18.29*** 0.00 9.09***
*, **, *** significance at the 90%, 95% and 99% confidence levels respectively.
Hypothesis 3: The effect of the financial market structure on the choice of exit.
Hypothesis 3 was tested by calculating the predicted probabilities of the dependent variables
used in the model. Table 4.11 below presents the predicted probabilities of the dependent
variables IPO, M&A, Secondary sales and Buyback.

44
Table 4.11 Predicted probabilities of exit modes
Exit mode Predicted probabilities
IPO 0.00
M&A 0.73
Secondary sale 0.08
Buyback 0.18
Based on our results, the most probable mode of exit, given that all independent variables are
held at their means, is M&A, with a predicted probability of 0.73. The least likely mode of exit
is IPO. This provides direct support for our hypothesis that a Bank centered market such as
South Africa, which also lacks a vibrant venture capital industry will exhibit poor IPO activity
with M&A being the most preferred mode of exit.
Independence of irrelevant alternatives IIA
In order to test for the independence of irrelevant alternatives assumption, the Haussmann
McFadden test was implemented in STATA12. Each exit mode was dropped consecutively to
test the IIA assumption. Dropping M&A, Secondary and Buyback did not violate the
assumption. However, dropping IPO violated the assumption. This may be possibly a result of
the relatively few data points relating to this exit mode.

45
CHAPTER 5: CONCLUSION
5.1. PURPOSE OF THE STUDY
Although it is the final stage in the investment process, the exit is of significant importance to
the private equity investment model. The objective of this paper is to study the exit behaviour
of private equity investments held by independent private equity firms in South Africa. As this
is an exploratory study we examine empirical hypothesis previously tested by other authors.
Firstly, we test whether portfolio companies within high technology sectors are more likely to
achieve an IPO exit relative to other exits. Secondly, we test the effect of the lending rate on
the likelihood of a secondary sale. Lastly, we consider the relative likelihood of IPO compared
to M&A. Relying on the findings of Levine (2002), which find South Africa to be a Bank
cantered market, we expect that the private equity investments will experience relatively low
IPO activity as suggested by Black and Gilson (1998).
5.2. KEY FINDINGS
The research is quantitative in nature and involves the use of statistical modelling, multinomial
logistic regression was applied, using panel data, which assumes that the effect of explanatory
variables on the choice of exit varies across observations (private equity firms) and over time.
From the multinomial logit model it was found that; 1) High technology firms were more likely
to be exited by means of M&A rather than IPO; 2) An increase in the lending rate was found
to increase the likelihood of a Secondary sale; and 3) M&A was found to be the most likely
mode of exit assuming all explanatory variables were at their mean, while IPO was the least
likely mode of exit.
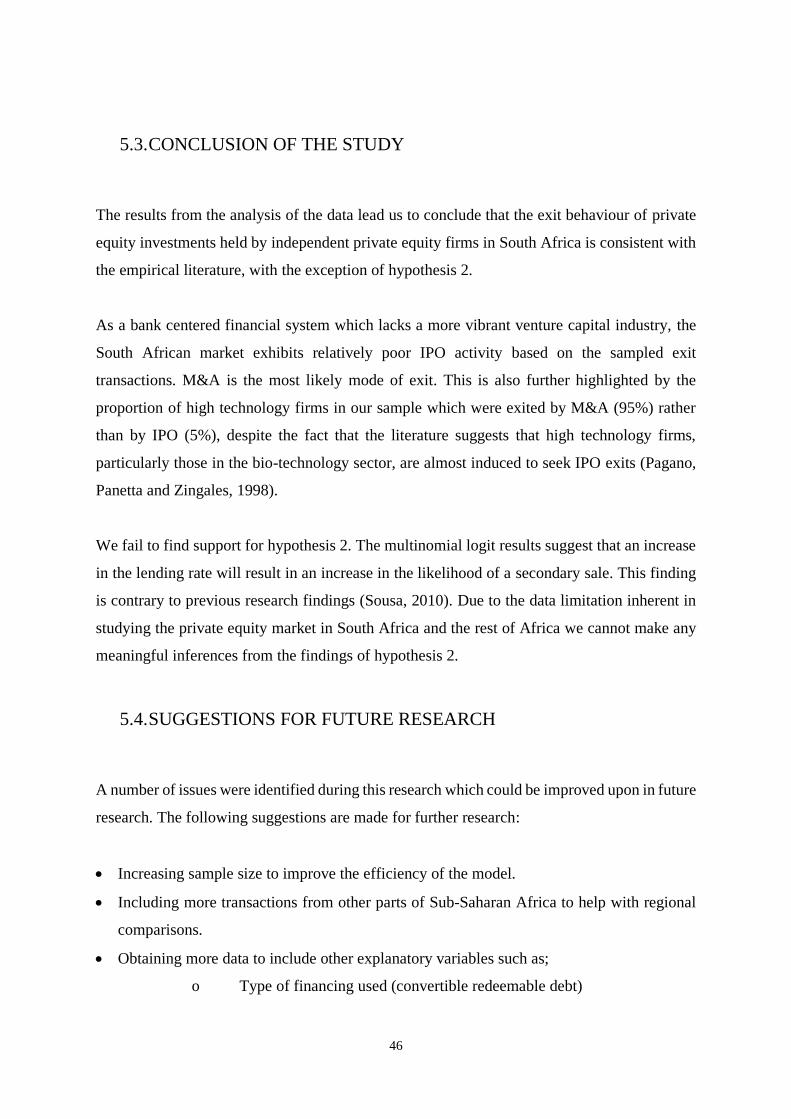
46
5.3. CONCLUSION OF THE STUDY
The results from the analysis of the data lead us to conclude that the exit behaviour of private
equity investments held by independent private equity firms in South Africa is consistent with
the empirical literature, with the exception of hypothesis 2.
As a bank centered financial system which lacks a more vibrant venture capital industry, the
South African market exhibits relatively poor IPO activity based on the sampled exit
transactions. M&A is the most likely mode of exit. This is also further highlighted by the
proportion of high technology firms in our sample which were exited by M&A (95%) rather
than by IPO (5%), despite the fact that the literature suggests that high technology firms,
particularly those in the bio-technology sector, are almost induced to seek IPO exits (Pagano,
Panetta and Zingales, 1998).
We fail to find support for hypothesis 2. The multinomial logit results suggest that an increase
in the lending rate will result in an increase in the likelihood of a secondary sale. This finding
is contrary to previous research findings (Sousa, 2010). Due to the data limitation inherent in
studying the private equity market in South Africa and the rest of Africa we cannot make any
meaningful inferences from the findings of hypothesis 2.
5.4. SUGGESTIONS FOR FUTURE RESEARCH
A number of issues were identified during this research which could be improved upon in future
research. The following suggestions are made for further research:
Increasing sample size to improve the efficiency of the model.
Including more transactions from other parts of Sub-Saharan Africa to help with regional
comparisons.
Obtaining more data to include other explanatory variables such as;
o Type of financing used (convertible redeemable debt)

47
o Market/book ratio of portfolio company at date of exit.
Finally, this research has fulfilled its purpose of using econometric methods to explore the
determinants of private equity exits by independent private equity firms in South Africa in
comparison to the stylised facts. The objective was to highlight the potential differences that
may exist between a bank centered market such as South Africa and a stock market centered
market such as the USA.

48
REFERENCES
Achleitner, A., Bauer, O., Figge, C. and Lutz, E. (2012) The Case for Secondary Buyouts as
Exit Channel, Journal of Applied Corporate Finance, (24) 4, pp. 102-111.
Acharya, V., Gottschalg, O., Hahn, M. and Kehoe, C. (2013) Corporate governance and value
creation: Evidence from private equity, Review of financial studies, 26(2), pp.368-402.
Arrow, K. (1951) Social choice and individual values, John Wiley and Sons, New York.
Bain & Company (2010) Global private equity report, Bain & Company Inc.
Bascha, A. and Walz, U. (2000) Convertible securities and optimal exit decisions in venture
capital finance, Journal of Corporate Finance, 7, pp. 285 – 306.
Baumeister, A. and Muelke, M. (2010) Private Equity exits: German trade and Secondary
sales in the financial crisis, Journal of Private equity, 13(3), pp.47 – 56.
Ben-Akiva, M. and Lerman, S. (1985) Discrete Choice Analysis, MIT Press, Cambridge.
Bent, N.,Williams, K. and Gilbert, E. (2004) The syndication of private equity investments in
South Africa, South Africa Journal of Business, 35(4), p39.
Bergemann, D. and Hege, U. (1998) Venture capital financing, moral hazard and learning,
Journal of Banking and Finance, 22 (6-8), pp.703-35.
Bienz, C. and Leite, T. (2008) A Pecking Order of Venture Capital Exits, Working paper,
Norwegian school of Economics and Business administration, Available at SSRN.
Black, B. and Gilson, J. (1998) Venture Capital and structure of capital markets: Banks
versus stock markets, Journal of financial economics, 47(3), pp.243 – 277.
Blanchard, O. (2011) Macroeconomics, 5th , Updated Edition, Pearson Education Inc., New
York. pp. 68-70.
Brander, J., Amit, R., Antweiler, W. (2002) Venture Capital Syndication: Improved Venture
Selection vs. The Value-Added Hypothesis, Journal of Economics & Management Strategy,
11(3), pp. 423 – 452.

49
Brooks, C. (2008) Introductory Econometrics for finance, 2nd, Cambridge University Press,
London.
Bygrave, W. and Timmons, J. (1992) Venture Capital at the Crossroads, Havard Business
school Press, Boston, MA.
Brzeszczynski, J. (2012) IPOs in emerging markets, QFinance, Available at
www.qfinance.com.
Casamatta, C. and Haritchabalet, C. (2007) Experience, screening and syndication in venture
capital investments, Working paper.
Caselli, S. (2010) Private equity and venture capital in Europe - Markets, techniques, and
deals, Academic Press, London.
Chahine, S., Wright, M. and Filatotchev, I. (2007) Venture capitalist, Business angels, and
performance of entrepreneurial IPOs in the UK and France, Journal of Business Finance and
Accounting, 34(3-4), pp.505-528.
Cumming, D., Fleming, G. and Schwienbacher, A. (2005) Liquidity risk and venture
capital finance, Financial Management, 34, pp.77 – 105.
Cumming, D. and Johan, A. (2009) Venture capital and private equity contracting – An
international perspective, Elsevier Inc., London.
Cumming, D. and MacIntosh, J. (2003a) Venture capital exists in Canada and United States,
University of Toronto Law Review, 53, pp.101 – 200.
Cumming, D. and MacIntosh, J. (2003b) A cross-country comparison of full and partial
venture capital exits, Journal of Banking & Finance, 27 (3), pp. 511-548.
Cumming, D. and MacIntosh, J. (2001) Venture Capital investment duration in Canada and
the United States, Journal of Multinational Financial Management,11, pp.445-463.
Das, S., Jaganathan, M. and Sarin, A. (2002) The private equity discount: An empirical
examination of the exit of venture capital backed companies, Working paper.
Deeds, D., Decarolis, D., Coombs, J. (1997) The impact of firm specific capabilities on the
amount of capital raised in an initial public offering: Evidence from the Biotechnology
industry, Journal of business venturing, 12, pp. 31 – 46.

50
Dickinson, T. (2008) Private equity: Eye for investment under African skies?, Policy insight
no.60 of OECD development centre.
EMPEA (2012) Industry statistics: fundraising and investment analytics, Emerging market
private equity association, available at: https://www.altassets.net/wp-
content/uploads/2013/07/EMPEA-Industry-Statistics-Q2-2013-Official-Public.pdf
Ernst & Young (2012a) Building bridges: Africa's attractiveness survey, Emerging market
centre.
Ernst & Young (2012b) Private equity roundup - Africa, Emerging market centre.
Espenlaub, S., Khurshed, A. and Mohamed, A. (2010) Exit behaviour of venture capital
firms, Working paper, available at Efmaefm.org.
Fenn, G., Liang, N. and Prowse, S. (1995) The Economics of the private equity market,
Working paper, Board of Governors of the Federal Reserve System, Washington, DC 20551.
Gilson, R. and Schizer, D. (2003) Understanding venture capital structure: A tax explanation
for convertible preferred stock, Harvard Law review, 116(3), pp.874-916.
Gompers, P. (1996) Grandstanding in the Venture Capital Industry, Journal of Financial
Economics, 42(1), pp.133 - 156.
Gompers, P. (1995) Optimal Investment, Monitoring and the Staging of Venture Capital,
Journal of Finance, 50(5), pp. 1461–1491.
Gorman, M. and Sahlman, W. (1989) What do venture capitalist do? Journal of Business
venturing, 4(4), pp. 231 – 248.
Hausman, J. and McFadden, D. (1984) Specification tests for the multinomial logit model,
Econometrica, 52(5), September, pp. 1219-1240.
Hellmann, T. (1998) The allocation of control rights in venture capital contracts, Rand
Journal of Economics, 29, pp.57-76.
Jain, A. and Kini, O. (1994) The post-issue operating performance of IPO firms, Journal of
Finance, 49(5), pp. 1699 – 1726.

51
Kitzmann, J. and Schiereck, D. (2009) A note of Secondary Buyouts – creating value or
recycling capital, iBusiness (Scientific Research publication),1, pp.113-123.
Klonowski, D. (2010) The Venture Capital Investment Process, Palgrave Macmillan, New
York.
Koppelman, F. and Bhat, C. (2006) A Self instructing course in mode choice modelling:
multinomial and nested logit models, U.S Department of transportation.
Leeds, R. and Sunderland, J. (2003) Private Equity Investing in Emerging Markets, Journal
of Applied Corporate Finance, 15(3), pp.111-119.
Leland, H. and Pyle, D. (1997) Informational asymmetry, financial structure and financial
intermediation, Journal of finance, 32, pp.371-387.
Lerner, J., Ledbetter, J., Speen, A., Leamon, A. and Allen, C. (2016) Private equity in
emerging markets: Yesterday, Today and Tomorrow, Journal of private equity, 19(3), pp.8-
20.
Lerner, J. (1994) Venture capitalists and the decision to go public, Journal of Financial
Economics, 35, pp.293–316.
Levine, R. (2002) Bank-based or Market-based Financial systems: which is better?, Journal
of Financial Intermediation, 11(4), pp.398-428.
Lin, T. and Smith, R. (1997) Insider reputation and selling decisions: The unwinding of
venture capital investments during equity IPOs, Journal of Corporate finance, 4, pp.241-263.
Lingelbach, D., Murray, G. and Geilbert, E. (2009) The rise and fall of South African venture
capital: A Coproduction perspective, Working paper.
Lockett, A. and Wright, M. (2001) The syndication of venture capital investments, The
International Journal of Management Science, 29, pp.375-390.
Loughram, T. and Ritter, J. (1995) The new issues puzzle, Journal of Finance, 50(1), pp.23 –
51.
Manigart, S. Lockett, M. Meuleman, M. Wright, H. Bruining, H. Landstr¨om, P. Desbri`eres
and Hommel, U. (2006), ‘The Syndication Decision of Venture Capital Investments’,
Entrepreneurship: Theory & Practice, 30(2), pp.131–53.

52
Meyer, T. and Mathonet, P. (2005) Beyond the J-curve: Managing a portfolio of venture
capital and private equity funds, John Wiley & Sons Ltd, West Sussex.
Missankov, I.,Van Dyke, R.,Van Biljon, A.,Hayes, M. and Van Der Veen (2008) Private
equity returns in Emerging markets: The South African case, The Journal of Private Equity,
11,p.42-52.
Ojah, K. and Mokoaleli-Mokoleti, T. (2010) Possible Effective Financing Models for
Entrepreneurship in South Africa: Guides from Microfinance and Venture Capital Finance,
The African Finance Journal, 12, pp.18 - 19.
Pagano, M., Panetta, F. and Zingales, L. (1998) Why do companies go public? An empirical
analysis, Journal of Finance, 53(1), pp.27 – 64.
Peduzzi, P., Contcato, J., Kemper, E., Holford, T. and Feinstein, A. (1996) A simulation
study of the number of events per variable in logistic regression analysis, J Clin Epidemoil ,
December, 49(12), pp. 1373 – 9.
Povaly S. (2006) Private equity exits: An analysis of divestment process management in
relation to leveraged buyouts, Dissertation, no.3238, University of St. Gallen.
Prahl, M., Cannarsi, A. and Zeisberger, C. (2011) Private equity exits in China and India,
Faculty and Research, Working paper, INSEAD.
Financial Mail (2012) Private equity and venture capital in SA, May 2012, pp. 28-33.
Ritter, J. (1991) The long run performance of initial public offerings, Journal of Finance,
46(1), pp.3 – 27.
Sapienza, H. (1992) When do venture capitalist add value, Journal of business venturing,
7(1), pp.9-27.
Sahlman, W. (1990) The Structure and Governance of Venture-Capital Organizations,
Journal of Financial Economics, 27(2), pp.473–522.
Schwienbacher, A. (2002) An empirical analysis of venture capital exits in Europe and in the
United States. Working Paper.
Schmidt, D., Steffen, S. and Szabo, F. (2007) Exit strategies of Buyout Investments – An
Empirical analysis, Centre of Private Equity Research.

53
Sousa, M. (2010) Why do Private Equity firms sell to each other? , Working paper, Said
Business School (University of Oxford).
Theil, H. (1969) A multinomial Logit Extension of the linear Logit model, International
Economic Review, pp. 251.
Thompson, R. (2008) Real Venture Capital - Building International Businesses, 3rd,
Palgrave Macmillan, London.
Wall, J. and smith, J. (1997) Better exits, The Journal of Private Equity, 1(2), pp. 31 – 43.
Wang, C. and Sim, V. (2001) Exit strategies of venture capital-backed companies in
Singapore, Venture Capital, 3(4), pp.337-358.
Wilton, D. and Reed, L. (2013) The Case for Emerging Market Private Equity, Working
paper, International Finance Corporation.
Yin, R. (1994) Case study research: design and methods, Thousand Oaks: Sage publications.

55
APPENDIX A
Table A.1 Private equity exit transactions
Exit modes: M&A = Merger and acquisition; SS = Secondary sale; Buyback = Buyback; IPO = Initial public offering
Observation Exit mode
Investment
duration
(Years)
Private
equity firm
experience
(Years)
Industry
focus
(Dummy)
Country of
headquarters
(Dummy)
Year of exit Exchange
rate
GDP growth
rate Inflation rate
Lending
interest rate
Log of
investment
duration
(Years)
Log of
private
equity firm
experience
(Years)
1 M&A 2.06 1.50 1 1 2012 8.21 2.55 5.60 8.75 0.72 0.41
2 SS 3.50 0.47 0 0 2007 7.05 5.55 7.10 13.17 1.25 -0.75
3 M&A 7.96 0.59 0 0 2012 8.21 2.55 5.60 8.75 2.07 -0.52
4 M&A 7.00 1.00 0 1 2012 8.21 2.55 5.60 8.75 1.95 0.00
5 Buyback 3.25 1.75 0 0 2009 8.44 -1.53 7.10 11.71 1.18 0.56
6 Buyback 1.36 3.95 0 0 2010 7.32 3.09 4.30 9.83 0.30 1.37
7 M&A 2.07 4.93 0 1 2007 7.05 5.55 7.10 13.17 0.73 1.60
8 M&A 6.32 4.68 0 1 2011 8.44 3.46 5.00 9.00 1.84 1.54
9 Buyback 4.24 6.76 0 1 2012 8.21 2.55 5.60 8.75 1.44 1.91
10 IPO 5.52 3.00 0 0 2009 8.44 -1.53 7.10 11.71 1.71 1.10
11 M&A 7.00 2.00 0 0 2009 8.44 -1.53 7.10 11.71 1.95 0.69
12 M&A 5.01 4.67 1 0 2010 7.32 3.09 4.30 9.83 1.61 1.54
13 M&A 5.08 4.67 1 0 2010 7.32 3.09 4.30 9.83 1.62 1.54
14 M&A 2.41 7.84 0 0 2011 8.44 3.46 5.00 9.00 0.88 2.06
15 M&A 4.76 3.25 0 1 1999 6.11 2.36 5.10 18.00 1.56 1.18
16 SS 4.59 4.84 1 1 2000 6.94 4.15 5.30 14.50 1.52 1.58

56
Observation Exit mode
Investment
duration
(Years)
Private
equity firm
experience
(Years)
Industry
focus
(Dummy)
Country of
head-
quarters
(Dummy)
Year of exit Exchange
rate
GDP growth
rate Inflation rate
Lending
interest rate
Log of
investment
duration
(Years)
Log of
private
equity firm
experience
(Years)
17 M&A 3.00 6.92 0 1 2000 6.94 4.15 5.30 14.50 1.10 1.93
18 SS 4.25 7.75 0 1 2003 7.56 2.95 5.80 14.96 1.45 2.05
19 SS 3.50 8.67 0 1 2003 7.56 2.95 5.80 14.96 1.25 2.16
20 SS 6.84 5.42 0 1 2003 7.56 2.95 5.80 14.96 1.92 1.69
21 SS 5.25 7.25 0 1 2003 7.56 2.95 5.80 14.96 1.66 1.98
22 Buyback 2.75 9.76 0 1 2003 7.56 2.95 5.80 14.96 1.01 2.28
23 SS 7.42 5.42 0 1 2003 7.56 2.95 5.80 14.96 2.00 1.69
24 M&A 3.75 9.17 1 1 2003 7.56 2.95 5.80 14.96 1.32 2.22
25 M&A 4.17 9.17 1 1 2004 6.45 4.55 1.40 11.29 1.43 2.22
26 Buyback 5.34 9.76 0 1 2006 6.77 5.60 4.70 11.17 1.67 2.28
27 SS 6.51 9.76 0 1 2007 7.05 5.55 7.10 13.17 1.87 2.28
28 M&A 3.77 16.01 0 1 2010 7.32 3.09 4.30 9.83 1.33 2.77
29 M&A 3.15 2.85 0 1 2011 8.44 3.46 5.00 9.00 1.15 1.05
30 M&A 2.48 1.00 0 0 2003 7.56 2.95 5.80 14.96 0.91 0.00
31 SS 1.84 5.17 0 1 2005 6.36 5.28 3.40 10.63 0.61 1.64
32 IPO 1.20 6.25 0 0 2007 7.05 5.55 7.10 13.17 0.18 1.83
33 IPO 3.54 5.01 1 0 2008 8.25 3.62 11.50 15.13 1.26 1.61
34 M&A 6.00 12.01 0 1 2001 8.60 2.74 5.70 13.77 1.79 2.49
35 M&A 5.00 13.01 0 1 2001 8.60 2.74 5.70 13.77 1.61 2.57
36 M&A 7.00 13.01 0 1 2003 7.56 2.95 5.80 14.96 1.95 2.57
37 M&A 1.58 19.43 0 1 2004 6.45 4.55 1.40 11.29 0.46 2.97
38 M&A 7.01 14.01 0 1 2004 6.45 4.55 1.40 11.29 1.95 2.64
39 M&A 6.64 14.37 0 1 2004 6.45 4.55 1.40 11.29 1.89 2.67
40 M&A 5.73 16.28 0 1 2005 6.36 5.28 3.40 10.63 1.75 2.79

57
Observation Exit mode
Investment
duration
(Years)
Private
equity firm
experience
(Years)
Industry
focus
(Dummy)
Country of
head-
quarters
(Dummy)
Year of exit Exchange
rate
GDP growth
rate Inflation rate
Lending
interest rate
Log of
investment
duration
(Years)
Log of
private
equity firm
experience
(Years)
41 M&A 1.00 22.01 0 1 2006 6.77 5.60 4.70 11.17 0.00 3.09
42 M&A 7.22 16.79 0 1 2007 7.05 5.55 7.10 13.17 1.98 2.82
43 M&A 8.93 16.08 0 1 2008 8.25 3.62 11.50 15.13 2.19 2.78
44 M&A 6.56 21.45 0 1 2011 8.44 3.46 5.00 9.00 1.88 3.07
45 Buyback 2.00 2.00 0 1 1995 3.63 3.12 8.70 17.90 0.69 0.69
46 M&A 4.00 3.00 1 1 1998 5.53 0.52 6.90 21.79 1.39 1.10
47 M&A 7.00 0.00 1 1 1998 5.53 0.52 6.90 21.79 1.95
48 Buyback 2.00 6.01 0 1 1999 6.11 2.36 5.10 18.00 0.69 1.79
49 Buyback 4.00 6.01 0 1 2001 8.60 2.74 5.70 13.77 1.39 1.79
50 Buyback 3.00 8.01 1 1 2002 10.52 3.67 9.20 15.75 1.10 2.08
51 M&A 5.00 6.01 1 1 2002 10.52 3.67 9.20 15.75 1.61 1.79
52 M&A 6.14 6.87 0 1 2004 6.45 4.55 1.40 11.29 1.82 1.93
53 M&A 7.00 6.01 0 1 2004 6.45 4.55 1.40 11.29 1.95 1.79
54 Buyback 7.00 7.01 1 1 2005 6.36 5.28 3.40 10.63 1.95 1.95
55 M&A 14.01 0.00 0 1 2005 6.36 5.28 3.40 10.63 2.64
56 M&A 6.00 9.01 0 1 2006 6.77 5.60 4.70 11.17 1.79 2.20
57 M&A 4.00 11.01 1 1 2006 6.77 5.60 4.70 11.17 1.39 2.40
58 Buyback 4.00 11.01 1 1 2006 6.77 5.60 4.70 11.17 1.39 2.40
59 Buyback 8.00 7.01 1 1 2006 6.77 5.60 4.70 11.17 2.08 1.95
60 Buyback 3.95 12.01 0 1 2007 7.05 5.55 7.10 13.17 1.37 2.49
61 SS 7.00 9.01 1 1 2007 7.05 5.55 7.10 13.17 1.95 2.20
62 Buyback 9.00 7.01 0 1 2007 7.05 5.55 7.10 13.17 2.20 1.95
63 M&A 9.00 9.01 1 1 2009 8.44 -1.53 7.10 11.71 2.20 2.20
64 Buyback 8.00 11.01 1 1 2010 7.32 3.09 4.30 9.83 2.08 2.40

58
Observation Exit mode
Investment
duration
(Years)
Private
equity firm
experience
(Years)
Industry
focus
(Dummy)
Country of
head-
quarters
(Dummy)
Year of exit Exchange
rate
GDP growth
rate Inflation rate
Lending
interest rate
Log of
investment
duration
(Years)
Log of
private
equity firm
experience
(Years)
65 M&A 9.00 11.01 1 1 2011 8.44 3.46 5.00 9.00 2.20 2.40
66 M&A 9.00 11.01 1 1 2011 8.44 3.46 5.00 9.00 2.20 2.40
67 IPO 9.41 5.49 0 0 2004 6.45 4.55 1.40 11.29 2.24 1.70
68 M&A 3.75 1.25 0 1 2007 7.05 5.55 7.10 13.17 1.32 0.22
69 M&A 6.32 4.68 0 1 2011 8.44 3.46 5.00 9.00 1.84 1.54

59
Table A.2 Multinomial logits of explanatory variables
This table presents the results of the multinomial logit regression of the probability of each exit outcome. The multinomial logits are presented to
highlight the effect that each variable has on the likelihood of an exit relative to the base category (M&A). *, **, *** represents significance at the
90%, 95% and 99% levels, respectively.
IPO Secondary sale Buyback
Coefficient t-statistic Coefficient t-statistic Coefficient t-statistics
Constant -194.42 -15.17*** -10.67 -1.77 3.67 0.74
Investment duration -7.94 -4.10*** -0.73 -0.71 -0.18 -0.26
LN-Investment duration 69.39 7.05*** 3.74 0.73 -0.36 -0.12
Private equity firm experience -19.27 -22.72*** -0.71 -2.88*** -0.78 -2.84***
LN private equity firm experience 136.91 19.98*** 3.26 2.29** 5.11 2.66***
Industry focus -48.04 -18.87*** -1.40 -1.34 0.00 0.00
County of head quarters -115.80 -20.50*** -1.98 -1.13 0.28 0.24
Exchange rate (ZAR/USD) -17.13 -17.28*** -0.17 -0.42 -0.95 -1.86*
GDP Growth rate 0.61 0.50 0.93 2.71*** -0.07 -0.25
Inflation rate 12.12 18.19*** 0.23 0.86 0.76 2.60***
Lending rate 8.86 18.29*** 0.39 1.78* -0.30 -1.60*

60
Table A.3 Marginal effects of explanatory variables
This table presents the results of the multinomial logit regression of the probability of each exit outcome. Marginal effects are presented to highlight
the statistical significance along with the economic significance. *, **, *** represents significance at the 90%, 95% and 99% levels, respectively.
IPO8 M&A Secondary sale Buyback
Marginal effect t-statistic Marginal effect t-statistic Marginal effect t-statistic Marginal effect t-statistics
Investment duration n/a n/a 0.06 0.65 -0.07 -0.66 0.00 0.02
LN-Investment duration n/a n/a -0.20 -0.43 0.39 0.80 -0.18 -0.45
Private equity firm experience n/a n/a 0.12 4.61*** -0.04 -1.85* -0.08 -2.46***
LN private equity firm experience n/a n/a -0.72 -3.76*** 0.14 1.02 0.57 2.44**
Industry focus n/a n/a 0.09 0.85 -0.14 -1.40 0.05 0.52
County of head quarters n/a n/a 0.10 0.54 -0.21 -1.34 0.11 0.72
Exchange rate (ZAR/USD) n/a n/a 0.11 1.59 0.02 0.54 -0.12 -2.03**
GDP Growth rate n/a n/a -0.05 -1.28 0.10 2.54*** -0.04 -1.17
Inflation rate n/a n/a -0.09 -2.53*** -0.00 -0.19 0.10 2.70***
Lending rate n/a n/a 0.00 0.18 0.05 2.47*** -0.06 -2.31**
8 Due to the relatively small number of observations in our sample Stata 12.0 was unable to estimate the marginal effects of the various independent variables on the IPO exit.