Determinants Of Customer Satisfaction In Supermarkets In ...
urologypracticejournal.com
Determinants of Patient Satisfaction with Urology Practice
Deepak A. Kapoor*,y
From Integrated Medical Professionals, PLLC, Melville, and Department of Urology, The Icahn School of Medicine at Mount Sinai,New York, New York
Abstract
Introduction: Although patient satisfaction surveys will be used by CMS (Centers for Medicare &Medicaid Services) to determine reimbursement in physician offices within 2 years, there are no publisheddata to our knowledge on what influences patient satisfaction with the urology office. Therefore, weevaluated which parameters had the greatest impact on a patient’s likelihood to refer another patient to ourpractice.Methods: We employed a national survey firm to mail patient satisfaction questionnaires consisting of21 questions covering parameters on logistics, practice and physician interactions to a random subset ofurology outpatients. Data on number of patients seen, wait time in clinic, survey response rate and likelihood torefer were also collected. Interrelations between survey parameters were analyzed using a Pearson product-moment correlation and Fisher’s transformation.Results: During a 2-year period we received 58,932 responses to 211,679 surveys (27.8% response rate).Although logistical and staff parameters correlated positively with likelihood to refer, the strongest correlationwas observed in physician parameters (r¼0.947, p <0.01). Of physician parameters, patient confidence inphysician correlated most strongly with likelihood to refer (r¼0.976, p <0.01). Clinic wait time showed arelatively weak correlation to likelihood to refer (r¼ 0.500, p <0.01), while number of patients seen did notcorrelate to likelihood to refer (r¼�0.090, p¼0.40). Survey response correlated positively with likelihood torefer (r¼0.593, p <0.01).Conclusions: Our large series demonstrates that patient satisfaction in the urology office correlates moststrongly with patient-physician interaction. Implementation of systematic, comprehensive patient satisfactionsurveys is feasible for urology practices and can provide meaningful data to enhance the patient experience.
Key Words: patient satisfaction, urology, data collection
Submitted for publication March 26, 2014.* Correspondence: Integrated Medical Professionals, PLLC, Melville,
New Yorky Financial interest and/or other relationship with Large Urology Group
Practice Association, Know Error� and Scrubs RRG.
2352-0779/$36.00
� 2014 by AMERICAN UROLOGICAL ASSOCIATION EDUCATION AND RESEARCH, INC.
Published by Elsevier
http://dx.do
Ur
Abbreviationsand Acronyms
CG-CAHPS = Clinic andGroup Consumer Assessmentof Healthcare Providers andSystems
CP = care provider
EHR = electronic health record
LTR = likelihood to refer
Although the concept of patient empowerment in health careis not novel,1 an increase in patient consumerism along withfrustration with the level of transparency in health care deliverysystems has led to increased interest in measuring patientsatisfaction as a quality parameter.2,3 Research on whether thepatient experience correlates with outcomes is inconsistent,with some suggesting that improving patient perception leadsto better outcomes,4 others failing to note any correlation with
outcome5 and some suggesting that systematic performancemeasures may actually have a deleterious effect on health caredelivery.6
Patient satisfaction surveys have already been incorporatedinto reimbursement methodology for hospitals. The PatientProtection and Affordable Care Act of 2010 includes pro-visions for patient satisfaction in value based purchasing forinstitutions and individual providers. Of hospital value basedpurchasing measures 30% is derived from results of theHospital Consumer Assessment of Healthcare Providers andSystems (H-CAHPS). H-CAHPS scores were linked to hospitalreimbursement commencing with discharges in October 2012.In 2014, 1.25% of hospital reimbursements are at stake, whichincreases to 2% for 2017 and beyond.7
i.org/10.1016/j.urpr.2014.05.001
ology Practice 1 (2014), 122-126
Table 1.Survey scores
Mean
Score SEM
95% CI
(�10�3)
Ease of getting clinic on phone 88.8 2.94 4.36
Convenience of office hrs 90.1 2.58 3.80
Ease of scheduling appointments 91.5 2.51 3.69
Courtesy of registration staff 93.4 2.37 3.50
Information about delays 82.8 4.05 6.75
Wait time at clinic 82.8 3.87 5.85
How well staff protect safety 93.4 2.18 3.28
Sensitivity to pt needs 92.2 2.40 3.60
Concern for pt privacy 92.9 2.26 3.39
Cleanliness of practice 94.2 2.07 3.08
Staff worked together 93.4 2.23 3.30
Friendliness/courtesy of nurse/assistant 93.3 2.21 3.30
Concern of nurse/assistant for problem 90.6 2.65 4.10
Friendliness/courtesy of CP 95.1 1.97 2.90
CP explanations of problem/condition 94.1 2.25 3.33
CP concern for questions/worries 93.7 2.32 3.45
CP efforts to include in decisions 93.2 2.40 3.72
CP information about medications 92.8 2.45 3.92
CP instructions for followup care 93.2 2.37 3.69
CP spoke using clear language 94.5 2.11 3.14
Time CP spent with pt 91.5 2.66 3.95
Pt confidence in CP 94.9 2.16 3.20
Likelihood of recommending CP 94.6 2.35 3.49
123Patient Satisfaction with Urology Practice
Of particular importance to urologists is the expansion ofsuch survey tools into physician practices and the incorporationof these metrics into value based purchasing reimbursementcalculations for this site of service. The CG-CAHPS has beendeveloped for this purpose. Implementation of value basedmodifiers commences in 2015 for group practices with morethan 100 providers billing under a single taxpayer identificationnumber, and this expands to all physicians in 2017. For med-ical practices impacted by CG-CAHPS at least 16.7% of valuebased dollars will be based on CG-CAHPS scores.8
There have been many reviews on patient satisfaction inurology. However, these reviews are largely focused on spe-cific disease states or procedures. Despite the looming impor-tance of patient satisfaction data, there is a paucity of data onwhich parameters influence patient satisfaction in the urologyoffice setting. Therefore, we evaluated which measures ofpatient experience had the greatest correlation with patientsatisfaction as measured by a patient’s likelihood to referanother patient to our practice.
Methods
We partnered with Press Ganey Associates, Inc., a nationallyrecognized firm specializing in patient experience surveys, toproduce a custom questionnaire for distribution to our patients.Questions were divided into 3 categories related to logistics(appointment scheduling and check-in), practice (coveringitems after the patient commenced the appointment but beforeseeing the provider) and physician (direct patient-physicianinteraction). We also collected data on waiting time in clinic,number of patients seen and survey response rate. As patientloyalty has been linked to patient satisfaction,9 we used LTR asa proxy for overall patient satisfaction. This measure has beenfound to be an important component in historical10 and future11
models of patient satisfaction and profitability, and is also acomponent of the CG-CAHPS survey instrument. Surveyquestions are presented in the Appendix.
Patients were selected to receive mailings using a 2-stepprocess. Patient appointment data were electronically trans-mitted to the survey company. The raw appointment data foreach quarter were reordered using a randomization algorithmand filtered to remove duplicate records. Survey recipientswere selected from the revised file using a 1:3 ratio read-skipmethod. The survey design was a 5-part Likert scale, witheach response assigned a numerical value from 1 (lowest) to5 (highest). Scores were converted to a 100-point scale usingthe formula (x-1)*25, with x representing question score.Survey responses for each quarter were averaged and quarterlyaverage scores were combined in a weighted fashion. Two dataarrays were generated, with the first containing aggregatescores on logistics, practice and provider, and the secondcontaining all scores individually tabulated. A Pearson product-moment correlation coefficient matrix was calculated for eacharray and the statistical significance of the differences betweencorrelation coefficients was determined using Fisher’s trans-formation. Where appropriate, statistical analysis was per-formed using GraphPad Prism� 6.0 software.
Results
Between October 1, 2011 and September 30, 2013, 211,679surveys were mailed, with 58,932 responses (27.8% responserate). Vendor analytics indicate that this was in the 85thpercentile of response rate compared to other medical practicesperforming such surveys. Cronbach’s a for our study instru-ment was 0.97, indicating a high degree of reliability andreproducibility. Mean question scores with standard error ofmeasurements and 95% CIs are presented in table 1.
The results of question category analysis are summarized intable 2. Although LTR correlated positively with logistics andpractice parameters (r¼0.593, p <0.01 and r¼0.798, p <0.01;respectively), the strongest positive correlation existed betweenLTR and provider parameters (r¼0.947, p <0.01). There was asignificant difference in correlation coefficient between logis-tics and practice parameters (D¼0.205, p <0.01), as well asbetween practice and provider parameters (D¼0.149, p <0.01).LTR also correlated positively with survey response rate(r¼0.593, p <0.01), but there was no significant correlationbetween LTR and number of patients seen (r¼�0.90, p¼0.40).However, there was a significant, albeit weak, inverse corre-lation with number of patients seen and practice parameters(r¼�0.263, p¼0.01).
Specific question correlation is presented in the figure.Questions within each group are marked with an outline. Forease of reading the cells are formatted with a colorimetric scalein which deeper green indicates a stronger positive correlationand darker red denotes a stronger negative correlation. Asanticipated from the group analysis, CP parameters had thehighest correlation with LTR. The strongest positive correla-tion was seen between LTR and 1) patient confidence in CP
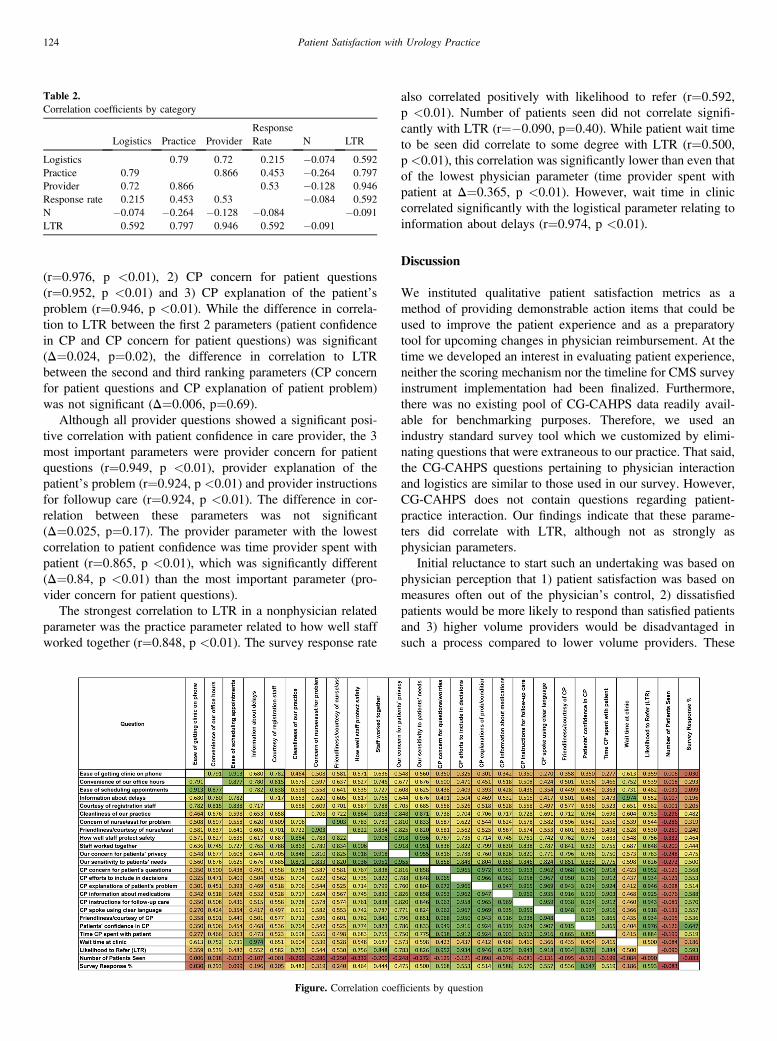
Table 2.Correlation coefficients by category
Logistics Practice Provider
Response
Rate N LTR
Logistics 0.79 0.72 0.215 �0.074 0.592
Practice 0.79 0.866 0.453 �0.264 0.797
Provider 0.72 0.866 0.53 �0.128 0.946
Response rate 0.215 0.453 0.53 �0.084 0.592
N �0.074 �0.264 �0.128 �0.084 �0.091
LTR 0.592 0.797 0.946 0.592 �0.091
124 Patient Satisfaction with Urology Practice
(r¼0.976, p <0.01), 2) CP concern for patient questions(r¼0.952, p <0.01) and 3) CP explanation of the patient’sproblem (r¼0.946, p <0.01). While the difference in correla-tion to LTR between the first 2 parameters (patient confidencein CP and CP concern for patient questions) was significant(D¼0.024, p¼0.02), the difference in correlation to LTRbetween the second and third ranking parameters (CP concernfor patient questions and CP explanation of patient problem)was not significant (D¼0.006, p¼0.69).
Although all provider questions showed a significant posi-tive correlation with patient confidence in care provider, the 3most important parameters were provider concern for patientquestions (r¼0.949, p <0.01), provider explanation of thepatient’s problem (r¼0.924, p <0.01) and provider instructionsfor followup care (r¼0.924, p <0.01). The difference in cor-relation between these parameters was not significant(D¼0.025, p¼0.17). The provider parameter with the lowestcorrelation to patient confidence was time provider spent withpatient (r¼0.865, p <0.01), which was significantly different(D¼0.84, p <0.01) than the most important parameter (pro-vider concern for patient questions).
The strongest correlation to LTR in a nonphysician relatedparameter was the practice parameter related to how well staffworked together (r¼0.848, p <0.01). The survey response rate
Figure. Correlation coef
also correlated positively with likelihood to refer (r¼0.592,p <0.01). Number of patients seen did not correlate signifi-cantly with LTR (r¼�0.090, p¼0.40). While patient wait timeto be seen did correlate to some degree with LTR (r¼0.500,p <0.01), this correlation was significantly lower than even thatof the lowest physician parameter (time provider spent withpatient at D¼0.365, p <0.01). However, wait time in cliniccorrelated significantly with the logistical parameter relating toinformation about delays (r¼0.974, p <0.01).
Discussion
We instituted qualitative patient satisfaction metrics as amethod of providing demonstrable action items that could beused to improve the patient experience and as a preparatorytool for upcoming changes in physician reimbursement. At thetime we developed an interest in evaluating patient experience,neither the scoring mechanism nor the timeline for CMS surveyinstrument implementation had been finalized. Furthermore,there was no existing pool of CG-CAHPS data readily avail-able for benchmarking purposes. Therefore, we used anindustry standard survey tool which we customized by elimi-nating questions that were extraneous to our practice. That said,the CG-CAHPS questions pertaining to physician interactionand logistics are similar to those used in our survey. However,CG-CAHPS does not contain questions regarding patient-practice interaction. Our findings indicate that these parame-ters did correlate with LTR, although not as strongly asphysician parameters.
Initial reluctance to start such an undertaking was based onphysician perception that 1) patient satisfaction was based onmeasures often out of the physician’s control, 2) dissatisfiedpatients would be more likely to respond than satisfied patientsand 3) higher volume providers would be disadvantaged insuch a process compared to lower volume providers. These
ficients by question
125Patient Satisfaction with Urology Practice
notions were bolstered by data suggesting clinical outcomesand patient experience are not necessarily connected.12 Indeedthe WHO found that satisfaction with the health caresystem depends more on factors external to the health systemthan on the experience of care as a patient, potentially limitingthe use of patient satisfaction measures as a basis for qualityimprovement and health system reform.13 Nevertheless, patientsatisfaction metrics have become increasingly important,particularly as CMS moves forward with plans to link physi-cian reimbursement to such measures. This is of particularimportance to urologists as Medicare beneficiaries account fora substantial percentage of a typical urologist’s workload.
In contrast to reports suggesting that patient satisfactionwith inpatient visits was not closely tied to interaction with thephysician,14 in our outpatient experience parameters relating tothe patient-physician interaction were most closely tied to pa-tient LTR. Concerns that logistical parameters would overrideother factors in LTR proved to be unfounded. In fact, thiscategory correlated least strongly with LTR. Concerns of busierproviders proved to be unfounded as well. There was no sig-nificant correlation between patient volume and LTR. We alsofound that of the physician parameters, time spent with thepatient had the lowest correlation to patient satisfaction.15 Thisfinding differs from data analyzing visits to primary carephysicians. In addition, LTR correlated significantly with sur-vey response rate, belying notions that only dissatisfied patientswould respond to surveys.
Although our purpose was to determine what parameters ofpatient experience correlated most closely to patient satisfac-tion in the urology office, ultimately this information is of littleuse if it cannot be translated into action plans to producepositive change. Data suggest that the use of an EHR detractsfrom physician ability to interact with patients.16 As weimplemented a comprehensive EHR in 2006 our providersexpressed concerns about their ability to improve their patientsatisfaction scores. Based on our results demonstrating thatpatient satisfaction is most directly related to the interaction
Appendix.Survey questions
Logistics Practice
Ease of getting clinic on phone Cleanliness of our practice
Convenience of our office hours Concern of nurse/assistant for problem
Ease of scheduling appointments Friendliness of nurse/assistant
Information about delays How well staff protect safety
Courtesy of registration staff Staff worked together
Our concern for patients’ privacy
Our sensitivity to patients’ needs
between the physician and patient, we used these data to createspecific action plans for individual providers to improve theirpatient satisfaction scores, with attention to direct interactionwith patients in the EHR environment. In addition, based onthe strong correlation between information about delays andwait time in clinic (r¼0.974, p <0.01), those offices withlonger wait times were directed to be more proactive incommunicating information about delays to patients. Theseefforts proved fruitful. In data not presented in this report,after implementing systemic provider education tools, during a12-month period we observed a significant increase in ourpractice’s aggregate LTR score from the 56.9th percentile tothe 69.1 percentile (D¼12.2, p¼0.02).
Despite the large study size, our data are not without limi-tations. Although our questionnaire and CG-CAHPS surveyinstruments are physician centric and, therefore, the results arelikely similar, the scoring mechanism for CG-CAHPS isdifferent than that used in our questionnaire. As such, our resultsmay differ from those of the CG-CAHPS. In addition, as ourpractice is located in the New York metropolitan area, we do nothave survey responses for the United States overall. This limi-tation is mitigated by the broad footprint of the data collection.Patients were seen at 47 office locations in 7 densely populatedcounties with a wide socioeconomic demographic range. Ourdata collection was also limited to adult patients in freestandingurology offices. Therefore, the conclusions may not be gener-alizable to pediatric or institutional outpatient offices.
Conclusions
The incorporation of patient satisfaction metrics is increasinglyimportant to urologists nationwide. Our large series demon-strates that patient satisfaction in the urology office correlatesmost strongly with patient-physician interaction. Implementa-tion of systematic, comprehensive patient satisfaction surveysis feasible for urology practices and can provide meaningfuldata to enhance the patient experience.
Provider Other
CP concern for patient’s questions Wait time at clinic
CP efforts to include in decisions Likelihood to refer
CP explanations of patient’s problem Number of patients seen
CP information about medications Survey response %
CP instructions for follow-up care
CP spoke using clear language
Friendliness/courtesy of CP
Patients’ confidence in CP
Time CP spent with patient
References
1. Reiser SJ: The era of the patient. Using the experience of illness in shapingthe missions of health care. JAMA 1993; 269: 1012.
2. Huckman RS and Kelley MA: Public reporting, consumerism, and patientempowerment. N Engl J Med 2013; 369: 1875.
3. Kerr EA and Hayward RA: Patient-centered performance management:enhancing value for patients and health care systems. JAMA2013; 310: 137.
4. Jha AK, Orav EJ, Zheng J et al: Patients’ perception of hospital care in theUnited States. N Engl J Med 2008; 359: 1921.
5. Rao M, Clarke A, Sanderson C et al: Patients’ own assessments ofquality of primary care compared with objective records based measuresof technical quality of care: cross sectional study. BMJ 2006; 333: 19.
6. Powell AA, White KM, Partin MR et al: Unintended consequences ofimplementing a national performance measurement system into localpractice. J Gen Intern Med 2012; 27: 405.
126 Patient Satisfaction with Urology Practice
7. Giordano LA, Elliott MN, Goldstein E et al: Development, implementa-tion, and public reporting of the HCAHPS survey. Med Care Res Rev2010; 67: 27.
8. Centers for Medicare & Medicaid Services (CMS), HHS: Medicare pro-gram; revisions to payment policies under the physician fee schedule,clinical laboratory fee schedule & other revisions to Part B for CY 2014.Final rule with comment period. Fed Regist 2013; 78: 74229.
9. Kessler DP and Mylod D: Does patient satisfaction affect patient loyalty?Int J Health Care Qual Assur 2011; 24: 266.
10. Bell R and Krivich MJ: How to Use Patient Satisfaction Data to ImproveHealthcare Quality. Milwaukee: American Society for Quality Press 2000.
11. Press Ganey Associates Inc: Protecting market share in the era of reform:understanding patient loyalty in the medical practice segment. Available atwww.pressganey.com/researchResources/white-papers/white-papers-for-medical-practices-ambulatory.aspx.
12. Fu AZ and Wang N: Healthcare expenditures and patient satisfaction: costand quality from the consumer’s perspective in the US. Curr Med Res Opin2008; 24: 1385.
13. Bleich SN, Ozaltin E and Murray CK: How does satisfaction with thehealth-care system relate to patient experience? Bull World Health Organ2009; 87: 271.
14. Schoenfelder T, Klewer J and Kugler J: Determinants of patient satisfac-tion: a study among 39 hospitals in an in-patient setting in Germany. Int JQual Health Care 2011; 23: 503.
15. Freeman GK, Horder JP, Howie JG et al: Evolving generalpractice consultation in Britain: issues of length and context. BMJ 2002;324: 880.
16. Gadd CS and Penrod LE: Dichotomy between physicians’ and patients’attitudes regarding EMR use during outpatient encounters. Proc AMIASymp 2000; 275.


![Determinants of Employee Satisfaction in POWERGRID[1]](https://static.fdocuments.in/doc/165x107/54689b64af795988338b5bd3/determinants-of-employee-satisfaction-in-powergrid1.jpg)