Determinants of Organizational Performance Ln The Semi ...
301
United Arab Emirates University Scholarworks@UAEU eses Electronic eses and Dissertations 5-2016 Determinants of Organizational Performance Ln e Semi-Government Sector Of Abu Dhabi: Strategic Management Perspective Bakheet Saeed Al Katheeri Follow this and additional works at: hps://scholarworks.uaeu.ac.ae/all_theses Part of the Business Commons is Dissertation is brought to you for free and open access by the Electronic eses and Dissertations at Scholarworks@UAEU. It has been accepted for inclusion in eses by an authorized administrator of Scholarworks@UAEU. For more information, please contact [email protected]. Recommended Citation Al Katheeri, Bakheet Saeed, "Determinants of Organizational Performance Ln e Semi-Government Sector Of Abu Dhabi: Strategic Management Perspective" (2016). eses. 688. hps://scholarworks.uaeu.ac.ae/all_theses/688
Transcript of Determinants of Organizational Performance Ln The Semi ...

United Arab Emirates UniversityScholarworks@UAEU
Theses Electronic Theses and Dissertations
5-2016
Determinants of Organizational Performance LnThe Semi-Government Sector Of Abu Dhabi:Strategic Management PerspectiveBakheet Saeed Al Katheeri
Follow this and additional works at: https://scholarworks.uaeu.ac.ae/all_theses
Part of the Business Commons
This Dissertation is brought to you for free and open access by the Electronic Theses and Dissertations at Scholarworks@UAEU. It has been acceptedfor inclusion in Theses by an authorized administrator of Scholarworks@UAEU. For more information, please contact [email protected].
Recommended CitationAl Katheeri, Bakheet Saeed, "Determinants of Organizational Performance Ln The Semi-Government Sector Of Abu Dhabi: StrategicManagement Perspective" (2016). Theses. 688.https://scholarworks.uaeu.ac.ae/all_theses/688

I nl I: u College of Business \.1 � and Economics
a.ul.a..ll �pt.lll.::..IIJL..o�l W!..al;l �· I United Arab Emirates University
United Arab Emirates University
College of Business and Economics
DETERMJNANTS OF ORGANIZATIONAL PERFORMANCE lN
THE SEMI-GOVERNMENT SECTOR OF ABU DHABI: STRATEGIC MANAGEMENT PERSPECTIVE
Bakheet Saeed Al Katheeri
This dissertation is submitted in partial fulfilment of the requirements for the degree ofDoctorate ofBusiness Administration
Under the Supervision ofDr. Said Elbanna
May 2016

ii
Declaration of Original Work
I, Bakheet Al Katheeri, the undersigned, a graduate student at the United Arab
Emirates University (UAEU), and the author of this dissertation entitled
“Determinants of Organizational Performance in the Semi-Government Sector of Abu
Dhabi: A Strategic Management Perspective”, hereby, solemnly declare that this
dissertation is my own original research work that has been done and prepared by me
under the supervision of Dr. Said Elbanna, in the College of Business and Economic
at Qatar University. This work has not previously been presented or published, or
formed the basis for the award of any academic degree, diploma or a similar title at
this or any other university. Any materials borrowed from other sources (whether
published or unpublished) and relied upon or included in my dissertation have been
properly cited and acknowledged in accordance with appropriate academic
conventions. I further declare that there is no potential conflict of interest with respect
to the research, data collection, authorship, presentation and/or publication of this
dissertation.
Student’s Signature Date

iii
Copyright
Copyright © 2016 Bakheet Al Katheeri All Rights Reserved

iv
Advisory Committee
1) Advisor: Dr. Said Elbanna
Title: Associate Professor of Strategic Management
College of Business and Economic at Qatar University, Qatar
2) Co-advisor: Dr. Mustafa Colak
Title: Assistant Professor of Strategic Management
Faculty of Political Science at Social Sciences University of Ankara, Turkey

v
Approval of the Doctorate Dissertation
This Doctorate Dissertation is approved by the following Examining Committee
Members:
Advisor: Dr. Said Elbanna
Title: Associate Professor
Department: Management and Marketing
College of Business and Economics, Qatar University
Signature Date
Member: Dr. James Ryan
Title: Associate Professor
Department: Business Administration
College of Business and Economics, UAE University
Signature Date
Member: Dr. Samir Emam
Title: Associate Professor
Department: Mechanical Engineering
College of Engineering, UAE University
Signature Date
Member (External Examiner): Dr. Marin Alexandrov Marinov
Title: Professor
Department: Business Management
Institution: Aalborg University, Denmark
Signature Date

vi
This Doctorate Dissertation is accepted by: Dean of the College of Business and Economics: Professor Geralyn Franklin Signature Date Dean of the College of the Graduate Studies: Professor Nagi T. Wakim Signature Date
Copy of

vii
Abstract
With a conceptual model, we focused on evaluating the current situation of
strategic management practices in Abu Dhabi’s semi-government sector, a little-
researched area, to understand the relationships between strategy formulation,
implementation and evaluation, as elements, and organizational performance; to
identify whether environmental dynamism plays moderating roles in these
relationships; and to explore the relationship between organisational performance and
organizational competiveness. Data were collected in Abu Dhabi from semi-
government organizations of the UAE. A questionnaire was used on a sample
population of 210 organizations. 182 completed questionnaires were collected and
included in the analysis. The structural equation modelling package, AMOS, was used
to test the hypotheses shown in the conceptual model of the study. Our findings suggest
that one dimension of strategy formulation (namely, the intensity of strategic
planning), the two dimensions of strategy implementation (namely, the
comprehensiveness and the alignment of strategic plan implementation), and those of
strategy evaluation (namely, accountability and strategic control) are positively related
to organizational performance. We found also that environmental dynamism plays a
moderating role in most of these relationships and organizational performance
significantly influences organizational competiveness. The academic and managerial
implications of these findings for both scholars and practitioners are discussed.
Keywords: Strategic management, Abu Dhabi’s semi-government sector, strategy
formulation, implementation and evaluation, organisational performance and
organizational competiveness.

viii
Title and Abstract (in Arabic)
محددات الأداء التنظیمي في قطاع أبو ظبي شبھ الحكومي: منظور الإدارة الاستراتیجیة
صالملخ
باستخدام نموذج نظري، قمنا بالتركیز على تقییم الوضع الحالي لممارسات الإدارة
القطاع شبھ الحكومي في اماره أبو ظبي بدولھ الإمارات العربیة المتحدة وھو الاستراتیجیة في
موضوع غیر مدروس بشكل كافي، وذلك لفھم العلاقات بین صیاغة الاستراتیجیة وتطبیقھا
وتقییمھا، كعناصر رئیسیة، وبین أداء المنظمة. وتھدف ھذه الدراسة أیضا الى تحدید فیما لو
ئة المحیطھ تلعب دورا وسیطا في ھذه العلاقات وأن تستكشف العلاقة بین كانت دینامیكیة البی
أداء المنظمة وقدرة المنظمھ التنافسیة . لقد تم تجمیع البیانات الخاصھ بھذه الدراسة من منظمات
القطاع شبھ الحكومي في اماره أبو ظبي بدولة الإمارات العربیة المتحدة. ولقد تم استھداف عینة
استبیانا ۱۸۲منظمة شبھ حكومیة. ومن بین تلك المنظمات، تم النجاح في تجمیع ۲۱۰تضم
وتم استخدامھا في تحلیل البیانات. ولقد استخدمنا برنامج محاكاة المعادلة الھیكلیة، (أموس)،
النموذج النظري للدراسة. وتظھر نتائج الدراسة أن بعدا واحدا من بعدي صیاغة لاختبار فروض
الإستراتیجیة، وبالتحدید كثافة التخطیط الاستراتیجي، والبعدین المتعلقین بتطبیق الاستراتیجیة،
وبالتحدید شمولیة وتوافق تطبیق الخطة الاستراتیجیة، والبعدین المتعلقین بتقییم الاستراتیجیة،
. وقد استنتجنا أیضا وبالتحدید المسائلة والرقابة الاستراتیجیة، مرتبطین إیجابیا بأداء المنظمة
أن دینامیكیة البیئة المحیطھ لھا دور وسیط في أغلب ھذه العلاقات وأن أداء المنظمة یؤثر تأثیرا
معنویا على القدرة التنافسیة التنظیمیة. وسنناقش في ھذه الدراسة التطبیقات الأكادیمیة والعملیة
.لھذه النتائج بالنسبة لكل من الباحثین والممارسین
. القطاع شبھ الحكومي في اماره أبو ظبي ،لإدارة الاستراتیجیة ا ھیم البحث الرئیسیة:مفا

ix
Acknowledgements
Although it is my name alone that is on the front cover of this thesis, I am by
no means the only contributor. Rather, a number of people are behind this piece of
work, who deserve to be both acknowledged and thanked here.
First, I would like to thank my Advisors, Dr. Said Elbanna and Dr. Mustafa
Colak, who have helped me with their guidance, support, and time to ensure that this
journey would be educationally enriching and successfully completed. Thanks also
go to Professor Mohamed Madi and Dr. Rihab Khalifa for their help and support, and
for making the UAEU DBA program so intellectually stimulating. I am also indebted
to Professor Riyad Eid who has provided me with valuable and timely feedback during
my DBA study.
Last but not least, special recognition goes to my family and colleagues.
Without their unremitting support, encouragement and patience, I would not have been
able to complete my study.
For all, I will always be grateful.

x
Dedication
To H.E. Suhail Mohammed Al Mazroui, The Minister of Energy in the UAE for his inspiration and encouragement.

xi
Table of Contents
Title .................................................................................................................................... i Declaration of Original Work .......................................................................................... ii Copyright ......................................................................................................................... iii Advisory Committee ....................................................................................................... iv Approval of the Doctorate Dissertation .......................................................................... v Abstract ........................................................................................................................... vii Title and Abstract (in Arabic) ....................................................................................... viii Acknowledgements ......................................................................................................... ix Dedication ......................................................................................................................... x Table of Contents ............................................................................................................ xi List of Tables ................................................................................................................. xiii List of Figures ................................................................................................................. xv
Chapter 1: Introduction .................................................................................................... 1 1.1 Overview ...................................................................................................... 1 1.2 Theoretical Context of the Study ................................................................ 1 1.3 Abu Dhabi as the Research Context ........................................................... 7 1.4 Research Objectives and Questions .......................................................... 10 1.5 Research Contributions ............................................................................. 12 1.6 Outline of the Thesis .................................................................................. 15
Chapter 2: Literature Review and Hypotheses Testing ............................................... 18 2.1 Introduction ................................................................................................ 18 2.2 Strategic Management ............................................................................... 18 2.3 Organizational Performance...................................................................... 25 2.4 Organizational Competitiveness ............................................................... 29 2.5 Strategic Plan Formulation ........................................................................ 33 2.6 Strategic Plan Implementation .................................................................. 51 2.7 Strategic Plan Evaluation .......................................................................... 68 2.8 Organizational Performance and Organizational Competitiveness ........ 85 2.9 Environmental Characteristics (Environmental Dynamism) .................. 87 2.10 Organizational Characteristics ................................................................ 92 2.11 Summary of Hypotheses ......................................................................... 97 2.12 Chapter Summary .................................................................................. 101
Chapter 3: Methodology .............................................................................................. 102 3.1 Introduction .............................................................................................. 102 3.2 Research Questions .................................................................................. 102 3.3 Research Paradigm .................................................................................. 103 3.4 Questionnaire Development and Pretesting ........................................... 106 3.5 Sampling ................................................................................................... 118

xii
3.6 Data Collection Procedures ..................................................................... 121 3.7 Ethical Considerations ............................................................................. 122 3.8 The Analysis Process ............................................................................... 122 3.9 Data Analysis Method ............................................................................. 125 3.10 Chapter Summary .................................................................................. 132
Chapter 4: Purification of Measures and Descriptive Analysis................................. 133 4.1 Introduction .............................................................................................. 133 4.2 Data Preparation and Purification of Measures, and Reliability Analysis ......................................................................................................................... 133 4.3 Content Validity ....................................................................................... 141 4.4 Descriptive Analysis of the Sampled Organizations and Respondents 169 4.5 Chapter Summary .................................................................................... 173
Chapter 5: Exploratory Analysis and Hypotheses Testing ........................................ 175 5.1 Introduction .............................................................................................. 175 5.2 Exploratory Analysis of Strategic Planning Practice ............................ 175 5.3 Hypotheses Testing .................................................................................. 190 5.4 Conclusion and Summary of Findings ................................................... 206
Chapter 6: Discussion and Conclusion ....................................................................... 208 6.1 Introduction .............................................................................................. 208 6.2 Discussion of the Research Findings ...................................................... 208 6.3 Theoretical Contributions of the Study .................................................. 222 6.4 Implications of the Study ........................................................................ 223 6.5 Limitation and Suggestions for Future Research ................................... 225 6.6 Conclusions .............................................................................................. 228
Bibliography ................................................................................................................. 229 Appendix A ................................................................................................................... 260 Appendix B ................................................................................................................... 261 Appendix C ................................................................................................................... 272 Appendix D ................................................................................................................... 276 Appendix E ................................................................................................................... 277

xiii
List of Tables
Table 1: The Eight (8) ‘S’s of Strategy Execution Defined ........................................ 61 Table 2: Strategic Plan Formulation Items ................................................................. 108 Table 3: Strategic Plan Implementation Items ........................................................... 109 Table 4: Strategic Plan Evaluation Items .................................................................... 111 Table 5: Organizational Performance ......................................................................... 113 Table 6: Environmental Dynamism ............................................................................ 114 Table 7: Reliability Analysis for the Research Variables .......................................... 136 Table 8: KMO and Bartlett's Test ............................................................................... 145 Table 9: Principal Component Analysis Extraction Results...................................... 146 Table 10: Communalities ............................................................................................. 146 Table 11: Rotated Component Matrixa ....................................................................... 147 Table 12: KMO and Bartlett's Test ............................................................................. 150 Table 13: Principal Component Analysis Extraction Results ................................... 151 Table 14: Communalities ............................................................................................. 152 Table 15: Rotated Component Matrixa ....................................................................... 153 Table 16: KMO and Bartlett's Test ............................................................................. 156 Table 17: Principal Component Analysis Extraction Results ................................... 157 Table 18: Communalities ............................................................................................. 158 Table 19: Rotated Component Matrixa ....................................................................... 159 Table 20: KMO and Bartlett's Test ............................................................................. 162 Table 21: Principal Component Analysis Extraction Results ................................... 163 Table 22: Communalities ............................................................................................. 163 Table 23: Rotated Component Matrixa ....................................................................... 164 Table 24: KMO and Bartlett's Test ............................................................................. 166 Table 25: Principal Component Analysis Extraction Results ................................... 166 Table 26: Communalities ............................................................................................. 167 Table 27: Rotated Component Matrixa ....................................................................... 168 Table 28: Number of Full Time Employees ............................................................... 170 Table 29: Number of Expatriate Employees .............................................................. 171 Table 30: Percentage of Foreign Ownership .............................................................. 172 Table 31: Number of Years in Current Organization................................................. 172 Table 32: Managerial Level ......................................................................................... 173 Table 33: Gender .......................................................................................................... 173 Table 34: Reliability analysis of main constructs in the study .................................. 174 Table 35: Distribution of the Sample by Development of the First Strategic Plan .. 176 Table 36: Distribution of the Sample by Planning Horizon ...................................... 177 Table 37: Distribution of the Sample by Time Needed to Prepare the Strategic Plan
..................................................................................................................... 178 Table 38: Distribution of the Sample by Full Time Employees who are Charged with
Strategic Planning ....................................................................................... 179

xiv
Table 39: Distribution of the Sample by Managers/Board Members Participating in Strategic Planning ....................................................................................... 180
Table 40: Participation in the Development of Strategic Plans (by Managers/Board Members) according to Organizational Size............................................. 181
Table 41: Participation in the Development of Strategic Plans (by Managers/Board Members) in relation to Ownership ........................................................... 183
Table 42: Distribution of the sample by Strategic Planning Tools Used .................. 185 Table 43: Strategic Planning Tools Used (by Organizational Size).......................... 186 Table 44: Strategic Planning Tools Used (by Ownership) ........................................ 189 Table 45: Skewness and Kurtosis ................................................................................ 195 Table 46: Confirmatory Factor Analysis of Model Constructs ................................. 196 Table 47: Cronbach’s alpha, Bivariate Correlations, and Average Variances
Extracted (AVE) ......................................................................................... 198 Table 48: Standardized Regression Weights .............................................................. 200 Table 49: Test moderating effect................................................................................. 204 Table 50: Results of Hypothesis Testing .................................................................... 207

xv
List of Figures
Figure 1: Conceptual Model .......................................................................................... 98 Figure 2: Model of the Data Analysis Process ........................................................... 124 Figure 3: Moderator Model ......................................................................................... 130 Figure 4: Research Model ............................................................................................ 193 Figure 5: Tested Model ................................................................................................ 202

1
Chapter 1: Introduction
1.1 Overview
Strategic management is an increasingly important activity for many
organizations, including those in less-researched, non-Western countries, such as the
United Arab Emirates (UAE). Although the amount of research on this area is vast, in
particular in Western countries, a number of notable gaps certainly remain in the
literature. This chapter begins with an overview of the background to the present
research, before describing its focus: understanding the relationship between strategic
planning, implementation and evaluation on one side, and organizational performance
on the other. The discussion then turns to describing the Abu Dhabi emirate, as the
research context. Then the chapter sets out the research objectives and questions, in
addition to the academic contribution that the research is hoped to make to the strategic
management literature. The chapter concludes with an overview of the structure of the
thesis, highlighting the issues to be discussed in each of the forthcoming chapters.
1.2 Theoretical Context of the Study
The last few decades have seen phenomenal transformations in the way that
organizations work. These transformations have paved the way for new work practices
and technologies enabling businesses to cope with changing economic and social
consequences in an increasingly global marketplace (Mulcasteri, 2009). However, to
tackle the new economic and social conditions, both internal and external,
organizations are using strategies to achieve high levels of strategic alignment and
consistency (Mckeown, 2012).

2
As businesses evolved, strategic management was introduced to increase
management’s ability to develop plans, policies and structures (Neilson, Martin, &
Powers, 2008). According to David (2011), strategic management allowed
organizations to assess and re-assess strategies, competitors, new economic situations
and technology. Through strategic management, organizations learnt to make timely
business decisions and deal with an increasingly uncertain future.
The fundamental definition of strategic management derives from the basic
meaning of ‘strategy’. The works of Chandler (1962) and Ansoff (1965) provide the
first definitions of strategy and the foundation for the field. Chandler (1962, p. 16)
defines strategy as “the determination of the basic long-term goals and objectives of
an enterprise, and the adoption of courses of action and the allocation of resources
necessary for carrying out these goals”.
In the current literature, normative models of strategic management have
depicted it as a process with three key stages or elements: strategy formulation,
strategy implementation, and strategy evaluation and control (Preble, 1992). Strategy
formulation refers to establishing the vision, mission, and long-term objectives and
generating and identifying strategic options to strengthen the competitive position of
the company. Strategy implementation is concerned primarily with the modification
of organizational structures and processes to ensure that the planned results are
obtained (Galbraith & Kazanjian, 1986; Lorange & Murphy, 1984). This stage requires
the building of an organization capable of performing a successful strategy, setting
budgets, developing administrative support systems, and devising performance reward
systems and an organizational culture model to match the strategy. Strategy evaluation

3
and control aims to highlight and generate solutions to correct any deviations from the
outcomes that the implemented strategies were expected to generate.
Researchers have been interested in studying the relationship of strategy
formulation, implementation, and evaluation to organizational performance. For
example, many studies seek to elucidate the relationship between strategic planning or
strategy formulation and organizational performance. The results of this body of
research are fragmented, however, and no consensus has yet emerged (Elbanna &
Child, 2007; Falshaw, Glaister, & Tatoglu, 2006). Previous research provides support
for all possible relationships: a positive relationship (Andrews, Boyne, Law, &
Walker, 2011; Sarason & Tegarden, 2003); a negative relationship (Fredrickson &
Mitchell, 1984); no relationship (Robinson & Pearce, 1983); and a complex
relationship (Fredrickson & Mitchell, 1984; Poister, Edwards, Pasha, & Edwards,
2013). However, it is usually accepted that the practice of strategic planning benefits
organizations (Sarason & Tegarden, 2003); and that, over time, the use of tools for
strategic planning will enhance organization performance (Elbanna, 2008).
The relationship between strategy implementation and organizational
performance has also been addressed by many researchers. White, Conant, and
Echambadi (2003) have suggested that firms that excel at implementing strategy have
significantly greater firm performance. Similarly, the marketing strategy literature
suggests that the effective implementation of planned marketing strategy is a key
driver of firm performance (Olson, Chae, & Sheu, 2005). Morgan, Katsikeas, and
Vorhies (2012) find that effective implementation of planned export marketing
strategy contributes to export market and financial performance. More recently,
Elbanna and Fadol (2016) report a significant linkage between the comprehensive
implementation of strategic plans and their effectiveness.

4
Researchers point out that many benefits result from conducting strategy
evaluation (Guyadeen & Seasons, 2015). Evaluations support constant improvement
in the profession (Balsas, 2012; Oliveira & Pinho, 2011). By conducting evaluation,
managers can improve both the planning process and the implementation of plans, thus
achieving intended outcomes (Seasons, 2003) and improving organizational
performance. Strategy evaluation has a positive impact on outcomes, which include
strategic direction, fit with the environment, communication with stakeholders and
performance (Elbanna, 2013).
Although we can find plenty of empirical studies on any of the above three
elements of the strategic management process, namely, strategy formulation,
implementation and evaluation, it is hard to find one study that incorporates all three
elements in a single work, as we do in the present research. This is a significant
contribution on the part of this study, which contributes to filling a serious gap in the
literature of strategic management.
Another contribution of this study is its empirical examination of the three
processes of strategic management in semi-government organizations. Organizations
may be classified as pure government, quasi- or semi-government organizations, and
purely private organizations. According to Moe (2001), the second category consists
of state owned corporations, business enterprises or public sector undertakings created
for the purpose of commercial activity by the government itself. Semi-government
organizations occupy a putative terrain which exists between the government and the
private sectors and functions across the political realm for five different purposes – to
prevent the presence and growth of bureaucracy; develop new sources for revenue;
exempt advocates of agencies from management laws; provide a basis for new public

5
management using economically-focused values; and propagate entity-specific laws
and regulations for management flexibility (Kosar, 2011).
While strategic management across private organizations is a well-researched
subject, strategic management processes across the public sector have received less
than their due attention from researchers (Elbanna, Andrews, & Pollanen, 2015;
Furrer, 2008). Private sector organizations have paid active attention to strategic
management since the 1950s, whereas, according to Poister and Streib (2005), strategic
management was introduced into the public sector only three decades ago.
Previously, the literature focused on public and/or private organizations but
little or no attention went to semi-government organizations. In the semi-government
organizations, generalized applications of either public sector or private sector
strategic management processes or practices are implied (Elbanna, 2007). Therefore,
it is helpful to understand the relevance and value of strategic management for the
purpose of better managing semi-government bodies.
While government organizations are operated solely by political entities in
government, semi-government organizations are elected agencies usually controlled
by the government (Hudson & Lowe, 2009). Nevertheless, organizations which are
between public and private have different strategic management practices from semi-
government organizations. The differences in the core definitions of organizations
between the public and private sectors and those in the semi-government sector
demand separate research in the strategic management field.
Another contribution of the present research is its use of a non-Western country
(i.e., the UAE) as the source of its data. Most of the available literature on strategic

6
management focuses on practices in Western countries (Streib, Slotkin, & Rivera,
2001). However, while descriptive research on the public sector and the practical
application of the findings are widely found in Western accounts of public and private
organizations, they are scarce even from academic writers in the UAE. In a recent
study, Elbanna (2013) states that little academic knowledge is available on strategic
management practices in the UAE public sector. He adds that it is unclear which stage
of practice the UAE public sector organizations have reached: do they plan in order to
achieve, plan to act or plan to act effectively and positively influence organizational
performance and the quality of service delivery? Hence, this study aims to examine
strategic management practices where little research has been done – in semi-
government organizations in general, and in those of the UAE in particular.
Finally, this research is concerned with the role of the environment of the
strategy process. Many scholars have discussed the impact of the environment on
strategy processes and organizational performance (Goll & Rasheed, 2004). They
argue that strategy processes are influenced by such environmental attributes as
uncertainty, complexity, munificence, and dynamism (Dess & Beard, 1984;
Hutzschenreuter & Kleindienst, 2006; Sharfman & Dean, 1991; Shepherd & Rudd,
2014). Thus, it would be interesting to discuss the moderating role of the environment
on the relationship of strategy formulation, implementation, and evaluation to
organizational performance.
In sum, this study contributes to the literature of strategic management by
incorporating the three main elements of the strategy process, namely formulation,
implementation and control, in one model and by examining this model in the less

7
researched semi-government sector in a region where little research on strategy can be
found, the Arab Middle East in general and the UAE in particular.
1.3 Abu Dhabi as the Research Context
The UAE is one of the most prosperous countries in the Middle East. It is
globally known for its liberal economic policies, diverse workforce and multicultural
environment (Fadol, Barhem, Elbanna, Adcroft, & Bruce, 2015). Apart from being
politically stable, the UAE offers lucrative business opportunities and relatively high
returns on investments (Schwab & Sala-i-Martin, 2012). Correspondingly, the
government restrictions on businesses are minimal and the infrastructure in the country
is highly developed. The UAE government also plans to develop new infrastructural
projects which can aid and consolidate the process of the nation’s economic
development (Schwab & Sala-i-Martin, 2012).
At the heart of the UAE lies Abu Dhabi, the emirate which is its capital, one
of the most dynamic capitals in the world today. Over the course of the last few
decades, Abu Dhabi has undergone rapid transformation in terms of both economic
and social development (DED, 2011). Primarily, the economy of Abu Dhabi is based
on rich oil and gas resources, which give the country one of the highest Gross Domestic
Product (GDP) per capita incomes in the world.
Government-owned firms control most of the world’s oil reserves.
Governments are also known as the most significant oil producers in the world
(Bremmer, 2010). The UAE holds an estimated seven percent (7%) of the world’s
proven oil reserves and produces 2.7 million barrels of oil per day (EIA, 2013).
According to the Oil & Gas Journal estimates as of January 2015, the UAE holds the

8
seventh largest proved reserves of oil in the world, at 97.8 billion barrels, with most of
the reserves located in Abu Dhabi, which accounts for approximately ninety-four
percent (94%) of the UAE's total (U.S. Energy information administration, 2015).
Thus, the huge natural resources provide rich economic sustenance and
conditions for growth. However, in the last decade, Abu Dhabi has encountered a
challenge in diversifying its economy and building a durable basis for sustained long-
term growth and prosperity (IKED, 2010). Given the limited presence of other natural
resources and its heavy dependence on ‘oil and gas’, Abu Dhabi’s Vision 2030 calls
for diversification in economic planning (IKED, 2010).
The rapid growth in international trade, foreign investments, new technologies
and personal mobility has forced the organizations in Abu Dhabi to strategically
transform and manage their own rapid growth (IKED, 2010). As a result, the
government of Abu Dhabi has been paying close attention to investing in its semi-
government organizations in order to diversify its economy and reduce its dependence
on the oil and gas industry. The country’s progress and the interest in the semi-
government sector, coupled with globalization, falling oil prices, turmoil in the Middle
East and the global financial crisis have shown an acute need to practice strategic
management across the UAE in general (Elbanna & Fadol, 2016) and Abu Dhabi in
particular.
At the beginning of the new millennium, little emphasis was put on strategic
planning in UAE based organizations. As a result, strategic management processes,
which up until 2008 were rarely and ineffectively invoked, failed to be applied where
they were needed in order to strategize Abu Dhabi’s public and semi-public
organizations (Elbanna, 2013). Over time, however, public and private sector

9
organizations in the UAE began to adapt and implement strategic management
processes, but it is difficult to claim that semi-government organizations also did this;
the author is not aware of any relevant research on this sector in Abu Dhabi or even in
the UAE as a whole compared with other contexts.
The Abu Dhabi’s group of semi-government bodies includes approximately
200 organizations encompassing oil and gas, energy, investment, education,
healthcare, tourism and many other fields (ADG, 2013). As discussed above, despite
the importance of this group, the literature has said little or nothing pertinent to
strategic management practices in the UAE’s semi-government organizations in
general or those of Abu Dhabi in particular. This is another vital contribution of the
present study, making theoretical and practical contributions to the strategic
management literature.
However, active functionality and participation from public, private and semi-
government organizations are crucial for the realization of Abu Dhabi’s Vision 2030,
which envisages long-term planning to transform the Emirate’s economy, reducing its
reliance on oil production and increasing the focus on knowledge based industries
(Arnold, 2013). In addition, the government aims to diversify the economy through
increased contributions to the non-oil sector, including primarily tourism, aviation,
manufacturing, the media, health care, petrochemicals, financial services and
renewable energy, so these organizations can implement a developed economic
strategy by 2030 (ADCED, 2008).
Vision 2030 demands transparent and accountable departments in public,
private and semi-government bodies. This inevitably affects the government’s
planning and decision making ability, calling upon semi-government organizations in

10
particular to exemplify strategic planning through formularized, implementable and
evaluative strategies for the sake of better performance.
Likewise, given the potential for growth in the semi-government sector of Abu
Dhabi, this seems a good opportunity to study strategic management processes in order
to understand how the semi-government sector formulates, implements and evaluates
strategic plans (ADCED, 2008).
Hence, a study of Abu Dhabi’s semi-government sector would inevitably add
value to the existing literature and fill important gaps in the research on strategic
management in the semi-government sector of Abu Dhabi.
1.4 Research Objectives and Questions
With the above discussion in mind, the following objectives of this study may
be specified:
1. Evaluate the current stance of the strategic management practices in Abu
Dhabi’s semi-government sector.
2. Explore the relationship between strategy formulation, implementation
and evaluation elements and organizational performance.
3. Identify whether environmental dynamism moderates the relationship of
strategy formulation, implementation and evaluation elements to
organizational performance.
To achieve the above objectives, the following research questions are
addressed for analysis:

11
1. What is the nature of strategy formulation, implementation and evaluation
in Abu Dhabi’s semi-government sector?
2. What is the relationship of the strategy formulation, implementation, and
evaluation elements to organizational performance?
3. Does environmental dynamism moderate the relationship of strategy
formulation, implementation and evaluation to organizational
performance?
It follows that addressing these research questions would fill a number of
notable knowledge gaps in the literature that still exist, despite several significant steps
that have already been taken towards developing a better understanding of the strategic
management process.
1. As noted below in Part 1.5, the relationship between the strategic
management process and organizational performance needs further
investigation because much of the focus of the previous research has been
on strategy formulation, with too little attention to its links with the other
two components of the process; namely, implementation and evaluation
and control, a line of research that has recently been emerging (e.g.,
Elbanna, 2013).
2. The moderating effect of environmental characteristics on the relationship
between the full strategic management process (i.e., all its three elements)
and organizational performance requires further study because, as a natural
extension of the above point, much of the previous research examined the
impact of environmental characteristics on strategy formulation, leaving

12
the issue of their impact on implementation and evaluation and control still
open for investigation.
3. The current stance of the strategic plan formulation, implementation and
evaluation elements in Abu Dhabi’s semi-government sector is still not
clear, since much of the focus of the previous research has been conducted
in the private and, to a lesser extent, the public sectors. Furthermore, much
of this research has been conducted in Western contexts. Only recently, a
very few studies started to investigate strategic management in the semi-
government organization context in the UAE (e.g., Elbanna, 2012; Fadol
et al., 2015).
This research attempts to fill the above knowledge gaps by studying, via
structural equation modeling, a sample of 182 semi-government organizations in the
UAE and offering several theoretical and managerial implications, as outlined below.
1.5 Research Contributions
The present study contributes to the current knowledge on strategic
management in several ways.
1. As pointed out above, previous research paid most attention to the
component of formulation and did not relate the three components of the
strategic management process equally to organizational performance; nor
did it consider all these three elements in one integrated model, apart from
a few recent exceptions (Elbanna, 2016; Elbanna & Fadol, 2016; Elbanna
et. al., 2015; Elbanna, 2013). The present research attempts to overcome
this weakness by integrating the three elements of the strategic

13
management process, in a single framework and examining their impact on
organizational performance, which may help to develop a more complete
model of the strategic management process.
2. Most of the early research has investigated environmental characteristics
with respect to strategy formulation. The present study takes these efforts
one step further and investigates the impact of environmental
characteristics (i.e., environmental dynamism) on the other two
components of the strategic management process (i.e., implementation and
evaluation and control) as well, which may further advance our
understanding of organizational performance from a strategic management
perspective.
3. Despite some recent research into strategic management processes in the
public sector in the UAE (Elbanna, 2013; Elbanna et al., 2015), very little
research has so far examined this process in semi-government
organizations (e.g., Elbanna, 2012; Fadol et al., 2015). By examining the
semi-government sector in Abu Dhabi, this study contributes to improving
managerial practices in this sector, a less researched sector than either the
private or public sectors, in the UAE in particular.
4. On a practical note, this study is timely for policy makers and executives
of the semi-government sector in Abu Dhabi. They are at present working
to divert the economy of this important emirate toward non-oil and
sustainable industries and strategic management practices are at the heart
of this process and among its main drivers.

14
This research also offers a number of implications for managers and policy
makers in the UAE semi-governmental sector in general and that of Abu Dhabi in
particular.
This study indicated that organizational performance is a function of strategic
plan formulation. Therefore, organizations should pay close attention to the strategic
planning process (i.e., choose the strategic planning tools that best fit their needs).
This study further indicated that the execution of strategic plans is also
important for organizational performance. Therefore, our study calls for managers’
attention to ensure that planned strategic decisions are effectively implemented.
This study found that strategy evaluation is positively related to organizational
performance. This suggests that top managers must have a strong sense of
accountability and effectively practice strategic control to achieve high performance
on the part of their organizations.
This study also found that environmental dynamism affects the relationship
between the strategic management process and organizational performance. This
suggests that decision makers in organizations should pay enough attention to the
environment in which their organizations are working and act accordingly.
Finally, our thesis is of special importance to the organizations operating in the
Abu Dhabi context, in that it reports that strategic planning can help the Abu Dhabi
semi-government organizations to plan effectively and strategically, and thereby to
perform better.

15
1.6 Outline of the Thesis
The plan and organization of chapters in this thesis are as follows:
Chapter 1: Introduction
This chapter discusses the general outline of the thesis. Topics include
theoretical background to the research, the context of the study, the research objectives
and questions, and the contributions and outline of the thesis.
Chapter 2: Literature Review
This chapter provides an overview of the theoretical foundations on which this
research is based. It discusses the literature on strategic management, strategy
formulation, strategy implementation and strategy evaluation. The literature search
focuses on issues arising from the relationship between the three strategy processes
and organizational performance and competitiveness. It is used to identify related
constructs and gaps in the literature, which then leads to the formulation of a research
model and research hypotheses.
Chapter 3: Methodology
This chapter is about the research methods that were adopted in this study to
collect data for testing the research hypotheses that were developed in Chapter 2. It
therefore discusses in detail issues such as the research design, unit of analysis,
measurement, sampling design, questionnaire design, data collection methods, and
analytical procedures. To achieve the research purpose, the literature related to these
issues was searched to obtain information on the scales appropriate for measuring the

16
constructs and the appropriate method for conducting quantitative research with
significant validity and reliability.
Chapter 4: Descriptive Statistics and Reliability Analysis
This chapter presents the preliminary research findings. The descriptive
analysis provides some qualitative insights with which to investigate, describe and
discuss the data. It also focuses on the purification and computation processes of the
measuring instruments.
Chapter 5: Quantitative Analysis
This chapter describes the procedures and findings of the factor analysis,
means testing, and structural equation modelling. The results of the hypothesis testing
were revealed.
Chapter 6: Discussion
This chapter discusses the research findings. It next highlights the theoretical
contributions and the practical implications of this study. The chapter then draws
attention to the study’s limitations, before offering suggestions for future research. The
chapter ends with a conclusion to the thesis as a whole.
Summary
This chapter presents an overview of the study: namely, the theoretical
background to the research, its research objectives and questions, and the significance
of the present study. In addition, this chapter also presents an outline of the study. The

17
following chapter reviews the literature in order to identify the research constructs and
their relationships. The literature review leads to the development of a conceptual
framework and associated hypotheses.

18
Chapter 2: Literature Review and Hypotheses Testing
2.1 Introduction
This research aims to investigate how strategy formulation, strategy
implementation and strategy evaluation influence organizational performance and the
impact of the latter on organizational competitiveness. To this end, this chapter
provides a review of the relevant literature on these concepts and develops the study’s
hypotheses. The chapter begins by a brief description of the evolution of strategic
management. Then it briefly discusses the concepts of organizational performance and
competitiveness, provides an in-depth review of the literature on the three elements of
strategic management (formulation, implementation and evaluation), and explains the
relationships of these three concepts with organizational performance and that of the
latter with organizational competitiveness. The concept of environmental dynamism
is also discussed to explore its moderating effects on the above relationships. Finally,
the above reviews are synthesized to develop a conceptual framework that describes
the hypotheses put forward, which are presented and discussed at the end of the
chapter.
2.2 Strategic Management
The definition of strategic management derives from the basic meaning of
‘strategy’. The works of Chandler (1962) and Ansoff (1965) provided the first
definitions of strategy and the foundation for the field. Chandler (1962, p. 16), for
example, defined strategy as “the determination of the basic long-term goals and
objectives of an enterprise, and the adoption of courses of action and the allocation of
resources necessary for carrying out these goals”. Andrew (1987) added the ideas of

19
distinct competence, company mission and business definition and popularized the
SWOT analysis, which was usually credited to the works of George Albert Smith Jr.,
C. Roland Christensen and Kenneth Andrews at the Harvard Business School in the
1950s (Ghazinoory, Abdi, & Azadegan-Mehr, 2011). Andrew (1987) argued that by
using SWOT analysis, a firm can understand the uncertain environment that presents
threats and opportunities to which it has to adapt its strengths and weaknesses.
Johnson, Scholes, and Whittington (2008) defined ‘strategy’ as complex adaptations
of processes, plans and structures that serve or appear to serve an important function
in achieving evolutionary success.
The above brief description suggests that one of the fundamental questions that
strategic management attempts to answer is, how do firms achieve sustainable
competitive advantage (Herrmann, 2005). In this quest, many concepts, theories and
methodological approaches have been developed. These theories and concepts mainly
examine the external and internal conditions for the firm and develop ideas and
methodological advances that try to predict managerial responses to changes in these
conditions (Herrmann, 2005), ultimately causing strategic management to emerge as a
field of study.
2.2.1 Evolution of Strategic Management
The evolution of the strategic management field has been impressive. Since its
earliest days, strategic management has experienced fluctuating popularity and
effectiveness. It first appeared in the 1950s and was very popular between the mid-
1960s and the mid-1970s. Then at the end of the 1970s and during the 1980s, strategic
management lost its popularity because many planning models did not perform very

20
well (Elbanna, 2013) and strategic management was criticized on the grounds that it is
based upon theoretical principles and not on the realities of management (Berry, 1998).
It has also been argued that strategic management (strategic planning) is rigid and
limited to the work of top managers or CEOs (Aldehayyat & Anchor, 2008). As a
response, these and similar criticisms were incorporated into strategic management.
Consequently, during the 1990s, strategic management restored some of its reputation
(Glaister & Falshaw, 1999). From its ‘humble’ beginnings as the limited content of a
capstone general management course in the business school curriculum, strategic
management is now a well-established field and is a widely used practice in various
organizations (Hoskisson, Hitt, Wan, & Yiu, 1999).
In strategic management, the original definition of strategy initiated an era of
ferment characterized by a focus on the environment (Herrmann, 2005). The attention
to the environment of firms resulted in the development of a widely accepted model
for analysing industry. Then a new era of ferment was created derived from the
resource-based view that affirms that the main sources of sustainable competitive
advantages reside in the development and use of valuable organizational resources
(Herrmann, 2005). These two perspectives, which are briefly described below, have
played a significant role in shaping strategy research, along with such other theoretical
perspectives as agency theory, institutional theory, and transaction costs theory
(Guerras-Martín, Madhok, & Montoro-Sánchez, 2013).

21
2.2.1.1 Michael Porter’s Five Forces
Michael Porter (1980) used the ideas of industrial organizational economics to
build a framework for industry analysis. He provided the first ‘dominant design’ in
strategic management with his classic book Competitive Strategy (Barney, 2001).
Porter’s Five Forces framework clearly specifies the various aspects of an
industry structure; in this way it provides a useful analytic tool to assess an industry’s
attractiveness and facilitates competitor analysis. The “Five Forces” model combines
an analysis of competitive actions (or rivalry) between firms, with the horizontal threat
of new entrants and substitutes and the vertical power of buyers and suppliers to
determine an industry’s attractiveness and identify possible sources of profitability
(Porter, 2008). More particularly, Porter argues that a firm’s performance is primarily
a function of the industry environment in which it competes. Firm performance is
determined by industry attractiveness, which depends on five essential forces: threat
of entry, intensity of rivalry among existing competitors, pressure from substitute
products, the bargaining power of buyers, and the bargaining power of suppliers.
Based on multiple industry analyses, Porter also classified four stages in an industry’s
life cycle, namely, introduction, growth, maturity and decline, in which the industrial
forces combine in predictable ways that make certain generic strategies more or less
advantageous (Grant, 2008).
Porter’s Five Forces concept built a framework of strategic management and
industry analysis. However, this framework focuses on the market structure to explain
organizational performance and ignores the firm itself (Hoskisson et al., 1999). Thus,
the resource-based view of the firm has been readily adopted as a useful complement
that shifts the focus on to building organizations’ internal capabilities to leverage

22
unique configurations of resources (Grant, 2008). By focusing internally,
organizations are able to rely on their unique and rare resources to achieve competitive
advantage and high levels of organizational performance.
2.2.1.2 The Resource-based View of the Firm
After the definition of strategy in the 1960s and the focus on the environment
in the 1980s, scholars searched inside the firm for a new paradigm. The Resource
Based-View (RIB) of the firm can be seen as a discontinuity that started a new era of
ferment in strategic management. The RIB focuses on market imperfections and
highlights firms’ varying degrees of specialization. This view complements the
industry analysis framework, which considers that profitability is the source of the
characteristics of the industry, and indicates that the type, magnitude and nature of a
firm’s resources and capabilities are important determinants of profitability (Amit &
Schoemaker, 1993).
The word ‘resource’ refers to something that an organization can draw on to
accomplish its goals. It may refer to tangible assets (a prime location), intangible assets
(a strong brand or knowledge) or capabilities (a superefficient manufacturing process)
that firms may use to conceive of and implement their strategies (Barney, 2001). From
this angle, the RBV of the firm suggests that valuable, rare, imperfectly imitable, and
non-substitutable resources can lead to sustainable competitive advantage and superior
performance (Barney, 1991). Such strategically valuable resources have five
characteristics: (1) they are difficult to copy, (2) they depreciate slowly, (3) the
company – not employees, suppliers, or customers – controls their value, (4) they

23
cannot be easily replaced, (5) they are superior to similar resources that competitors
own (Collis & Montgomery, 2008).
Teece, Pisano, and Shuen (1997) introduced the concept of dynamic
capabilities, which is considered an extension of the RBV. Dynamic capabilities can
“continuously create, extend, upgrade, protect, and keep relevant the enterprise’s
unique asset base” in a changing environment (Teece, 2007, p. 1319). They are
particularly relevant in highly turbulent markets (Eisenhardt & Martin, 2000).
Dynamic capabilities are second-level capabilities; they are the capabilities that can be
used to modify other resources and first-level capabilities, thus creating value for
firms. Dynamic capabilities theory is used to explain why some firms can perform
better than others in dynamic environments.
The two perspectives briefly discussed above played an important role in the
development of the field of strategic management, which is usually depicted as a
process. The following section provides a definition of the strategic management
process.
2.2.2 Strategic Management Process
Researchers use the terms strategic management and strategic planning
synonymously. However, the term strategic management is more often used in
academia, whereas the latter is often used in the business world (David, 2011; Elbanna,
2013). Strategic management is a more inclusive concept than strategic planning,
because it includes not only strategic planning, but also the implementation and the
evaluation of strategic plans (Bryson, 2011; Elbanna, 2013).

24
In the current literature, normative models of strategic management have
depicted strategic management as a process that includes three key stages or elements:
strategy formulation, strategy implementation, and strategy evaluation and control
(Preble, 1992).
Strategy formulation, which is also referred to in this study as strategic plan
formulation, refers to establishing the vision, mission, and long-term objectives and
generating and identifying the strategic options to strengthen the competitive position
of the company. It is related to determining an organization’s future direction
(Mintzberg, 1973).
Strategy implementation, which is also referred to as strategic plan
implementation in this study, is concerned primarily with the modification of
organizational structures and processes to ensure that the planned results are obtained
(Galbraith & Kazanjian, 1986; Lorange & Murphy, 1984). It requires the building of
an organization capable of performing a successful strategy, setting budgets,
developing administrative support systems, and building performance reward systems
and an organizational culture model to match the strategy (Elbanna, 2013).
Strategy evaluation and control, which is also referred to as strategic plan
evaluation in this study, aims to highlight and generate solutions to correct deviations
from the outcomes that the implemented strategies are expected to generate. It involves
assessing the overall effects of the implemented strategy on the organization and
evaluating the performance to determine whether plans, strategies, and objectives are
achieved. The feedback from this assessment is used to solve problems or take
corrective actions (Preble, 1992; Schendel & Hofer, 1979).

25
Despite many recent research efforts on the above three elements of strategic
management (Greenley, Hooley, Broderick, & Rudd, 2004; Håkonsson, Burton, Obel,
& Lauridsen, 2012), much of the existing research has been carried out in Western
countries and little research has been empirically conducted on strategic management
in the Arab region (Elbanna & Fadol, 2016).
This study contributes to filling this gap in the literature by investigating the
relationships of the three components of strategic management (i.e., strategy
formulation, strategy implementation and strategy evaluation) to the performance of
semi-government organizations in the United Arab Emirates (UAE) and the impact of
the latter on organizational competitiveness. The following section provides a brief
discussion of the concepts of organizational performance and competitiveness
followed by an in-depth review of the literature on the three components of the
strategic management process.
2.3 Organizational Performance
2.3.1 The Concept of Organizational Performance
In this study, organizational performance, which is hypothesized to influence
organizational competitiveness, is considered from both financial and non-financial
perspectives. The performance concept and organizational effectiveness, and their
importance have been widely recognized by several scholars (Yamin, Gunasekaran, &
Mavondo, 1999). While performance refers to how well an organization achieves its
market-oriented goals and its financial goals (Yamin et al., 1999), competitiveness is
the extent to which an organization is able to create a defensible position over its
competitors (McGinnis & Vallopra, 1999).

26
Previous researchers have discussed both performance and competitiveness
and tried to understand their relationship and how organizational practices influence
them (Li, Ragu-Nathan, Ragu-Nathan, & Rao, 2006; Yamin et al., 1999). This is also
the approach adopted in this study. Below is a brief review of organizational
performance and competitiveness. In particular, the researcher suggests that creating a
defensible position over time depends on a firm’s (financial and non-financial)
performance.
2.3.2 Organizational Performance
Organizational performance has been a pervasive issue in strategy research
(Combs, Crook, & Shook, 2005; Hamann, Schiemann, Bellora, & Guenther, 2013).
While it is beyond the purpose of the present study to provide a comprehensive review
of the studies on organizational performance, two issues that are particularly relevant
to the present study deserve brief coverage: how to measure performance and how to
obtain performance data.
Regarding the former issue, a variety of performance measures exist, which
can be broadly classified as either financial or nonfinancial measures (Phillips &
Moutinho, 2000). Financial measures are the measures that rely on accounting-based
information and are expressed in monetary units. Among the financial measures are
profit, return on investment, asset turnover, return on capital employed (Baker, Black,
& Hart, 1988), and inventory turnover (Frazier & Howell, 1983). Nonfinancial
measures, for their part, refer to the measures that do not rely on accounting-based
information and are not expressed in monetary terms. They may include innovation
(Zuriekat, Salameh, & Alrawashdeh, 2011), employee satisfaction (Zuriekat et al.,

27
2011), customer satisfaction (Vorhies & Morgan, 2005), corporate social
responsibility (Hart & Banbury, 1994), operational efficiency (Child, 1972), market
share, sales growth (Vorhies & Morgan, 2005), market standing (Saunders & Wong,
1985) and quality of products or services provided (Zuriekat et al. (2011, p. 165).
Regarding the latter issue, performance can be measured by objective
measures, which do not rely on the interpretation of the respondents, or subjective
measures, which are affected by the respondents’ perceptions (Ailawadi, Dant, &
Grewal, 2004; Chenhall, Kallunki, & Silvola, 2011). In this study, both financial and
nonfinancial measures are used to capture organizational performance in its different
aspects and to depict it more comprehensively (Jusoh & Parnell, 2008). This approach
has been successfully used in the UAE (Fadol, Barhem, Elbanna, Adcroft, & Bruce,
2015), which is the study setting of the present research.
Financial and nonfinancial performance data are collected from the
respondents subjectively. This study acknowledges that this approach of using
subjective performance measure has its drawbacks. One notable potential problem is
that individuals consistently overestimate the level of performance in the organization
(Hastie & Dawes, 2003; Meier & O’Toole, 2013). This overestimation is not related
to more difficult tasks or the availability of resources. This self-assessment of
performance may also lead to common source bias (Meier & O’Toole, 2013).
Thus, the benefits of using managers’ self-assessments of performance need to
be weighed against the costs (Meier & O’Toole, 2013). One notable benefit of using
perceptual performance measures is that it is easier to collect subjective assessments
because most organizations are reluctant to provide “hard” or objective performance
data (Fiorito & LaForge, 1986). Another benefit of using subjective measures is that it

28
helps to avoid the problems associated with using objective performance data. For
example, there are no objective financial data publicly available in the UAE, making
it necessary to subjectively evaluate performance. Similarly, when the study covers
diverse industries (Miles, Covin, & Heeley, 2000), as is the case in this research,
directly comparing the objective (financial) data of companies will be misleading
(Miles et al., 2000), making it necessary to use perceptual performance measures.
Furthermore, past research showed that objective measures of performance are highly
correlated with subjective measures (Guthrie, 2001; Wall, Michie, Patterson, & Wood,
2004). For example, in the study of Guthrie (2001), the sample of which comprised
senior management respondents from 164 New Zealand companies, subjective
performance (productivity) was operationalized as reported sales per employee and
was calculated from the responses to two questionnaire items asking for the most
recent estimates of annual sales and total number of employees. The directly
corresponding objective financial data (i.e., sales per employee) were obtained for a
sub-sample of 65 companies. The product-moment correlations between the subjective
performance and objective financial data were significantly correlated. The second
study is that described by Wall et al. (2004). The sample comprised 80 U.K.
manufacturing companies employing from 60 to 1,150 employees. Wall et al. (2004)
examined the relationship between the subjective and objective measures of
performance. Subjective performance was operationalized as labour productivity, and
financial performance. The objective performance was measured using financial data
extracted from an EXTEL database. The product-moment correlations between the
two kinds of measure were statistically significant (Wall et al., 2004).
For these reasons and following earlier studies in UAE context (e.g., Elbanna,
2012; Fadol et al., 2015), this study chose subjective financial and nonfinancial

29
performance measures over objective measures and argues that each of the three
elements of the strategic management process (i.e., strategy formulation, strategy
implementation, and strategy evaluation and control) is related to organizational
performance, which in turn is related to organizational competitiveness. The study
further suggests that environmental dynamism moderates the relationship between the
three components of the strategic management process and organizational
performance. The following parts discuss these fundamental suggestions of this study.
2.4 Organizational Competitiveness
The concept of competitiveness can be looked at from three different levels:
country, industry, and firm level (Ajitabh & Momaya, 2004). It also involves different
disciplines or perspectives, such as comparative advantage, the price competitiveness
perspective, the strategy and management perspective, and the historical and
sociocultural perspectives (Waheeduzzaman & Ryans, 1996). This indicates that there
is no universal and exact definition for the concept of competitiveness.
Ruekert, Walker Jr, and Roering (1985, p. 20) offers a view of competitiveness
which is also adopted by the current study, that portrays competitiveness in terms of
the ability of organization to adapt to changes in competitors’ market strategies, to
adapt its products/services to changes in customers’ needs, to react rapidly to threats
in the market, and to explore market opportunities. Rainer and Kazem (1994) propose
that competitiveness can be viewed in terms of its three components: i) customer value
(i.e., the ability to persuade customers to choose one firm’s offerings over alternatives),
ii) shareholder value (i.e., the ability to improve shareholder’s profit potential in
relation to the competitors) and iii) the ability to act and react within the competitive

30
environment, which is affected by the financial strength and the potential of people
and technology to implement the necessary strategic changes. According to Rainer and
Kazem (1994, p. 58), competitiveness can be sustained only if an appropriate balance
is maintained between these factors, which sometimes conflict.
Some researchers use ‘competitiveness’ and ‘competitive capability’
interchangeably (e.g. Tracey, Vonderembse, & Lim, 1999). Some define firm level
competitiveness as the ability of a firm to design, produce and/or market products
superior to those offered by competitors, considering both price and non-price qualities
(D’Cruz & Rugman, 1992). Corbett, Van Wassenhove, and de Constance (1993) also
view competitiveness as a multidimensional concept and suggest that a firm’s
competitiveness has price, place, and product dimensions. Similarly, Buckley, Pass,
and Prescott (1988) suggest the application of a threefold measure of competitiveness,
including competitive performance, competitive potential, and management process.
Adopting the model of Buckley et al. (1988), Man, Lau, and Chan (2002) propose that
competitiveness has four dimensions, namely entrepreneurial competencies,
competitive scope, organizational capabilities, and firm performance. The competitive
scope and organizational capabilities represent the constructs of external
environmental factors and internal firm factors, respectively, and together they make
up the potential dimension of competitiveness. The construct of firm performance
addresses the performance dimension (Man et al., 2002, p. 133). Purba and Diane
(2005) consider variables such as improved efficiency, quality improvement,
productivity improvement and cost savings to investigate competitiveness.
This study argues that organizational performance is different from
organizational competitiveness. Organizational performance is an organizational

31
outcome which can be either financial or nonfinancial However, organizational
competitiveness is a type of organizational ability which allows organizations to adapt
to changes in competitors’ market strategies, to adapt its products/services to changes
in customers’ needs, to react rapidly to threats in the market, and to explore market
opportunities (Ruekert, Walker Jr, and Roering, 1985, p. 20).
Scholars have investigated the factors that can improve organizational
competitiveness. Some authors have viewed competitiveness with the competency
approach (Ajitabh & Momaya, 2004). They suggest that internal factors such as firm
strategy, structure, competencies, capacity to innovate, and other tangible and
intangible resources contribute to firms’ competitive success (Bartlett & Ghoshal,
1989; Hamel, Doz, & Prahalad, 1989; Hamel & Prahalad, 1990). This view is
particularly associated with the resource-based view of competitiveness (Barney,
1991; Barney, 2001; Peteraf, 1993), which suggests that the ability to develop and
renew capabilities far more effectively than competitors can help in achieving
competitiveness.
Past research has used competitiveness as a dependent variable. Tracey et al.
(1999), for example, studied the impact of advanced manufacturing technology and
manufacturing managers’ participation in strategy formulation on a firm’s competitive
capabilities. Their results indicate that there is a positive relationship between
advanced manufacturing technologies and competitiveness and between
manufacturing managers’ participation in strategy formulation and competitiveness.
The results also confirm the notion that firms with high levels of competitiveness
achieve high levels of customer satisfaction and market performance.

32
Similarly, Lu, Shen, and Yam (2008) identify the major factors for a successful
competitive strategy as an explicitly defined competitive strategy, matching strategy
to a company’s situation, and effective strategy implementation. These factors enable
managers to focus on the key aspects when competitive strategies are to be formulated
and implemented in the interests of competitiveness. In addition, Pryor, Anderson,
Toombs, and Humphreys (2007) propose that implementation expertise and capability
are equally important entities for creating and maintaining a sustainable competitive
advantage. Hauc and Kovač (2000) also indicate that prompt and effective strategy
implementation is becoming one of the most important competitive moves. When this
is combined with a correct and quick strategy formulation, better competitiveness is
ensured.
Our review so far has focused on organizational performance and
competitiveness. The following parts will establish the relevance of organizational
performance, first, to the three elements of strategic management process (formulation,
implementation, and evaluation) and then to organizational competitiveness. Further
research is needed about the way in which strategy formulation, implementation and
evaluation influence organizational competitiveness and performance in semi-
government (public) organizations in UAE; this would be timely, because the findings
of such an attempt could help the managers of these organizations make better
decisions and use public (and organizational) resources more effectively.
The following section reviews the literature on the three elements of strategic
management process (i.e., strategy formulation, strategy implementation and strategy
evaluation) as they relate to the hypotheses to be tested in this study.
33
2.5 Strategic Plan Formulation
2.5.1 Concept of Strategic Plan Formulation
Strategy formulation is a dynamic process through which organizations
develop their strategies (Kraus, Harms, & Schwarz, 2006). It provides firms with a
substantial basis for making key decisions, solving problems, improving performance
and ensuring effectiveness.
Researchers use the terms strategy formulation and strategic planning as
synonyms (Poister, Edwards, Pasha, & Edwards, 2013). Strategic planning is not a
new concept. Almost four decades ago, Ackoff (1970) wrote about corporate planning.
Since then, researchers have proposed many definitions of strategic planning, but none
that is commonly accepted and universal definition (Brews & Purohit, 2007).
Goldsmith (1995) views strategic planning as the process of allocating scarce
resources in an environment of competing demands to strengthen an organization’s
financial viability. Bryson (2003) defines it as “a disciplined effort to produce
fundamental decisions and actions that shape and guide what an organization (or other
entity) is, what it does, and why it does it” (p. 6).
Similarly, Hax and Majluf (1990) define strategic planning as the process by
which organizations determine and establish long-term directions and formulate and
implement strategies to accomplish long-term objectives, taking into account relevant
internal and external environmental variables. This definition, which is adopted by the
present research, indicates that the planning process involves a series of organizational
activities that begin with the definition of organizational mission, the development of
strategic objectives and crafting of strategies, and ends with the development of

34
detailed action plans to ensure that the strategies are implemented to achieve
organizational objectives while taking organizational environment into consideration.
In this process, organizations need to clarify competitive threats and opportunities
(Song, Im, Bij, & Song, 2011) and evaluate organizational strengths and weaknesses.
2.5.2 Process and Content of Strategic Plan Formulation
Strategy formulation can be understood from two perspectives. The first
perspective gives prominence to the “process” of strategy formulation or strategic
planning, which is concerned with “how” a strategic plan is developed, whereas the
second perspective notes rather the “content” of strategy formulation, which is
concerned with “what” the strategic plan contains (Elbanna, 2006). These two
perspectives are discussed below, with less emphasis on the latter, as beyond the scope
of this study.
2.5.2.1 Strategy Process
Strategy process refers to how certain elements crucial for an organization’s
sustenance are identified and established. These elements include organizational
mission, stakeholders’ needs, organizational mandates and strengths, and the
weaknesses, threats and opportunities found in the organizational environment. Other
key elements of strategic planning process are strategic agendas, action plans and the
assessment of proposed strategies (Poister & Streib, 2005).
Several factors have been argued to have important roles in strategic planning
process. Elbanna (2013), for example, argues that the attitudes of managers to strategic
planning, and the expertise of people involved in the planning process and use of

35
strategic advisors are important determinants of the effectiveness of strategic planning.
He finds in his study of 67 public organizations in the UAE that the former two factors
explained 41 percent of variation in the perceived strategic planning outcome.
Researchers also discuss the role of intuition in the strategic decision-making
(i.e., strategy formulation) process (Elbanna, Child, & Dayan, 2013; Glöckner &
Witteman, 2010). Elbanna et al. (2013) define intuition as “a mental process based on
a ‘gut feeling,’ as opposed to explicit, systematic analysis, which yields an intuitive
insight or judgment that is used as a basis for decision making.” (p. 150). Miller and
Ireland (2005) claim that intuition is an effective approach to strategic decision-
making, because managers usually do not have complete, accurate and timely
information when making strategy decisions. In a study of Egyptian manufacturing
firms, Elbanna et al. (2013) find that the strategic decision-making process will rely
more on intuition when it is motivated by an opportunity.
Other researchers examined strategy formulation in terms of the participation
(involvement) of organizational members in the formulation process (Lavarda, Canet-
Giner, & Peris-Bonet, 2010; Pappas & Wooldridge, 2007). Due to the growing
dynamism of the environment, organizational strategy formation has evolved from a
top-down process to a more bottom-up one or towards a middle-up-down perspective
(Lavarda et al., 2010). In the top-down decision-making model, top managers make
the decision. The emphasis is put on explicit knowledge (the standards and rules that
define the tasks) (Nonaka, 1994). Conversely, in the bottom-up decision-making
model, employees act as entrepreneurs and leaders who create or sponsor various
projects and information. Recently, researchers have recommended a strategy
formation process that is able to combine the two extreme models and suggested that

36
employees at all levels can help in the process of forming strategies (Pappas &
Wooldridge, 2007). Thus, a middle-up-down decision-making model is proposed. In
this model, management is composed of middle managers acting as coordinators and
facilitators of the process and catalysts encouraging the creation of organizational
knowledge, focusing on both explicit and tacit knowledge (experience) (Lavarda et al.,
2010). Middle management is the key level where the success of a middle-up-down
strategy formation process lies. Middle managers contribute to the strategy process
and they use brokerage relations to diffuse information across the various hierarchical
levels of organizational managers (Shi, Markoczy, & Dess, 2009). They have the
necessary abilities to participate in the decision-making processes and, as a result, they
are more involved in the strategic process. They are even able to change organization
directions by interposing their practical organizational perspectives (Lavarda et al.,
2010).
Other researchers have pointed to the importance of having a systematic
approach for developing strategic plans. More specifically, during the formulation of
strategic plans, a solution-based logical approach can transform the thinking process
if three fundamental steps are taken (Bryson, Crosby, & Bryson, 2009). The first step
involves defining potential solutions from various stakeholders while the second step
involves evaluating potential solutions through debate and scientific methods. The
final step is to select the best solution, either by negotiation or by compromise (Bryson
et al., 2009). Interaction among the strategy formulators or participants during these
three steps ultimately formulates an idea that is termed a “strategy”.
Still other researchers argue that the degree to which participants are leveraged
in decision-making, referred to as its ‘formality’, also plays an important role in

37
strategy formulation (Pearce & Robinson, 2008). While the ‘interaction’ is about the
involvement of the participants in strategy formulation, ‘formality’ is about the
conflict-resolution capacity and goal-orientation of the participants. The formality of
strategic planning or formal strategic planning process refers to a formal process that
focuses on defining, determining and implementing the specific objectives or strategic
initiatives of the firm (Armstrong, 1982; Jarzabkowski & Balogun, 2009). It calls for
an explicit procedure to determine specific, long-range objectives, generate alternative
strategies, strict implementation and a system for monitoring results (Elbanna,
Andrews& Pollanen, 2016).
Researchers provide a better understanding of the formality of planning
process through describing strategic ends (i.e., objectives set forth in a formal strategic
plan) and means (i.e., implementation plans set forth in a formal strategic plan) (Song
et al., 2011). Organizations with very specific ends will be aware of many precisely
quantified, formally documented, time-limited ends, ranging from a statement of firm
mission to statements of specific market share (Brews & Hunt, 1999). Very specific
means will be reflected in exact plans and/or programs for implementation, which
describe in detail the actions and steps required for implementation and are formally
documented and distributed within the firm (Dibrell, Craig, & Neubaum, 2014).
A carefully designed, formal strategic plan provides details and tactics that
ensure the successful implementation of the strategy, which in turn enhances firm
performance (Cooper & Kleinschmidt, 1986; Eisenhardt, 1989). In addition, formal
strategic planning significantly enhances the quality, speed, and productivity of new
product development (Clark & Fujimoto, 1991; Song et al., 2011).

38
However, many researchers criticize formal strategic planning for being rigid.
Mintzberg (2000), for example, suggests that the assumptions of formal strategic
planning, which are the superiority of formulation, separation of thought from action,
quantitative analysis, and environmental forecasts, can lead to stagnant and useless
strategies (Mintzberg, 2000). Mintzberg (2000) further argues that “the rationality
assumed in strategic planning can be irrational when judged against the needs of
strategy making” (Mintzberg, 2000, p. 221) and suggests that strategy formulation
needs creativity, tacit knowledge, hands-on learning, pattern recognition, and,
occasionally, radical departures from previous forms (Mintzberg, 1987).
Consequently, more natural processes, such as intuition and adaptive learning, are just
as or more successful at developing strategies (Mintzberg, 2000).
These shortcomings of formal planning are also recognized by other
researchers. For example, Dibrell et al. (2014) argue that the formal strategic planning
process creates some inflexibility and rigidness, thus making it hard to adapt to
changes in the external environment, in particular when managers become strictly
bound by their strategic plans (Mintzberg, 2000). Therefore, business leaders are
increasingly urging firms to alter their strategic plans to match the changing external
environment (Grant, 2003; Wiltbank, Dew, Read, & Sarasvathy, 2006). Additionally,
in the study of Honig and Karlsson (2004), formal strategic planning is found to be
negatively related to financial performance. The authors argue that writing formal
business plans to conform to institutionalized rules and to mimic the behavior of others
does not positively contribute to performance (Honig & Karlsson, 2004).
These and similar arguments raising the shortcomings of formality in planning
are discussed through distinguishing deliberate and emergent strategic planning.

39
Mintzberg, Ahlstrand, and Lampel (1998) distinguish strategies as either deliberate or
emergent. Deliberate strategies which suggest high levels of formality are defined as
“intentions rebased” from strategies that are formulated in advance, whereas an
emergent approach produces evolving strategic patterns “despite or in the absence of
intentions” (Mintzberg & Waters, 1985, p. 161). While some researchers advocate a
formal, systematic, rational, strategic planning process, others support an emergent
process (Mintzberg & Waters, 1985). Stonehouse and Pemberton (2002), for example,
argue that heavily structured planning (formal planning) is clearly inappropriate in
times of rapid and turbulent change, while an emergent approach allows firms to be
flexible when taking advantage of new opportunities in a changing environment
(Goold & Quinn, 1990).
An emergent approach (Mintzberg, 2003), which is better suited to a dynamic
and hyper-competitive environment, does not imply a complete absence of strategic
planning. Mintzberg (2003) suggests that strategy is a combination of deliberate plans
and emergent adjustments over time. Similarly, other researchers suggest that the
debate between deliberate and emergent strategic planning approaches has been based
upon a misconception of the way in which strategic planning works in practice. Grant
(2003) finds that the strategic planning systems of the international oil majors could
be described as processes of planned emergence. The primary direction of planning is
bottom-up and lets business managers wield substantial autonomy and flexibility in
strategy making. At the same time, the structure of the planning systems allows
corporate management to establish constraints and guidelines in the form of vision and
mission statements. Bodwell and Chermack (2010) suggest that organizations should
integrate deliberate and emergent strategy. Harrington, Lemak, Reed, and Kendall
(2004) argue that strategic planning should be treated as a continuum in order to better

40
tap into the idea that both approaches can be present in the organization. Andersen and
Kragh (2012) confirm that the two strategy making modes are complementary
elements of the strategy formation process and enhance organizational performance in
particular for organizations with highly active international business operations against
the turbulence of global markets.
Apart from the deliberate vs. emergent nature of strategic plans, strategic
planning tools have also been a topic of research on strategy processes. Research
suggests that various tools, such as a SWOT analysis, PESTEL analysis, stakeholder
analysis, balanced scorecard, etc. can be used in to develop strategic plans (e.g., to
formulate strategies) (Elbanna, 2013). Researchers have investigated the use of
strategic planning tools and techniques in different countries. For example, Ghamdi
(2005) studied Saudi Arabian organizations and found the mostly frequently used tool
is an analysis of critical success factors. Aldehayyat and Anchor (2008) investigate the
use of strategic planning tools and techniques in Jordanian companies. They find that
the most often used techniques by Jordanian companies are financial analysis (of their
own businesses), PEST or STEP analysis, Porter’s five-forces analysis and the analysis
of key success factors. Elbanna (2013) finds that other factors, such as the need to
improve organizational performance, not the ease of use of the planning tools,
determine the extent to which the planning tools are employed. Researchers also aimed
to identify strategy formulation tools that are associated with enhanced performance.
For example, the use of the balanced scorecard (Kaplan, 2001; Norton & Kaplan,
1992) has been argued to lead to better results (Cooper & Ezzamel, 2013) and to
positively affect overall performance (Braam & Nijssen, 2004; Hoque & James, 2000).

41
Intensity is also an important part of strategic planning. Firms which make
strategic plans with intensity can better understand their environment, which in turn
results in improved organizational performance (Miller, Burke, & Glick, 1998).
Intensity is also considered to positively influence performance (Chavunduka,
Chimunhu, & Sifile, 2015).
To sum up, as a result of the arguments pointing to the shortcomings of the
rigid formalization of formal strategic planning, strategic planning in practice has
become over time less rigid and to include enough flexibility to still allow firms to
have detailed plans. This has meant, for example, less emphasis on fully-elaborated
processes and systems that will allow strategic plans to be adapted to a changing
environment, and more focus on the use of multiple and complementary analytical
tools that allow firms to generate as much information as possible (i.e., to engage in
intensive strategic planning), and involve managers from different hierarchical levels
in the organization, including line managers, together with more attention to the
organizational culture that will increase the chance of implementation (Bonn &
Christodoulou, 1996). The present study focuses on asking whether two particular
aspects of strategy process (i.e., engaging in strategic planning practice, which is
captured by the use of planning tools, and the extent or intensity of the strategic
planning) influence firm strategy.
2.5.2.2 Strategy Content
Given the complexities faced by organizations, strategy process should also be
understood from a ‘content’ point of view (Andrews, Boyne, Law, & Walker, 2011).
Identifying the appropriate content for a strategy is necessary, since it equips

42
organizations to formulate the right strategy and enables them to give their optimal
performance (Boyne & Walker, 2004). Therefore, the content approach aims to
identify what is, or what should be, the strategy leading to optimal organizational
performance. This involves describing the effective competitive positioning of the
organization and access to resources within the organization’s environment (Chapman,
2005). Strategy is seen to follow a logical, linear process of strategy formulation,
implementation and control. Strategy content research provides snapshots of ideal
strategies, or optimal combinations of strategies for organizations in different settings.
Strategic change is typically categorized as being either radical or incremental
(Chapman, 2005).
Strategy content is the outcome of a strategy process and refers to a pattern of
action through which organizations aim at their desired goals, modify current
circumstances and realize latent opportunities (Boyne & Walker, 2004). It can be
explained on the basis of strategic actions and strategic stance. Strategic actions refer
to the specific actions that drive and materialize the strategic stance. The strategic
actions that organizations may use to operationalize their stance concern actual
changes in markets, services, revenues, and external and internal structure (Boyne &
Walker, 2004). Some researchers discuss the benefits of undertaking strategic actions.
For example, Bensebaa (2004) examines, for the period of 1999-2002, the strategic
actions of Lastminute.com and Ebookers.com and finds that these companies build up
their reputations by achieving a balance between the three types of action (i.e.,
symbolical, competitive and relational actions) and the frequency of their use. The
result suggests that there is a system linking the properties of these strategic actions to
the firm’s reputation.

43
Strategic stance, however, refers to the organization’s position and the way in
which it interacts with its environment (Boyne & Walker, 2004). The position may be
that of a prospector, defender or reactor (Miles, Snow, Meyer, & Coleman, 1978). In
the prospector stance, organizations seek to expand budgets and pioneer the
development of new products and services. In the defender stance, organizations take
a conservative view of new product development. Last, in the reactor stance,
organizations perceive frequent change and uncertainty in their organizational
environment (Andrews et al., 2011).
The study of Andrews, Boyne, and Walker (2006) presents an empirical test of
the proposition that strategy content is a key determinant of organizational
performance in the public sector. The authors conceptualize strategy content in terms
of these two dimensions: strategic stance (the extent to which an organization is a
prospector, defender, or reactor) and strategic actions (the relative emphasis on
changes in markets, services, revenues, external relationships, and internal
characteristics). The results from a survey of 119 English local authorities show that
organizational performance is positively associated with a prospector stance and
negatively with a reactor stance, suggesting that strategy content matters (Andrews et
al., 2006).
The two perspectives (i.e., the process and content perspectives) on strategy
formulation together suggest that the type of business strategy, interaction between
key decision makers/managers, expertise in strategic planning and strategic planning
tools, among other variables, facilitate the formulation of a strategic plan (Aldehayyat
& Anchor, 2008).

44
This research uses variables related to strategy formulation from the process
perspective. More specifically, it uses the following variables: the practice of strategic
planning (use of strategic planning tools) and the strategic planning intensity. Below
is a review of these two dimensions of strategy formulation.
2.5.3 Dimensions of Strategic Plan Formulation
2.5.3.1 Practice of Strategic Planning
Managers use a variety of tools and techniques to identify and deal with
strategic decisions (Ramanujam et al., 1986). For example, Webster (1992) presents a
set of 30 strategic planning tools and techniques. Lisiński and Šaruckij (2006) have
classified 28 tools of strategic planning. However, not all these tools and techniques
are commonly used. For example, Ghamdi (2005) finds that only 10% of the Saudi
Arabian organizations surveyed were using tools and techniques regularly. The most
regularly used tool was the analysis of critical success factors, followed by
benchmarking, and then what-if analysis, while SWOT analysis, product life cycle,
and stakeholder analysis were used only moderately. Gunn and Williams (2007) found
in a recent study of organizations in the UK that three tools – SWOT, bench marking,
and critical success factor analysis – were used more extensively than any other.
Aldehayyat and Anchor (2008) suggest that the tools and techniques most
commonly identified in the literature are: SWOT analysis, Porter’s five-forces
analysis, value chain analysis, portfolio analysis (e.g. BCG: growth share), PEST
analysis, etc. In Elbanna’s (2010) study, the three most used strategic planning tools
are pro forma financial statements, cost-benefit analyses, and SWOT analyses. The
high use of pro forma financial statements and cost-benefit analysis may be due to the

45
widespread availability of the accounting and financial skills required to prepare these
tools. The high use of these two tools may be a sign of short-term business planning
rather than strategic planning (Elbanna, 2010).
Glaister and Falshaw (1999) suggest that the availability of the planning tools
and the level of skills required to use them affect the type of tool/technique used in
strategy analysis. Interestingly, Elbanna (2010) suggests that the ease of use and
resources needed are not the main determinant of the amount of use of strategic
planning tools. He also suggests that people working in the UAE are less reluctant to
apply the tools of strategic planning.
Strategic planning tools and techniques provide many benefits to the strategy
process. For example, they allow managers to change valuable data into forms suitable
for decision-making and action (Fleisher & Bensoussan, 2003). By using these tools
and techniques, managers are able to reduce the risk involved in making certain
decisions, establish priorities in large complex companies, and easily evaluate the
relative importance of different business portfolios. These tools and techniques are a
valuable communication device, which managers can use to present complex issues
(Frost, 2003).
On the basis of the current literature, this study examines whether using the
following most commonly used tools to develop strategic plans in the UAE context
(Elbanna, 2013) will have positive influence on firm performance: pro forma financial
statements (e.g., cash flow, income statement and budget), cost- benefit analysis,
benchmarking, gap analysis, balanced scorecard, value chain analysis, spreadsheet
“what if analysis”, SWOT analysis, PEST (Political, Economic, Social and

46
Technological) analysis, portfolio analysis (e.g., Boston Consulting matrix or General
Electric matrix) and Porter’s five forces analysis.
2.5.3.2 Planning Intensity
Planning intensity describes the amount of effort made in the process of
planning. It is operationalized by the amount of information generated and the intensity
of analysing and evaluating the information (Schäffer & Willauer, 2003).
Previous studies used different concepts to refer to the intensity of strategic
planning. Whereas a few studies explicitly contain the actual term “intensity of
strategic planning” (Schäffer & Willauer, 2003), some researchers employ other terms,
such as “comprehensiveness of strategic planning” and “extensiveness of strategic
planning” to denote the intensity of strategic planning (Falshaw, Glaister, & Tatoglu,
2006). Comprehensive decisions are also likely to involve relatively complete
information and knowledge of environmental opportunities and threats before making
decisions (Elbanna, 2012). The comprehensiveness of the plan content reflects the
scope of coverage of different program and situational factors (Slotegraaf & Dickson,
2004). Firms with a comprehensive approach to strategic planning are likely to
generate numerous alternatives for competitive advantage (Menon, Bharadwaj,
Adidam, & Edison, 1999), to evaluate various alternatives and to discard those
perceived as less valuable to the firm (Slotegraaf & Dickson, 2004).
Researchers also discuss the factors that influence the intensity with which
managers engage in strategic planning. Akinyele and Fasogbon (2010) have conducted
a study based on data collected from First Bank of Nigeria. The results of their study
indicate that strategic planning intensity is determined by managerial factors (e.g.,

47
strategic planning expertise and beliefs about planning-performance relationships),
environmental factors (e.g., complexity and change) and organizational factors (e.g.,
size and structural complexity). These relationships have also been suggested in
several other studies (Robinson & Pearce, 1983; Robinson, Pearce, Vozikis, &
Mescon, 1984).
Research shows many beneficial outcomes of intensity for decision success
(Elbanna & Child, 2007), and organizational performance (Fredrickson & Mitchell,
1984; Miller et al., 1998). For example, Miller et al. (1998) claim that firms with
strategic planning intensity can better understand their environment, which in turn
results in improved organizational performance. With higher intensity, managers
become more capable of and effective in judging the environment’s potential effect on
their organization, thereby ensuring effective decision making (Sniezek, 1992).
Similarly, Schäffer and Willauer (2003) suggest that intensity of planning is a credible
sign of the importance of the planning in a company because it can increase managers’
attention to strategic planning and increase the probability that the planning contexts
and the fundamental business model will be understood and internalized. Thus, the
intensity of strategic planning has a positive impact on learning in strategic planning.
Some studies indicate that strategic planning intensity is positively related to
organizational performance. For example, Hopkins and Hopkins (1997) use data from
112 banks to investigate the relationship between strategic planning intensity and
financial performance. They find that the intensity with which banks engage in the
strategic planning process has a direct, positive effect on banks’ financial performance,
and mediates the effects of managerial and organizational factors on banks’
performance. The results also indicate a reciprocal relationship between strategic

48
planning intensity and performance. That is, strategic planning intensity causes better
performance and better performance, in turn, causes greater strategic planning
intensity. In addition, Chavunduka et al. (2015) use a case study to investigate the
relationship between strategic planning intensity and performance amongst mining
firms. The results suggest that strategic planning intensity positively influences
organizational performance. The authors maintain that efforts and commitment by
managerial employees to a firm’s strategic planning process are necessary managerial
ingredients to enhance the coherence and effectiveness of strategy and they are more
likely to positively influence firm performance. Salmela, Lederer, and Reponen (2000)
also suggest that in a turbulent environment, intensive (comprehensive) planning may
be more successful than incremental planning.
2.5.4 Strategic Plan Formulation and Organizational Performance
Although there are many studies that seek to elucidate the relationship between
strategic planning or strategy formulation and organizational performance, the results
of this body of research are fragmented and no consensus has yet emerged (Falshaw
et al., 2006). Previous research provides support for all possible relationships: a
positive relationship (Andrews et al., 2011; Sarason & Tegarden, 2003); a negative
relationship (Fredrickson & Mitchell, 1984); no relationship (Robinson & Pearce,
1983); and complex relationship (Fredrickson & Mitchell, 1984; Poister et al., 2013).
However, it is usually accepted that the practice of strategic planning is beneficial for
organizations (Sarason & Tegarden, 2003); and that, over time, the use of strategic
tools (strategic planning) will enhance firm performance (Elbanna, 2008).

49
Poister et al. (2013) argue that goal-setting theory can be used to explain the
linkage between strategic plan formulation and performance. Employees’ behavior
reflects conscious goals and intentions. Employees’ efforts and; thus, performance will
be influenced by the goals assigned to them (Fried & Slowik, 2004). Thus, strategy
formulation may possibly drive firm performance, since by developing clear strategic
plans, firms divert the energy and attention of their employees away from goal-
irrelevant activities toward goal-relevant efforts, leading to superior performance.
Similarly, Pindur (1992) suggests that strategy formulation serves to generate action
on high-priority items by taking managers’ attention away from day-to-day operations
and forcing them to focus on the critical issues that firms are facing.
In addition, Niven (2005) asserts that one of the principal benefits of strategic
planning is enhanced organizational performance, because a strategic focus ensures
that the entire organization is focused on its overall goals. Similarly, strategic planning
can enhance co-ordination, such as bringing together all the business unit strategies
within an overall corporate strategy (Koufopoulos & Moorgan, 1994). Through
formulating strategic plans, firms can identify and exploit future marketing
opportunities, enhance internal communication, and improve firm performance
(Aldehayyat & Anchor, 2008; Koufopoulos & Moorgan, 1994).
On similar lines, Poister (2010) establishes a clear relationship between
strategic planning and organizational performance, claiming that organizations can
achieve greater advantage if strategy better responds to the performance management
process. Since multi-functionality is a current characteristic of many public and private
organizations, strategic planning can ensure the effective functioning of the various
departments and programs (Poister, 2010).

50
The above arguments suggest that strategy formulation positively affects
organizational performance. The present author further suggests that, for this positive
effect to occur, the two aspects of the formulation process reviewed earlier (i.e.,
intensity of strategy formulation practices and use of strategic planning tools), which
represent both the process and content perspectives of strategy formulation, should be
positively related to organizational performance. More specifically, it is argued that
intensity and the use of planning tools are positively related to organizational
performance. This argument is consistent with various findings. For example,
Hopkins and Hopkins (1997) find that the intensity with which banks engage in the
strategic planning process has a direct, positive effect on banks’ financial performance.
Similarly, Chavunduka et al. (2015) found strategic planning intensity amongst mining
firms positively influences firm performance. Baker and Leidecker (2001) report that
there is a close relationship in the California tomato processing industry between the
use of strategic planning tools and firms’ Return On Assets. In particular, three specific
strategic management tools (a mission statement, long-term goals, and ongoing
evaluation) are found to have a strong positive correlation with firm profitability.
Similarly, in the UAE and another Arab country, strategic planning practice, measured
by the use of strategic tools, is concluded to enhance strategic planning effectiveness
(Elbanna, 2008).
Based on the above discussions and the literature review presented in Part
2.5.3.1 and Part 2.5.3.2, the following hypotheses are proposed:
H1: Practice of strategic planning (the use of strategic planning tools) is
positively related to organizational performance.

51
H2: Intensity of strategic planning is positively related to organizational
performance.
2.6 Strategic Plan Implementation
2.6.1 Concept of Strategic Plan Implementation
While strategy formulation is an intellectual activity, strategy implementation
is an administrative activity (Ackerman, Rosenblum, & Uyterhoeven, 1977) and
consists of decisions taken by the executors to bring about the strategic goals and
objectives formulated during the planning process. It concerns the gap between
formulation and performance and is therefore important for the development of
organizations (Elbanna, 2013).
Some researchers argue that strategy implementation, rather than strategy
formulation, is the key to superior organizational performance (Safdari Ranjbar,
Akbarpour Shirazi, & Lashkar Blooki, 2014). However, others have acknowledged the
interactive nature of strategy formulation and strategy implementation (Andrews,
1971) and argue that successful strategy formulation leads to the development of
appropriate structures and systems and to a suitable allocation of resources to ensure
successful implementation. The outcome of strategy formulation is of little use if this
process does not take into account the resources required to implement the formulated
strategies (Dess, 1987). Thus, successful executives should pay enough attention to
both strategy formulation and strategy execution.
Researchers have defined strategy implementation from different perspectives.
Some researchers view implementation as an act of control and monitoring (Hrebiniak

52
& Joyce, 1984). This treatment of implementation as synonymous with control is a
common perspective in many business strategy texts. Other researchers focus on the
processes involved and define strategy implementation as the communication,
interpretation, adoption, and enactment of strategic plans (Crittenden & Crittenden,
2008; Noble & Mokwa, 1999). Still others consider implementation to be synonymous
with the execution of the strategic plan (Floyd & Wooldridge, 1992). For example,
Kotler and Turner (1979) define implementation as the process that turns plans into
action assignments and ensures that such assignments are executed in a manner that
accomplishes the plan’s stated objectives. Similarly, strategy implementation is
viewed as the “activities and actions required for executing plans” (Elbanna, 2013, p.
433). It measures how far the processes of implementing the strategic plan in
organizations address all the major activities that are required to put the strategic plan
into action (Elbanna, 2013).
In the present study, the researcher argues that the “control and monitoring”
aspect of strategic management should be at the strategy evaluation stage, while
strategy implementation is more about implementing initiatives and changes across an
organization and aligning all aspects of organizations to the given strategies. Thus, this
study adopts Elbanna’s (2013) definition of implementation, given above.
Past research shows that implementation is a more difficult stage than the other
two stages of strategic management (i.e., formulation and evaluation). For example,
implementing a planned marketing strategy is widely seen as a problematic managerial
task that consumes substantial resources of time and effort but often ends in failure
(Thorpe & Morgan, 2007). In the same vein, there is much research work suggesting
that firms face many obstacles in implementing strategies (Andrew Lihalo K, 2014;

53
Canhada & Rese, 2011; Nazemi, Asadi, & Asadi, 2015). Based on qualitative data
collected from the Mashhad electric energy distribution company in Iran, Nazemi et
al. (2015) find eight distinct groups of barriers, namely, cultural, structural,
managerial, environmental, human resource management, and lack of effective
performance measures, insufficient resources and inadequate strategy formulation.
Similarly, Canhada and Rese (2011) discuss various barriers to strategy using
models that are inconsistent with the organization’s experience. Schaap (2012), for
example, using the Northern Nevada plumbing industry as his sample, finds that
strategic consensus plays an important role in the strategy implementation process.
The author’s findings also indicate that frequent communication up and down the
organizational structure enhances strategic consensus through the fostering of shared
attitudes and values. Senior-level leaders who have been trained in strategic planning
and implementation are more likely to meet the performance targets than are those
without training in the field. Based on the results, the study concludes that, in order to
achieve outstanding performance, strategy implementation plans must be clearly
developed with clear time frames, allocating specific responsibilities to individuals and
identifying the people accountable for task completion.
Jacques (2006) also identifies that major problems in the implementation of
medical and care protocols are the lack of senior management involvement and
participation in the process. Heide, Grønhaug, and Johannessen (2002) conduct a case
study on a Norwegian ferry-cruise company to identify the barriers to strategy
implementation. This study reports 174 barriers grouped in these seven categories:
communication barriers; organizational structure barriers; learning barriers; personnel
management barriers; cultural barriers; political barriers; and resource barriers. Čater

54
and Pučko (2010) collected data from 172 Slovenian companies and reveal that greater
obstacles to strategy execution, such as inadequate leadership skills and employees’
reluctance to share their knowledge have a negative influence on firm performance.
Several factors have been argued to influence the successful implementation
of strategies. For example, Yang (2010) outlines the elements that influence strategy
implementation. These elements include relationships between different departments
and units and the executors who implement the strategic plan across different strategic
levels. The other elements that influence successful strategy implementation include
consensus, commitment, organizational structure, communication and the degree of
interactivity at cross-organizational levels of implementation tactics models and
approaches (Andrews et al., 2011).
Still other elements that affect implementation quality, a proxy for successful
implementation, are trust, participation, past performance, implementation speed and
uncertainty (Elbanna, Thanos, & Colak, 2014). Elbanna et al. (2014) argue that the
outcomes of decision implementation cannot be modeled in terms of a single
perspective. The quality of implementation is shaped by the simultaneous effects of
different elements; thus, managers implementing strategic decisions should pay
attention to a number of issues. The results of Elbanna’s (2014) study suggest that the
quality of decision implementation is positively related to trust, participation and past
performance, and negatively to implementation speed and uncertainty.
Similarly, Koseoglu, Barca, and Karayormuk (2009) identify compensation
practices as an important influence on the success of strategy implementation. The
findings from a case-study of Miller (1997) highlight that four factors appear to be
critical for the successful management of implementation: backing (the degree to

55
which influence patterns favor implementation), assessability (the degree to which the
success of implementation can be evaluated with precision), specificity (clear aims and
planning) and a conducive culture. Factors such as having relevant experience, giving
implementation priority, having abundant resources, an appropriate structure and
implementing flexibly, appear to matter rather less.
Additionally, Crittenden and Crittenden (2008) set out to understand what
actually constitutes strategy implementation. They propose that critical structural
levels and managerial skills levers are necessary for successful strategy
implementation. These levers allow firms to identify strong and weak points that could
impact on the implementation process. The structural levels are (1) Actions by whom,
on what, and when of cross-functional integration and company collaboration; (2)
Programs instilling organizational learning and continuous improvement practices; (3)
Systems installing strategic support systems; and (4) Policies establishing strategy
supportive policies. The managerial skills levers are (1) Interacting in the exercise of
strategic leadership; (2) Allocating understanding: when and where to allocate
resources; (3) Monitoring: tying rewards to achievement; and (4) Organizing the
strategic shaping of corporate culture. The eight levers of implementation identified
by Crittenden and Crittenden (2008) provide organizations with an evaluative
opportunity to determine which levers are working well, and which levers need to be
improved.
As indicated above, some current studies also stress the importance of strategy
formulation for strategy implementation. Strategy formulation is critical to all
organizations; 66% of organizational strategies, however, are never implemented
(Johnson, 2004). This suggests that the problem lies somewhere in the middle of the

56
strategy-performance gap, a more likely source being a gap in the formulation-to-
implementation process. If insufficient time and effort are used on executing strategy,
or if time and effort are put into inappropriate execution actions, organizational
performance invariably suffers (Higgins, 2005).
Studies suggest that firms that excel at implementing strategy have
significantly higher firm performance (White, Conant, & Echambadi, 2003). White et
al. (2003) conducted research on data collected from 710 marketing managers in the
game, toy, and children’s vehicle manufacturing industry in the United States. They
found that firms with superior implementation capability realize significantly greater
firm performance. Since the behaviors of both targeted segments and the market as a
whole are constantly changing and market opportunities arise as a result of the changes
(Dickson, 1992), firms with the ability to implement, control and evaluate their
marketing programs can capitalize on these opportunities by segmenting and providing
differentiated offerings to targeted market segments, producing goods or services at
lower relative costs and delivering superior customer value (Day & Wensley, 1988).
Therefore, firms that implement their marketing strategy successfully can give greater
performance because they are more likely to benefit from market opportunities (White
et al., 2003).
Morgan, Katsikeas, and Vorhies (2011) empirically examine the performance
consequences of the effectiveness of export marketing strategy implementation in the
context of manufacturing firms in the U.K. They find that the effectiveness of external
marketing strategy implementation is positively associated with both export venture
market performance and financial performance. The authors argue that in practice
managers often allocate significantly more time and attention to formulating strategic

57
decisions than to planning and following through on their implementation (Morgan et
al., 2011; Rosier, Morgan, & Cadogan, 2010). The study of Morgan et al. (2011)
provides a calibration of the performance benefits of the effective execution of planned
export marketing strategies. Effectively implementing export marketing strategy to
drive venture performance requires the intended export marketing strategy decisions
to be realized (Morgan et al., 2011).
Although it is widely perceived as a significant determinant of all performance,
most research on strategy implementation has been carried out in the private sector
(Andrews et al., 2011; Elbanna, 2013). This study examines the relationship between
strategy implementation and organizational performance in the semi-government
sector from the perspective of two aspects of strategy implementation; namely, the
comprehensiveness of strategic plan implementation and the alignment of strategic
plan implementation, as suggested by some researchers (Fadol et al., 2015; Higgins,
2005). The following section covers these two aspects of strategy implementation.
2.6.1.1 Comprehensiveness of Strategic Plan Implementation
Unlike many studies on the comprehensiveness of strategy formulation,
relatively few studies have discussed the comprehensiveness of strategy
implementation. Such comprehensiveness, which has been extensively examined, has
been defined in several ways. It is viewed, for example, as the extent to which an
organization attempts to be exhaustive or inclusive in making and integrating strategic
decisions (Grover & Segars, 2005) or as the extent to which an upper executive group
uses an extensive decision process when dealing with immediate opportunities and
threats (Fredrickson & Mitchell, 1984; Miller, 2008) or the extent to which an

58
organization’s key decision makers have a tendency to use an extensive process for
decision-making, which includes a high level of investigation to develop alternative
courses of action and multiple criteria to filter these alternatives (Elbanna & Child,
2007; Forbes, 2005; Hakimpoor, 2014). For the purpose of this study, the
comprehensiveness of strategy implementation, which is a less researched concept, is
defined as ‘the extent to which an organization attempts to be exhaustive or inclusive
in implementing its strategic plan by carrying out all the activities and taking all the
actions required for its effective execution’ (Elbanna & Fadol, 2016, p. 1).
The most recent study in the UAE on this topic (Elbanna & Fadol, 2016) finds
that implementation comprehensiveness is affected by the strategy formulation process
and confirms the positive effect of comprehensiveness on organizational outcomes.
More specifically, the authors analysed the implementation comprehensiveness of a
sample of federal and local organizations in Abu Dhabi and Dubai so as to show
whether the implementation process in these organizations addressed all the major
activities that were required to put their strategic plans into action. The study
concluded that three factors of strategy formulation; namely, the adoption of an
intended mode of strategy, enhancing employees’ participation and minimizing
political behavior during strategy formulation, significantly influenced the
comprehensiveness of strategy implementation, which in turn had a significant
positive effect on the effectiveness of the strategic planning.
Other studies have identified further antecedents of comprehensiveness. For
example, drawing on contingency and institutional theories, Atuahene-Gima and
Murray (2004) propose that output and process rewards, task conflict, and project
members' intra- and extra-industry relationships are the antecedents of strategy

59
comprehensiveness. Output reward refers to “a process of monitoring and
compensating project members for achieving the desired performance target” (p. 34).
It provides incentives for getting the desired result. Process reward is a process of
monitoring and compensating project members for completing specified procedures
and activities. The key objective of process reward is to ensure that the planned
procedures are followed by project members. Task conflict is the disagreement among
project members about the content, goals and processes of strategy development and
implementation.
The above arguments suggest that comprehensiveness matters for
organizational performance and affects it directly or indirectly. This research suggests
the former type of relationship and empirically tests it.
2.6.1.2 Alignment of Strategic Plan Implementation
In order to effectively implement strategies, organizations need to align key
organizational factors with strategy. The notion of strategic alignment originates from
the organization literature whose fundamental proposition is that organizational
performance is the consequence of fit between two or more factors such as strategy,
structure, technology, culture, and environment (Bergeron, Raymond, & Rivard,
2004). In Higgins’s (2005) study, alignment is the fit between different strategies and
different kinds of structure, system, style, staffing, resources, and the shared values to
make them work. The fundamental view of fit propounded by strategic management
researchers and organization theorists is that it involves a search to align the
organization with its environment and arrange resources to support this alignment
(Miller, 1983). Since strategy is the force that mediates between the firm and its

60
environment, organizational structure must be well suited to the strategy in order to
create a significant competitive advantage.
Studies have suggested various ways to achieve alignment. For example, based
on the literature across numerous functional and academic disciplines (e.g., strategic
management, organizational behavior, operations management, human resources
management, organizational development), Pryor et al. (2007) propose a 5Ps model
that guides organizations to achieve strategic alignment. The five Ps are Purpose (the
organization’s mission, vision, goals and objectives, strategies, measurement, and
feedback), Principles (the guiding philosophies, assumptions, or attitudes about the
way that the organization should operate and conduct business), Processes (involving
the physical steps or stages by which inputs are transformed into outputs and elements,
such as responsibility, controls, accountability, and authority), People (including
employees, customers, suppliers, and others) and performance. The 5Ps must be
aligned with each other to achieve maximum efficiency and effectiveness. The
integration and alignment of the 5Ps are essential for successful strategy
implementation (Beer & Eisenstat, 2000; Raps, 2004).
This study adopts Higgins’ (2005) view of alignment. Higgins (2005, p. 5)
proposes a practical model for a successful implementation that he calls the ‘Eight
“S”s of Strategy Execution’. The 8Ss model is a cross-functional way of thinking about
ways to execute strategy and implement change across an organization. This model is
based on the McKinsey Seven “S”s, which was first introduced by Peters, Waterman,
and Jones (1982) in their book entitled “In Search of Excellence”.
The underlying principle of the 8Ss model is that different strategies require
different kinds of structure, system, style, staffing, resources, and shared values to
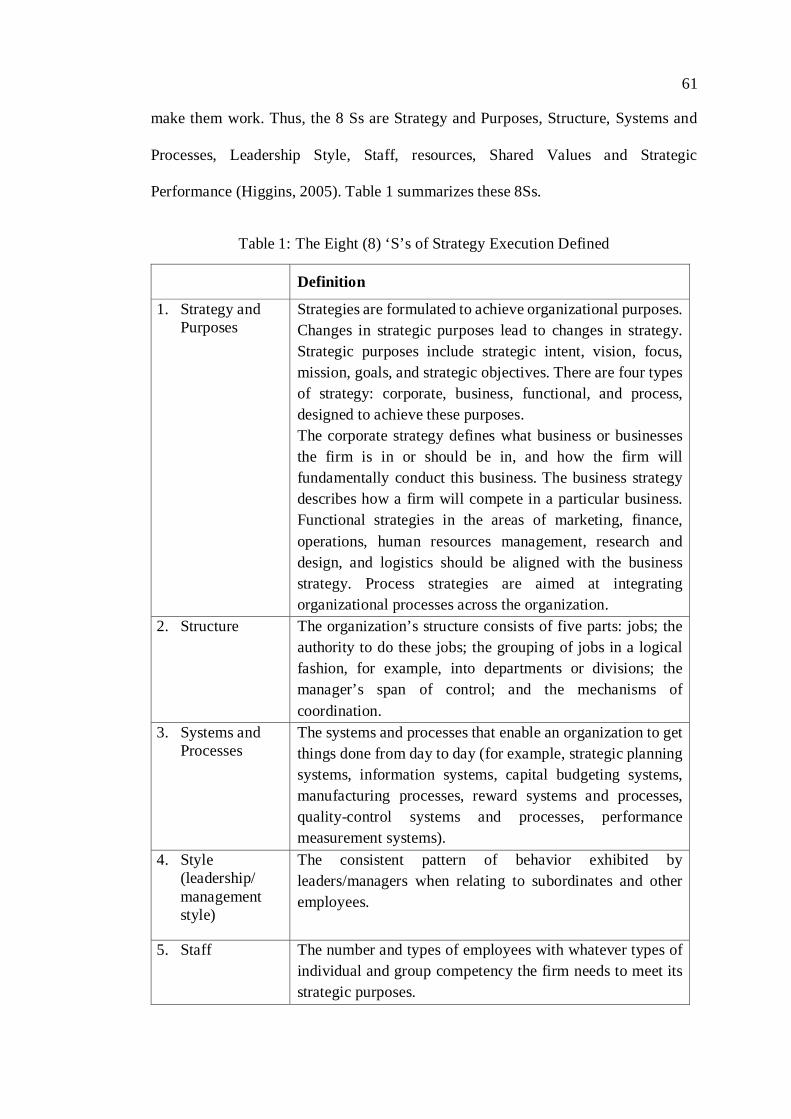
61
make them work. Thus, the 8 Ss are Strategy and Purposes, Structure, Systems and
Processes, Leadership Style, Staff, resources, Shared Values and Strategic
Performance (Higgins, 2005). Table 1 summarizes these 8Ss.
Table 1: The Eight (8) ‘S’s of Strategy Execution Defined
Definition
1. Strategy and Purposes
Strategies are formulated to achieve organizational purposes. Changes in strategic purposes lead to changes in strategy. Strategic purposes include strategic intent, vision, focus, mission, goals, and strategic objectives. There are four types of strategy: corporate, business, functional, and process, designed to achieve these purposes. The corporate strategy defines what business or businesses the firm is in or should be in, and how the firm will fundamentally conduct this business. The business strategy describes how a firm will compete in a particular business. Functional strategies in the areas of marketing, finance, operations, human resources management, research and design, and logistics should be aligned with the business strategy. Process strategies are aimed at integrating organizational processes across the organization.
2. Structure The organization’s structure consists of five parts: jobs; the authority to do these jobs; the grouping of jobs in a logical fashion, for example, into departments or divisions; the manager’s span of control; and the mechanisms of coordination.
3. Systems and Processes
The systems and processes that enable an organization to get things done from day to day (for example, strategic planning systems, information systems, capital budgeting systems, manufacturing processes, reward systems and processes, quality-control systems and processes, performance measurement systems).
4. Style (leadership/ management style)
The consistent pattern of behavior exhibited by leaders/managers when relating to subordinates and other employees.
5. Staff The number and types of employees with whatever types of individual and group competency the firm needs to meet its strategic purposes.

62
Definition
6. Resources The extent to which the organization has adequate resources to achieve its strategy: people (staff), technology and money are the three most critical.
7. Shared Values (organizational culture)
The values shared by members of the organization. Managing values and cultural artefacts are critical to successfully leading organizational change.
8. Strategic Performance
Strategic performance is a derivative of the other seven Ss. Strategic performance is possessed by an organization as a whole, or the profit-based parts of the whole.
Source: Higgins (2005, p. 5).
By using the 8Ss model in the strategizing process, managers can anticipate
what needs to be changed in the organization in order for the strategy to work.
Therefore, the model serves as a road map for implementation during the execution
stage. It can help managers to find what has caused strategy execution to fail.
Researchers argue that aligning organizational factors with strategy can lead to
successful strategy implementation and superior performance. Pryor et al. (2007)
propose a 5Ps model that includes purpose, principal, process, people and
performance. They argue that the integration and alignment of the 5Ps are essential for
successful strategy implementation (Beer & Eisenstat, 2000; Raps, 2004). Similarly,
many researchers have discussed the strategic alignment of the information system and
firm performance (Bergeron et al., 2004; Lee & Pai, 2003). For example, Bergeron et
al. (2004) find that low-performance firms exhibited a conflictual coalignment pattern
of business strategy, business structure, IT strategy, and IT structure. The coalignment
approach transcends both strategic integration (bivariate fit between business strategy
and IT strategy) and operational integration (bivariate fit between business structure
and IT structure) to achieve systems integration, thus increasing performance.
Sledgianowski, Luftman, and Reilly (2006) also argue, from a strategic alignment

63
perspective, that it is critical to create a “strategic fit” between the IT infrastructure
and IT strategy to achieve business value. On similar lines, Lee and Pai (2003) find
that the maturity of the information systems function has a strong effect on strategic
information systems planning and that IT-business alignment improves with the
effectiveness of a firm’s planning process.
Although the information system’s strategic alignment has been well
discussed, relatively few studies focus on discussing the strategic alignment in the
organizational strategy and many different organizational factors, such as structures,
systems, style, staffing, resources, and shared values, as proposed by Higgins (2005).
Thus, this study will try to close this gap and empirically test the importance of
strategic alignment for strategy implementation and organizational performance.
2.6.2 Strategic Plan Implementation and Organizational Performance
Strategy implementation has been argued to be a significant determinant of
performance (Andrews et al., 2011). For example, Long and Franklin (2004) suggest
that one of the key variables when studying implementation is the implementation
approach or implementation style, which refers to the processes used to put strategy
into practice (Andrews et al., 2011). Long and Franklin (2004) argue that
implementation can be carried out in a centralized, decentralized, or mixed approach
way, consisting of top-level policy guidance and bottom-level, administrative
expertise. The authors argue that the one-size-fits-all approach to implementation is
not suitable, since each organization has unique challenges determined by the specific
context of the organizations. These challenges can be met only by some sort of
adaptive or evolutionary implementation approaches.

64
Some researchers have also investigated the relationship between the style of
implementation and performance. For example, the study of Thorpe and Morgan
(2007) of private sector service organizations finds that implementation styles
influence the effectiveness of implementation. Contrary to the literature that has
recommended bottom-up marketing planning, the findings of Thorpe and Morgan
(2007) show that if the firm displays an implementation environment characterized by
hierarchical structures and strong top-down influences, then its marketing strategy
implementation will be more effective. Thus, there is a need for a degree of top-down
imposition, but fostering the cooperation of mid-level marketing managers through
bottom-up initiatives is required in the implementation process.
Similarly, Andrews et al. (2011) study the relationship between strategy
implementation style and public service performance. Based on Bourgeois & Brodwin
(1984), Andrews et al. (2011) identify three kinds of implementation style; namely,
the rational implementation style, the incremental style and implementation with no
clear style. The rational implementation style has centralized control. Formal means
are used to achieve compliance and strategy formulation and implementation are
viewed as sequential activities, following deliberately formulated strategies. In the
incremental style, organizations decentralize their responsibilities and a loose
distinction is made between strategy formulation and implementation. Finally, it is also
possible for organizations to have ‘no clear style of implementation’. In this case,
strategy implementation is not discernible (Andrews et al., 2011).
The results of Andrews et al. (2011) indicated that none of the implementation
styles generates better performance by itself and that implementation style is important
only in combination with the three types of appropriate strategic stance or strategic

65
orientation (i.e., prospector, defender or reactor). More specifically, their results show
that strategic orientation moderates the relationship between implementation style and
organizational performance such that a rational style of implementation is positively
correlated with performance, whereas incremental style and implementation with no
clear style is negatively correlated with performance.
In other words, Andrews et al.’s (2011) study suggests that the positive impact
of strategy implementation on firm performance is dependent on whether there is a fit
between strategic stance and implementation style. Only when a closer synonymy is
achieved between strategic stance and implementation style is, organizational
performance enhanced. Brenes, Mena, & Molina (2008) offer a similar contingency
relationship where successful strategy implementation requires a deliberate and
systematic management of five dimensions; namely, a strategy formulation process;
systematic strategy execution; strategy control and follow-up; the leadership of top
management supported by suitable, motivated managers and employees; and corporate
governance (Brenes et al., 2008).
The relationship between strategy implementation and organizational
performance is also addressed by many researchers. Others, for example, Hickson,
Miller, and Wilson (2003) examine the link between implementation and performance.
They propose two distinct approaches to implementation management: the experience-
based approach and the readiness-based approach. In the experience-based approach,
management knows enough to assess what the end goals are, what has to be done
beforehand and what appropriate personnel, finance and time can be used. The
readiness-based approach occurs where the climate is receptive but experience is
relatively lacking. This approach seems to begin with the hope that things will be

66
managed somehow and managers can learn by doing. Hickson et al. (2003) conclude
that although either approach may enhance decision performance, great success is
associated with a combined approach. Similarly, the marketing strategy literature
suggests that the effective implementation of planned marketing strategy is a key
driver of firm performance (Olson, Chae, & Sheu, 2005). Morgan, Katsikeas, and
Vorhies (2012) discuss kind of export marketing strategy implementation based on the
implementation literature in marketing and strategic management. The results indicate
that the effective implementation of planned export marketing strategy contributes to
export market and financial performance.
The above arguments suggest that strategy implementation positively affects
organizational performance. The author of the present study further suggests that, for
this positive effect to occur in organizational performance, the two aspects of the
implementation process reviewed earlier (i.e., comprehensiveness and alignment),
should be positively related. More specifically, the author suggests that
comprehensiveness has a positive impact on organizational performance. The support
for this argument comes from several studies pointing out that comprehensiveness is
an important factor affecting the successful management of strategy formulation and
implementation and that there is a positive relationship between comprehensiveness
and organizational performance. Miller et al. (1998) for example, argue that strategic
decision-making comprehensiveness allows managers to better understand their
environment and to be more capable and effective in judging the environment’s
potential effect on their organization, thereby ensuring effective decision making and
improving organizational performance.

67
Similarly, we claim that this argument can be extended to the realm of strategy
implementation. For example, the positive relationship between comprehensiveness
and organizational performance was established in the context of strategy
implementation in a recent study by Elbanna and Fadol (2016), who analyse the
strategy implementation processes in federal and local organizations in the UAE to
show how these organizations carried out their activities and took the actions required
for effective execution of their strategic plans. The study concluded that
comprehensiveness positively affects organizational performance in both private and
public settings, a result that supports Zinn and Flood (2009)’s finding that
comprehensiveness permits managers to act strategically to exploit opportunities. This
has also been supported by a more recent study in the Canadian public sector (Elbanna,
Andrews, & Pollanen, 2015).
As pointed out earlier, the alignment of strategy implementation should also
positively affect organizational performance. Aspects of the firm such as culture,
organizational structure, and management style may have a profound effect on
implementation processes (Noble, 1999). Aligning and integrating organizational
factors with strategy should allow organizations to achieve superior performance
(Slater & Olson, 2000). At the organizational level, a proper relationship between
strategy, structure and control can create an environment that is conducive to
implementation success. At an interpersonal level, the degree of shared understanding
among implementation managers is critical. At the individual level, the cognitive
processes and commitment to strategy of the involved managers are important for
performance (Noble, 1999). Similarly, Pryor et al. (2007) claim that continually
ascertaining the proper alignment of organizational Purpose, Principles, Processes, and
People is a requisite in successfully implementing the firm’s strategies. Additionally,

68
Govindarajan (1988) has found that a match between appropriate administrative
mechanisms and strategy can reduce uncertainty within the firm and increase the
effectiveness of the marketing strategy implementation.
Based on the above discussions and the literature review presented in Part
2.6.2.1 and Part 2.6.2.2, the following hypotheses are proposed.
H3: Comprehensiveness of strategic plan implementation is positively
related to organizational performance.
H4 Alignment of strategic plan implementation is positively related to
organizational performance.
2.7 Strategic Plan Evaluation
2.7.1 Concept of Strategic Plan Evaluation
Strategy evaluation is a relatively unexplored research field (Oliveira & Pinho,
2011), despite the fact that it is a crucial stage for successfully transforming a strategic
intent into a strategic practice and that many researchers have contributed to this field
(Laurian et al., 2010; Seasons, 2003). Strategy evaluation can be defined as “the
activities and actions required for assessing the strategic plan” (Elbanna, 2013, p. 434).
It monitors the performance of organizations and helps organizations to realize the
desired objective and validate the success or failure of the given strategy (Weiss,
Berger, & Hatcher, 2008). Weiss et al. (2008) define evaluation as the process of
asking questions related to a particular topic and collecting and analysing information
to answer those questions. This process implies an iterative process and is carried out

69
to generate continuous feedback about a particular strategy or strategies being
implemented.
Weiss et al. (2008) propose that there are two types of evaluation; namely,
process evaluation and outcome evaluation. Process refers to the groundwork needed
to achieve the outcome objectives. It describes what the organizations are doing and
how they will do it. Process evaluation is “conducted to assess whether a strategy is
being implemented as planned and whether it is reaching its intended population”
(Weiss et al., 2008, p. 1). It is a sort of quality assurance that focuses on the
implementation. Outcome refers to “changes in attitude, knowledge, behaviour and
long-term implications” (Weiss et al., 2008, p. 12). Outcome evaluation aims to assess
if the intended outcomes of the strategic plan are achieved. Outcome evaluation allows
organizations to evaluate whether the strategies are effective. Coupled with process
evaluation, outcome evaluation can be used to determine whether or not a strategy
intervention was responsible for any observed outcomes. Outcome evaluation is
valuable for organizations; as Carmona (2007) argues “a final analysis of the ‘outcome
quality’ can only be made when the actual outcomes from the process themselves are
evaluated” (p. 4).
Other researchers have argued that there are three types of evaluation: ex ante
evaluations, ongoing evaluations and post hoc evaluations (Guyadeen & Seasons,
2015). Ex ante evaluations occur during the planning stage. In this stage, managers
evaluate different plans and one solution path is chosen from among alternative
proposals (plans). Ongoing evaluations take place during the implementation stage.
Last post hoc evaluations are made after the implementation stage. The purpose is

70
usually to discover if the plan was implemented, and if so, how it performed (Alterman
& Hill, 1978).
Studies also offer other types of strategy evaluation. For example, Laurian et
al. (2010) propose four types of evaluations: goal or objective-driven evaluation,
theory-driven and theory-based evaluation, stakeholder-focused evaluation and data-
driven evaluation. Goal or objective-driven evaluation focuses on whether strategic
goals and objectives are achieved (Weiss, 1972). It is positivist, in that it assumes that
well-designed and implemented interventions have clear goals and yield expected
outcomes, which can be assessed by neutral experts. This approach is widely used to
evaluate strategic plans (Berke et al., 2006; Laurian et al., 2004; McCoy & Hargie,
2001). However, these evaluations are complicated because plan goals are not always
clear, multiple strategies are used to achieve goals, outcomes are difficult to measure,
and it is extremely difficult to attribute observed outcomes to particular plans.
In contrast, theory-driven evaluation seeks to clarify the relationships between
programs and outcomes (e.g., Weiss, 1997). This approach focuses on identifying and
modeling program logic and causal relations between programs and outcomes
(Bennear & Coglianese, 2005). It is most useful for ex post evaluation (Lunt,
Davidson, & McKegg, 2003). However, in practice, establishing the causal
relationships between a program and all its direct and indirect effects is extremely
difficult (Davidson, 2000).
The third form of evaluation is stakeholder-focused evaluation (Patton, 1997).
This approach is based on stakeholders' deliberations and understanding of the
strategic goals, functioning, and outcomes. It is also referred to as `responsive' or
`constructivist' evaluation (McCoy & Hargie, 2001). This approach takes stakeholders’

71
view into consideration; however, sometimes stakeholders tend to focus on short-term
and visible outcomes over long-term or large-scale cumulative impact. Finally, the last
type of evaluation is data-driven evaluation. It is used to track changes over time rather
than assess the specific impact of strategic plans. Thus, it cannot address the question
of attribution.
According to Weiss et al. (2008), evaluation should be conducted in five steps.
These steps are identifying and involving stakeholders, describing strategy, designing
the evaluation, establishing an action plan and collecting and analysing the data. In
the same context, other researchers suggest the number of planners involved in plan
making, and the sharing of information, contribute significantly to plan quality (Tang
& Brody, 2009). Improving stakeholder consultation during the planning process is
another important consideration (Guyadeen & Seasons, 2015).
Studies show that, to effectively conduct strategy evaluation, organizations
need sufficient resources (Guyadeen & Seasons, 2015). Those resources include
properly trained staff, financial resources and technical support for evaluation research
(Bell, 2004). Although organizations typically position strategic evaluation as a
decision-support and learning tool, in practice planning organizations tend to ‘front-
load’ resources during plan development (Waldner, 2004), leaving limited resources
for evaluation once plans are implemented. This happens because planners are future
oriented and may be biased towards generating future plans rather than evaluating old
ones (Waldner, 2004).
Another challenge related to evaluation is the lack of generally accepted
outcome evaluation methodologies and performance measurements. There are few
studies that inform the evaluation of plan outcomes. Laurian et al. (2010) proposed

72
and tested a plan-outcome evaluation methodology in New Zealand. They argue that
there is a substantive lack of ex post outcome evaluations that focus on land use plans;
thus it is difficult for planners to show the impact of their plans and activities
(Guyadeen & Seasons, 2015). In addition, there are also challenges related to
performance measurement that impede the evaluation of plan outcomes. Researchers
argue that it is difficult to isolate planning outcomes from the external influences that
might also have bearing on the situation; therefore it is hard to draw clear and distinct
causal links between planning actions and planning outcomes (Carmona & Sieh, 2008;
Laurian et al., 2010).
As reviewed below, studies show that strategy evaluation has beneficial
impacts on outcomes, which include strategic direction, fit with the environment,
communication with stakeholders and performance (Elbanna, 2013). To better
understand why evaluation generates beneficial outcomes, researchers have suggested
examining evaluation from its several dimensions, such as strategic control (Elbanna
& Fadol, 2016; Merchant & Otley, 2006) and accountability (Cavalluzzo & Ittner,
2004). The following section discusses the literature on these two dimensions.
2.7.2 Dimensions of Strategic Plan Evaluation
2.7.2.1 Accountability
Paul (1992, p. 2) defines accountability as “holding individuals and
organizations responsible for performance measured as objectively as possible”. In the
HarperCollins Dictionary of American Government and Politics, accountability is
defined as the extent to which one must answer to higher authority – legal or
organizational – for one’s action in society at large or within one’s organization.

73
Similarly, Gray and Jenkins (1993, p. 55) define accountability as ‘an obligation to
present an account of and answer for the execution of responsibilities to those who
entrusted those responsibilities’. For accountability, it is necessary to keep accurate
records of property, documents or funds (Shafritz & Shafritz, 1992).
Accountability is a complex, abstract and elusive concept (Crofts & Bisman,
2010) because it takes various forms, including communal, contractual, managerial
and parliamentary (Demirag, Dubnick, & Khadaroo, 2004; Laughlin, 1996; Sinclair,
1995; Stewart, 1984). Communal accountability involves seeking the legitimacy and
consensus of stakeholder groups affected by a particular policy through their
participation in the decision making process (Demirag & Khadaroo, 2011). The
contractual accountability process involves entering into a legally binding agreement
over standards of performance and creating liabilities and the obligation to comply
through the judicial process (Dubnick, 1998). Managerial accountability involves
making ‘those with delegated authority answerable for producing outputs or the use of
resources to achieve certain ends’ (Sinclair, 1995, p. 222). Organizational internal
structures are set up to implement, monitor and evaluate programs (Demirag et al.,
2004). Parliamentary accountability is the process of holding government executives
to account for the policies they have pursued (Demirag et al., 2004). In this study, the
researcher mainly focuses on discussing managerial accountability.
Crofts and Bisman (2010) conducted a content analysis of journal articles
which discussed accountability and revealed that researchers pay more attention to
accountability within “accounting”, “financial”, and “reporting” contexts, in particular
from public and social perspectives, while comparatively they emphasize managerial
accountability less in regard to cost, quality, and control (Crofts & Bisman, 2010). In

74
the same vein, Carnegie and West (2005) and Martin and Kloot (2001) have suggested
an overemphasis on accounting and financial perspectives in accountability, at the
expense of broader considerations of the managerial facets of accountability. The study
of Crofts and Bisman (2010) also highlights the relative paucity of accountability
research conducted within the private sector and not-for-profit organizations in
comparison to government and public sectors. From the above discussion, the
researcher argues that it is important to discuss not only financial accountability and
external accountability but also the internal development of accountability
mechanisms and process accountabilities. Thus, this study will further investigate how
managerial accountability as a dimension of strategic evaluation influences
organizational performance.
The current literature has discussed the factors that influence accountability.
Using data from a government-wide survey administered by the US General
Accounting Office, Cavalluzzo and Ittner (2004) examine some of the factors
influencing accountability in government activities. They find that organizational
factors such as top management commitment to the use of performance information,
decision-making authority, and training in performance measurement techniques all
exhibit significant, positive direct and indirect effects on accountability. In other
words, the extent to which government managers are held accountable for achieving
results is influenced not only by the extent of performance measurement, but also by
managers’ knowledge of and ability to apply management techniques and by top
management’s commitment to achieving results. In addition, the level of
accountability must be aligned with the decision-rights granted to managers. Greater
accountability can be achieved only when managers have expanded authority over
spending, human resources, and other management functions. However, in reality,

75
laws, bureaucratic rules, and the separation of powers in different branches of
government can place severe constraints on managers’ decision-making authority, and
thereby the extent to which they can be held accountable for results (Cavalluzzo &
Ittner, 2004).
The current literature also discusses the relationship between accountability
and performance. Some researchers suggest that there is a positive relationship
between accountability and performance. Dubnick (2005) argue that accountability
leads to superior performance. The reason behind this may be that accountability calls
on institutional managers to define their mission publicly, set goals, establish strategies
and activities to accomplish these goals, and measure and report the outcomes of their
activities (Oakes & Young, 2008). These reported outcomes have to be linked to inputs
and used as benchmarks to compare organizations. Instead of requiring mostly
financial information, accountability would require the disclosure of nonfinancial
quantitative information about how well the organizations are fulfilling their mission
(Herzlinger, 1995; Oakes & Young, 2008).
Another plausible explanation for the positive impact of accountability on
performance is that accountability is often associated with the execution of
responsibilities and being answerable for them. Kwon and Zmud (1987), for example,
have studied this in the context of IT implementation and suggest that one of the major
organizational factors in IT implementation success is the level of worker
responsibility. In addition, the level of accountability is expected to be positively
associated with decision-making authority, and thereby the extent to which managers
can be held accountable for results. Still another explanation comes from Cavalluzzo
and Ittner (2004), who suggest that performance measurement development and

76
outcomes are positively associated with the extent to which managers have the
authority to make decisions based on performance information. When managers have
the authority to make decisions based on performance information and when they are
held accountable for results, they are more likely to make decisions accurately and
carefully, thus improving performance. Martinez and Nilson (2006) look at South
Dakota’s performance funding and find that state accountability contributed to
institutional performance to some extent.
However, other researchers suggest that accountability does not necessarily
lead to positive performance. Volkwein and Tandberg (2008) determine that state
accountability did not contribute to state grades in Measuring Up 2002, 2004, and
2006. Huisman and Currie (2004) conducted comparative case studies on the new
accountability and have found that performance-based accountability was not
successful in enhancing institutional performance. Shin (2010) suggests that adopting
a form of performance-based accountability may not contribute to institutional
performance if the new accountability is not well grounded in institutional practices.
Demirag and Khadaroo (2011) also argue that accountability and performance (value
for money) relationships are problematic because it is often difficult to trace the value
for money benefits of private financial incentive projects and as a result it is
presumably difficult to hold public sector executives accountable for public services.
In addition, the measurement of performance is difficult (Cavalluzzo & Ittner, 2004),
in particular in environments where the problem of multiple and diverse expectations
is magnified (Demirag & Khadaroo, 2011).
Since there is no consensus on whether accountability leads to positive
performance, it is necessary to further examine this relationship in the present study.

77
In his attempt to examine this relationship, the author uses Cavalluzzo and Ittner’s
(2004) views of accountability in examining its relationship to organizational
performance.
2.7.2.2 Strategic Control
Strategic control has been a “hot issue” due to the fact that companies often
had serious difficulties responding in a timely manner to the failure of plans and
unexpected developments, because they do not have information about the ongoing
validity of the chosen strategic plan (Leonard, 1984). Therefore, researchers and
managers have underlined the value of strategic control and suggested specific
procedures (Schreyögg & Steinmann, 1987) and outcomes for it (Elbanna, 2016).
Researchers have given different meanings to the term ‘control’ (Giglioni &
Bedeian, 1974). Schendel and Hofer (1979), for example, provide a popular definition:
Strategic control “focuses on the dual questions of whether: (1) the strategy is being
implemented as planned; and (2) the results produced by the strategy are those
intended” (p.8). This definition refers to the traditional review and feedback stage that
constitutes the last step of the strategic management process. Elbanna (2016) sees
strategic control as a tool to ‘align the goals of individuals with [the] strategic goals’
of their organizations. According to other researchers, strategic control refers to
directing subordinates or systems to ensure proper actions (Lengnick-Hall &
Futterman, 1984) or to the critical evaluation of plans, activities, and the provision of
information for future action (Schreyögg & Steinmann, 1987, p. 91), which reflects
the view of strategic control adopted in the present study.

78
In order to better understand strategic control, it is necessary to discuss
budgetary control and strategic control. The concept of budgetary control is of course
closely related to budget. A budget specifies a goal, such as the total cost of a certain
quantity of product; it may also specify the means of accomplishing the goal, such as
the material and labor involved (Bruns & Waterhouse, 1975). Budgets are financial
plans that provide a basis for directing and evaluating the performance of individuals
or firms. Budgets help firms to coordinate and control the activities of different parts
of a firm (Bruns & Waterhouse, 1975). Budgetary control refers to “the application of
a comprehensive system of budgeting in the organization to assist the management in
the process of its planning, coordinating, controlling and performance evaluation. It is
an effective tool to the management to achieve the business goals and objectives of the
organization” (Debarshi, 2011, p. 468).
Budgetary control is used to track management performance against defined
cost and revenue objectives and thus provides the basis for feedback and incentives in
terms of career, compensation and the sense of achievement (or failure) that results
from being ahead of (or behind) budget (Goold & Quinn, 1990). It also provides
managers with a highly effective control tool and ensures that important aspects of a
business (such as cash management) are properly planned and monitored (Merchant,
1985).
Neely, Filippini, Forza, Vinelli, and Jasper (2001) argue that there are some
weaknesses of budgetary controls’ for example, budgets constrain responsiveness and
are often a barrier to change, budgets concentrate on cost reduction rather than value
creation, and, considering the time required to prepare them, add little value. In
addition, budgetary control does not cover non-financial objectives that may be critical

79
for obtaining secure profitability and competitive strength. It does not pay attention to
longer-term goals and objectives (Goold & Quinn, 1990). Hope and Fraser (2003) also
argue that budgets are increasingly inappropriate for organizations desiring to achieve
high performance in competitive conditions, and should be abandoned.
Researchers also find that budgetary control may not contribute to positive
financial performance. For example, Dunk (2011) found that when the emphasis is on
using budgets as a planning mechanism, budget facilitates product innovation,
impacting positively on the financial performance of firms. In contrast, when the
emphasis is on using budgets primarily as a control mechanism, it is unlikely that
product innovation will contribute to financial performance.
On the contrary, strategic controls involve longer term objectives because they
focus on competitive benchmarks, non-financial performance measures and long-term
outcomes (Goold & Quinn, 1990). This means that, with strategic control,
organizations need to look for external data and undertake less routine analysis. Some
authors also argue for a broader conception of strategic control, such that differences
between actual and planned outcomes lead not only to modification of the actions of
individuals, but also to questioning of the assumptions of the plan itself (Argyris &
Schon, 1978; Lorange & Murphy, 1984).
Lorange (1988) proposes a comprehensive approach to strategic controls. He
distinguishes three levels in the organization (i.e., the ‘overall portfolio’ or corporate
level, the ‘business family’ or divisional level and the ‘business element’ or SBU) and
suggests that organizations must monitor the performance at each level. This requires
establishing, at each level, i) the strategic objectives (the eventual objectives, in terms
of competitive strategy), ii) the strategic programs and milestones (the specific tasks

80
by which the strategic objectives will be accomplished, and by when), iii) the strategic
budgets (the resources to be spent on strategic programs) and iv) the operating budgets.
Strategic control is closely related to management control systems (MCS).
Management control systems have been recognized as important in the formulation
and implementation of strategies (Bromwich & Bhimani, 2005). MCS can give useful
and valuable information for an organization’s decision-making, planning and
evaluation processes (Merchant & Otley, 2006) and are employed by many
organizations as a tool to support their strategies and to conduct strategic control
(Golgeci & Ponomarov, 2013). Control generally involves (1) setting objectives, (2)
deciding on the preferred strategies for achieving these objectives, and then (3)
implementing these strategies and (4) making sure the strategies are implemented
(Merchant & Otley, 2006).
Any system, such as budgeting or a balanced scorecard, can be categorized as
an MCS (Malmi & Brown, 2008). The balanced scorecard originates from Porter’s
concept of strategy as a response to competitive forces in an industry. It is a
management control system popularized by Kaplan and Norton (1992) and (Kaplan,
2001). The balanced scorecard moves performance measurement away from its
traditional focus on purely financial measures (Woods & Grubnic, 2008). It serves as
a feed forward control system and a performance measurement system. The balanced
scorecard covers four component perspectives within a company: financial, customer,
internal business processes and learning and growth (Woods & Grubnic, 2008).
Although several researchers find a positive relationship between strategic
control and firm performance, researchers do suggest that strategic control positively
influences firms’ activities and capabilities. The reason is that MCS can co-ordinate

81
the efforts of employees; motivate individual managers; and alter direction depending
on circumstances (Liviu, Sorina, & Radu, 2008). Strategic controls can be used to
clarify how to evaluate whether a performance is good or bad; make explicit the trade-
offs between profit and investment; introduce individual targets; and ensure managers
choose the right time to intervene when business performance deteriorates (Liviu et
al., 2008).
Strategic control has been found to positively influence an organization’s
capabilities (Chenhall et al., 2011; Morris, Allen, Schindehutte, & Avila, 2006). For
example, Chenhall et al. (2011) find that formal controls have an influence on helping
organizations develop innovation. Financial plans can be used to encourage people to
project themselves into the future, to see new opportunities and threats and to adopt
new strategic postures (Davila, Foster, & Oyon, 2009). Formal controls also help firms
to identify areas that may need more innovative effort and to motivate managers to
improve effectiveness in generating innovation by developing and assessing reward
systems related to innovative effort (Simons, 2000). In addition, strategic control
systems give strategic direction to firms’ innovative efforts and the efficiencies they
produce can free up resources for innovation (Marginson, 2002).
A number of researchers have sought to link control systems, strategic choices,
and performance (Nilsson, 2002). Kober, Ng, and Paul (2007) discuss the
interrelationship between MCS and strategy. They find a two-way relationship
between MCS and strategy. That is, the MCS both shapes, and is shaped by, strategy.
Simons (1991) suggests that control systems can serve not only as a vehicle for
implementing strategy, but can help focus management attention on strategic
uncertainties, thereby facilitating the emergence of new competitive strategies.

82
Elbanna (2016) examines the impact of strategic control on organizational politics; and
how the latter influence the effectiveness of strategic planning in the UAE setting. His
results show the importance of strategic control in organizational processes and
outcomes. Marginson (2002) examines the effect of three groups of control
mechanisms on strategy formulation at a middle-management level and concludes that
different facets of control systems can be used to affect strategic change, secure
strategy implementation, and ensure that performance standards are met in key areas
of the strategy process. Further, Marginson (2002) argues that it is more the particular
design of a control mechanism than the way in which managers interpret its use
strategically that determines the influence of the control system. A recent study shows
that the control of plans and of goal achievement contributes significantly to firm
performance (Wijewardena, De Zoysa, Fonseka, & Perera, 2004).
In this study, we adopt Schreyögg & Steinmann’s (1987) view of strategic
control and focus on discussing whether managers monitor the environmental
conditions (e.g., forecasts of inflation or market growth rate, etc.), accomplish the
objectives of the intermediate plans and the master strategic planning, engage in a
systematic and continuous effort to identify and appraise the unforeseen effects of the
implemented decisions, and engage in an effort to monitor the full range of emerging
events inside and outside the organization that are likely to threaten the course of the
organization’s strategic action.
2.7.3 Strategic Plan Evaluation and Organizational Performance
Researchers point out that there are many benefits of conducting strategy
evaluation (Guyadeen & Seasons, 2015). Evaluation fosters continuous learning in

83
planning; and thus, it enables managers to assess the plans and understand what
distinguishes good planning from bad planning (Baer, 1997). Evaluation also supports
constant improvement in the profession (Balsas, 2012; Oliveira & Pinho, 2011). By
conducting evaluation, managers can improve the planning process and the
implementation of plans, thus achieving the intended outcomes (Seasons, 2003) and
improving organizational performance.
As indicated earlier, strategy evaluation has a positive impact on outcomes,
which include strategic direction, fit with the environment, communication with
stakeholders and performance (Elbanna, 2013). Similarly, Andrews et al. (2011)
contend that implementing strategic plans is widely accepted as a critical element of
strategy and one that can have a significant impact on organizational performance.
Brenes et al. (2008) also suggest that one of the significant determinants of strategy
success is the systematic execution of strategy. It is also a critical cornerstone in the
building of a capable organization.
Among the other benefits of conducting a strategy evaluation (Guyadeen &
Seasons, 2015) is its fostering of continuous learning in planning; thus, it enables
managers to assess the plans and understand what distinguishes good planning from
bad planning (Baer, 1997) and supports constant improvement in the profession
(Balsas, 2012; Oliveira & Pinho, 2011). By conducting evaluation, managers can
improve the planning process and the implementation of plans, thus achieving intended
outcomes (Seasons, 2003) and improving organizational performance. Pershing
(2006) suggests that performance improvement is a systematic combination of three
fundamental processes: performance analysis, cause analysis and intervention
selection. Cause analysis allows firms to identify the causes of gaps in performance

84
and the intervention selection process allows firms to select appropriate solutions
based on the results of cause analysis. Strategy evaluation is closely related to
performance analysis. Through conducting strategy evaluations, firms can identify any
adjustments that have to be made during and after development and implementation,
so that resources are maximized and organizations efficiently and effectively deliver
valuable results (Guerra-López, 2008).
Evaluation is a series of processes and procedures. Evaluation can provide
managers with relevant and reliable data to make justifiable decisions about which
programs to continue and how to improve these programs (Guerra-López, 2008).
Evaluation reports can be used to market firms’ successes to internal and external
customers (Guerra-López, 2008). It provides decision makers with feedback, which
works as a responsive and clear recipe for improving performance (Guerra-López,
2008).
The above arguments suggest that strategy evaluation positively affects
organizational performance. The author of the present study further suggests that, for
this positive effect to occur, the two aspects of the evaluation process reviewed earlier
(i.e., accountability and strategic control) positively affect organizational performance.
More specifically, the author suggests that accountability has a positive impact on
organizational performance. Support for this argument comes from several studies. For
example, Dubnick (2005) argues that accountability leads to superior performance.
Accountability will result in (1) greater transparency and openness (the promise of
democracy) (Schedler, Diamond, & Plattner, 1999); control for the abuse and misuse
of authority (the promise of justice) (Ambos, 2000); promoting appropriate behavior
on the part of public officials (the promise of ethical behavior) (Dubnick, 2003); and

85
improvements in the quality of government services (the promise of performance), (5)
promoting learning in pursuit of continuous improvement.
Similarly, strategic control should also positively affect organizational
performance because it has been found to be positively related to organizational
capabilities (Chenhall et al., 2011; Morris et al., 2006). Formal controls also have an
influence on helping organizations develop innovation Chenhall et al. (2011). Henri
(2006) has found that using strategic control, specifically, performance measurement
systems, can positively influence organizations’ four capabilities (i.e., market
orientation, entrepreneurship, innovativeness, and organizational learning). These
capabilities are more likely to help firms to achieve great organizational performance.
Based on the above discussions and the literature review presented in Part
2.7.2.1 and Part 2.7.2.2, the following hypotheses are proposed.
H5: Accountability is positively related to organizational performance.
H6: Strategic control is positively related to organizational performance.
2.8 Organizational Performance and Organizational Competitiveness
As mentioned earlier (Part 2.4), organizational competitiveness has been
defined as the ability of a firm to design, produce and or market products superior to
those offered by competitors, considering price and non-price qualities (D’Cruz &
Rugman, 1992). Early studies argued that competitiveness is related to performance
(e.g., Rainer and Kazem (1994, p. 58)). Empirical evidence also suggests that
competitiveness is positively associated with improved efficiency, quality
improvement, productivity improvement and cost savings (Purba and Diane, 2005),
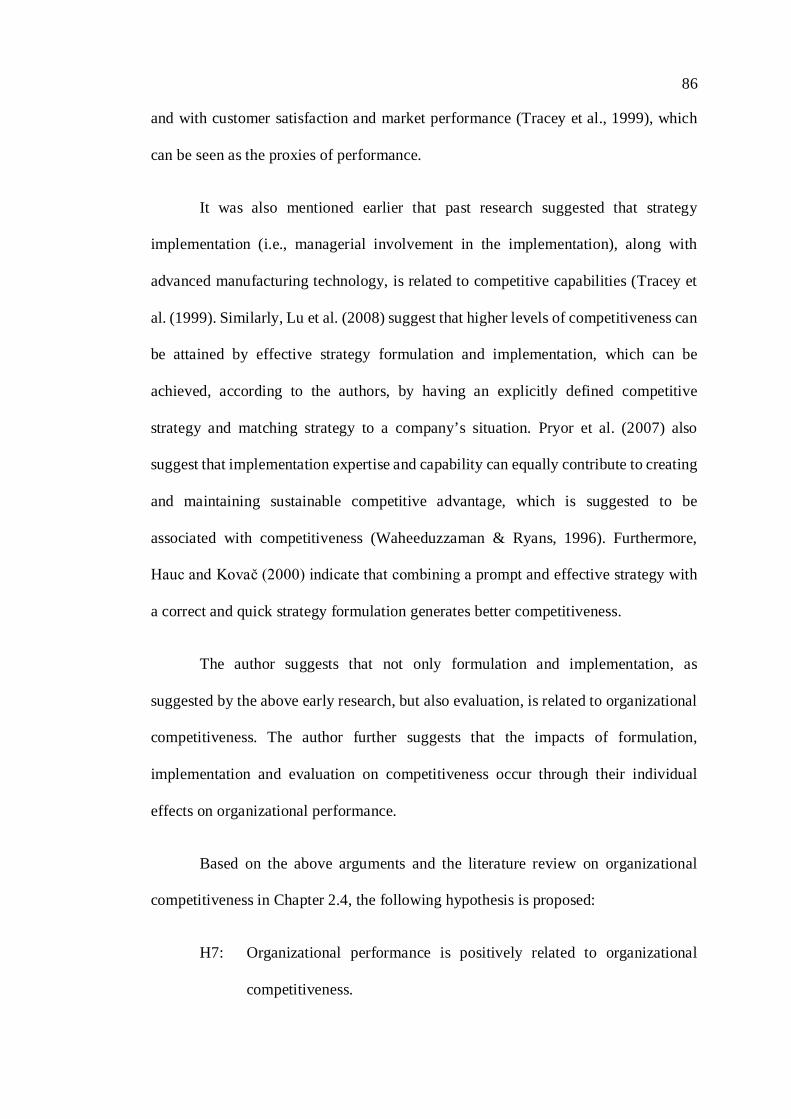
86
and with customer satisfaction and market performance (Tracey et al., 1999), which
can be seen as the proxies of performance.
It was also mentioned earlier that past research suggested that strategy
implementation (i.e., managerial involvement in the implementation), along with
advanced manufacturing technology, is related to competitive capabilities (Tracey et
al. (1999). Similarly, Lu et al. (2008) suggest that higher levels of competitiveness can
be attained by effective strategy formulation and implementation, which can be
achieved, according to the authors, by having an explicitly defined competitive
strategy and matching strategy to a company’s situation. Pryor et al. (2007) also
suggest that implementation expertise and capability can equally contribute to creating
and maintaining sustainable competitive advantage, which is suggested to be
associated with competitiveness (Waheeduzzaman & Ryans, 1996). Furthermore,
Hauc and Kovač (2000) indicate that combining a prompt and effective strategy with
a correct and quick strategy formulation generates better competitiveness.
The author suggests that not only formulation and implementation, as
suggested by the above early research, but also evaluation, is related to organizational
competitiveness. The author further suggests that the impacts of formulation,
implementation and evaluation on competitiveness occur through their individual
effects on organizational performance.
Based on the above arguments and the literature review on organizational
competitiveness in Chapter 2.4, the following hypothesis is proposed:
H7: Organizational performance is positively related to organizational
competitiveness.

87
2.9 Environmental Characteristics (Environmental Dynamism)
Strategy processes are influenced by environmental attributes such as
uncertainty, complexity, munificence, and dynamism (Dess & Beard, 1984;
Hutzschenreuter & Kleindienst, 2006; Sharfman & Dean, 1991). Duncan (1972)
argues that environmental characteristics can be related to both internal and external
conditions. The internal environment consists of the relevant physical and social
factors within the boundary of an organization that are taken into consideration in the
decision-making behavior of individuals in the system. The external environment is
formed from the relevant physical and social factors outside the boundary of an
organization that are taken into consideration in organizational decision-making. This
study discusses only the external environment. Early organization literature documents
well the fact that variability across organizational environments affects the nature of
organizational strategies and strategy formulation. Many scholars have discussed the
impact of the environment on managerial practices and organizational performance
(Goll & Rasheed, 2004). For example, Khandwalla (1976/1977) find that when
managers perceive their environment as dynamic and uncertain their strategies are
likely to be more comprehensive or multifaceted. Hrebiniak and Snow (1980) analysed
patterns of organizational response to uncertainty, and found significant differences
between industries, suggesting the importance of the industrial context for managerial
perceptions and responses. When formulating the resource dependence theory, Pfeffer
and Salancik (1978) argued that the business environment acts as an important source
of organizations’ resources such as personnel, product and services, information, and
funds. Kennerley and Neely (2003) examine the measurement of performance in a
changing business environment. Based on their findings, they recommend that
organizations should adopt measurement practices that take cognizance of the dynamic

88
and rapidly changing environments in which they operate. In addition, Pasanen (2003)
proposes that such environmental states as dynamism affect the way in which the
enterprises performed in the context of the small and medium-sized enterprises in
Finland.
The previous literature mainly focuses on discussing four environmental
characteristics: dynamism (Li & Liu, 2014), complexity (Chandler, 1962),
munificence (Goll & Rasheed, 2005) and hostility (Elbanna & Child, 2007; Miller &
Friesen, 1978). Similarly, according to the work of Okeyo (2014), the aspects of the
environment are munificence, dynamism and complexity. Each dimension constitutes
a critical environmental condition and plays an important role in moderating
organizational actions (Castrogiovanni, 1991; Park & Mezias, 2005). This study
discusses environmental dynamism and its moderating impact on the relationship
between the three components of strategic management and organizational
performance. This choice is due to the fact that dynamism or uncertainty is the most
examined environmental feature in strategy research (Shepherd & Rudd, 2014).
2.9.1 Environmental Dynamism
Environmental dynamism is a widely explored construct in the organization
theory and strategic management literature. Dynamism (often called uncertainty) is
characterized by the rate of change and innovation in the industry as well as the
uncertainty or unpredictability of the actions of competitors and customers (Lawrence
& Lorsch, 1967). Similarly, Tegarden, Sarason, Childers, and Hatfield (2005) define
environmental dynamism as technological change and the instability or
unpredictability of the environment. Keats and Hitt (1988) link dynamism to the

89
organizational environment as strategic diversification and organizational "postures"
towards innovation. These studies and others indicate the importance of the
environmental dynamism construct in explaining firm-level phenomena (Miller,
1983). Similarly, the study of Idris and Momani (2013) indicates that environmental
dynamism has a significant impact on organizational performance and the
comprehensiveness of marketing strategy. Furthermore, Elbanna and Child (2007)
propose that environmental characteristics such as uncertainty influence the rationality
of the strategic decision making process.
Research has discussed in some detail the moderating role of environmental
dynamism in a variety of relationships between strategic planning processes and firm
performance. For example, Priem, Rasheed, and Kotulic (1995) find that the
relationship between decision process rationality and firm performance is moderated
by environmental dynamism. Pearce, Freeman, and Robinson (1987) suggest that the
effect of strategic planning on performance is contingent upon the level of turbulence
that firms face. When firms face a high dynamic, managers rely on large amounts of
strategic planning to cope with changing, unpredictable conditions; while in a low
dynamic environment, managers need less strategic planning (Ansoff, 1991).
Similarly, Elbanna, Di Benedetto, and Gherib (2015) report evidence of the importance
of environmental uncertainty in understanding the relationship between strategy
process and outcomes in an Arab setting, namely, Tunisia. In addition, Fredrickson
and Mitchell (1984) empirically examine the relationship between the
comprehensiveness of the strategy formulation process and financial performance
under varying environmental conditions. They find that in conditions of high dynamic
environment, comprehensiveness did not lead to improved performance. However,

90
comprehensiveness was associated with performance in a relatively certain
environment.
Dynamic environments intensify challenges to the firm, and often complicate
these challenges. Greater analytical effort must therefore be devoted to understanding
and mastering the changes. Managers must study the dynamic environments very
carefully and diligently to have an adequate degree of mastery (Wilensky, 1967).
Changes in strategy making behavior are every bit as important as changes in structure
to cope with increased dynamism. In a highly dynamic environment, frequent changes
in customer demand, technology, and business practices require firms to continuously
modify their products or services to remain competitive. Brews and Purohit (2007)
draw from a multinational survey of 886 firms to show that as environmental
dynamism increases so does planning. Generative planning (plans encourage product,
service and process innovation) and transactive planning (plans are formed iteratively
on an ongoing basis and are adjusted as implementation proceeds) are more closely
associated with environmental instability. Change makes current product and services
obsolete and requires the development of new ones (Jansen, Van Den Bosch, &
Volberda, 2006). To avoid anachronistic products and practices, innovation is critical
in a dynamic environment (Lawrence & Lorsch, 1967). Likewise, sudden and
unpredictable changes can reduce the value of firms’ existing knowledge and even
render it obsolete (Hitt, Ireland, & Lee, 2000). To minimize the threat of obsolescence,
firms need to introduce an exploratory strategy and develop new products that move
away from existing products, services, and markets to meet the needs of the changing
environments. Firms must focus on solving new problems through new knowledge
creation (Revilla, Rodriguez-Prado, & Prieto, 2008). Extreme situations of

91
environmental dynamism result in ‘hyper competition’, where the benefits derived
from almost all forms of competitive advantage are short-lived (Bierly & Daly, 2007).
Hence, it is logical to assume that, in high dynamic environments, formulated
strategic planning may be short-lived and become obsolete very quickly, since the
environment is changing rapidly. Alternatively, in less dynamic markets, customer
preferences and competition situation are relatively stable and, therefore, strategic
planning may be more effective. In addition, environmental dynamism may pose
challenges to strategy implantation and evaluation. Thus, the positive relationship
between strategy implementation and performance, and the positive relationship
between strategy evaluation and performance are stronger in a low dynamic
environment than a high one.
Based on the above arguments, the following hypotheses are proposed for
testing:
H8: Environmental dynamism moderates the relationships between
strategic plan formulation, implementation and evaluation on one side
and organizational performance on the other side. In detail:
H8a: Environmental dynamism moderates the relationship between strategic
planning practice and organizational performance.
H8b: Environmental dynamism moderates the relationship between intensity
of strategic planning and organizational performance.

92
H8c: Environmental dynamism moderates the relationship between
comprehensiveness of strategic plan implementation and
organizational performance.
H8d: Environmental dynamism moderates the relationship between
alignment of strategic plan implementation and organizational
performance.
H8e: Environmental dynamism moderates the relationship between
accountability and organizational performance.
H8f: Environmental dynamism moderates the relationship between strategic
control and organizational performance.
2.10 Organizational Characteristics
Organizational characteristics can affect the nature of the relationships
hypothesized above. For this reason, they must be controlled to obtain reliable results.
This study uses organizational size as a control variable. The other variables, such as
strategic planning age, time horizon, preparation time, and degree of foreign
ownership, are included to better understand the responding firms in terms of their
practice of strategic management (i.e., for the purpose of descriptive analysis)/ Below
is a review of these variables.
2.10.1 Organizational Size
Many suppose that organization size may systematically influence managerial
strategic processes and strategic approaches (Elbanna, 2008; Elbanna & Child, 2007;

93
Wiesner & Millett, 2012). Organization size can affect rationality (Miller et al., 1998;
Snyman & Drew, 2003), such that larger firms will employ more formal and rational
processes (e.g., Papadakis, Lioukas, & Chambers, 1998). A number of studies have
also found support for an association between firm size and planning process
sophistication (Griggs, 2002). Kraus et al. (2006) claim that in the literature smaller
enterprises do in fact plan strategically. However, Wiesner and Millett (2012) argue
that there is often the perception that small and medium- sized enterprises do not
engage in formal strategy making since their focus is mainly on daily operational
issues. Small firms may not have the resources to have a department that is exclusively
responsible for planning activities, whereas large firms can afford to do so (Gibcus &
Kemp, 2003). As firms become larger they have more available resources for planning,
while smaller firms have resource gaps including lack of staff, expertise and time
(Matthews & Scott, 1995).
Based on these arguments, the performance and competitiveness of firms
sampled in this research may be influenced by the size of each organization; thus, when
discussing the relationship between strategy formulation, strategy implementation and
strategy evaluation and firm performance, it is necessary to include organizational size
as a control variable in the research model.
2.10.2 Strategic Planning Age
The study of Elbanna (2013) shows that in the UAE, the practice of strategic
management in the public sector is recent. Specifically, he finds that 77 percent of the
sampled organizations developed their first strategic plan between 2007 and 2011, 20
percent of the sampled organizations developed their first strategic plan between 2002

94
and 2006, and only 3 percent did so before 2002. Since 2007 local and federal
organizations have followed the direction of the UAE government and started to
conduct strategic management practices. The mean score for the age of strategic
planning in the sampled organizations was 4.2 years. It would be instructive to further
understand when our sampled semi-governmental organizations developed their first
strategic plan and whether the government directive has worked.
2.10.3 Time Horizon
It is suggested that the time horizon is one of the aspects researchers can look
at when discussing the characteristics of the strategic management practices in an
organization. The time horizon refers to the time periods of organizations’ strategic
planning (Elbanna, 2013). In terms of planning, the time horizon gives some indication
of whether the planning is short-, medium- or long-term (Stonehouse & Pemberton,
2002). Elbanna (2013) has found that the time horizons for the sampled UAE public
organizations range from 1 to 5 years. The mean score for the strategic planning
horizon is 4.2 years. Most organizations develop their plans for a period of either 3
years or 5 years. The time horizon for strategic planning in most federal organizations
is 3 years and in most local organizations is 5 years. However, we know nothing about
the planning horizon in the semi-governmental organizations of Abu Dhabi or the UAE
in general, which this study addresses in Chapter 5.
Similarly, Stonehouse and Pemberton (2002) discuss the time horizon based
on a survey of 159 small and medium-sized enterprises selected from both the service
and manufacturing sectors in the UK. They find that for both sectors the median value
of the time horizon is three years. Although a fifth of companies do plan over a five-

95
year time horizon, they seldom plan over a longer period Over 70 per cent of the
organizations have a planning horizon of three years or less, with over one-fifth having
only a one-year planning horizon. The authors ask whether one-year planning can be
classed as strategic or not.
Other researchers also indicate that there is a tendency for organizations to
shorten their strategic planning time horizons (Grant, 2003). In the study of Grant
(2003), all the companies reported a shortening of their planning horizons over the
previous decade. Five out of the eight sampled companies had planning periods of 5
years or less. The major contraction of companies’ strategy horizons resulted in
shifting their emphasis from the long term to the short and medium term.
Furthermore, researchers have also discussed whether the time horizon relates
to performance. Some research has found that the time horizon did not contribute to
performance; however, the planning formalization has a positive and highly significant
impact on performance (Kraus et al., 2006). This study further discusses the time
horizons of the sampled UAE organizations to better understand the characteristics of
their strategic planning.
2.10.4 Preparation Time
Preparation time and planning speed are also critical in strategic planning.
Researchers have found that organizations vary in terms of the time taken over
preparing strategic plans. For example, Elbanna (2013) has found that the mean score
for the time taken over preparing strategic plans by his sample of public organizations
in the UAE as a whole, is 5.4 months. In his study, most of the organizations, in the
whole sample and the sub-samples, take either 1–4 months (36 percent–48 percent) or

96
5–8 months (39 percent–50 percent) to prepare their strategic plans. He does not find
any big difference between federal and local organizations with regard to the length of
the preparation for strategic plans.
Other researchers also discuss whether organizations should take more time to
prepare strategic plans and make comprehensive decisions or whether they should
make faster decisions. For example, Kahneman, Slovic, and Tversky (1982) argue that
fast decision-making may produce bad decisions and bad performance if
comprehensive information gathering is sacrificed to gain speed. On the contrary,
Bourgeois and Eisenhardt (1988) identify a positive association between fast strategic
decision-making and firm performance. Still other researchers find a positive relation
between comprehensive decision processes (exhaustive and integrative) and
performance in a stable environment and a negative relation between
comprehensiveness and performance in an unstable environment (Fredrickson &
Mitchell, 1984). Similarly, Baum and Wally (2003) have found that dynamism is
significantly related to fast decision speeds, which in turn is related to improved
growth. This argument is consistent with the finding that fast decision-making
enhances performance in ‘high-velocity’ markets (Judge & Miller, 1991). This study
further discusses the preparation time of the sampled UAE semi-governmental
organizations to better understand the characteristics of their strategic planning.
2.10.5 Degree of Foreign Ownership
Previous researchers have found that ownership influences an organization’s
behavior. Based on the study of the public hospital services in England, Salge (2012)
finds that the level of temporal persistence in organizations’ innovative search

97
activities is determined by both structural differences in organizational size and
ownership, and the slack resources of the organizations. Furthermore, Papadakis et al.
(1998) find that internal firm characteristics, such as planning formality, performance,
firm size and type of ownership have more significant effects on the strategy process
than do environmental variables. Thus, many researchers consider the impact of
ownership when discussing the impact of strategic planning on firm performance. For
example, Fadol et al. (2015) control for the effect of organization size, organization
age, and type of ownership when discussing the impact of the extensiveness of
strategic planning on organizational performance. The type of ownership may
influence who makes the strategic decision and the effectiveness of strategic planning.
This study further discusses the degree of ownership of the sampled UAE semi-
governmental organizations to better understand the characteristics of their strategic
planning.
2.11 Summary of Hypotheses
Based on the literature review discussed, the following Conceptual model (See
Figure 1 below) is proposed:

98
Figure 1: Conceptual Model
As can be seen, in this model, the independent constructs consist of strategy
formulation, strategy implementation and strategy evaluation. Organizational
competitiveness is the dependent variable that is affected by organizational
performance, which in turn is affected by strategy formulation, strategy
implementation and strategy evaluation. Environmental dynamism moderates the
relationships between the three constructs and organizational performance.
STRATEGY FORMULATION
Practice of strategic
planning
STRATEGY FORMULATION
Intensity
STRATEGY IMPLEMENTATION
Comprehensiveness
STRATEGY IMPLEMENTATION
Alignment
STRATEGY EVALUATION
Accountability
STRATEGY EVALUATION
Strategic control
ORGANISATIONAL PERFORMANCE
ORGANISATIONAL COMPETITIVENESS
CONTROL VARIABLE
Organisational size
ENVIRONMENTAL DYNAMISM

99
Organizational size is used in the model to control for its possible confounding effects
on performance and competitiveness. In sum, the following are the hypotheses that
will be tested in this study.
H1: Practice of strategic planning (the use of strategic planning tools) is
positively related to organizational performance.
H2: Intensity of strategic planning is positively related to organizational
performance.
H3: Comprehensiveness of strategic plan implementation is positively
related to organizational performance.
H4: Alignment of strategic plan implementation is positively related to
organizational performance.
H5. Accountability is positively related to organizational performance.
H6. Strategic control is positively related to organizational performance.
H7. Organizational performance is positively related to organizational
competitiveness.
H8: Environmental dynamism moderates the relationships between
strategic plan formulation, implementation and evaluation in one side
and organizational performance on the other side. In detail:
H8a: Environmental dynamism moderates the relationship between strategic
planning practice and organizational performance.

100
H8b: Environmental dynamism moderates the relationship between intensity
of strategic planning and organizational performance.
H8c: Environmental dynamism moderates the relationship between
comprehensiveness of strategic plan implementation and
organizational performance.
H8d: Environmental dynamism moderates the relationship between
alignment of strategic plan implementation and organizational
performance.
H8e: Environmental dynamism moderates the relationship between
accountability and organizational performance.
H8f: Environmental dynamism moderates the relationship between strategic
control and organizational performance.
The conceptual model portrayed in Figure 1 is particularly useful to managers
in UAE for the following reasons. First, it links all three aspects of the strategic
management process with organizational performance and organizational
competitiveness. It allows managers to understand what the critical components of
strategic management process are in order to have superior performance. Second, by
including specific dimensions of strategy formulation, strategy implementation and
strategy evaluation, this model provides managers with detailed suggestions on each
component and encourages them to approach strategic management in a holistic
manner in order to effectively undertake this important task. Third, this study includes
environmental dynamism in the model. Environment dynamism has been discussed by
many researchers due to its importance in influencing the strategic management

101
process, in particular strategy formulation. Given that semi-government organizations
in the UAE are also constantly facing a changing competitive environment,
understanding the (moderating) impact of environmental dynamism should give
managers more practical guidance when making strategic decisions and implementing
them in turbulent conditions.
2.12 Chapter Summary
This chapter reviewed the literature on the concept and evolution of strategic
management. The researcher then discussed the research on strategy formulation,
strategy plan implementation and strategy evaluation. Strategy formulation has two
dimensions, namely, the practice of strategic planning measured by the use of strategic
planning tools and intensity. Strategy implementation was viewed as comprising two
constructs, namely comprehensiveness and alignment of strategy implementation.
Strategy evaluation was also reviewed with its two dimensions, namely accountability
and strategic control. In addition, the relationship between each of the above-
mentioned dimensions and organizational performance was reviewed. Based on the
literature, the researcher concluded that further research is needed to better understand
how specific dimensions of strategic management influence organizational
performance. The related constructs of the study were modelled into a conceptual
framework to address the existing gap identified in the literature. The environmental
dynamism is hypothesized to be the moderator in the model. The following chapter
discusses and describes the methodology aspects of this study.

102
Chapter 3: Methodology
3.1 Introduction
Chapter 2 examined the relevant literature in some detail and developed an
integrated conceptual framework for strategic management and organizational
performance. This chapter presents the research methodology. It discusses the research
characteristics in terms of the research hypotheses and questions. It describes the
philosophical research paradigm used in this study, before outlining the quantitative
research method. Finally, the techniques and tools used in collecting the data are
presented and discussed.
3.2 Research Questions
This research is aimed at providing a better understanding of the processes and
impacts of strategic management in the semi-government sector of Abu Dhabi, UAE.
The key research questions investigated are as follows:
1. What is the nature of the strategic plan formulation, implementation and
evaluation in Abu Dhabi’s semi-government sector?
2. What is the relationship between the strategic plan formulation,
implementation and evaluation elements and organizational performance?
Moreover, what is the impact of organizational performance on
organizational competitiveness?
3. Does environmental dynamism moderate the relationship between the
three areas of strategic planning and organizational performance?

103
3.3 Research Paradigm
Research paradigms are defined as the basic belief systems that guide
researchers to choose appropriate research methods (Guba, 1990). The key issues
confronting paradigms are mainly related to ontology, epistemology, axiology,
rhetoric and the chosen methodology (Creswell & Clark, 2011). Ontology concerns
the nature of reality (e.g., whether reality is subjective or objective). It specifies what
the researcher can study and make knowledge claims about (Guba & Lincoln, 1994).
Epistemology is the branch of philosophy that studies the nature of knowledge in terms
of its foundations, scope and validity and the process by which it is acquired
(Demopoulos, 2003). Axiology covers the role of values in the research, rhetoric refers
to the research language, and the chosen methodology reveals the procedures used by
a researcher to determine what she or he knows (Creswell & Clark, 2011). Every
paradigm is based on its own ontological and epistemological assumptions. These
assumptions will influence the methods that researchers use to conduct their research.
The research methods can be traced back through the methodology and epistemology,
to an ontological position (Scotland, 2012). The following paragraphs discuss three
common paradigms.
Among the many possible paradigms, the positivist and interpretivist types are
very common in management research. Darke, Shanks, and Broadbent (1998) and
Orlikowski and Baroudi (1991) suggest that the interpretivist approach is appropriate
for a piece of research when the researcher acknowledges that reality is subjective and
that research is not value free; research should not aim to discover repeatable patterns
in the investigated phenomenon, but the research is intended to provide in-depth
understanding of some phenomenon.

104
At the opposite extreme, the positivist paradigm, in the view of Orlikowski and
Baroudi (1991), is followed when the phenomenon of interest is single, tangible and
fragmental, and there can be a unique, best description of any chosen aspect of it (p.
9). In the positivist paradigm, the researcher seeks to identify a single truth that will
guide action now and in the future (Robson, 1993). The fundamental principle of
positivism is the ability of the researcher to make an objective analysis. Researchers
seek to provide interpretations of the data in a value-free manner. Therefore, from the
standpoint of positivist philosophy, the research technique used should be a highly
structured methodology to facilitate both replication and quantifiable observations that
lend themselves to statistical analysis (Saunders, Saunders, Lewis, & Thornhill, 2011).
The positivist philosophy embraces the idea that science is founded on logic and
mathematics – this provides a universal language and a formal basis for quantitative
analysis (Kołakowski, 1972). In this tradition, positivists seek to break down a
phenomenon into its components and then test the relationships between these
components (Robson, 1993).
However, the interpretivist and positivist approaches are not mutually
exclusive. Tashakkori and Teddlie (1998) argue that the contradiction between
paradigms is over. They describe pragmatically oriented researchers as those who can
use mixed methods in which elements of both quantitative and qualitative approaches
coexist. Similarly, Venkatesh, Chan, and Thong (2012) provide a consistent view of
the pragmatist paradigm: a peaceful coexistence of multiple paradigms, which is
feasible in a research inquiry (p. 2). Researchers should aim to employ mixed methods
research as long as they can overcome the practical challenges that may be encountered
in such an attempt (Venkatesh, Brown, & Bala, 2013). Pragmatism is the paradigm
providing the underlying philosophical framework for mixed-methods research

105
(Somekh & Lewin, 2005). The pragmatic paradigm is not committed to any one system
of philosophy or reality (Mackenzie & Knipe, 2006). Early pragmatists rejected the
notion that social enquiry could access the 'truth' about the real world solely by using
a single scientific method (Mackenzie & Knipe, 2006). Pragmatist researchers
nowadays focus on the 'what' and 'how' of the research problem; they place the research
problems in the center and apply all possible approaches to understanding them
(Creswell, 2003).
In this study, a positivist paradigm was chosen because the researcher believes
that “knowledge is real, objective and out there in the world” and that it can be
“observed, measured and quantified” objectively (Sikes, 2004; cited in Jackson, 2013,
p. 50). This perspective of the researcher, along with the nature of the research and
topic under investigation, dictated the adoption of a positivist approach. Such an
approach ensures that the researcher can:
1. measure the elements of the study objectively (through the already
established robust measures of each of the variables under investigation),
2. describe the sample in numerical terms and examine the relationships
between the elements of study; and
3. reach a large enough sample to draw meaningful conclusions and
generalize findings to a population.
These three benefits are the fundamental principles in the positivistic
development of the research methodology in the present study.

106
3.4 Questionnaire Development and Pretesting
3.4.1 Scaling
The survey is developed on the basis of the literature review and conceptual
framework that occupied the previous chapters. It consists of six main sections:
strategic plan formulation, strategic plan implementation, strategic plan evaluation,
organizational performance, organizational characteristics and general information.
In measuring the items representing the theoretical constructs shown in the
conceptual model, we used the multi-scaling method: some questions used the Likert
Scale, and others were open-ended. Malhotra and Birks (2007) describe scaling as the
process of locating the respondents on a continuum. Answers using the Likert scale
are easy to elicit and administer. In addition, the format of the scale is easy for the
respondent to use. Researchers have indicated that five or seven point Likert scales are
normally adequate for most measures (Hinkin, 1995). The use of this scale helps to
increase the response rate by minimizing the informants’ time and effort. This study
used five-point Likert scales.
For example, the scaling procedure for some items was a five-point Likert
Scale anchored on 1 = never, and 5 = always. For other items, the five-point Likert
Scale ranged from 1 = strongly disagree to 5 = strongly agree. For firm performance,
the scale ranged from 1 = much worse to 5 = much better. The scale that measured the
use of strategic planning tools was a five-point scale ranging from 1 = never to 5 =
always. The researcher added a column to help respondents who were not familiar with
any of the tools to reflect this fact, namely, ‘not familiar with’. The actual scales that
were used in the questionnaire are presented in Appendix A.

107
The following section contains detailed information on the measurement items
for each construct.
3.4.1.1 Strategic Plan Formulation
This section includes questions asking about the involvement of the individuals
concerned in the formulation of a strategic plan, what planning tools are used in the
strategic plan and the intensity of the strategic planning.
A five-point scale was used to measure the responses for each of the strategic
plan formation items. Respondents were asked to indicate the extent to which they
used specific planning tools (such as gap analysis, SWOT analysis, etc.) in the
formulation of their organizational strategic plans. These items were drawn from the
research of Elbanna (2010, p. 34) and Aldehayyat, Al Khattab, and Anchor (2011, p.
483). In addition, the research instrument included one question with six items
designed to measure the respondents' perceptions of the intensity of their
organizations’ strategic planning process. The items for intensity were adapted from
the research of Schäffer and Willauer (2003, p. 97). Respondents were asked to
indicate the level of their agreement with each statement by circling their response on
a five-point scale, anchored by 1 – strongly disagree 'and 5 – strongly agree’. One of
the items is reverse coded, as shown in Table 2 below, which summarizes Section A
in the survey, namely, the measurement items of strategic plan formulation, their
sources, and their corresponding numbers in the survey instrument distributed to the
respondents.

108
Table 2: Strategic Plan Formulation Items
Variable Sources Items Practice of Strategic Planning
Aldehayyat, Al Khattab, and Anchor (2011); Elbanna (2010)
Pro forma financial statements (e.g., cash flow, income statement and budget) Cost-benefit analysis Benchmarking Gap analysis Balanced scorecard Value chain analysis Spread sheet “what if” analysis SWOT analysis PEST (Political, Economic, Social and Technological) analysis Portfolio analysis (e.g., Boston consulting matrix or General Electric matrix or General Electric matrix) Porter’s five forces analysis
Intensity of Strategic Planning
Schäffer and Willauer (2003)
Everything that has to be planned is studied carefully during the process of strategic planning. During the process of strategic planning, we analyse each decision very carefully. During the process of strategic planning, many alternatives are evaluated carefully. Those who are involved in strategic planning analyse and evaluate projects carefully. Strategic planning is a very demanding process. Those who are involved in strategic planning spare no effort. (reverse coded)
3.4.1.2 Strategic Plan Implementation
Strategic plan implementation includes thirteen items that capture the
comprehensiveness and alignment of the strategic plan implementation. The
comprehensiveness refers to the extent to which an organization attempts to be
exhaustive or inclusive in making and integrating strategic decisions (Grover &
Segars, 2005). It also indicates the extent to which key organizational decision makers
are inclined to use an extensive process for making decisions (Elbanna & Child, 2007;
Forbes, 2005; Miller, 2008). The items for measuring comprehensiveness were
adapted from the study of Hakimpoor (2014, p. 10). Alignment refers to the extent to

109
which organizations align their resources with the strategic plan. The items for
measuring alignment are based on the study of Higgins (2005, p. 5). Higgins (2005, p.
5) proposes the Eight Ss of Successful Strategic Plan Execution, as follows: Strategic
plan and Purposes, Structure, Systems and Processes, Style (leadership/management
style), Staff, reSources, Shared Values (organizational culture) and Strategic
Performance. The items for this study were designed to capture whether organizations
aligned these eight Ss with their organizational strategic plans.
A five-point scale was used to measure the responses for each of the thirteen
(13) strategic plan implementation items. Respondents were asked to indicate the
extent to which they agreed or disagreed with each one of the statements in terms of
the comprehensiveness and alignment of their organizations’ strategic plan
implementation. One (1) respondent indicated that they strongly disagreed with the
statement, while five (5) respondents indicated that they strongly agreed with it. Table
3 (provided on the following page) shows the measurement items of the strategic plan
implementation, their sources, and their corresponding numbers in the survey
instrument distributed to the respondents.
Table 3: Strategic Plan Implementation Items
Variables Sources Items Comprehensiveness of Strategic Plan Implementation
Hakimpoor (2014)
We use a diverse set of ideas from internal and external sources (rather than from limited internal sources) in implementing our strategic plan. We evaluate thoroughly each possible action before implementing our strategic plan. We attempt to determine optimal courses of action for how to best implement our strategic plan.

110
Variables Sources Items We use the experiences of managers from different management levels while implementing our strategic plan. We search extensively for possible implementation actions before we actually implement our strategic plan.
Alignment of Strategic Plan Implementation
Higgins (2005)
Our people have the necessary skills to implement our strategic plan effectively. When our people don’t have the necessary skills for implementing our strategic plan, we hire new staff with the necessary skills. Our systems and processes (e.g., reward systems, manufacturing processes, information systems, etc.) are aligned to make our strategic plan work. We have a formal assignment of organizational specializations, authority, and responsibility. Our organizational culture (e.g., the values that are shared by organizational members) is in alignment with our strategic plan. The behaviors/ decisions of our managers are consistent with the requirements of our strategic plan. We allocate the resources (e.g., money, technology, staff, etc.) that are necessary to support our strategic plan. We plan and decide according to our established strategic plan.
3.4.1.3 Strategic Plan Evaluation
The third section in the survey was strategic plan evaluation. The aim of this
section was to assess the accountability, and strategic control of the strategic plan
evaluation. The measurement of accountability was based on the studies of Cavalluzzo
and Ittner (2004, p. 252) and Elbanna (2013, p. 453). Strategic control has three
components: premise control, implementation control, and strategic surveillance

111
(Schreyögg & Steinmann, 1987). Following the practice of Schreyögg and Steinmann
(1987, pp. 95-98), four items were newly developed to measure these three
components. All the items were worded in a way that would fully reflect the concepts
of the three types of strategic control. In addition, some further explanations were
included to make the questions easy to follow. For instance, the first item explains
what environmental conditions are by adding “e.g., forecasts of inflation or market
growth rate, etc.” Each item was measured on a 5-point scale where 1 stood for
strongly disagree and 5 for strongly agree. Table 4 on the following page presents the
measurement items of the strategic plan evaluation, their sources, and their
corresponding numbers in the survey instrument distributed to the respondents.
Table 4: Strategic Plan Evaluation Items
Variables Sources Accountability Cavalluzzo
and Ittner (2004); Elbanna (2013)
Our organization conducts regular audits/reviews of our programs/activities. Our organization benchmarks its performance on key indicators against comparable organizations. Managers at my level are held accountable for the results of their activities. The individual to whom I report periodically reviews my results with me.
Strategic Control
Schreyögg and teinmann (1987)
After we develop or implement our strategic plan, we engage in a systematic and continuous effort to identify if the environmental conditions (e.g., forecasts of inflation or market growth rate, etc.) forming the basis of our plan have changed so that we can update our assumptions and strategic plan. We focus on the accomplishment of the objectives of our strategic plan. Once implementation of our strategic plan has begun, we engage in a systematic and continuous effort to identify and appraise the unforeseen effects of the implemented decisions so that we can assess whether we should change our course of action.

112
Variables Sources During the development and implementation of our strategic plan, we engage in a systematic and continuous effort to monitor the full range of emerging events inside and outside our organization which are likely to threaten the course of our strategic action, so that we can uncover important yet unanticipated information and safeguard our strategic plan on a continuous basis.
3.4.1.4 Organizational Outcomes
Organizational performance is the first dependent variable in the research
model of this study. The measure of organizational performance includes both
financial performance aspects (such as sales growth, market share, return on
investment, etc.) and nonfinancial performance aspects (such as corporate social
responsibilities, operational efficiency, customer satisfaction, etc.) We measured
organizational performance through respondents’ subjective assessments, using
measures from the previous literature (i.e., Zuriekat, Salameh, and Alrawashdeh
(2011, p.165); Vorhies and Morgan (2005, p. 92); Hart and Banbury (1994, p. 259);
Ruekert, Walker, and Roering (1985, p. 20), and Child (1972, p. 18). Respondents in
the present study were asked to evaluate their organization’s performance, in relation
to similar organizations at the present time. Statements were again to be placed on a
5-point scale, where 1 represented much worse [i.e. than before], 2 worse, 3 similar, 4
better and 5 much better. The competitiveness of the organization was evaluated, too.
These items were newly developed on the lines of the study by Ruekert, Walker Jr,
and Roering (1985, p. 20). Table 5 on the following page presents the measurement
items of the Organizational Performance, their sources, and their corresponding
numbers in the survey instrument distributed to the respondents.

113
Table 5: Organizational Performance
Variables Sources Items Organizational Performance
Zuriekat, Salameh, and Alrawashdeh (2011); Vorhies and Morgan (2005); Child (1972); Hart and Banbury (1994)
Quality of products or services provided Development of products/services Employee satisfaction Customer satisfaction Sales/revenues growth Market share Return on investment Corporate social responsibilities Operational efficiency
Organizational Competitiveness
Child (1972); Ruekert, Walker Jr, and Roering (1985)
Adapting to the changes in competitors’ market strategies. Rapid adaptation of products or services to changes in clients’ needs. Rapid reaction to new threats in the market. Rapid exploitation of new market opportunities.
3.4.1.5 Environmental Dynamism
Dynamism refers to the rate of change and innovation in an industry and also
to customers’ uncertain actions (Li & Liu, 2014). To measure environmental
dynamism, the researcher used a scale developed and validated by Li and Liu (2014,
p. 2798).
Table 6 presents the measurement items of the environmental characteristics,
their sources, and their corresponding numbers in the survey instrument distributed to
the respondents.
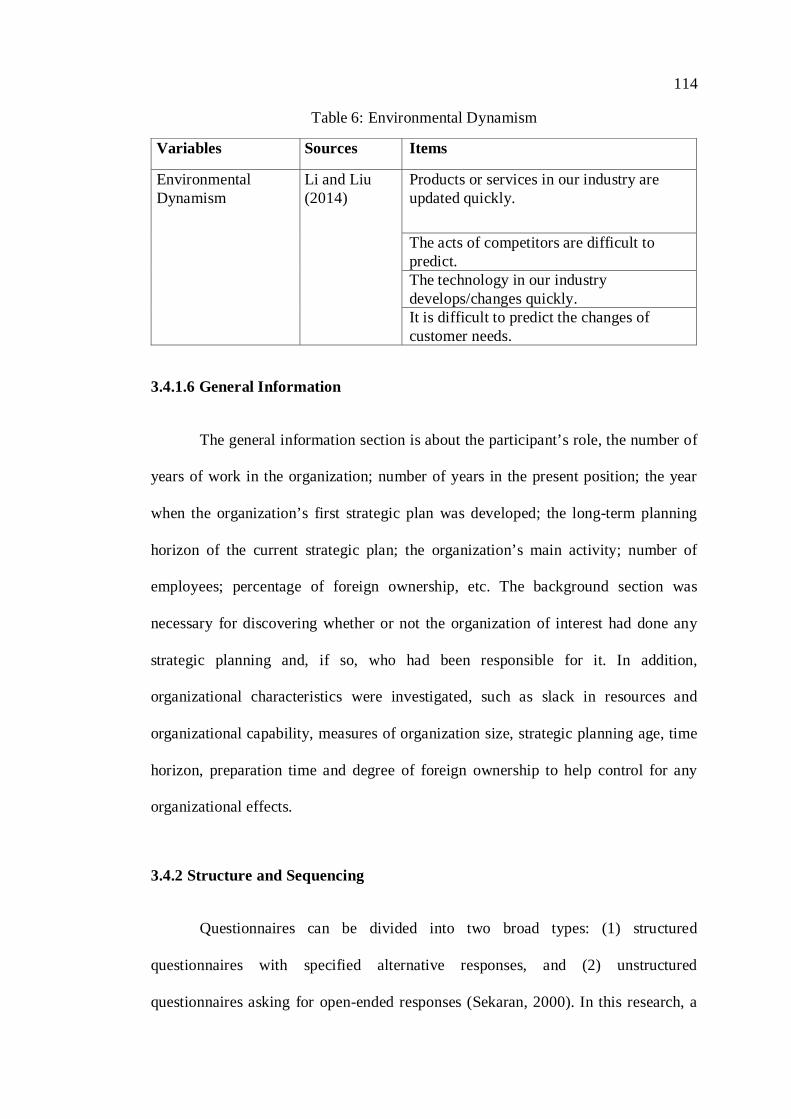
114
Table 6: Environmental Dynamism
Variables Sources Items
Environmental Dynamism
Li and Liu (2014)
Products or services in our industry are updated quickly.
The acts of competitors are difficult to predict. The technology in our industry develops/changes quickly. It is difficult to predict the changes of customer needs.
3.4.1.6 General Information
The general information section is about the participant’s role, the number of
years of work in the organization; number of years in the present position; the year
when the organization’s first strategic plan was developed; the long-term planning
horizon of the current strategic plan; the organization’s main activity; number of
employees; percentage of foreign ownership, etc. The background section was
necessary for discovering whether or not the organization of interest had done any
strategic planning and, if so, who had been responsible for it. In addition,
organizational characteristics were investigated, such as slack in resources and
organizational capability, measures of organization size, strategic planning age, time
horizon, preparation time and degree of foreign ownership to help control for any
organizational effects.
3.4.2 Structure and Sequencing
Questionnaires can be divided into two broad types: (1) structured
questionnaires with specified alternative responses, and (2) unstructured
questionnaires asking for open-ended responses (Sekaran, 2000). In this research, a

115
structured questionnaire was developed for greater simplicity in the administering and
analysing stages and for reliability (Churchill, 1979). Closed-ended questions were
used for all sections of the questionnaire, except some questions in the general
information section. The closed-ended questions allowed respondents to make quick
choices among several options (Sekaran, 2003), thereby reducing the time needed for
completion. For questions related to general information, such as the year that the
respondent’s organization developed its first strategic plan, an open-ended format was
applied. The questions were carefully designed with appropriate language and wording
and the questions were as brief as was compatible with fulfilling the purpose of the
questions. Some of them used reverse scaling, which is the use of reverse coded items
on scales. This study used the reverse scaling method to reduce response bias
(Papadakis & Barwise, 1998).
A five-point scale was employed in this study. The sequence of the questions
was carefully considered. The closed-ended questions included the most important
information and were thus located before the open-ended questions. Within the closed-
ended question section, the measurement items were arranged by following the logic
of the independent variables (strategic plan formulation, strategic plan implementation
and strategic plan evaluation), dependent variables (organizational performance and
organizational competitiveness), a control variable (organizational size), and a
moderator (environmental dynamism).
3.4.3 Pre –Test
Pre-testing, the last stage in the questionnaire design, is used to test the
questionnaire on a small sample of respondents to identify and eliminate potential

116
problems with various aspects of the questionnaire to be distributed to the target
companies, such as the wording of questions, response categories, etc.
(Diamantopoulos, Reynolds, & Schlegelmilch, 1994; Malhotra & Birks, 2007).
Pre-testing is in line with Churchill (1979), who suggests refining the measures
through asking for advice from people who are capable of understanding the nature of
the concept being measured. Similarly, Campanelli (2008) suggests using domain
experts to evaluate and comment on the survey design and questions before the survey
instrument is finalized. Following these and similar suggestions, this study used pre-
testing to evaluate the questionnaire items developed in terms of various aspects, such
as:
• Were the items appropriate for the UAE context?
• Were the items easy to understand (without highly technical terminology)?
• Were any important points missing?
• Were there any unexpected difficulties/problems in collecting the data?
Obtaining responses to these and similar questions helps researchers to
enhance the survey instrument by excluding and/or rephrasing some questionnaire
items; and in turn establish content validity (see Chapter 3.9).
Campanelli (2008) notes that a group of three (3) to four (4) experts in addition
to the researcher is an ideal number for the purpose of evaluating a survey. To benefit
from expert opinions, a draft of the questionnaire, once completed, was collected from
ten executives in Abu Dhabi who are experts in strategic management in their own
organizations. A research assistant who is quite experienced in conducting survey
research and interviewing managers distributed and collected the pre-test

117
questionnaires in person. During the pre-testing, participants had the opportunity to
comment on each item separately and on the survey instrument as a whole.
Feedback from pre-testing was used to further revise the questionnaire, with
particular regard to the interpretability of the measures, instructions and response
formats. For example, some executives found that it was hard to answer the questions
related to the management tools, since they were not familiar with the term “Pro forma
financial statements”. Consequently, the researcher added some examples, such as
cash flow, income statement and budget, in brackets to clarify what was meant.
Similarly, the four items of strategic control were rewritten to better reflect three
critical components: premise control, implementation control, and strategic
surveillance. In addition, the scale that measured the use of strategic planning tools
was a five-point scale ranging from 1 – never to 5 – always. We also added a column
to help respondents who were not familiar with any of the tools to reflect this fact,
namely, ‘not familiar with’. Furthermore, in the general information section, instead
of asking the respondents to specify the exact number of full time and expatriate
employees, the questions were designed as closed-ended questions so that respondents
could estimate the range without being put under pressure to provide exact numbers.
The length of time for completion was recorded. The final questionnaire was
expected to take 20-25 minutes to complete, which is suggested as a reasonable
response time, avoiding fatigue and negative emotions among the respondents
(Flowerdew & Martin, 2005).
After the above revisions, the actual field survey for data collection was
completed using a large and representative sample, as described below.

118
3.5 Sampling
3.5.1 Unit of Analysis
Researchers must clearly define the unit of analysis for the study (Zikmund,
2000). It indicates the level of investigation upon which the study focuses (Malhotra,
Hall, Shaw, & Oppenheim, 2002). The unit of analysis also determines how a scale is
treated (Hair, Anderson, Tahtam, & Black, 2006). Once the unit of analysis is
determined, the research method will be developed in response. This study is looking
at the influence of strategic plan formulation, strategic plan implementation and
strategic plan evaluation on organizational performance and the way in which the latter
influences organizational competitiveness. Hence, in line with others (e.g. Matanda &
Freeman, 2009; Styles, 1998), a single semi-government organization was chosen as
the unit of analysis. In other words, our unit of analysis was the organization.
Organizations can be classified as pure government, quasi organizations (semi-
government) and purely private organization. According to Moe (2001) the second
category (quasi or semi-government) consists of state owned corporations, business
enterprises or public sector undertakings created for the purpose of commercial
activities by the government itself. Semi-government organizations can also be
independent governmental corporations formed by the government to perform a set of
public functions or a particular service (Osborne & Gaebler, 1992). This study chose
to adopt Moe’s definition of a semi-government organization.

119
3.5.2 Key Informants
In organizational research, a single-key informant approach is the most
commonly used method to collect data (Kumar, Stern, & Anderson, 1993). In the
present study, we also used the single-key informant approach. The key informant was
a senior executive in a firm, such as a chief executive officer (CEO), president,
managing director, or senior manager. The senior executives were chosen if they met
certain criteria. First, they could be considered the most appropriate respondents due
to their broad knowledge of the organizations’ strategic activities. They would be the
ideal person from whom to elicit information about the organization’s strategies.
Second, they have considerable knowledge of the specific activities of the firm and
much experience with strategic management in general. Generally, it is the senior
executives who make the key strategic plans.
3.5.3 Sampling Technique
To identify the target population (i.e., semi-government organizations) for
distributing the questionnaire, several databases were used, e.g., the UAE government
website and databases from other websites (i.e. https://www.abudhabi.ae). We needed
the list of semi-government organizations that these websites provided because, to our
best knowledge, there is no database that lists all the semi-government organizations
in the UAE.
The final list contained two hundred and ten (210) semi-government
organizations, which represent most of the semi government organizations in Abu
Dhabi, as far as we can tell from our observation as a high-level manager of a semi-
government organization and from talking to colleagues in other such organizations.

120
All organizations included in the sample were targeted in the present study. All
questionnaires altogether were distributed and one-hundred and eighty-two (182)
completed questionnaires were collected and included in the analysis, representing a
response rate of 86.6 % (182/210). The responding organizations included semi-
government organizations in a range of industries. Such variety is representative of the
semi-government organizations in Abu Dhabi.
The study limited its population to semi-government organization in Abu
Dhabi, for two main reasons. First, organizations’ resources and strategic plans in the
UAE might vary from one emirate to another; thus, we might need to control for the
unknown effects of emirate (Elbanna, 2013). Second, Abu Dhabi is the capital city of
the UAE and is also one of the two main centers of business and economic activity in
UAE; the other is Dubai. Examples of the semi-government organizations in Abu
Dhabi are ADNOC and its group of companies, Mubadala and its group of companies,
Abu Dhabi Walter and Electricity and its group of companies, Abu Dhabi National
Hotels, the Cleveland Clinic in Abu Dhabi, the Diabetes Centre of Imperial College,
London (ICLDC), Musanada, Al Yah Satellite communication company (Yahsat),
Abu Dhabi Finance, Emirates Aluminium (EMAL), Dolphin Energy, Emirates LNG,
Tabreed National Central Cooling Company in Al Dar, Emirates Ships Investment
Company, Abu Dhabi Ports Company, Advance Military Maintenance Company
(AMROC), Injazat company, etc.
As is made clear throughout, this study uses path analysis, a special case of
structural equation modeling (SEM) analysis, to test its hypotheses. While SEM is
used to evaluate a model with both observed variables (indicators) and unobserved
(latent) variables, path analysis is used to evaluate models with only observed variables

121
(Garson, 2012) cited in Elbanna, Thanos, & Colak (2014). SEM analysis requires a
larger sample size than path analysis does. The sample size of this study is 182; given
that a sample size of 100-200 is considered an acceptable (medium) sample size (Kline,
2015), path analysis is preferred to SEM analysis here to avoid the invalid estimations
that SEM might have produced with a sample size of 182(Nasser & Takahashi, 2003),
cited in Elbanna et al. (2014).
3.6 Data Collection Procedures
This study used the drop off and pick up method in collecting data since it is
widely and successfully used in the Arab Middle East in general and the UAE in
particular (Elbanna, 2012). The respondents were notified by telephone and email
about the forthcoming survey before the questionnaires were made available. This
method is suggested for the sake of maximizing the response rate (Sekaran, 2003). The
questionnaire that followed was accompanied by a cover letter.
The cover letter contained a statement of the research purpose and of the
importance of the organization’s participation, together with a promise that a summary
of the findings would be provided to participating organizations and that research
confidentiality would be maintained (see Appendix A).
The questionnaire was personally delivered by a trained research assistant. We
gave him some training in collecting the completed sheets. When distributing the
questionnaires, this trained researcher was able to offer guidelines to the respondents,
stressing the value of their cooperation and the benefits they could obtain by taking
part. After one week of distributing the survey instruments, a follow up call was made
to the participating organizations. Then, after another week, the questionnaires were

122
personally collected by the research assistant. The whole process of data collection,
including training the research assistant, was carried out between August 15, 2105 and
November 15, 2015.
3.7 Ethical Considerations
The survey and explanatory statements are all in English. The explanatory
statements were prepared to give the participants in-depth information about the aims
and objectives of the research; how their contact details were obtained; how the
privacy of their personal and organizational information would be assured; the
importance of completing all the questions even if they looked similar; and the promise
to send a copy of the report to anyone interested in the research result (see Appendix
A for the explanatory statements and survey).
In order to improve the response rate, this study tried to ensure that the
respondents had little concern over the confidentiality of the survey, including the
following in the explanatory statement.
“Please be assured that your responses will be kept strictly confidential. Only
aggregated results will be reported, with no references made to individual responses,
respondents, or companies.”
3.8 The Analysis Process
The flow-chart (Figure 2 on the next page) provides an overview of the way in
which the analysis processes were carried out in the present study. A sequence of steps
was followed in developing the scale. It involves a number of exploratory factor

123
analyses and examines the internal reliability of the data set using item-to-total
correlations and Cronbach’s alpha coefficients. Items which fulfilled all requirements
in the exploratory factor analysis were then submitted to a reliability analysis to
measure the item-total correlations and Cronbach’s alpha before using them in further
analysis. This procedure was undertaken to sustain the reliability and validity of the
data. Then, as indicated above, structural equation modelling (path analysis) was used
to test the hypotheses.

124
Figure 2: Model of the Data Analysis Process
Primary Data from Questionnaire
Descriptive Analysis of Data
Validity and Reliability Testing
Item(s) Removal/Purification Process
• Exploratory Factor Analysis
• Item-to-total correlation (Rejection of items if correlation is less than 0.30).
• Cronbach’s alpha coefficient (Acceptance of dimensions of constructs with a
minimum Cronbach alpha equaling and above 0.60.)
Analysis of Data for Three Purposes
1. To identify the current stance of strategic plan formulation, implementation and evaluation
2. To evaluate the effect of strategic plan formulation, implementation and evaluation on organizational performance.
3. To test the moderating effect of the environmental dynamism
Descriptive Analysis
Path Analysis (Structural Equation
Modelling)
Path Analysis (Structural Equation
Modelling)

125
The data analysis in this study has three main objectives:
1. To identify the current stance of strategic plan formulation,
implementation and evaluation.
2. To evaluate the effect of strategic plan formulation, implementation and
evaluation on organizational performance and the impact of the latter on
organizational competitiveness.
3. To test the moderating effect of environmental dynamism on the
relationship between strategic plan formulation, implementation and
evaluation, and organizational performance.
3.9 Data Analysis Method
The data were subjected to a range of statistical analyses, designed to address
the following research objectives: a) examine the relationship between strategic plan
formation, strategic plan implementation, strategic plan evaluation and organizational
performance; and b) identify how environmental characteristics moderate these
relationships. The data analysis proceeded as follows.
More detailed information about the reliability and validity, structural equation
modeling analysis and moderation analysis is given in the following section.
3.9.1 Reliability and Validity
3.9.1.1 Reliability
Reliability is defined as “the amount of agreement between independent
attempts to measure the same theoretical concept” (Bagozzi & Heatherton, 1994, p.

126
17). Reliability has two different meanings, referring to (1) the scale’s internal
consistency; and (2) its stability over time. Since this study uses cross-sectional data,
only the reliability of the scale’s internal consistency was tested. Internal consistency
reliability refers to the degree to which the items jointly measure the same construct
(Henson, 2001).
To assess the reliability of the scales used in this study, item-to-total
correlations and Cronbach’s (1951) coefficient alpha (Henson, 2001) were calculated.
The latter indicates the internal consistency of a scale. An item-to-total correlation of
0.30 and above is considered enough for an item to have high reliability (Cooper &
Emory, 1995). The value of 0.60 is recommended as the minimum level of Cronbach’s
alpha. If an item’s Alpha is less than 0.6, it is recommended to remove the item. To
prepare the constructs for these procedures of reliability assessment and also establish
their validity, exploratory factor analysis was used (see Chapter 4). It should also be
noted at this point that the validity of the scales was also assessed by confirmatory
factor analysis (see Chapter 5). Certain requirements had to be fulfilled before factor
analysis could be successfully employed. One of the important requirements was to
measure the variables by using interval scales. Using a 5-point Likert scale in the
survey questionnaire fulfilled this requirement. A number of reasons account for this
use of Likert scales. First, they communicate interval properties to the respondent, and
therefore produce data that can be assumed to be interval-scaled (Madsen, 1989;
Schertzer and Kernan, 1985). Second, in the strategic management literature, Likert
scales are almost always treated as interval scales (see for example, Aaker et al., 1995;
Bagozzi, 1994; Kohli and Jaworski, 1990; Nerver and Slater, 1990; Tansuhaj et al.,
1989).

127
Another important requirement is that the sample size should be more than
100; a researcher generally cannot use factor analysis with fewer than 50 observations
(Hair et al., 1998). Bartlett's Test of Sphericity and the Kaiser-Meyer-Olkin Measure
of Sampling Adequacy were used to assess if the sample size was enough to carry out
exploratory factor analysis.
Factor extraction results using Principal Component Analysis (PCA) are given
in the tables in Chapter 4. It should be noted that an eigenvalue of 1.0 is used as the
benchmark in deciding the number of factors (Hair et al., 1998; Norusis, 1993). The
Varimax technique for rotated component analysis was used with a cut-off point for
interpreting the factors at 0.40 or greater.
3.9.1.2 Validity
Validity refers to “a process of accumulating evidence to support inferences”
(American Psychological Association, 1985, p. 9). There are three types of validity
check, namely, checks of content, construct and criterion validity (Malhotra et al.,
2002).
Content validity measures “the degree to which the content of the items
adequately represents the universe of all relevant items under study” (Cooper &
Schindler, 2001, p. 211). This study tried to maximize content validity as follows.
First, the items used in this research were adopted/adapted from the relevant literature.
Previous researchers had validated these items. The newly developed items (i.e., four
items for strategic control and four items for organizational competitiveness) were also
based on the current literature (Ruekert et al., 1985; Schreyögg & Steinmann, 1987)
and were carefully worded. Once the final pool of scale items had been generated,

128
content validity was then assessed by four academics familiar with the strategic
management literature. This is consistent with prior research (Cooper & Schindler,
2001, p. 211; Narver & Slater, 1990). Each person worked independently and assessed
the statements of each variable for clarity and relevance. Their task was to identify any
overlapping, ambiguous or irrelevant items and to assess whether the scale items
generated captured the nuances of the brand orientation construct and the salient
activities associated with managing brand identity, architecture, communications and
value. Second, the survey instrument was pre-tested with senior executives who are
experts in strategic management in their respective organizations. These managers
further checked the questionnaire items.
Construct validity is defined as the extent to which an instrument measures the
concept that it aims to measure (Churchill & Iacobucci, 2002). Campbell and Fiske
(1959) proposed two aspects of construct validity: convergent and discriminant
validity. Convergent validity refers to “the degree to which multiple attempts to
measure the same concept are in agreement” (Bagozzi, Yi, & Phillips, 1991, p. 423).
Thus, the items that are indicators of a specific construct should converge or share a
high proportion of variance (Campbell & Fiske, 1959; Hair et al., 2006). Discriminant
validity involves demonstrating whether a construct can be differentiated from other
constructs that may be somewhat similar (Malhotra et al., 2002). This study used
exploratory (see Chapter 4) and confirmatory factor analysis (see Chapter 5) to test
both convergent and discriminant validity. The underlying premise was that items
purporting to measure distinct constructs should not load onto the same factors when
subjected to factor analysis.

129
Criterion-related validity refers to the extent to which one measure estimates
or predicts the values of another measure or quality (Reynolds & Fletcher-Janzen,
2007). There are two types of criterion-related validity: predictive validity and
concurrent validity. The main difference between these two types is the time when
predictor and criterion data are collected. In this study, since all the data were collected
at the same time, only concurrent validity was assessed. Concurrent validity can be
assessed by checking the correlation between the measuring instrument and the
criterion variable. When the correlation is high, the instruments are considered to have
criterion validity (Churchill & Iacobucci, 2002).
3.9.2 Structural Equation Modelling
As indicated earlier, this study used path analysis, a type of structural equation
modelling (SEM) technique, via the AMOS 22 software package, to test the
hypotheses posited. The factor means were employed as single item indicators to
perform path analysis, applying the maximum likelihood estimates (MLE) method,
following the guidelines suggested by Joreskog & Sorbom (1982).
3.9.3 Moderation Analysis
In this study, we also examined the moderating effects of environmental
dynamism on the relationships between strategic plan formulation, strategic plan
implementation, strategic plan evaluation and organizational performance.
A moderator is a variable that influences the direction and/or strength of the
relationship between an independent variable and a dependent variable (Baron &
Kenny, 1986). Figure 3 below illustrates a moderator model.

130
The model has three causal paths that feed into the outcome variable: the
impact of the focal predictor (Path a); the impact of the moderator (Path b), and their
interaction (Path c). The moderating effect is supported if the interaction (Path c) is
significant. Although the main effects of the focal predictor and moderator (Paths a
and b) could be significant, they are not directly relevant conceptually to examining
the moderating effects (Baron & Kenny, 1986).
Figure 3: Moderator Model
Source: based on (Baron & Kenny, 1986).
To evaluate the moderating effect of environmental dynamism, we used the
methodology of Zhao and Cavusgil (2006), who suggested a two-group model
approach. The sample was split into two groups according to the mean score of the
environmental characteristics of the participating companies. The data above the mean
(3) were defined as high and supportive environmental characteristics, and the data
below the mean as low in environmental support. A two group AMOS model was used
later in order to determine whether or not there was any significant difference between
the structural parameters of the high environmental characteristics group and those of
the low environmental characteristics group. In the first analysis, the parameter from
the environmental characteristics was constrained to be equal. In the second, the

131
parameter was kept free (not constrained). Differences in the T values between the two
models determined whether the degree of environmental characteristics had a
moderating effect on the relationship between the strategic planning processes and
company performance. The T statistic was calculated according to the following
equations (Cohen, 1983):
𝑇𝑇 = 𝑝𝑝𝑝𝑝𝑝𝑝ℎ_ℎ𝑖𝑖𝑖𝑖ℎ − 𝑝𝑝𝑝𝑝𝑝𝑝ℎ_𝑙𝑙𝑙𝑙𝑙𝑙
𝑆𝑆𝑆𝑆� 1𝑛𝑛1
+ 1𝑛𝑛2
𝑆𝑆𝑆𝑆 = �(𝑛𝑛1 − 1)2(𝑆𝑆.𝐸𝐸1)2 + (𝑛𝑛2 − 1)2 (𝑆𝑆.𝐸𝐸2)2
𝑛𝑛1 + 𝑛𝑛2 − 2
SP: polled standard deviation
3.9.4 Handling the Missing Data
This part presents some popular methods of treating missing data, including
the method chosen for this study. There are two conventional methods of dealing with
missing data: first, case deletion, which eliminates all questionnaires with missing data
and analyzes the data disadvantages: 1) it significantly decreases the number of cases
available for analysis; and 2) data are not always missing entirely at random. This
method biases the data distribution and statistical analysis (Briggs et al.,2003). The
second method is the imputation method, which replaces each missing value with a
reasonable guess, and then carries out the analysis as if no values were missing. With
this method, the calculated means of the non-missing values are used to impute the
missing values.

132
The imputation method is one of the most commonly used methods (Allison,
2001; Edgar, 2004; Briggs et al., 2003). Therefore, it seems prudent to replace the
missing data for a given feature in this study by the mean of all the known values of
this attribute that pertain to the instance with the missing feature. Appendix (B)
includes a table which summarizes the numbers of the missing data.
3.10 Chapter Summary
This chapter described the research paradigm and methodology. Scale items
were generated on the basis of the current literature. The discussion then turned to the
research design employed in this study and the sampling methodology adopted.
Samples were drawn from both government databases and other websites. Due to the
risk of a low response rate if we asked senior executives to participate in the survey
via postal mail, this study used the drop off and pick up method to collect its data.
Reliability and validity tests were conducted. Structural equation modeling was used
to test the hypotheses concerned with strategic plan formulation, strategic plan
implementation, strategic plan evaluation and organizational performance and
between the latter and organizational competitiveness. Moderation analysis was used
to identify how environmental dynamism moderates the relationships between
strategic planning elements and organizational performance. The following chapter
further discusses the data analysis procedures and results.

133
Chapter 4: Purification of Measures and Descriptive Analysis
4.1 Introduction
This chapter is concerned to analyze the reliability and validity of the research
measures and make a descriptive analysis of the sampled organisations and
respondents. First, the data were edited, coded and entered on SPSS. Second, the
descriptive analysis of the data provided some qualitative insights in investigating,
describing and discussing the data obtained in terms of their value and contribution to
the aims of the research. Third, as part of the process of purifying the measuring
instruments, Cronbach’s alpha was used as an indicator of the reliability of the scale
measurement. Content validity was considered and factor analysis was used to
examine it. Finally, the sampled organisations and respondents were descriptively
analysed. It should be noted that this chapter is restricted to the purification analysis
of the collected data and the presentation of the descriptive analysis of the sampled
organisations and respondents.
4.2 Data Preparation and Purification of Measures, and Reliability Analysis
The first step in preparing the data for analysis was the process of data editing,
coding and entering on SPSS. First, the raw data were edited for the purpose of
detecting any errors and omissions, correcting them where possible, and certifying that
the relevant data quality standards had been met. Second, the study variables were
coded into formats for the statistical Package for the Social Sciences (SPSS) version
22 that was used in the data analysis. Each variable was given a unique label. This step
helped in setting up the computer software to analyse the data. Then SPSS was used
to enter the data. Each questionnaire received was first checked for errors and

134
omissions, before the answers were entered manually into the computer and the data
became ready for analysis.
According to Nachmias and Nachmias (1996), after collecting the data,
researchers must follow certain steps in order to obtain meaningful results from the
analysis stage. This section discusses these steps in detail.
After the entry and recording processes had been completed, all the measures
were purified by assessing their reliability and validity. There are a number of reasons
for emphasising the reliability and validity of the measurements. One, a reliable and
valid measuring instrument enhances the methodological rigour of the research; two,
it permits a co-operative research effort and provides support for the triangulation of
results; and three, it provides a more meaningful explanation of the phenomena that
are being investigated (Hair et al., 2006).
In this study the reliability was measured using item-to-total correlation. The
aim was to remove items if they had low correlation unless they represented an
additional domain of interest. This method is considered the most common procedure
used by researchers for guaranteeing the reliability of a multi-item scale (May, 1997).
The purpose of the item-to-total correlation measure is to determine the relationship
of a particular item to the rest of the items in the same dimension. The process helps
to ensure that the items making up the dimension share a common core (May, 1997).
In this purification process, each item to be retained for further analysis should have
an item-to-total correlation score of 0.30 or above and would then be considered highly
reliable (Cooper and Emory, 1995).

135
Additionally, the estimation of reliability was also made on the basis of the
average correlation among items within a dimension, which is a matter of “internal
consistency” (Nounally, 1978). The basic formula for determining the reliability on
the basis of this internal consistency is called the coefficient alpha (Cronbach’s alpha).
This technique has proved to be a good estimate of reliability in most research
situations. Nunnally (1978) suggests that a reliability of 0.60 would be sufficient.
The following section reports the results of the reliability analyses which were
conducted for all the measuring instruments in the questionnaire, namely, strategic
planning formulation, strategic planning implementation, strategic planning
evaluation, environmental dynamism, and organizational performance factors
(Reliability Analysis).
Computing the item-to-total correlation and also testing with coefficient alpha
constitutes the process of analysing reliability. Item-to-total correlation and the
Cronbach Alpha coefficient are observed to be very popular in the field of social
science research (Price and Muller, 1986).
All the items were found to have a high item-to-total correlation, above the
acceptable level of 0.30. As shown in the last column of Table 7, below, the reliability
coefficients ranged from 0.83 to 0.93 which were significantly higher than the
acceptable level of 0.60 (Nunnally 1978). These results confirm that reliable scales
were used.
This study calculates the reliability for every single variable. Table 7 shows
the reliability coefficient and item-total correlations for all the study constructs.

136
Table 7: Reliability Analysis for the Research Variables
Item
Item Item-total correlation
Cronbach’s
A STRATEGIC PLAN FORMULATION
Practice of strategic planning 0.83
Q1 Please tell us how often the following tools are used in developing your strategic plans?
1.1 Pro forma financial statements (e.g., cash flow, income statement and budget)
0.44
1.2 Cost-benefit analysis 0.64
1.3 Benchmarking 0.59
1.4 Gap analysis 0.50
1.5 Balanced scorecard 0.41
1.6 Value chain analysis 0.45
1.7 Spreadsheet “what if” analysis 0.54
1.8 SWOT analysis 0.58
1.9 PEST (Political, Economic, Social and Technological) analysis
0.57
1.10 Portfolio analysis (e.g., Boston consulting matrix or General Electric matrix)
0.67
1.11 Porter’s five forces analysis 0.60
Intensity of strategic planning 0.89
Q2 To what extent do you agree or disagree with each of the following statements about the strategic planning process in your organization?
2.1 Everything that has to be planned is studied carefully during the process of strategic planning.
0.61
2.2 During the process of strategic planning, we analyse each decision very carefully.
0.80

137
Item
Item Item-total correlation
Cronbach’s
2.3 During the process of strategic planning, many alternatives are evaluated carefully.
0.77
2.4 Those who are involved in strategic planning analyse and evaluate projects carefully.
0.76
2.5 Strategic planning is a very demanding process.
0.72
2.6 Those who are involved in strategic planning spare no effort.
0.68
B STRATEGY IMPLEMENTATION
Comprehensiveness of strategic plan implementation
0.92
Q3 To what extent do you agree or disagree with each of the following statements to best describe the current situation of strategic plan implementation at your organization?
3.1 We use a diverse set of ideas from internal and external sources (rather than from limited internal sources) in implementing our strategic plan.
0.77
3.2 We evaluate thoroughly each possible action before implementing our strategic plan.
0.65
3.3 We attempt to determine optimal courses of action for implementing our strategic plan.
0.86
3.4 We use the experiences of managers from different management levels while implementing our strategic plan.
0.76
3.5 We search extensively for possible implementation actions before we actually implement our strategic plan.
0.87
Alignment of strategy plan implementation
0.90
Q4 Please identify to what extent you agree or disagree with each one of the following

138
Item
Item Item-total correlation
Cronbach’s
statements in relation to the current situation within your organization.
4.1 Our people have the necessary skills to implement our strategic plan effectively.
0.78
4.2 When our people don’t have the necessary skills for implementing our strategic plan, we hire new staff with the necessary skills.
0.60
4.3 Our systems and processes (e.g., reward systems, manufacturing processes, information systems, etc.) are aligned to make our strategic plan work.
0.66
4.4 We have formal assignment of organizational specializations, authority and responsibility.
0.58
4.5 Our organizational culture (e.g., the values that are shared by employees) is in alignment with our strategic plan.
0.71
4.6 The behaviours/decisions of our managers are consistent with the requirements of our strategic plan.
0.78
4.7 We allocate the resources (e.g., money, technology, staff, etc.) that are necessary to support our strategic plan.
0.70
4.8 We plan and decide according to our established strategic plan.
0.82
C STRATEGY EVALUATION
Accountability 0.85
Q5 To what extent do you agree or disagree with each of the following statements regarding the managerial accountability practices in your organization?
5.1 Our organization conducts regular audits/reviews of our programs/activities.
0.74

139
Item
Item Item-total correlation
Cronbach’s
5.2 Our organization benchmarks its performance on key indicators against comparable organizations.
0.73
5.3 Managers at my level are held accountable for the results of their activities.
0.63
5.4 The individual to whom I report periodically reviews my results with me.
0.64
Strategic control 0.89
Q6 To what extent do you agree or disagree with each one of the following statements that best describe strategic plan evaluation at your organization?
6.1 After we develop and implement our strategic plan, we engage in a systematic and continuous effort to identify whether the environmental conditions (e.g., forecasts of inflation or market growth rate, etc.) forming the bases of our plan have changed so that we can update our assumptions and strategic plan.
0.74
6.2 We focus on the accomplishment of the objectives of our strategic plan.
0.70
6.3 Once implementation of our strategic plan has begun, we engage in a systematic and continuous effort to identify and appraise the unforeseen effects of the implemented decisions so that we can assess whether we should change our course of action.
0.77
6.4 During the development and implementation of our strategic plan, we engage in a systematic and continuous effort to monitor the full range of emerging events inside and outside our organization which are likely to threaten the course of our strategic action, so that we can uncover important yet unanticipated information and safeguard our strategic plan on a continuous basis.
0.82

140
Item
Item Item-total correlation
Cronbach’s
C ENVIRONMENTAL CHARACTERISTICS
.
Environmental dynamism 0.93
Q7 To what extent do you agree or disagree with each of the following statements regarding your industry?
7.1 Products or services in our industry are updated quickly.
0.86
7.2 The acts of our competitors are difficult to predict.
0.86
7.3 The technology in our industry develops/ changes quickly.
0.80
7.4 It is difficult to predict the changes in customer needs.
0.84
D 5. ORGANIZATIONAL OUTCOMES
.
7. Organizational performance 0.90
Q8 8. Relative to similar organizations at the present time, how do you rate your organization’s performance in each of the following dimensions?
8.1 Quality of products or services provided 0.79
8.2 Development of products/services 0.84
8.3 Employee satisfaction 0.74
8.4 Customer satisfaction 0.81
8.5 Sales/ revenues growth 0.87
8.6 Market share 0.83
8.7 Return on investment 0.83
8.8 Social responsibilities 0.74

141
Item
Item Item-total correlation
Cronbach’s
8.9 Operational efficiency 0.76
9. Organizational competitiveness 0.93
Q9 10. To what extent is your organization able to attain each of the following?
9.1 Adapting to the changes in competitors’ market strategies.
0.88
9.2 Rapid adaptation of products or services to changes in clients’ needs.
0.85
9.3 Rapid reaction to new threats in the market. 0.79
9.4 Rapid exploitation of new market opportunities.
0.83
4.3 Content Validity
Content validity is the degree to which the domain of properties or
characteristics of a construct that one desires to measure are in fact captured by the
measures (Bagozzi, 1994). A measure has content validity if there is general agreement
among the subjects and researchers that the instrument has measurement items that
cover all the content domain of the variables being measured (Nunnally and Bernstein,
1994). Researchers can satisfy content validity through careful definition of the
research problem, the items to be scaled, and the scale to be used. This logical process
is somewhat intuitive and is unique to each researcher (Emory and Cooper, 1991).
However, the measurement scale must satisfy certain criteria before it can be applied
in empirical work.

142
The criteria which we tried to consider in this study include (McDaniel and
Gates, 1996):
• Carefully defining what is to be measured.
• Conducting a careful literature review and interviews with the target
population before collecting our data.
• Letting the scale be checked by experts.
• Making sure that the scales could be pre-tested.
• Carefully selecting our scales from related research which has been tested
and validated by other researchers.
As discussed earlier, all the variables listed in the survey that we made were
identified by a comprehensive review of the related literature. The variables list was
also validated by several interviews with strategic planning experts and a pilot study.
This process guaranteed that content validity had been achieved in the survey.
4.3.1 Construct Validity and Scale Development
This section reports the test of construct validity and scale development for the
variables included in this study. As mentioned earlier (Part 3.9), a sequence of steps
was followed through the scale development process, which involved a number of
exploratory factor analyses and examination of the internal reliability of the data set
using item-to-total correlations and Cronbach’s alpha coefficients. Items which
fulfilled all the requirements in the exploratory factor analysis were then submitted to
a reliability analysis to calculate the item-total correlations and Cronbach’s alpha
values, the results of which are reported in Table 7, above. This type of procedure was
undertaken to sustain the reliability and validity of the data. Bearing in mind the great

143
number of items in our study (55), along with our sample size (N = 182), which violates
the assumption of the recommended six-to-one ratio for obtaining stable factor
solutions (Bauer et al., 2001), we ran several sets of factor analysis (e.g., Hart &
Banbury, 1994). This also has been a practice followed by many researchers in the
strategic management field (see for example Bauer, Truxillo, Sanchez, Craig, Ferrara,
and Campion, 2001) and Elbanna and Child, 2007).
4.3.2 Strategic Plan Formulation Variables
On the basis of the literature review, we measured our two variables of strategy
formulation (see Chapter 3 for more information on the sources of these variables).
These two variables are the practice of strategic planning and the intensity of strategic
planning. However, to validate the two constructs, the different items included were
submitted to factor analysis. The results are reported below.
4.3.2.1 Results of Factor Analysis
Certain requirements need to be fulfilled before factor analysis can be
successfully employed. One of the important requirements is to measure the variables
by using interval scales. Using a 5-point Likert scale in the survey questionnaire
fulfilled this requirement. This use of Likert scales can be justified as follows. First,
they communicate interval properties to the respondent, and therefore produce data
that can be assumed to be interval scaled (Madsen, 1989; Schertzer and Kernan, 1985).
Second, in the strategic management literature Likert scales are almost always treated
as interval scales (see, for example, Aaker et al., 1995; Bagozzi, 1994; Kohli and
Jaworski, 1990; Nerver and Slater, 1990; Tansuhaj et al, 1989). Third, the sample size

144
should be more than 100 since researchers generally cannot use factor analysis with
fewer than 50 observations (Hair et al., 1998). This requirement has also been fulfilled,
because 182 respondents took part in this research. The results of the factor analysis
tests are briefly discussed below.
4.3.2.1.1 Bartlett's Test of Sphericity
Since the first dimension of the strategy formulation was directed to find what
the current practice of the strategic plan formulation is in Abu Dhabi’s semi-
government sector, the 17 items were submitted to factor analysis. The results of
Exploratory Factor Analysis (EFA) yielded a two-factor solution that accounted for
54.02 % of the variance extracted. The result for Bartlett’s Test of Sphericity (BTS)
was high, at 1921.90, and the associated significance value was very low (p=0.00).
This shows that the data were appropriate for factor analysis (Snedecor and Cochran,
1989).
4.3.2.1.2 Kaiser-Meyer-Olkin Measure of Sampling Adequacy
The Kaiser-Meyer-Olkin (KMO) measurement of sample adequacy (MSA)
gives the computed KMO as 0.88, which is adequate, and above the acceptable level
(Snedecor and Cochran, 1989) (see Table 8).

145
Table 8: KMO and Bartlett's Test
Kaiser-Meyer-Olkin Measure of Sampling Adequacy. 0.88
Bartlett's Test of Sphericity
Approx. Chi-Square 1921.90
df 136
Sig. 0.00
Source: Analysis of survey data
As the above requirements were met, we concluded that factor analysis was
appropriate for this data set and allowed the procedures for factor analysis to be
performed.
4.3.2.2 Results of Principal Component Analysis Extraction Process
The factor extraction results using Principal Component Analysis (PCA) are
given in Table 9. An eigenvalue is the standard variability in the total data set (equal
to the numbers of variables included), which is accounted for by an extracted factor in
factor analysis.
The Kaiser-Meyer-Olkin method proposed by Kaiser (1960) is perhaps the best
known and most often adopted in practice (Fabrigar et. al, 1999). According to this
rule, only those factors that account for variances greater than 1 should be included
(Norusis, 1993). It should be noted that an eigenvalue of 1.0 was used as the
benchmark in deciding the number of factors (Hair et al., 1998; Norusis, 1993).

146
Table 9: Principal Component Analysis Extraction Results
Factor Eigen value
Variance Explained (%)
Cumulative Variance (%)
1 6.34 37.32 37.32
2 2.84 16.70 54.02
Extraction method: Principal Component Analysis
An initial (un-rotated) solution identified 17 items and two factors with
eigenvalues of more than one, accounting for 54.02% of the variance (see Table 9). As
Table 10 on the next page shows, all 17 variables score communalities that range from
0.20 to 0.75. Therefore, it may be concluded that a degree of confidence in the factor
solution can be justified.
Table 10: Communalities
Initial Extraction Pro forma financial statements (e.g., cash flow, income statement and budget)
1.00 0.20
Cost-benefit analysis 1.00 0.47 Benchmarking 1.00 0.56 Gap analysis 1.00 0.48 Balanced scorecard 1.00 0.32 Value chain analysis 1.00 0.42 Spreadsheet “what if” analysis 1.00 0.53 SWOT analysis 1.00 0.60 PEST (Political, Economic, Social and Technological) analysis
1.00 0.64
Portfolio analysis (e.g., Boston consulting matrix or General Electric matrix)
1.00 0.71
Porter’s five forces analysis 1.00 0.61 Everything that has to be planned is studied carefully during the process of strategic planning.
1.00 0.58
During the process of strategic planning, we analyse each decision very carefully.
1.00 0.75
During the process of strategic planning, many alternatives are evaluated carefully.
1.00 0.64

147
Initial Extraction Those who are involved in strategic planning analyse and evaluate projects carefully.
1.00 0.63
Strategic planning is a very demanding process. 1.00 0.49 Those who are involved in strategic planning spare no effort.
1.00 0.49
Extraction Method: Principal Component Analysis.
4.3.2.3 Factor Rotation and factor Loading
Once we were satisfied with the two chosen factors, we examined a loading of
all the items within the two factors. The Varimax technique for rotated component
analysis was used with a cut-off point for interpreting the factors at 0.40 or greater
(Snedecor and Cochran, 1989). The results are summarized in Table 11 on the next
page:
Table 11: Rotated Component Matrixa
Component 1 2
Pro forma financial statements (e.g., cash flow, income statement and budget)
0.44
Cost – benefit analysis 0.56 Benchmarking 0.44 0.54 Gap analysis 0.65 Balanced scorecard 0.66 Value chain analysis 0.60 Spreadsheet “what if” analysis 0.64 SWOT analysis 0.71 PEST (Political, Economic, Social and Technological) analysis 0.56 Portfolio analysis (e.g., Boston consulting matrix or General Electric matrix)
0.62
Porter’s five forces analysis 0.61 Everything that has to be planned is studied carefully during the process of strategic planning.
0.81
During the process of strategic planning, we analyse each decision very carefully.
0.83
During the process of strategic planning, many alternatives are evaluated carefully.
0.91

148
Component 1 2
Those who are involved in strategic planning analyse and evaluate projects carefully.
0.85
Strategic planning is a very demanding process. 0.92 Those who are involved in strategic planning spare no effort. 0.70 Extraction Method: Principal Component Analysis. Rotation Method: Varimax with Kaiser Normalization. a. Rotation converged in 3 iterations.
All the items were loaded onto the expected factors for which they were
designed. Factor loadings were all higher than 0.40 so that each item loaded higher on
its associated construct than on any other construct. As suggested by Hair et al. (1998),
a factor loading higher than 0.35 is considered statistically significant at an alpha level
of 0.05. This is supported by the discriminant validity of the measurement, as shown
in Chapter 5.
4.3.2.4 Factor Naming and Interpretation Process
The interpretation of the two-factor solution was accomplished by relating
them to the theoretical concepts of strategic planning. The two factors can be discussed
as follows:
Factor 1 consists of 11 items and fits very well with the ‘Practice of strategic
planning’ (mean of use of planning tools) (Aldehayyat et al., 2011; Elbanna, 2010).
This factor comprises the following items (1) Pro forma financial statements (e.g., cash
flow, income statement and budget), (2) Cost-benefit analysis, (3) Benchmarking, (4)
Gap Analysis, (5) Balanced scorecard, (6) Value chain analysis, (7) Spreadsheet “what
if” analysis, (8) SWOT Analysis, (9) PEST (Political, Economic, Social and
Technological) analysis, (10) Portfolio analysis (e.g., Boston consulting matrix or

149
General Electric matrix), and (11) Porter’s five forces analysis. The values are closely
grouped with SWOT analysis as the highest (0.71) and “Pro forma financial statements
(e.g., cash flow, income statement and budget)” the lowest (0.44).
The second factor consists of 6 items. This factor represents the managers’
opinions regarding ‘intensity of strategic planning’ (Schäffer and Willauer, 2003). It
covers the following variables: (1) Everything that has to be planned is studied
carefully during the process of strategic planning, (2) During the process of strategic
planning, we analyse each decision very carefully, (3) During the process of strategic
planning, many alternatives are evaluated carefully, (4) Those who are involved in
strategic planning analyse and evaluate projects carefully, (5) Strategic planning is a
very demanding process, and (6) Those who are involved in strategic planning spare
no effort. The values are closely grouped, “Strategic planning is a very demanding
process” being the highest (0.92) and “Those who are involved in strategic planning
spare no effort in implementing our strategic plan” the lowest (0.70).
4.3.3 Strategy Implementation Variables
4.3.3.1 Results of Factor Analysis
Respondents were asked to indicate the extent to which the statements
described the current situation of strategic plan implementation in their organization.
All the thirteen items that represent strategy implementation comprehensiveness and
strategy alignment were entered for factor analysis. The results of the factor analysis
tests are briefly discussed below:
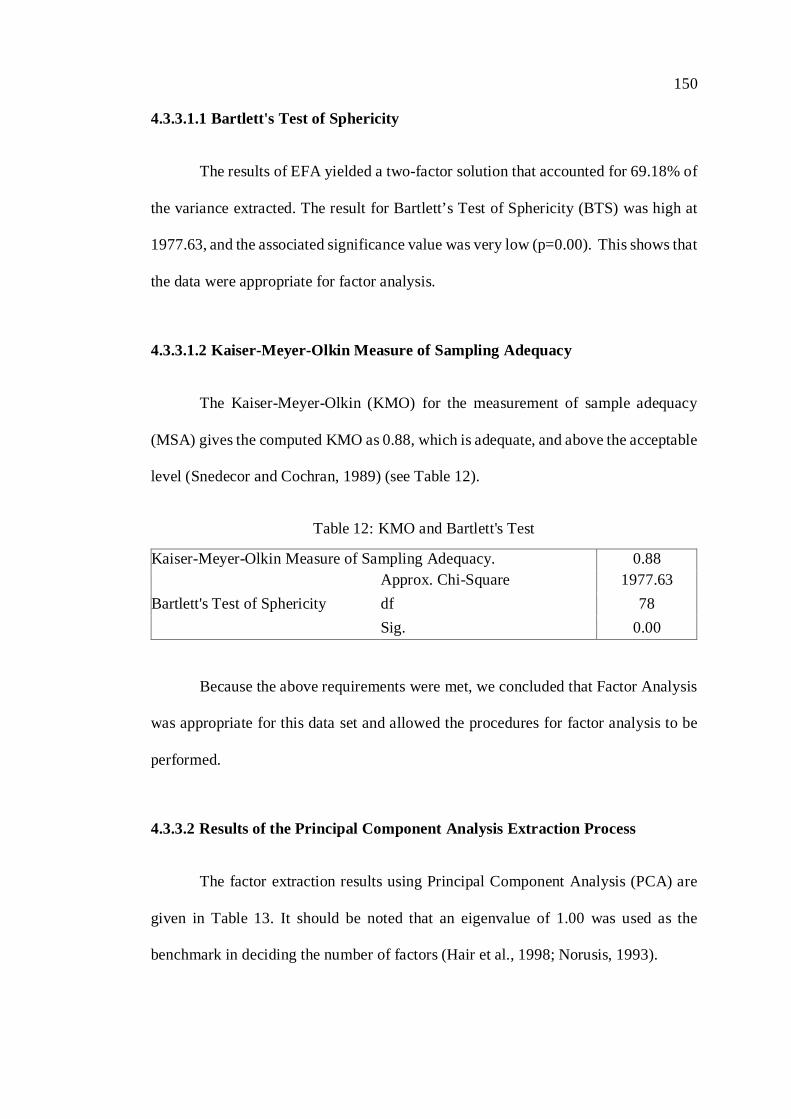
150
4.3.3.1.1 Bartlett's Test of Sphericity
The results of EFA yielded a two-factor solution that accounted for 69.18% of
the variance extracted. The result for Bartlett’s Test of Sphericity (BTS) was high at
1977.63, and the associated significance value was very low (p=0.00). This shows that
the data were appropriate for factor analysis.
4.3.3.1.2 Kaiser-Meyer-Olkin Measure of Sampling Adequacy
The Kaiser-Meyer-Olkin (KMO) for the measurement of sample adequacy
(MSA) gives the computed KMO as 0.88, which is adequate, and above the acceptable
level (Snedecor and Cochran, 1989) (see Table 12).
Table 12: KMO and Bartlett's Test
Kaiser-Meyer-Olkin Measure of Sampling Adequacy. 0.88
Bartlett's Test of Sphericity Approx. Chi-Square 1977.63 df 78 Sig. 0.00
Because the above requirements were met, we concluded that Factor Analysis
was appropriate for this data set and allowed the procedures for factor analysis to be
performed.
4.3.3.2 Results of the Principal Component Analysis Extraction Process
The factor extraction results using Principal Component Analysis (PCA) are
given in Table 13. It should be noted that an eigenvalue of 1.00 was used as the
benchmark in deciding the number of factors (Hair et al., 1998; Norusis, 1993).

151
Table 13: Principal Component Analysis Extraction Results
Eigenvalue Variance Explained (%) Cumulative Variance (%)
6.86 52.32 52.32 2.12 16.36 69.18
Extraction method: Principal Component Analysis
An initial (un-rotated) solution identified thirteen items and two factors with
eigenvalues of more than one, accounting for 69.18% of the variance (see Table 13).
As Table 14 shows, all thirteen variables scored high communalities that range from
0.55 to 0.86. Therefore, it may be concluded that a degree of confidence in the factor
solution is justified.

152
Table 14: Communalities
Initial Extraction
We use a diverse set of ideas from internal and external sources (rather than from limited internal sources) in implementing our strategic plan.
1.00 0.71
We evaluate thoroughly each possible action before implementing our strategic plan.
1.00 0.73
We attempt to determine optimal courses of action for implementing our strategic plan.
1.00 0.81
We use experiences of managers from different management levels while implementing our strategic plan.
1.00 0.73
We search extensively for possible implementation actions before we actually implement our strategic plan.
1.00 0.86
Our people have the necessary skills to implement our strategic plan effectively.
1.00 0.70
When our people don’t have the necessary skills for implementing our strategic plan, we hire new staff with the necessary skills.
1.00 0.55
Our systems and processes (e.g., reward systems, manufacturing processes, information systems, etc.) are aligned to make our strategic plan work
1.00 0.60
We have formal assignment of organizational specializations, authority and responsibility.
1.00 0.57
Our organizational culture (e.g., values that are shared by employees) is in alignment with our strategic plan.
1.00 0.65
The behaviors/decisions of our managers are consistent with the requirements of our strategic plan.
1.00 0.70
We allocate the resources (e.g., money, technology, staff, etc.) that are necessary to support our strategic plan.
1.00 0.60
We plan and decide according to our established strategic plan.
1.00 0.79
Extraction Method: Principal Component Analysis.
4.3.3.3 Factor Rotation and factor Loading
Once we were satisfied with the two chosen factors, we examined a loading of
all the items within the two factors. The Varimax technique for rotated component
analysis was used with a cut-off point for interpreting the factors at 0.50 or greater.
The results are summarized in Table 15 below:

153
Table 15: Rotated Component Matrixa
Component 1 2
We use a diverse set of ideas from internal and external sources (rather than from limited internal sources) in implementing our strategic plan.
0.83
We evaluate thoroughly each possible action before implementing our strategic plan.
0.82
We attempt to determine optimal courses of action for implementing our strategic plan.
0.89
We use the experiences of managers from different management levels while implementing our strategic plan.
0.82
We search extensively for possible implementation actions before we actually implement our strategic plan.
0.90
Our people have the necessary skills to implement our strategic plan effectively.
0.72
When our people don’t have the necessary skills for implementing our strategic plan, we hire new staff with the necessary skills.
0.74
Our systems and processes (e.g., reward systems, manufacturing processes, information systems, etc.) are aligned to make our strategic plan work.
0.77
We have formal assignment of organizational specializations, authority and responsibility.
0.75
Our organizational culture (e.g., values that are shared by employees) is in alignment with our strategic plan.
0.68
The behaviors/decisions of our managers are consistent with the requirements of our strategic plan.
0.72
We allocate the resources (e.g., money, technology, staff, etc.) that are necessary to support our strategic plan.
0.75
We plan and decide according to our established strategic plan.
0.74
Extraction Method: Principal Component Analysis. Rotation Method: Varimax with Kaiser Normalization. a. Rotation converged in 3 iterations.
All items were loaded onto the expected factors for which they were designed.
Factor loadings were all higher than 0.50, so that each item loaded higher on its
associated construct than on any other construct. As suggested by Hair et al. (1998), a
factor loading higher than 0.35 is considered statistically significant at an alpha level

154
of 0.05. This is supported by the discriminant validity of the measurement, as shown
in Chapter 5.
4.3.3.4 Factor Naming and Interpretation Process
The interpretation of the two-factor solution was accomplished by relating the
factors to the theoretical concepts of strategic management and strategic planning
theories. The factors can be described as follows:
Factor 1 consists of 5 items and fits very well with the ‘comprehensiveness’ of
the strategic plan implementation (Hakimpoor, 2014). This factor comprises the
following variables: (1) We use a diverse set of ideas from internal and external
sources (rather than from limited internal sources) in implementing our strategic plan,
(2) We evaluate thoroughly each possible action before implementing our strategic
plan, (3) We attempt to determine the optimal courses of action for implementing our
strategic plan, (4) We use the experiences of managers from different management
levels while implementing our strategic plan, and (5) We search extensively for
possible implementation actions before we actually implement our strategic plan.
The values are closely grouped, the highest being “We search extensively for
possible implementation actions before we actually implement our strategic plan”
(0.90) and the lowest being both “We use the experiences of managers from different
management levels while implementing our strategic plan” and “We evaluate
thoroughly each possible action before implementing our strategic plan” (0.82).
The second factor consists of 8 items. This factor represents the managers’
opinions regarding the ‘alignment’ of strategic planning (Higgins, 2005). It covers the

155
following variables: (1) Our people have the necessary skills to implement our
strategic plan effectively, (2) When our people don’t have the necessary skills for
implementing our strategic plan, we hire new staff with the necessary skills, (3) Our
systems and processes (e.g., reward systems, manufacturing processes, information
systems, etc.) are aligned to make our strategic plan work, (4) We have formal
assignment of organizational specializations, authority and responsibility, (5) Our
organizational culture (e.g., values that are shared by employees) is in alignment with
our strategic plan, (6) The behaviors/decisions of our managers are consistent with the
requirements of our strategic plan, (7) We allocate the resources (e.g., money,
technology, staff, etc.) that are necessary to support our strategic plan, and (8) We plan
and decide according to our established strategic plan. The values are closely grouped,
the highest being “Our systems and processes (e.g., reward systems, manufacturing
processes, information systems, etc.) are aligned to make our strategic plan work”
(0.77) and the lowest “Our organizational culture (e.g., values that are shared by
employees) is in alignment with our strategic plan” (0.68).
4.3.4 Strategy Evaluation Variables
This section reports the scale development for the strategy evaluation
constructs. A sequence of steps was followed in the scale development process. This
involves examining the internal reliability of the data set using item-total correlation,
a reliability test as reported in the previous chapter, and exploratory factor analysis.
Items which fulfilled all requirements in the exploratory factor analysis were then
submitted to a reliability analysis to measure the item-total correlation and Cronbach’s
alpha before being used in further analysis. This type of procedure was undertaken to

156
sustain the reliability and validity of the data. Below we report the item scale
development based on the survey questionnaire.
4.3.4.1 Results of Factor Analysis
Respondents were asked to indicate the extent to which each statement
described the evaluation of the strategic planning process in their companies. All 8
items representing accountability and strategic control were entered for factor analysis.
The results of the Factor Analysis tests are briefly discussed below:
4.3.4.1.1 Bartlett's Test of Sphericity
The result for Bartlett’s Test of Sphericity (BTS) was high at 752.30, and the
associated significance value was very low (p=0.00). This shows that the data were
appropriate for factor analysis.
4.3.4.1.2 Kaiser-Meyer-Olkin Measure of Sampling Adequacy
The Kaiser-Meyer-Olkin (KMO) for the measurement of sample adequacy
(MSA) gives the computed KMO as 0.84, which is adequate, and above the acceptable
level (Snedecor and Cochran, 1989) (see Table 16).
Table 16: KMO and Bartlett's Test
Kaiser-Meyer-Olkin Measure of Sampling Adequacy. 0.84
Bartlett's Test of Sphericity Approx. Chi-Square 752.30 df 28.0 Sig. 0.00
Source: Analysis of survey data

157
Since the above requirements were met, we concluded that Factor Analysis
was appropriate for this data set, allowing the procedures for factor analysis to be
performed.
4.3.4.2 Results of Principal Component Analysis Extraction process
The factor extraction results using Principal Component Analysis (PCA) are
given in Table 17. It should be noted that an eigenvalue of 1.0 was used as the
benchmark in deciding the number of factors (Hair et al., 1998; Norusis, 1993).
Table 17: Principal Component Analysis Extraction Results
Factor Eigenvalue Variance Explained (%) Cumulative Variance (%)
1 3.88 48.57 48.57 2 1.90 23.77 72.35
Extraction method: Principal Component Analysis
An initial (un-rotated) solution identified 8 items and two factors with
eigenvalues of more than one, accounting for 72.35% of the variance (see Table 17).
As Table 18 on the nest page shows, all 8 variables scored high communalities ranging
from 0.62 to 0.83. Therefore, it could be concluded that a degree of confidence was
achieved.

158
Table 18: Communalities
Initial Extraction Our organization conducts regular audits/reviews of our programs/activities.
1.00 0.76
Our organization benchmarks its performance on key indicators against comparable organizations.
1.00 0.74
Managers at my level are held accountable for the results of their activities.
1.00 0.62
The individual to whom I report periodically reviews my results with me.
1.00 0.64
After we develop and implement our strategic plan, we engage in a systematic and continuous effort to identify whether the environmental conditions (e.g., forecasts of inflation or market growth rate, etc.) forming the bases of our plan have changed so that we can update our assumptions and strategic plan.
1.00 0.73
We focus on the accomplishment of the objectives of our strategic plan.
1.00 0.70
Once implementation of our strategic plan has begun, we engage in a systematic and continuous effort to identify and appraise any unforeseen effects of the implemented decisions so that we can assess whether we should change our course of action.
1.00 0.78
During the development and implementation of our strategic plan, we engage in a systematic and continuous effort to monitor the full range of emerging events inside and outside our organization which are likely to threaten the course of our strategic action, so that we can uncover important yet unanticipated information and safeguard our strategic plan on a continuous basis.
1.00 0.83
Extraction Method: Principal Component Analysis.
4.3.4.3 Factor Rotation and factor Loading
Once we were satisfied with the two chosen factors, we examined a loading of
all the items within the two factors. The Varimax technique for rotated component
analysis was used with a cut-off point for interpreting the factors at 0.50 or greater.
The results are summarized in Table 19 below:

159
Table 19: Rotated Component Matrixa
Component 1 2
Our organization conducts regular audits/reviews of our programs/activities.
0.87
Our organization benchmarks its performance on key indicators against comparable organizations.
0.85
Managers at my level are held accountable for the results of their activities.
0.75
The individual to whom I report periodically reviews my results with me.
0.79
After we develop and implement our strategic plan, we engage in a systematic and continuous effort to identify whether the environmental conditions (e.g., forecasts of inflation or market growth rate, etc.) forming the bases of our plan have changed so that we can update our assumptions and strategic plan.
0.81
We focus on the accomplishment of our strategic plan objectives.
0.81
Once implementation of our strategic plan has begun, we engage in a systematic and continuous effort to identify and appraise unforeseen effects of the implemented decisions so that we can assess whether we should change our course of action.
0.88
During the development and implementation of our strategic plan, we engage in a systematic and continuous effort to monitor the full range of emerging events inside and outside our organization which are likely to threaten the course of our strategic action, so that we can uncover important yet unanticipated information and safeguard our strategic plan on a continuous basis.
0.91
Source: Analysis of survey data Extraction Method: Principal Component Analysis- Rotation Method: Varimax with Kaiser Normalization. a. Rotation converged in 5 iterations
All items were loaded onto the expected factors for which they were designed.
Factor loadings were all higher than 0.5, so that each item loaded higher on its
associated construct than on any other construct. As suggested by Hair et al. (1998), a
factor loading higher than 0.35 is considered statistically significant at an alpha level

160
of 0.05. This is supported by the discriminant validity of the measurement, as shown
in Chapter 5.
4.3.4.4 Factor Naming and Interpretation Process
The interpretation of the two-factor solution was made by relating the factors
to the theoretical concepts of strategic management and strategic planning theories.
The two factors may be described as follows:
Factor 1 consists of 4 items and fits very well with ‘accountability’ (Cavalluzzo
and Ittner, 2004; Elbanna, 2013).This factor comprises the following variables: (1) Our
organization conducts regular audits/reviews of our programs/activities, (2) Our
organization benchmarks its performance on key indicators against comparable
organizations, (3) Managers at my level are held accountable for the results of their
activities, and (4) The individual to whom I report periodically reviews my results with
me. The values are closely grouped with “Our organization conducts regular audits
/reviews of our programs/activities” as the highest (0.87) and “Managers at my level
are held accountable for the results of their activities” as the lowest (0.75).
The second factor consists of 4 items. This factor represents the respondents’
opinions regarding “strategic control” (Schreyögg and Steinmann, 1987). It covers the
following variables: (1) After we develop and implement our strategic plan, we engage
in a systematic and continuous effort to identify whether the environmental conditions
(e.g., forecasts of inflation or market growth rate, etc.) forming the bases of our plan
have changed so that we can update our assumptions and strategic plan, (2) We focus
on the accomplishment of the objectives of our strategic plan, (3) Once implementation
of our strategic plan has begun, we engage in a systematic and continuous effort to

161
identify and appraise unforeseen effects of the implemented decisions so that we can
assess whether we should change our course of action, and (4) During the development
and implementation of our strategic plan, we engage in a systematic and continuous
effort to monitor the full range of emerging events inside and outside our organization
which are likely to threaten the course of our strategic action, so that we can uncover
important yet unanticipated information and safeguard our strategic plan on a
continuous basis. The values are closely grouped with “During the development and
implementation of our strategic plan, we engage in a systematic and continuous effort
to monitor the full range of emerging events inside and outside our organization” as
the highest (0.91) and “After we develop and implement our strategic plan, we engage
in a systematic and continuous effort” and “We focus on the accomplishment of the
objectives of our strategic plan” as joint lowest (0.81).
4.3.5 Environmental Dynamism Variable
This section reports the scale development for the environmental dynamism
construct. This section reports the development of the item scale based on the survey
questionnaire.
4.3.5.1 Results of Factor Analysis
Respondents were asked to indicate the extent to which the statements
described the evaluation of the environmental dynamism in their organizations. Four
items that measured the environmental dynamism were entered for factor analysis. The
results of the Factor Analysis tests are briefly discussed below.

162
4.3.5.1.1 Bartlett's Test of Sphericity
The result for Bartlett’s Test of Sphericity (BTS) was high at 630.36, and the
associated significance value was very low (p=0.00). This shows that the data were
appropriate for factor analysis.
4.3.5.1.2 Kaiser-Meyer-Olkin Measure of Sampling Adequacy
The Kaiser-Meyer-Olkin (KMO) for measurement of sample adequacy (MSA)
gives the computed KMO as 0.83, which is adequate, and above the acceptable level
(see Table 20).
Table 20: KMO and Bartlett's Test
Kaiser-Meyer-Olkin Measure of Sampling Adequacy. 0.83
Bartlett's Test of Sphericity Approx. Chi-Square 630.36 df 6.00 Sig. 0.00
As the above requirements were met, we concluded that Factor Analysis was
appropriate for this data set, allowing the procedures for factor analysis to be
performed.
4.3.5.2 Results of Principal Component Analysis Extraction Process
The factor extraction results using Principal Component Analysis (PCA) are
given in Table 21. It should be noted that an eigenvalue of 1.00 was used as the
benchmark in deciding the number of factors (Hair et al., 1998; Norusis, 1993).

163
Table 21: Principal Component Analysis Extraction Results
Factor Eigenvalue Variance Explained (%) Cumulative Variance (%)
1 3.35 83.78 83.78 Extraction method: Principal Component Analysis
An initial (un-rotated) solution identified 4 items and one factor with
eigenvalues of more than one, accounting for 83.78% of the variance (see Table 21).
As Table 22 shows, all 4 variables scored high communalities ranging from 0.80 to
0.86. Therefore, it may be concluded that a degree of confidence in the factor solution
is justified.
Table 22: Communalities
Initial Extraction Products or services in our industry are updated quickly. 1.00 0.86 The acts of our competitors are difficult to predict. 1.00 0.86 The technology in our industry develops/changes quickly. 1.00 0.80 It is difficult to predict the changes in customer needs. 1.00 0.84 Extraction Method: Principal Component Analysis.
4.3.5.3 Factor Rotation and factor Loading
Once we were satisfied with the chosen factor, a loading of all the items within
the four factors were examined. The Varimax technique for rotated component
analysis was used with a cut-off point for interpreting the factors at 0.50 or greater.
The results are summarized in Table 23.

164
Table 23: Rotated Component Matrixa
Component 1
Products or services in our industry are updated quickly. 0.92 The acts of our competitors are difficult to predict. 0.93 The technology in our industry develops/changes quickly. 0.90 It is difficult to predict the changes in customer needs. 0.92 Extraction Method: Principal Component Analysis. Rotation Method: Varimax with Kaiser Normalization. a. Rotation converged in 7 iterations.
All the items were loaded onto the expected factors for which they were
designed. Factor loadings were all higher than 0.5 so that each item loaded higher on
its associated construct than on any other construct. As suggested by Hair et al. (1998),
a factor loading higher than 0.35 is considered statistically significant at an alpha level
of 0.05. This is supported by the discriminant validity of the measurement, as shown
in Chapter 5.
4.3.5.4 Factor Naming and Interpretation Process
The interpretation of the one-factor solution was accomplished by relating it to
the theoretical concepts of strategic management and strategic planning theories. The
suggested factor consists of 4 items and fits very well with the ‘environmental
dynamism’ factor (Li and Liu 2014). This factor comprises the following variables:
(1) Products or services in our industry are updated quickly, (2) The acts of our
competitors are difficult to predict, (3) The technology in our industry
develops/changes quickly, and (4) It is difficult to predict the changes in customer
needs. The values are closely grouped, the highest being “The acts of our competitors
are difficult to predict” (0.93) and the lowest “The technology in our industry develops/
changes quickly” (0.90).

165
4.3.6 Organizational Outcomes Variables
This section reports the scale development for the constructs of the
organizational outcomes. This part reports the item scale development based on the
survey questionnaire.
4.3.6.1 Results of Factor Analysis
Respondents were asked to indicate the extent to which the statements describe
the results of the strategic planning process in their companies. All the 13 items that
are related to the organizational outcomes were entered for factor analysis. The results
of the Factor Analysis tests are briefly discussed below:
4.3.6.1.1 Bartlett's Test of Sphericity
The result for Bartlett’s Test of Sphericity (BTS) was high at 2280.76, and the
associated significance value was very low (p=0.00). This shows that the data were
appropriate for factor analysis.
4.3.6.1.2 Kaiser-Meyer-Olkin Measure of Sampling Adequacy
The Kaiser-Meyer-Olkin (KMO) for a measurement of sample adequacy
(MSA) gives the computed KMO as 0.92, which is adequate, and above the acceptable
level (Snedecor and Cochran, 1989) (see Table 24).

166
Table 24: KMO and Bartlett's Test
Kaiser-Meyer-Olkin Measure of Sampling Adequacy. 0.92
Bartlett's Test of Sphericity Approx. Chi-Square 2280.76 df 78.00 Sig. 0.00
Source: Analysis of survey data
As the above requirements were met, we concluded that Factor Analysis was
appropriate for this data set, allowing the procedures for factor analysis to be
performed.
4.3.6.2 Results of Principal Component Analysis Extraction Process
The factor extraction results using Principal Component Analysis (PCA) are
given in Table 25. It should be noted that an eigenvalue of 1.00 was used as the
benchmark in deciding the number of factors (Hair et al., 1998; Norusis, 1993).
Table 25: Principal Component Analysis Extraction Results
Factor Eigenvalue Variance Explained (%) Cumulative Variance (%)
1 8.254 63.490 63.49 2 1.651 12.697 76.18
Extraction method: Principal Component Analysis
An initial (un-rotated) solution identified 13 items and three factors with
eigenvalues of more than one, accounting for 76.18% of the variance (see Table 25).
As Table 26 on the following page shows, all 13 variables scored high communalities
that ranged from 0.67 to 0.87. Therefore, it may be concluded that a degree of
confidence in the factor solution can be justified.

167
Table 26: Communalities
Initial Extraction Quality of products or services provided 1.00 0.73 Development of products/services 1.00 0.77 Employee satisfaction 1.00 0.71 Customer satisfaction 1.00 0.72 Sales/ revenues growth 1.00 0.82 Market share 1.00 0.80 Return on investment 1.00 0.77 Social responsibilities 1.00 0.67 Operational efficiency 1.00 0.68 Adapting to the changes in competitors’ market strategies.
1.00 0.87
Rapid adaptation of products or services to changes in clients’ needs.
1.00 0.82
Rapid reaction to new threats in the market. 1.00 0.74 Rapid exploitation of new market opportunities.
1.00 0.82
Extraction Method: Principal Component Analysis.
4.3.6.3 Factor Rotation and factor Loading
Once we were satisfied with the two chosen factors, we examined the loading
of all the items within the two factors. The Varimax technique for rotated component
analysis was used with a cut-off point for interpretation of the factors at 0.50 or greater.
The results are summarized in Table 27 below:

168
Table 27: Rotated Component Matrixa
Component 1 2
Quality of products or services provided 0.82 Development of products/services 0.78 Employee satisfaction 0.83 Customer satisfaction 0.72 Sales/revenues growth 0.85 Market share 0.86 Return on investment 0.84 Social responsibilities 0.60 Operational efficiency 0.63 Adapting to the changes in competitors’ market strategies. 0.87 Rapid adaptation of products or services to changes in clients’ needs.
0.88
Rapid reaction to new threats in the market. 0.81 Rapid exploitation of new market opportunities. 0.87 Extraction Method: Principal Component Analysis. Rotation Method: Varimax with Kaiser Normalization. a. Rotation converged in 3 iterations.
All items were loaded onto the expected factors for which they were designed.
Factor loadings were all higher than 0.50 so that each item loaded higher on its
associated construct than on any other construct. As suggested by Hair et al. (1998), a
factor loading higher than 0.35 is considered statistically significant at an alpha level
of 0.05. This is supported by the discriminant validity of the measurement, as shown
in Chapter 5.
4.3.6.4 Factor Naming and Interpretation Process
The interpretation of the two-factor solution was accomplished by relating the
factors to the theoretical concepts of strategic management and strategic planning
theories. The factors may be described as follows:

169
Factor 1 consists of 9 items and fits very well with ‘organizational
performance’ (Zuriekat, Salameh, and Alrawashdeh, 2011; Vorhies and Morgan,
2005; Hart and Banbury, 1994; Child, 1972).This factor comprises the following
variables (1) Quality of products or services provided, (2) Development of
products/services, (3) Employee satisfaction, (4) Customer satisfaction, (5)
Sales/revenues growth, (6) Market share, (7) Return on investment, (8) Social
responsibilities, and (9) Operational efficiency . The values are closely grouped, the
highest being “Market share” (0.86) and the lowest “Social responsibilities” (0.60).
The second factor consists of 4 items. This factor represents the respondents’
opinions regarding the ‘competitiveness” of the organization (Child, 1972; Ruekert et
al. 1985). It covers the following variables: (1) Adapting to the changes in competitors’
market strategies, (2) Rapid adaptation of products or services to changes in clients’
needs, (3) Rapid reaction to new threats in the market, and (4) Rapid exploitation of
new market opportunities. The values are closely grouped, the highest being “Rapid
adaptation of products or services to changes in clients’ needs” (0.88) and the lowest
“Rapid reaction to new threats in the market” (0.81).
4.4 Descriptive Analysis of the Sampled Organizations and Respondents
This section focuses on providing general information about the respondents
and participant companies. The aim was to provide a brief account of the profile of the
sample and the respondents in the study.

170
Frequency analysis was used to distribute the participating companies and respondents
according to the following characteristics:
1. Number of Full Time Employees
2. Number of Expatriate Employees
3. Percentage of Foreign Ownership
4. Number of Years in Current Organization
5. Managerial Level
6. Gender
4.4.1 Number of Full Time Employees
Organizational size was measured using the number of full time employees.
As shown in Table 28, most of the companies (nearly 72%) fell into the category of
having more than 250 employees (131 companies out of 182). Nearly 38% of the
participating companies had more than 1000 full time employees. Only 15 companies
(8.2%) had fewer than 100 full time employees. The analysis indicated that the average
number of employees for the whole sample was 779 employees.
Table 28: Number of Full Time Employees
Frequency Percent
Valid
Fewer than 100 Employees 15 8.2 100-249 Employees 36 19.8 250-499 Employees 31 17.0 500-999 Employees 31 17.0 More than 1000 Employees 69 37.9 Total 182 100.0

171
4.4.2 Number of Expatriate Employees
One of the demographic questions was related to the number of expatriate
employees that are hired by every company in the country. Table 29 reveals that most
of the companies (approximately 63%) in this study had fewer than 250 expatriates.
32 companies (17.6%) had 250-499 expatriates while 21 companies had 500-999
expatriates (11.5%). Only 14 companies (7.7%) had more than 1000 expatriates. This
is perhaps because the Abu Dhabi government a few years ago started a process of
what is called Emiratization in governmental organisations. The demographics here
reflect the government movement and support for Emiratization (Localization).
Table 29: Number of Expatriate Employees
Frequency Percent
Valid
Fewer than 100 Expatriate Employees 63 34.6 100-249 Expatriate Employees 52 28.6 250-499 Expatriate Employees 32 17.6 500-999 Expatriate Employees 21 11.5 More than 1000 Expatriate Employees 14 7.70 Total 182 100.0
4.4.3 Percentage of Foreign Ownership
Table 30 reveals that most of the companies (83%) in this survey were either
0% foreign owned or 1-25% foreign owned. Only 31 companies (17%) out of the 182
companies were under 26-49% of foreign ownership. This is due to the fact that the
maximum percentage of foreign ownership allowed in Abu Dhabi is 49%.
Furthermore, the Abu Dhabi government encourages the local ownership of
companies, in particular companies working in critical sectors such as the energy
sector.

172
Table 30: Percentage of Foreign Ownership
Frequency Percent
Valid
0% Foreign Ownership 69 37.9 1-25 % Foreign Ownership 82 45.1 26-49% Foreign Ownership 31 17.0 Total 182 100.0
4.4.4 Number of Years in Current Organization
Table 31 shows that nearly half of the respondents (49.5%) have been with
their present company for more than 10 years. Consequently, it can be concluded that
respondents in this research can provide valuable information about the process and
outcomes of strategic planning. However, 28% of the respondents had worked with
the same organisation for 5-10 years (51 respondents). Finally, only 41 out of the 182
respondents had worked for the same organisation for less than 5 years.
Table 31: Number of Years in Current Organization
Frequency Percent
Valid
More than 10 Years 90 49.5 5-10 Years 51 28.0 Less than 5 year 41 22.5 Total 182 100.0
4.4.5 Managerial Level
Table 32 reveals that nearly half of the respondents in this survey hold a
position at the top level of management (48.4%). 73 of the respondents hold a position
at middle management level (40.1%). This is actually normal, since people who are
involved in the strategic planning process are mostly located at these two levels.
Finally, only 20 respondents were working at the lower management level (11%).

173
Table 32: Managerial Level
Frequency Percent
Valid
Lower Management 20 11.0 Middle Management Level 73 40.1 Top Management Level 88 48.4 Total 181 99.5
Missing System 1 0.5 Total 182 100.0
4.4.6 Gender
Table 33 shows that most of the respondents (77.5) were males and that only
41 females (22.5%) participated in the survey. This is a similar result to that in related
research in other Arab countries, such as Egypt. For example, 32% of respondents in
a similar study conducted in Egypt were female (Elbanna, 2007). Similar results were
also reported in the UAE public sector (Elbanna, 2013). However, we should be
cautious about extending such results to other Arab countries, for instance, Saudi
Arabia.
Table 33: Gender
Frequency Percent
Valid Male 141 77.5 Female 41 22.5 Total 182 100.0
4.5 Chapter Summary
This chapter is devoted to reporting the preliminary analysis of the collected
data. This includes, first, encoding, editing and entering the data into SPSS, followed
by reliability and validity testing, which covers all the research constructs to find the
extent to which the measurements were reliable and valid. Item-to-total correlation
was calculated for each variable. As shown in Table 34, all the variables had acceptable

174
reliability values ranging from 0.83 to 0.93, which was significantly higher than the
acceptable level of 0.60 (Nunnally, 1978) and therefore, acceptable for further
analysis. Table 34 presents a summary of the reliability analysis of the main constructs
in this study, which are set out in Table 7. Then, steps to maximise content and
construct validity were taken. The reliability and validity analyses show that our
measures are both reliable and valid. In the next chapter, various statistical techniques
are used to explore the practice of strategic planning in the sampled companies and
test the study hypotheses. Last, we examined the general descriptive analysis of the
respondents’ profile and their response distribution. In addition, some initial
interpretations are also put forward to start the process of data analysis.
Table 34: Reliability analysis of main constructs in the study
Basic Constructs Total Number of Items
Item-Total Correlation
Cronbach’s Alpha
Practice of strategic planning 11 0.55 0.83 Intensity of strategic planning 6 0.67 0.89 Comprehensiveness of the strategic plan implementation
5 0.68 0.92
Alignment of the strategy plan implementation
8 0.74 0.90
Accountability 4 0.57 0.85 Strategic Control 4 0.70 0.89 Environmental Dynamism 4 0.78 0.93 Organizational Performance 9 0.83 0.90 Organizational Competitiveness 4 0.80 0.93

175
Chapter 5: Exploratory Analysis and Hypotheses Testing
5.1 Introduction
The previous chapter has validated and purified the data that were obtained
from the fieldwork questionnaire and has provided an exploratory analysis of the study
sample and respondents. This chapter introduces an exploratory analysis of certain
aspects of strategic planning practices in the sampled organizations and then presents
the results of hypothesis testing. SPSS/AMOS version 22 was used to analyse the data.
As discussed in Chapter 1, the aim of the thesis is to explore the practices of strategic
planning in the sampled organizations and to understand the role of strategic planning
on organizational outcomes. Therefore, as noted in Chapter 3, this chapter attempts
two tasks: to explore some practices of strategic planning in Abu Dhabi’s semi-
government sector and, more importantly, to examine the study’s hypotheses.
5.2 Exploratory Analysis of Strategic Planning Practice
This section aims to provide an exploratory analysis of the strategic planning
practices in the sampled organizations. Frequency analysis was used to classify the
participating organizations according to their practice in the following aspects of
planning:
1. Development of the First Strategic Plan
2. Planning Horizon
3. Time to Prepare the Strategic Plan
4. Participation in The Development of Strategic Plans (by Full Time
Employees)

176
5. Participation in The Development of Strategic Plans (by Managers/Board
Members)
6. Participation in The Development of Strategic Plans (by Managers/Board
Members and Organizational Size)
7. Participation in The Development of Strategic Plans (by Managers/Board
Members and Ownership)
8. Tools Used in Developing Strategic Plans
9. Tools Used in Strategic Planning (by Organizational Size)
10. Tools Used in Strategic Planning (by Ownership)
5.2.1 Development of the First Strategic Plan
Table 35, on the next page, reveals that nearly half of the organizations (47.3%)
in this survey developed their first strategic plans less than five years ago. 56
organizations (30.8%) developed their strategic plans five years ago. Finally, only 22%
of the respondents developed their strategic plans more than 5 years ago. This reflects
the fact that in Abu Dhabi strategic planning is still in its early stages, as confirmed by
related research (Elbanna, 2013), which shows that the formal practice of strategic
planning in Abu Dhabi public organizations started a decade ago.
Table 35: Distribution of the Sample by Development of the First Strategic Plan
Frequency Percent
Valid
Less Than 5 Years 86 47.3 5 Years 56 30.8 More Than 5 Years 40 22.0 Total 182 100.0

177
5.2.2 Planning Horizon
Table 36 reveals that most of the organizations (89%) in this survey developed
strategic plans that extend over 5 years at least. Only 20 organizations out of the 182
that participated in this survey developed a strategic plan that covers less than 5 years.
Table 36 highlights the fact that 5 years is the most common time horizon used in Abu
Dhabi – 114 of the 182 participants used it as the period in which their strategic plans
would operate.
Table 36: Distribution of the Sample by Planning Horizon
Frequency Percent
Valid
Less Than 5 Years 20 11.0 5 Years 114 62.6 More Than 5 Years 48 26.4 Total 182 100.0
The analysis shows that the average number of years in the sample’s planning
horizon is 5.75 years. This time horizon is longer than the strategic planning horizon
found in the study by Elbanna (2013). In his study, the mean score for the sample as a
whole regarding the strategic planning horizon was 4.2 years and most organizations
developed their plans for periods of either 3 or 5 years.
5.2.3 Time to Prepare the Strategic Plan
Table 37 on the next page indicates that most of the organizations which
participated in this survey (69.2%) took between 4 and 8 months to develop their
strategic plans. Only 40 organizations (22%) took less than 4 months to do so.
However, a small number of organizations (8.8%) needed more than 8 months to

178
develop their strategic plans. The analysis also shows that the average time needed in
the whole sample to prepare the strategic plan was 7.44 months.
The result of this study confirms the findings of Elbanna (2013) and Elbanna
(2010) that most organizations take less than 8 months to develop strategic plans. In
addition, Elbanna (2010) also found that large organizations tend to require more time
than small ones to prepare their strategic plans. The strategic planning process in large
organizations is more complex than that in small organizations and this may account
for the discrepancy.
Table 37: Distribution of the Sample by Time Needed to Prepare the Strategic Plan
Frequency Percent
Valid
Less Than 4 Months 40 22.0 4-8 Months 126 69.2 More Than 8 Months 16 8.80 Total 182 100.0
5.2.4 Participation in the Development of Strategic Plans (by Full Time Employees)
Table 38 reveals that nearly 79% of the participating organizations put 10 or
fewer employees in charge of developing the strategic plan (42.3% + 36.8%). Only 38
organizations (20.9%) have more than 10 employees participating in developing the
strategic plan. The analysis shows that the average number of employees participating
in the development of the strategic plans in the whole sample is 8.9.
This indicates that very few full time employees participate in developing the
strategic plan. Similarly, in the study of Elbanna (2013), it was found that the sampled
organizations had an average of 6.5 employees involved in planning strategies. In
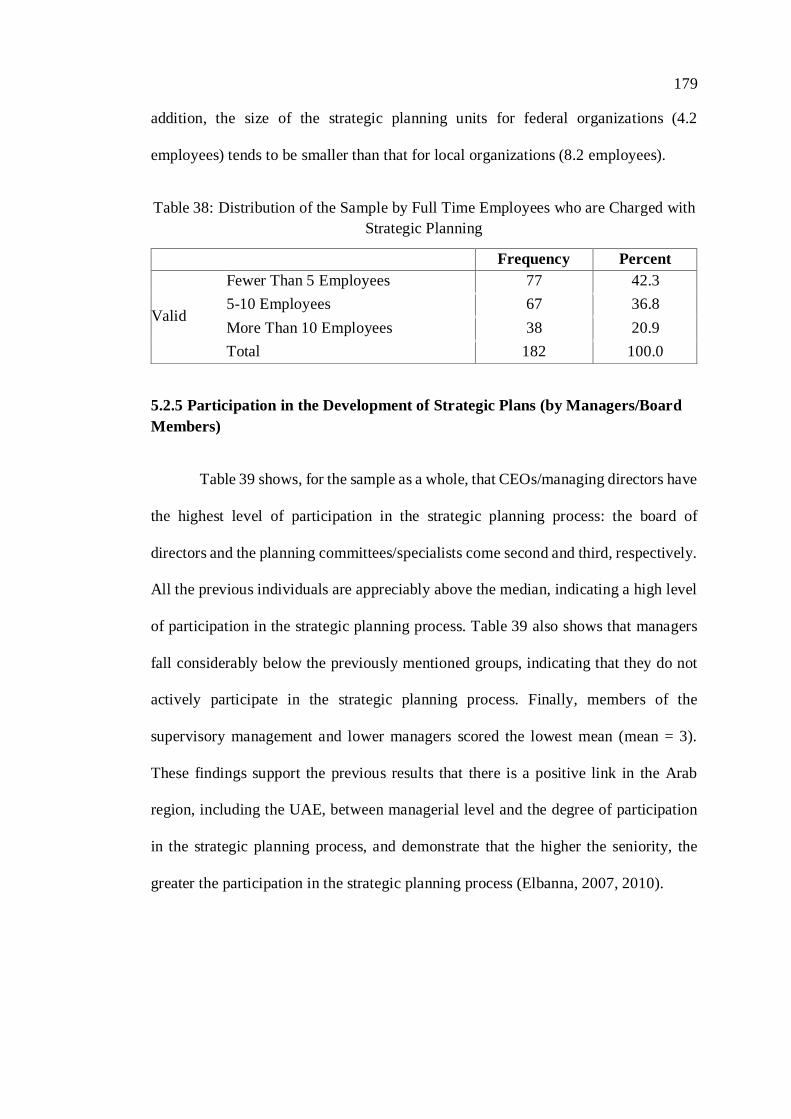
179
addition, the size of the strategic planning units for federal organizations (4.2
employees) tends to be smaller than that for local organizations (8.2 employees).
Table 38: Distribution of the Sample by Full Time Employees who are Charged with Strategic Planning
Frequency Percent
Valid
Fewer Than 5 Employees 77 42.3 5-10 Employees 67 36.8 More Than 10 Employees 38 20.9 Total 182 100.0
5.2.5 Participation in the Development of Strategic Plans (by Managers/Board Members)
Table 39 shows, for the sample as a whole, that CEOs/managing directors have
the highest level of participation in the strategic planning process: the board of
directors and the planning committees/specialists come second and third, respectively.
All the previous individuals are appreciably above the median, indicating a high level
of participation in the strategic planning process. Table 39 also shows that managers
fall considerably below the previously mentioned groups, indicating that they do not
actively participate in the strategic planning process. Finally, members of the
supervisory management and lower managers scored the lowest mean (mean = 3).
These findings support the previous results that there is a positive link in the Arab
region, including the UAE, between managerial level and the degree of participation
in the strategic planning process, and demonstrate that the higher the seniority, the
greater the participation in the strategic planning process (Elbanna, 2007, 2010).

180
Table 39: Distribution of the Sample by Managers/Board Members Participating in Strategic Planning
Mean CEO/managing director 4.71 Board of directors 4.54 Planning committee/specialists 4.23 Senior managers 4.00 Middle managers 3.34 Members of the supervisory management/lower managers 3.01 Note; N = 182; the mean is an average on a scale of 1: strongly disagree to 5: strongly agree.
5.2.6 Participation in the Development of Strategic Plans (by Managers/Board Members and Organizational Size)
The analysis of participation in the development of strategic planning taking
into account members of the top management team or board and organizational size
(number of employees) shows a high degree of agreement in the results, as shown in
Table 40, between the whole sample and the subsamples. In general the participation
of the CEO/managing director, board of directors and planning committee/specialists
is high (Mean≤ 4) in all sectors. However, the participation of managers and members
of the supervisory management/lower managers tends to be lower. It was interesting
to find that the participation of the middle managers (Mean= 4.466) and members of
supervisory management/lower managers (Mean= 4.200) is high in organizations
which have fewer than 100 employees.

181
Table 40: Participation in the Development of Strategic Plans (by Managers/Board Members) according to Organizational Size
N Mean Std. Deviation
Std. Error
CEO/managing director
Fewer than 100 Employees
15 4.60 0.73 0.19
100-249 Employees 36 4.86 0.424 0.07 250-499 Employees 31 4.77 0.56 0.10 500-999 Employees 31 4.64 0.48 0.08 More than 1000 Employees
69 4.66 0.56 0.06
Total 182 4.71 0.54 0.04
Board of directors
Fewer than 100 Employees
15 4.66 0.72 0.18
100-249 Employees 36 4.72 0.61 0.10 250-499 Employees 31 4.61 0.84 0.15 500-999 Employees 31 4.67 0.47 0.08 More than 1000 Employees
69 4.33 0.63 0.07
Total 182 4.54 0.66 0.04
Planning committee/specialists
Fewer than 100 Employees
15 4.66 0.89 0.23
100-249 Employees 36 4.44 0.77 0.12 250-499 Employees 31 4.32 0.70 0.12 500-999 Employees 31 3.96 0.75 0.13 More than 1000 Employees
69 4.10 0.42 0.05
Total 182 4.23 0.68 0.05
Senior managers
Fewer than 100 Employees
15 4.46 0.74 0.19
100-249 Employees 36 4.11 0.82 0.13 250-499 Employees 31 3.83 0.68 0.12 500-999 Employees 31 4.00 0.68 0.12 More than 1000 Employees
69 3.91 0.87 0.10
Total 182 4.00 0.80 0.05
Middle managers
Fewer than 100 Employees
15 4.46 0.91 0.23
100-249 Employees 36 3.52 1.08 0.18 250-499 Employees 31 3.12 0.80 0.14

182
N Mean Std. Deviation
Std. Error
500-999 Employees 31 3.12 1.23 0.22 More than 1000 Employees
69 3.18 1.03 0.12
Total 182 3.34 1.08 0.08 Members of the supervisory management/lower managers
Fewer than 100 Employees
15 4.20 1.08 0.27
100-249 Employees 36 3.05 1.24 0.20 250-499 Employees 31 2.64 1.01 0.18 500-999 Employees 31 3.03 0.91 0.16 More than 1000 Employees
69 2.86 1.53 0.18
Total 182 3.00 1.31 0.097 The mean is an average on a scale of 1 strongly disagree to 5 strongly agree.
5.2.7 Participation in the Development of Strategic Plans (by Managers/Board Members and Ownership)
The analysis of participation in the development of strategic planning taking
into account members of the top management team or board and ownership shows that
there is a high degree of agreement in the results shown in Table 41 between the whole
sample and the subsamples. In general the participation of the CEO/managing director,
board of directors, and planning committee/specialists is high (Mean≤ 4) in the three
categories of ownership. However, the participation of managers and members of the
supervisory management/lower managers tends to be lower. It was interesting to find
that the participation of the middle managers (Mean=2.99) and members of the
supervisory management/lower managers (Mean=2.62) is very low in organizations
that have 1-25 % Foreign Ownership. This may be because such organizations have
limited numbers of employees.

183
Table 41: Participation in the Development of Strategic Plans (by Managers/Board Members) in relation to Ownership
N Mean Std. Deviati
on
Std. Error
CEO/managing director
0% Foreign Ownership
69 4.69 0.60 0.07
1-25 % Foreign Ownership
82 4.68 0.49 0.05
26-49% Foreign Ownership
31 4.83 0.52 0.09
Total 182 4.71 0.54 0.04
Board of directors
0% Foreign Ownership
69 4.49 0.81 0.09
1-25 % Foreign Ownership
82 4.51 0.50 0.05
26-49% Foreign Ownership
31 4.74 0.68 0.12
Total 182 4.54 0.66 0.04
Planning committee/specialists
0% Foreign Ownership
69 4.39 0.75 0.09
1-25 % Foreign Ownership
82 4.08 0.57 0.06
26-49% Foreign Ownership
31 4.25 0.72 0.13
Total 182 4.23 0.68 0.05
Senior managers
0% Foreign Ownership
69 4.11 0.84 0.10
1-25 % Foreign Ownership
82 3.81 0.81 0.09
26-49% Foreign Ownership
31 4.22 0.49 0.08
Total 182 4.00 0.80 0.05
Middle managers
0% Foreign Ownership
69 3.75 1.09 0.13
1-25 % Foreign Ownership
82 2.98 1.13 0.125
26-49% Foreign Ownership
31 3.35 0.48 0.08
Total 182 3.34 1.08 0.08

184
N Mean Std. Deviati
on
Std. Error
Members of the supervisory management/lower managers
0% Foreign Ownership
69 3.36 1.31 0.15
1-25 % Foreign Ownership
82 2.62 1.38 0.15
26-49% Foreign Ownership
31 3.22 0.76 0.13
Total 182 3.00 1.31 0.09 The mean is an average on a scale of 1 strongly disagree to 5 strongly agree.
5.2.8 Tools Used in Developing Strategic Plans
As shown in Table 42, the first six tools clearly exceed the median measure,
i.e., pro forma financial statements (e.g., cash flow, income statement and budget),
cost-benefit analysis, benchmarking, gap analysis, balanced scorecard and SWOT
analysis. One of the reasons for this finding may be associated with the ease with which
these six tools can be prepared and used (Elbanna, 2007). Less use is made of value
chain analysis, spreadsheet ‘what if’ analysis, Porter’s five forces analysis, Portfolio
analysis (e.g., Boston consulting matrix or General Electric matrix) and PEST
(Political, Economic, Social and Technological) analysis. However, the mean of all of
these tools is still higher than the cut-off point (3). As noted by Elbanna (2007), this
may be due to the more demanding skills required to use these tools effectively. In this
regard it is the ease of application that determines the type of tool used in strategic
planning. The results in general testify to the high awareness level of strategic planning
tools in the UAE in general.

185
Table 42: Distribution of the sample by Strategic Planning Tools Used
Tools Mean
Pro forma financial statements (e.g., cash flow, income statement and budget)
4.60
Cost-benefit analysis 4.54 Benchmarking 4.41 Gap analysis 4.30 Balanced scorecard 4.24 SWOT analysis 4.10 Value chain analysis 3.82 Spreadsheet “what if” analysis 3.74 Porter’s five forces analysis 3.70 Portfolio analysis (e.g., Boston consulting matrix or General Electric matrix)
3.54
PEST (Political, Economic, Social and Technological) analysis 3.53 N = 182
5.2.9 Tools Used in Developing Strategic Plans (by Organizational Size)
Similarly, regarding the number of employees, there is a high degree of
agreement in the results shown in Table 43 between the whole sample and the
subsamples. In general, the eleven tools listed above clearly exceed the median
measure, i.e., pro forma financial statements (e.g., cash flow, income statement and
budget), cost–benefit analysis, benchmarking, Gap analysis, Balanced Scorecard,
Value chain analysis, Spreadsheet “what if” analysis, SWOT analysis, PEST (Political,
Economic, Social and Technological analysis), Portfolio analysis and Porter’s five
forces analysis. As mentioned earlier, this also reflects a high degree of awareness in
Abu Dhabi’s semi-government sector of these strategic planning tools. Moreover, the
eleven tools clearly exceed the median measure regardless of the size of organization
in terms of the number of employees.

186
Table 43: Strategic Planning Tools Used (by Organizational Size)
N Mean Std. Deviati
on
Std. Error
Pro forma financial statements (e.g., cash flow, income statement and budget)
Fewer than 100 Employees
15 4.46 0.74 0.19
100-249 Employees 36 4.66 0.71 0.11 250-499 Employees 31 4.48 0.88 0.15 500-999 Employees 31 4.51 0.62 0.11 More than 1000 Employees
69 4.69 0.60 0.07
Total 182 4.60 0.69 0.05
Cost-benefit analysis
Fewer than 100 Employees
15 4.93 0.25 0.06
100-249 Employees 36 4.61 0.76 0.12 250-499 Employees 31 4.19 0.74 0.13 500-999 Employees 31 4.22 0.56 0.10 More than 1000 Employees
69 4.71 0.54 0.06
Total 182 4.53 0.66 0.04
Benchmarking
Fewer than 100 Employees
15 4.66 0.72 0.18
100-249 Employees 36 4.41 0.55 0.09 250-499 Employees 31 4.00 0.81 0.14 500-999 Employees 31 3.87 0.76 0.13 More than 1000 Employees
69 4.78 0.48 0.05
Total 182 4.41 0.72 0.05
Gap analysis
Fewer than 100 Employees
15 4.66 0.72 0.18
100-249 Employees 36 4.50 0.77 0.12 250-499 Employees 31 3.90 0.90 0.16 500-999 Employees 31 3.64 0.95 0.17 More than 1000 Employees
69 4.59 0.55 0.06
Total 182 4.30 0.84 0.06
Balanced scorecard
Fewer than 100 Employees
15 3.60 1.05 0.27
100-249 Employees 36 4.16 0.94 0.15 250-499 Employees 31 4.03 0.87 0.15

187
N Mean Std. Deviati
on
Std. Error
500-999 Employees More than 1000 Employees
31 69
3.67 4.75
0.94 0.52
0.16 0.06
Total 182 4.23 0.91 0.06
Value chain analysis
Fewer than 100 Employees
15 3.13 0.83 0.21
100-249 Employees 36 3.69 1.00 0.16 250-499 Employees 31 3.67 0.83 0.14 500-999 Employees 31 3.80 0.79 0.14 More than 1000 Employees
69 4.10 0.95 0.11
Total 182 3.81 0.94 0.06
Spreadsheet “what if” analysis
Fewer than 100 Employees
15 3.66 1.11 0.28
100-249 Employees 36 3.52 0.97 0.16 250-499 Employees 31 3.38 0.88 0.15 500-999 Employees 31 3.38 1.49 0.26 More than 1000 Employees
69 4.17 0.72 0.08
Total 182 3.73 1.04 0.07
SWOT analysis
Fewer than 100 Employees
15 4.00 0.75 0.19
100-249 Employees 36 4.13 0.89 0.14 250-499 Employees 31 4.00 1.06 0.19 500-999 Employees 31 3.22 1.54 0.27 More than 1000 Employees
69 4.55 0.77 0.09
Total 182 4.10 1.10 0.08
PEST (Political, Economic, Social and Technological) analysis
Fewer than 100 Employees
15 4.13 1.12 0.29
100-249 Employees 36 3.16 1.15 0.19 250-499 Employees 31 3.22 1.11 0.20 500-999 Employees 31 3.12 1.60 0.28 More than 1000 Employees
69 3.91 1.31 0.15
Total 182 3.53 1.34 0.09 Portfolio analysis (e.g., Boston consulting
Fewer than 100 Employees
15 3.26 1.16 0.30

188
N Mean Std. Deviati
on
Std. Error
matrix or General Electric matrix)
100-249 Employees 36 3.80 0.92 0.15 250-499 Employees 31 3.61 0.88 0.15 500-999 Employees 31 3.64 1.08 0.19 More than 1000 Employees
69 3.37 1.41 0.17
Total 182 3.53 1.17 0.08
Porter’s five forces analysis
Fewer than 100 Employees
15 3.80 0.56 0.14
100-249 Employees 36 3.91 0.87 0.14 250-499 Employees 31 3.41 0.88 0.15 500-999 Employees 31 3.87 0.99 0.17 More than 1000 Employees
69 3.60 1.39 0.16
Total 182 3.69 1.10 0.08 The mean is an average on a scale of 1 strongly disagree to 5 strongly agree.
5.2.10 Tools Used in Developing Strategic Plans (by Ownership)
Finally, regarding the type of ownership, there is a high degree of agreement
in the results shown in Table 44 between the whole sample and the subsamples. In
general the eleven tools clearly exceed the median measure, i.e., pro forma financial
statements (e.g., cash flow, income statement and budget), cost-benefit analysis,
benchmarking, Gap analysis, Balanced Scorecard, Value chain analysis, Spreadsheet
“what if” analysis, SWOT analysis, PEST (Political, Economic, Social and
Technological analysis), Portfolio analysis and Porter’s five forces analysis. As noted
above, this also reflects a high degree of awareness in Abu Dhabi’s semi-government
sector of these strategic planning tools. Moreover, the eleven tools clearly exceed the
median measure, regardless of the type of ownership.

189
Table 44: Strategic Planning Tools Used (by Ownership)
N Mean Std. Deviation
Std. Error
Pro forma financial statements (e.g., cash flow, income statement and budget)
0% Foreign Ownership 69 4.31 0.88 0.10 1-25 % Foreign Ownership
82 4.79 0.46 0.05
26-49% Foreign Ownership
31 4.74 0.51 0.09
Total 182 4.60 0.69 0.05
Cost-benefit analysis
0% Foreign Ownership 69 4.37 0.84 0.10 1-25 % Foreign Ownership
82 4.60 0.49 0.05
26-49% Foreign Ownership
31 4.70 0.52 0.09
Total 182 4.53 0.66 0.04
Benchmarking
0% Foreign Ownership 69 4.42 0.82 0.09 1-25 % Foreign Ownership
82 4.50 0.70 0.07
26-49% Foreign Ownership
31 4.16 0.45 0.08
Total 182 4.41 0.72 0.05
Gap analysis
0% Foreign Ownership 69 4.30 0.84 0.10 1-25 % Foreign Ownership
82 4.17 0.87 0.09
26-49% Foreign Ownership
31 4.64 0.66 0.11
Total 182 4.30 0.84 0.06
Balanced scorecard
0% Foreign Ownership 69 3.86 0.98 0.11 1-25 % Foreign Ownership
82 4.34 0.83 0.09
26-49% Foreign Ownership
31 4.77 0.56 0.10
Total 182 4.23 0.91 0.06
Value chain analysis
0% Foreign Ownership 69 3.72 1.06 0.12 1-25 % Foreign Ownership
82 3.97 0.83 0.09
26-49% Foreign Ownership
31 3.61 0.88 0.15
Total 182 3.81 0.94 0.06

190
N Mean Std. Deviation
Std. Error
Spreadsheet “what if” analysis
0% Foreign Ownership 69 3.97 0.95 0.11 1-25 % Foreign Ownership
82 3.69 1.12 0.12
26-49% Foreign Ownership
31 3.32 0.90 0.16
Total 182 3.73 1.04 0.07
SWOT analysis
0% Foreign Ownership 69 4.14 0.98 0.11 1-25 % Foreign Ownership
82 4.09 1.31 0.14
26-49% Foreign Ownership
31 4.03 0.70 0.12
Total 182 4.10 1.10 0.08
PEST (Political, Economic, Social and Technological) analysis
0% Foreign Ownership 69 4.01 0.97 0.11 1-25 % Foreign Ownership
82 3.42 1.46 0.16
26-49% Foreign Ownership
31 2.74 1.29 0.23
Total 182 3.53 1.34 0.09
Portfolio analysis (e.g., Boston consulting matrix or General Electric matrix)
0% Foreign Ownership 69 3.71 1.08 0.13 1-25 % Foreign Ownership
82 3.31 1.29 0.14
26-49% Foreign Ownership
31 3.74 0.92 0.16
Total 182 3.53 1.17 0.08
Porter’s five forces analysis
0% Foreign Ownership 69 3.86 0.96 0.11 1-25 % Foreign Ownership
82 3.39 1.28 0.14
26-49% Foreign Ownership
31 4.12 0.56 0.10
Total 182 3.69 1.10 0.08 The mean is an average on a scale of 1 strongly disagree to 5 strongly agree.
5.3 Hypotheses Testing
The data were analysed using path analysis, which is a multivariate analytical
methodology for empirically examining sets of relationships in the form of linear

191
causal models (Duncan, 1986; Li, 1975). The aim of path analysis is to examine the
direct and indirect effects of each hypothesis on the basis of knowledge and theoretical
constructs (Pedhazur, 1982). Path analysis does not establish causal relations with
certainty, but is used for quantitative interpretations of possible causal relationships
(Borchgrevink and Boster, 1998). A path diagram represents the proposed antecedents
and consequents among the variables in the model. Arrows are used to symbolize the
hypothesized relationships and the direction of influence in the model. In specifying a
path model, a distinction is drawn between exogenous variables and endogenous
variables. The influence of exogenous variables is outside the model, while
endogenous variables have influence within the model. In this case, the strategic
planning processes are treated as the only exogenous variables, and organizational
performance and organizational competitiveness are the endogenous variables.
Figure 4 below depicts the proposed path diagram that reflects the relationships
between the variables. The value of the path coefficient associated with each path
represents the strength of each linear influence. The structural-equation-modelling
package, AMOS, was used to test the hypotheses shown in the model. We used the
factor scores as single item indicators and performed a path analysis, applying the
maximum likelihood estimates (MLE) method, following the guidelines suggested by
Joreskog and Sorbom (1982).
Before testing the model, in which all the dimensions together were
considered, it is important to highlight, from a methodological point of view, that
individualized analyses of each of the dimensions were made (according to the
measurement model), in order to refine in advance the items used in their
measurement. Having established the different measures, a confirmatory factor

192
analysis (CFA) was conducted. This research used both a structural model (which
includes all the constructs in one model) and a measurement model (in which each
construct has a separate model) (Hair et al., 2006).

193
Figure 4: Research Model
INDEPENDENT
VARIABLES
Organizational
Performance
H8f
H8e H8d H8c H8b H8a
H7
H6
H5
H4
H3
H2
H1 STRATEGY
FORMULATION
Practice of strategic
planning
Environmental Dynamism
STRATEGY
FORMULATION
Intensity
STRATEGY
IMPLEMENTATIO
N
Comprehensiveness
STRATEGY
IMPLEMENTATION
Alignment
STRATEGY
EVALUATION
Accountability
STRATEGY
EVALUATION
Strategic control
Organizational
Competitiveness
MODERATOR
FINAL RESULTS
Control Variable
Organizational Size

194
5.3.1 Measurement Models
To apply the MLE method for estimating the model, the constructs must satisfy
the criterion of multivariate normality (Bagozzi & Yi, 1988). Therefore, for all the
constructs, tests of normality, i.e. skewness and kurtosis (Bagozzi & Yi, 1988), were
conducted. Table 45 indicates no departure from normality, since most of the results
are close to one (i.e. +/- 1) (Bagozzi & Yi, 1988). Thus, once normality was confirmed
for all the constructs, it was decided to proceed with the use of the maximum likelihood
estimation (MLE) method to estimate the model. The reliability of the constructs was
assessed by item-to-total correlations and Cronbach’s alpha reliability coefficient (see
Chapter 4) (Nunnally & Bernstein, 1994).
Furthermore, the analysis of Mahalanobis distance was carried out using
AMOS to identify any multivariate outliers within the data. The Mahalanobis distance
is a metric for estimating how far each case is from the centre of all the distributions
of the variables (i.e. the centroid in multivariate space) (Mahalanobis, 1927). The
Mahalanobis distance test used in the present thesis identified one case which had an
outlier. However, due to the limited number of available cases it was decided to keep
it (the results of the Mahalanobis distance test are listed in the appendices).

195
Table 45: Skewness and Kurtosis
Variable Skewness Kurtosis Practice of Strategic Planning -0.23 0.52 Intensity of Strategic Planning -0.80 1.05 Comprehensiveness of Strategic Plan Implementation
-0.69 -0.72
Alignment of Strategic Plan Implementation
-0.50 0.13
Accountability -0.87 -0.01 Strategic control -0.07 -1.04 Organizational Performance -0.28 -0.84 Organizational Competitiveness -0.69 0.83 Organizational Size -0.59 -1.09
Next, several fit statistics were used to evaluate the acceptability of each of the
factor models. As recommended by Bentler and Bonnet (1980), the goodness-of-fit
index was taken into account and results were deemed acceptable if above the
recommended value of 0.90. Additionally, the comparative fit index (CFI) was also
used and acceptable model fit was demonstrated with CFIs above 0.90. Furthermore,
the adjusted goodness-of-fit index (AGFI), and the root mean square residual
(RMSEA) were also provided. Standard cut-offs for the above indices, as proposed by
experts (Bentler, 1990; Hu and Bentler, 1995; Joreskog and Sorbom, 1982), are
provided in Table 46. The results indicated that the scales were unidimensional.

196
Table 46: Confirmatory Factor Analysis of Model Constructs
Construct Chi-Square
DF P GFI
AGFI
CFI RMSEA
Practice of Strategic Planning 36.06 22 .03 .96 .88 .98 0.05 Intensity of Strategic Planning 2.73 4 .60 .99 .97 .99 0.00 Comprehensiveness of Strategic Plan
2.31 3 .51 .99 .97 .99 0.00
Alignment of Strategic Plan Implementation
31.42 12 .06 .96 .88 .98 0.09
Accountability 1.30 2 .52 .99 .98 1.0 0.00 Strategic control 0.85 2 .65 .99 .98 1.0 0.00 Organizational Performance 32.6 16 .08 .96 .89 .98 0.07 Organizational Competitiveness 2.96 2 .22 .99 .96 .99 0.05 Statistic Suggested Goodness-of-fit index (GFI) ≥0.90 Adjusted goodness-of- fit index (AGFI)
≥0.80
Comparative fit index (CFI) ≥0.90 Root mean square residual (RMSEA)
≤0.10
Chi-Square Significant ≥0.05
To meet the requirements of satisfactory convergent and discriminant validity,
the six strategic planning dimensions, one environmental characteristic and two
organizational outcomes were tested by confirmatory factor analysis. Convergent
validity describes the extent to which the indicators of a specific construct converge or
share a high proportion of variance (Hair et al., 2006). Convergent validity is achieved
if the average variance extracted (AVE) for a construct is greater than 0.50. Table 47
on the following page summarizes the results of the convergent validity analysis. Note
that all of the scales had an acceptable convergent validity. The AVE for the Practice
of strategic planning is 0.55, for the Intensity of strategic planning is 0.77, for the
Comprehensiveness of strategic plan implementation is 0.84, for the Alignment of
strategic plan implementation is 0.74, for Accountability is 0.76, for Strategic control

197
is 0.82, for Organizational performance is 0.82, for Organizational competitiveness is
0.87, and for dynamism is 0.88, all exceeding the minimum threshold of 0.5.
Meanwhile, discriminant validity is the distinctiveness of two conceptually
similar constructs (Hair et al., 2006). This indicates that each construct should share
more variance with its items than it shares with other constructs. Discriminant validity
is present when the variances extracted by the constructs (AVE) from each construct
are greater than the square of the correlations. Table 47 shows that the AVE in each
case was greater than any squared correlation among the constructs (the factor scores
as single item indicators were used to calculate the between-constructs correlations);
this implied that the constructs were empirically distinct (Fornell & Larcker, 1981).

198
Table 47: Cronbach’s alpha, Bivariate Correlations, and Average Variances Extracted (AVE)
(1) (2) (3) (4) (5) (6) (7) (8) (9) Practice of Strategic Planning (1)
0.55
Intensity of Strategic Planning (2)
0.231 **
0.77
Comprehensiveness of Strategic Plan Implementation (3)
0.087 **
0.078 **
0.84
Alignment of Strategic Plan Implementation (4)
0.251 **
0.356 **
0.298 **
0.74
Accountability (5) 0.006 **
0.152 **
0.150 **
0.208 **
0.76
Strategic Control (6) 0.061 **
0.289 **
0.422 **
0.219 **
0.117 **
0.82
Organizational Performance (7)
0.140 **
0.078 **
0.081 **
0.137 **
0.071 **
0.113 **
0.82
Organizational Competitiveness (8)
0.145 **
0.127 **
0.040 **
0.138 **
0.103 **
0.080 **
0.675 **
0.87
Environmental Dynamism (9)
0.175 **
0.252 **
0.388 **
0.370 **
0.285 **
0.361 **
0.423 **
0.379 **
0.88
Organizational Size (10) 0.027 *
0.000 0.169 **
0.079 **
0.126 **
0.019 0.202 **
0.227 **
0.299 **
Coefficient Alpha 0.83 0. 89 0.92 0.90 0.85 0.89 0.90 0.93 0.93 *. Correlation is significant at the 0.05 level (2-tailed), **. Correlation is significant at the P<0.01 level (2-tailed). ***. Correlation is significant at the P<0.01 level (2-tailed). The diagonals represent the average variance extracted (AVE) in Bold and the lower cells represent the squared correlation among the constructs.
For example, the AVE of the Alignment of Strategic Plan Implementation is
0.74, which is greater than any squared correlation among the other constructs, i.e.
0.208, 0.219, 0.137, 0.138, 0.370, 0.079.
In these tests, the AVEs were found to be high, while all the standardized item
loadings were statistically significant and associated with the nominated constructs.

199
The reliability of the strategic planning constructs that are included in the model
(Strategic Planning Practice = 0.83, Strategic Planning Intensity= 0.89,
Comprehensiveness of Strategic Plan Implementation = 0.92, Alignment of Strategic
Plan Implementation = 0.90, Accountability = 0.85, Strategic Control = 0.89,
Organizational Performance = 0.90, Organizational Competitiveness = 0.93,
Environmental Dynamism = 0.93) was invariably high. In summary, the measurement
model test, including convergent and discriminant validity measures, was satisfactory.
5.3.2 Structural-Model Testing
Finally, given that the purpose of the study was to test the hypothesized causal
relationships among the constructs of the model, we used the structural equation-
modeling package, AMOS 22 (see Figure 4). The factor means were employed as
single item indicators to perform path analysis, applying the maximum likelihood
estimates (MLE) method, following the guidelines suggested by Joreskog & Sorbom
(1982).
A more detailed analysis of the results and measures for model fit is reported
in Table 48. The organizational size was used as a control variable to test its effect on
performance and competitiveness. Since there is no definitive standard of fit, a variety
of indices is provided in Table 48, along with their suggested values. Unlike the
traditional statistical procedures, where the null hypothesis posits no relationship
between the variables of interest (and thus, where researchers hope to reject it), in path
(SEM) analysis, the null hypothesis posits that the research model being investigated
fits the collected data well (and thus, researchers hope not to reject it). The non-
significant value of the Chi-square test (X2 = 0.11) in Table 48 indicates an adequate

200
fit. The other fit indices, together with the squared multiple correlations, also indicate
a good overall fit with the data (GFI = 0.96, CFI = 0.96, NFI = 0.95, RMSEA = 0.09,
RMR=0.01). Since these indices confirm that the overall fit of the model to the data
was good, it was concluded that the structural model was an appropriate basis for
hypothesis testing.
Table 48: Standardized Regression Weights
Predictor variables
Criterion Variables
Hypothesized relationship
Standardized coefficient
R2
Practice of strategic planning
Organizational Performance
H1 0.071ns 0.72
Intensity of strategic planning
Organizational Performance
H2 0.211***
Comprehensiveness of strategic plan implementation
Organizational Performance
H3 0.148***
Alignment of strategic plan implementation
Organizational Performance
H4 0.278***
Accountability Organizational Performance
H5 0.275***
Strategic Control Organizational Performance
H6 0.273***
Organizational Size Organizational Performance
Control 0.253***
Organizational Performance
Organizational Competitiveness
H7 0.658*** 0.55
Organizational Size Organizational Competitiveness
Control 0.124*
Statistic Suggested Obtained
Chi-Square Significance ≥0.05 0.11 Goodness-of-fit index (GFI) ≥0.90 0.96 Comparative fit index (CFI) ≥0.90 0.96 Normed Fit Index (NFI) ≥0.90 0.95 Root Mean Square Residual (RMR) ≤0.05 0.01 Root mean square residual (RMSEA) ≤0.10 0.09 *P<0.05, **P<0.01, ***P<0.001, ns is not significant

201
Hypothesis testing was conducted by examining the estimated standardized
parameters for the causal paths, which are obtained from the output of AMOS. Table
48 shows these parameters. Apart from the Practice of Strategic Planning (H1)
(Standardized Estimate=0.071, P= 0.110 which is not significant), the suggested paths
positively affected organizational performance. These paths were Strategic Planning
Intensity (H2) (Standardized Estimate=0. 211, P< 0.001), Comprehensiveness of
Strategic Plan Implementation (H3) (Standardized Estimate=0.148, P< 0.001),
Alignment of Strategic Plan Implementation (H4) (Standardized Estimate=0.278,
P<0.001), Accountability (H5) (Standardized Estimate=0.275, P< 0.001) and Strategic
Control (H6) (Standardized Estimate=0.273, P< 0.001).
It was also found that Organizational Performance affects Organizational
Competitiveness. This gives support to H7 (Standardized Estimate=0.658, P<0.001).
It shows the great role played by organizational performance in determining the level
of organizational competitiveness.
The results further indicate that organizational size positively affects
organizational performance (Standardized Estimate=0. 253, P< 0.001) and
organizational competitiveness (Standardized Estimate=0.124, P<0.05). This finding
is consistent with related strategy research, which argues that size can systematically
affect managerial practices (Child & Mansfield, 1972); and thus justifies its use as the
control variable in this study.
Figure 5 shows the results of hypotheses testing on the research model
displayed in Figure 4, including the results of testing the moderation hypotheses, which
are covered below.

202
Figure 5: Tested Model
0.12*
0.25*
INDEPENDENT
VARIABLES
Organizational
performance
0.72 x
.45 **
.24***
.26 **
.36***
.25 ns
.27***
.24ns
.30**
.16 **
.41***
-.01ns
.04ns
0.66*
0.27*
0.28*
.28***
0.15*
0.21***
.071 ns
STRATEGY
FORMULATION
Practice of strategic
planning
- Environmental Dynamism
STRATEGY
FORMULATION
Intensity
STRATEGY
IMPLEMENTATION
Comprehensiveness
STRATEGY
IMPLEMENTATION
Alignment
STRATEGY
EVALUATION
Accountability
STRATEGY
EVALUATION
Strategic Control
Organizational
Competitiveness
0.55 x
MODERATOR
FINAL RESULTS
*P<0.05, **P<0.01, ***P<0.001, ns is not significant and x Squared Multiple Correlation
Control Variable
Organizational Size

203
5.3.3 Moderating Effects of Environmental Dynamism
To evaluate the moderating effects of environmental dynamism, the study
followed the methodology of Zhao & Cavusgil (2006). According to them, a two-
group model can be used, because it can determine whether environmental dynamism
moderates the effect of the strategic planning processes on organization performance.
The sample was split into two groups according to the mean score of the environmental
dynamism of the participating organizations. The data above the mean (3) were
defined as high and supportive environmental dynamism, and the data below the mean
as low in terms of environmental dynamism. A two group AMOS model was used
later to determine whether or not there was any significant difference between the
structural parameters of the high environmental dynamism group and those of the low
environmental dynamism group. In the first analysis, the parameter from
environmental dynamism was constrained to be equal. In the second, the parameter
was kept free (not constrained). Differences in the T values between the two models
determined whether the degree of environmental dynamism had a moderating effect
on the relationship between the strategic planning processes and organizational
performance.
Table 49 shows that, for the different strategic planning dimensions, the
coefficients of the high environmental dynamism score group were greater than those
of the low environmental dynamism score group. The coefficient of the practice of
strategic planning for the low environmental dynamism group was 0.011 (not
significant, P>0.05) and that for the high environmental dynamism group was 0.049
(not significant, P>0.05). Although the environmental dynamism was hypothesized to
moderate the relationship between the practice of strategic planning and organizational

204
performance, the results indicated that this moderation effect is insignificant (T= 0.27:
the accepted level for 5% alpha ≤ 1.96). This result leads to the rejection of H8a.
The T statistic has been calculated according to the following equations
(Cohen, 1983):
𝑇𝑇 = 𝑝𝑝𝑝𝑝𝑝𝑝ℎ_ℎ𝑖𝑖𝑖𝑖ℎ − 𝑝𝑝𝑝𝑝𝑝𝑝ℎ_𝑙𝑙𝑙𝑙𝑙𝑙
𝑆𝑆𝑆𝑆� 1𝑛𝑛1
+ 1𝑛𝑛2
𝑆𝑆𝑆𝑆 = �(𝑛𝑛1 − 1)2(𝑆𝑆.𝐸𝐸1)2 + (𝑛𝑛2 − 1)2 (𝑆𝑆. 𝐸𝐸2)2
𝑛𝑛1 + 𝑛𝑛2 − 2
SP: polled standard deviation
Table 49: Test moderating effect
Relationship Moderator Hypothesis Coefficient T Difference Practice of strategic planning
Low environmental dynamism
H8a 0.011 ns 0.27
High environmental dynamism
0.049 ns
Intensity of strategic planning
Low environmental dynamism
H8b 0.163 ** 1.37
High environmental dynamism
0.410***
Comprehensiveness of strategic plan implementation
Low environmental dynamism
H8c 0.245 ns .040
High environmental dynamism
0.304***
Alignment of strategic plan implementation
Low environmental dynamism
H8d 0.256 ns 0.13
High environmental dynamism
0.276***
Accountability Low environmental dynamism
H8e 0.262** 0.66
High environmental dynamism
0.361***

205
Relationship Moderator Hypothesis Coefficient T Difference Strategic control Low environmental
dynamism H8f
0.454 ** 1.39
High environmental dynamism
0.248***
*P<0.05, **P<0.01, ***P<0.001, ns is not significant
Using the same procedure, the moderating effect of the environmental
dynamism on the relationship between the intensity of the strategic planning and
organizational performance was calculated. The coefficient of the intensity of strategic
planning for the low environmental dynamism group was 0.163 (significant, P<0.01)
and for the high environmental dynamism group it was 0.410 (significant, P<0.001).
Hence, it appears that environmental dynamism significantly moderates the
relationship between the intensity of the strategic planning and organizational
performance (T= 1.37: the accepted level for 5% alpha ≤ 1.96), supporting H8b.
However, the coefficient of the comprehensiveness of the strategic planning
implementation for the low environmental dynamism group was 0.245 (not significant,
P>0.05) and for the high environmental dynamism group it was 0.304 (significant,
P<0.001). Hence, it appears that environmental dynamism significantly moderates the
relationship between the comprehensiveness of the strategic planning implementation
and organizational performance (T= 0.40: the accepted level for 5% alpha ≤ 1.96),
supporting H8c. Similarly, the coefficient of the alignment of the strategic planning
implementation for the low environmental dynamism group was 0.256 (not significant,
P>0.05) and for the high environmental dynamism group it was 0.276 (significant,
p<0.001). Hence, it appears that environmental dynamism significantly moderates the
relationship between the alignment of the strategic planning implementation and

206
organizational performance (T= .13: the accepted level for 5% alpha ≤ 1.96),
supporting H8d.
In line with this, the coefficient of the accountability for the low environmental
dynamism group was 0.262 (significant, P<0.01) and for the high environmental
dynamism group was 0.361 (significant, P<0.001). Hence, it appears that
environmental dynamism significantly moderates the relationship between the
accountability of strategic planning and organizational performance (T= 0.66: the
accepted level for 5% alpha ≤ 1.96), supporting H8e.
Finally, the coefficient of the control of the strategic planning for the low
environmental dynamism group was 0.454 (significant, P<0.01) and for the high
environmental dynamism group was 0.248 (significant, P<0.001). Hence, it appears
that environmental dynamism significantly moderates the relationship between control
of the strategic planning and organization performance (T= 1.39: the accepted level
for 5% alpha ≤ 1.96), supporting H8f.
5.4 Conclusion and Summary of Findings
This chapter reported the results of exploratory analysis of the strategic
planning practices of the organizations sampled in the study and described the
procedures and findings of path analysis, which was used for testing the hypotheses.
The summary of the hypothesis testing is presented in Table 50 below:

207
Table 50: Results of Hypothesis Testing
Hypotheses Results H1. Practice of strategic planning (the use of strategic planning tools) is positively related to organizational performance.
Rejected
H2. Intensity of strategic planning is positively related to organizational performance.
Accepted
H3. Comprehensiveness of strategic plan implementation is positively related to organizational performance.
Accepted
H4. Alignment of strategic plan implementation is positively related to organizational performance.
Accepted
H5. Accountability is positively related to organizational performance. Accepted
Accepted
H6. Strategic control is positively related to organizational performance.
Accepted
H7. Organizational performance is positively related to organizational competitiveness.
Accepted
H8a. Environmental dynamism moderates the relationship between strategic planning practice and organizational performance.
Rejected
H8b. Environmental dynamism moderates the relationship between intensity of strategic planning and organizational performance.
Accepted
H8c. Environmental dynamism moderates the relationship between comprehensiveness of strategic plan implementation and organizational performance.
Accepted
H8d. Environmental dynamism moderates the relationship between alignment of strategic plan implementation and organizational performance.
Accepted
H8e. Environmental dynamism moderates the relationship between accountability and organizational performance.
Accepted
H8f. Environmental dynamism moderates the relationship between strategic control and organizational performance.
Accepted

208
Chapter 6: Discussion and Conclusion
6.1 Introduction
This chapter discusses the study results. It starts by addressing the results of
the exploratory analysis of strategic planning practice in the sampled companies. Then
it discusses the hypotheses concerning the relationships of strategic plan formulation,
strategic plan implementation and strategic plan evaluation to organizational
performance before reviewing the findings on the relationship between organizational
performance and organizational competitiveness and addressing the findings related
to the moderating effects of environmental dynamism. The chapter also highlights the
implications of the study to academics and practitioners. Consecutively, the limitations
of this study are discussed, and areas for future research are identified.
6.2 Discussion of the Research Findings
6.2.1 Exploratory Analysis of Strategic Planning Practice
6.2.1.1 Development of the First Strategic Plan
Nearly half of the organizations studied developed their first strategic plans
less than five years ago. Only 22% of the organizations developed their strategic plans
more than 5 years ago. This reflects the fact that strategic planning in Abu Dhabi is
still in its early stages, as confirmed by related research (Elbanna, 2013), which shows
that the formal practice of strategic planning in Abu Dhabi public organizations started
a decade ago.

209
6.2.1.2 Planning Horizon
The analysis shows that the average number of years in the sample’s planning
horizon is 5.75 years. This time horizon is longer than the strategic planning horizon
(4.2 years) found in the study by Elbanna (2013). This study also shows that most
organizations developed their plans for periods of either 3 or 5 years.
6.2.1.3 Time needed to Prepare the Strategic Plan
The result of this study confirms the findings of related research in the United
Arab Emirates (Elbanna, 2010, 2013) that most of the sampled organizations took less
than 8 months to develop strategic plans and that large organizations tend to require
more time than small ones to prepare their strategic plans, since large organizations
have more complex strategic planning processes.
6.2.1.4 Size of Strategic Planning Units
Most of the participating organizations have 10 or fewer employees in charge
of developing their strategic plans. This result is similar to the result for the study by
Elbanna (2013), who found that the sampled organizations had an average of 6.5
employees involved in planning strategies.
6.2.1.5 Participation in the Development of Strategic Plans (by Managers/Board Members)
CEOs/managing directors have the highest level of participation in the
strategic planning process: the board of directors and the planning
committees/specialists come second and third, respectively. In line with the argument

210
of Elbanna (2010), there is a positive link in the Arab region, including the UAE,
between managerial level and the degree of participation in the strategic planning
process, demonstrating that the higher the seniority, the greater the participation in the
strategic planning process。
The participation of managers and members of supervisory management/lower
managers tends to be lower. Interestingly, the participation of the middle managers
and members of supervisory management/lower managers is high in organizations that
have fewer than 100 employees. This indicates that smaller organizations tend to
include middle and lower level managers in their strategic plans.
6.2.1.6 Tools Used in Developing Strategic Plans
Organizations use pro forma financial statements, cost-benefit analysis,
benchmarking, gap analysis, balanced scorecard and SWOT analysis more than the
other tools listed. One of the reasons for this finding may be associated with the ease
with which these six tools can be prepared and used (Elbanna, 2007). Less use is made
of value chain analysis, spreadsheet “what if” analysis, Porter’s five forces analysis,
Portfolio analysis and PEST analysis. As noted by Elbanna (2007), this may be due to
the more demanding skills required to use these tools effectively. Regardless of the
size of organization, they all use the eleven tools.

211
6.2.2 Strategic Plan Formulation and Organisation Performance
6.2.2.1 Practice of strategic planning and organizational performance
The practice of strategic planning (use of strategic planning tools) is found not
to be positively related to organizational performance. This result is in conflict with
the predictions of the present study. The result is also inconsistent with that of Elbanna
(2010), who argues that although strategic planning tools neither make strategy nor
implement it, they can be used to gain new insights and understanding and to present
complex issues. In fact, planning tools could play an important analytical role and
serve as valuable communication tools, reducing many pages of narrative planning to
one or two diagrams (Elbanna, 2010; Hussey & Hussey, 1997). Koufopoulos &
Chrysochoidis, (2000) endorse these comments, pointing out that using strategic tools
offers more benefits than disadvantages to the organization. Our insignificant finding
about the impact of strategic planning on performance is also inconsistent with the
findings in some recent meta-analyses (e.g., Brinchmannet et. al., 2010; Mcllquham-
Schmidt, 2010), which report that strategic planning is positively related to
organizational performance.
One plausible explanation for these conflicting results with regard to the
impact of strategic planning on firm performance may be related to the design of the
present study. To be precise, this study examined the impact of strategic planning on
firm performance by analysing whether firm performance is associated with using a
number of strategic planning tools as a whole (e.g., experience curve analysis, value
chain analysis, Porter’s 5-forces analysis, SWOT analysis, etc.) However, this
approach fails to ascertain whether the strategic planning tools, considered
individually, affect performance.

212
Another explanation may be related to the fact that the investigation of the
impact on firm performance of strategic planning tools as a whole was carried out
along with an investigation of the moderating impact of environmental dynamism.
This approach assumes that dynamism affects each planning tool in the same manner
and thus fails to identify whether dynamism affects planning tools and their impact on
performance differently.
Taken together, these two reasons suggest that examining the moderating
impact of environmental dynamism on the relationship between strategic planning
tools viewed as a whole and performance may not be the proper way to investigate the
association between strategic planning and organizational performance. Thus, further
research could seek to distinguish the strategic planning tools from one another and
investigate separately the impact of each one on organizational performance, bearing
in mind the moderating role of environmental dynamism. This may help to explain the
missing moderating role of environmental dynamism on the link between strategic
planning practice and performance.
Finally, the unfamiliarity of the strategy formulators with planning tools may
also explain the inconsistent findings reported in this study and earlier ones with regard
to the impact of strategic planning on firm performance. As pointed out above in this
chapter, our data suggest that strategic planning in Abu Dhabi is still in its early stages,
a finding which is also put forward in Elbanna (2013). Therefore, it may be the case
that the strategy formulators in the organizations in our sample do not yet have the
necessary knowledge and skills to use strategic planning tools properly. If so, the
reason for our finding that strategic planning does not impact on firm performance
may be that the sampled organizatios in our study have not yet built up the knowledge

213
and skills to use the planning tools properly but not that strategic planning has no effect
on performance.
6.2.2.2 Intensity of Strategic Planning and Organizational Performance
The intensity of strategic planning is found to be positively related to
organizational performance. This finding is consistent with the findings of several
studies (e.g., (Mohd, Idris, & Momani, 2013). Chavunduka, Chimunhu, and Sifile
(2015), for example, reported that strategic planning intensity positively influences
firm performance amongst mining firms. Similarly, Hopkins and Hopkins (1997)
found that the intensity with which banks engage in the strategic planning process has
a direct positive effect on banks’ financial performance.
Our finding that planning intensity enhances organizational performance
confirms our reasoning that intensity helps managers to better understand their
environment (Miller, Burke, and Glick (1998) and become more capable and effective
in judging the environment’s potential effect on their organization, thereby ensuring
more effective decision making (Sniezek, 1992). Similarly, with higher intensity,
managers learn to base their strategic plans on relatively complete information on
environmental opportunities and threats (Elbanna, 2012), so as to generate and
evaluate a number of options (Menon, Bharadwaj, Adidam, & Edison, 1999;
Slotegraaf & Dickson, 2004), and to avoid their own cognitive biases (i.e.,
systematically deviating from good judgment (Tversky & Kahneman, 1974) in making
decisions. The consequence is that having intensive planning helps decision makers to
deal effectively with the inherent complexity of the strategic decision making process

214
(Hakimpoor, 2014) and to coordinate strategic actions and achieve better
organizational performance and effectiveness (Andersen (2004).
Our finding may also suggest that planning intensity positively affects
organizational performance because it sends strong signals to the members of the
organization and increases the attention that they pay to the planning process (Schäffer
and Willauer (2003), which will eventually increase the effectiveness of the planning
process, and in turn enhance organizational performance.
6.2.3 Strategic Plan Implementation and Organisational Performance
6.2.3.1 Comprehensiveness of Strategic Plan Implementation and Organizational Performance
The results of this study support the argument that the comprehensiveness of
strategic plan implementation is positively related to organizational performance. This
finding is consistent with related research which shows that comprehensiveness
positively contributes to superior organizational outcomes. In a recent study involving
231 public organizations in the UAE, for example, (Elbanna & Fadol, 2016) found that
the comprehensiveness of strategy implementation has a significant positive effect on
strategic planning effectiveness, which is positively associated with performance
(Veliyath and Shortell, 1993). Similarly, our finding supports that of Hickson, Miller,
and Wilson (2003), who argued in their study of 55 cases of decision implementation,
that organizations can use two approaches to implementation (i.e., readiness-based and
experience-based) and found that each approach is associated with enhanced
performance.

215
The reason behind the positive relationship between comprehensiveness and
organizational performance may be similar to that behind the positive relationship
between planning intensity and organizational performance. More specifically, our
finding may suggest that comprehensiveness allows implementers to deal effectively
with the inherent complexity of the implementation process (Hakimpoor, 2014) and
reduces decision makers’ cognitive biases during this process (Tversky & Kahneman,
1974), leading to better implementation practices. Furthermore, the
comprehensiveness of planning implementation may be positively related to
performance because it may enhance the motivation among decision makers to
implement (Miller, 2008).
6.2.3.2 Alignment of Strategic Plan and Organizational Performance
The alignment of strategic plan implementation is found to be positively
related to organizational performance. This result confirms that aligning
organizational factors with strategy allows organizations to achieve superior
performance (Slater & Olson, 2000). As discussed earlier, among the organizational
factors that need to be aligned may be Higgin’s (2005) 8Ss elements (i.e., Strategy and
Purposes, Structure, Systems and Processes, Leadership Style, Staff, reSources,
Shared Values and Strategic Performance) or the 5Ps elements of Pryor, Anderson,
Toombs, and Humphreys (2007), who claimed that the proper alignment of
organizational Purpose, Principles, Processes, and People is necessary for successful
implementation and good Performance.
In a broader sense, our findings indicate that organizations need to align
different aspects of organizational activities at organizational, interpersonal and

216
individual levels. At the organizational level, aligning strategy, structure and control
can create an environment that is conducive to implementation success. At an
interpersonal level, shared understanding among implementation managers is also
critical to organizations. At the individual level, alignment means that managers who
are involved in strategic planning should be committed to strategy (Noble, 1999).
6.2.4 Strategic Plan Evaluation and Organisational Performance
6.2.4.1 Accountability and Organizational Performance
The findings of this research showed that accountability is positively related to
organizational performance. This is consistent with previous arguments. For example,
Dubnick (2005) suggests that accountability leads to superior performance. This effect
occurs because accountability requires organizations to establish performance
standards, use these standards to evaluate the outcomes of implementation activities
(i.e., of strategic plans), and identify the sources of problems so that corrective actions
can be taken. When viewed from this perspective, accountability eventually leads to
superior performance.
Another plausible explanation for the positive effect of accountability on
organizational performance is that accountability requires the disclosure of
nonfinancial quantitative information to show how well an organization is fulfilling its
mission (Herzlinger, 1995; Oakes & Young, 2008).; and thus, promotes transparency
and openness (Schedler, Diamond, & Plattner, 1999); justice (Ambos, 2000); ethical
behaviour (Dubnick, 2003); and learning in pursuit of continuous improvement. Taken
together, all these outcomes of accountability should lead to improved organizational
performance.

217
Our result also seems to support the argument that accountability promotes
careful and critical managerial thinking because it makes managers responsible for
their (poor) decisions. As suggested by Cavalluzzo and Ittner (2004), when managers
are held accountable for results, they are more likely to make decisions accurately and
carefully, thus improving performance.
6.2.4.2 Strategic Control and Organizational Performance
Consistent with the prediction of this study, strategic control is found to be
positively related to organizational performance. This finding provides support for the
reasoning behind our prediction. More specifically, our finding seems to support our
argument that strategic control positively affects organizational performance by
enhancing organizational capabilities (i.e., capabilities for market orientation,
entrepreneurship, innovativeness, and organizational learning) (Chenhall, Kallunki, &
Silvola, 2011; Morris, Allen, Schindehutte, & Avila, 2006).
Our finding also seems to support our reasoning that strategic control enhances
performance because it helps managers to exercise effective control over
organizational members, including middle management, and make efficient decisions
(Berry, Coad, Harris, Otley, & Stringer, 2009; Elbanna & Fadol, 2016). In this way,
strategic control could ensure that the behaviours and decisions of organizational
members are in alignment with theorganizational objectives (Flamholtz, Das, & Tsui,
1985), minimizing the deviations from strategic objectives (Goold & Quinn, 1990) and
leading to superior performance.

218
6.2.5 Organisational Performance and Organisational Competitiveness
Our results supported the hypothesis of this study that organizational
performance is positively related to organizational competitiveness. This lends
empirical support to the arguments offered by many authors (Hauc & Kovač, 2000).
For instance, Hauc and Kovač (2000) indicate that combining prompt and effective
strategies with a correct and quick strategy formulation generates better
competitiveness. When organizations perform better than their competitors, their
competitiveness is higher. This result also suggests that, in order to improve
organizational competitiveness, organizations can put effort into enhancing the aspects
that lead to better performance, such as strategic planning.
6.2.6 Environmental Dynamism
6.2.6.1 Strategic Planning Practice
Our study suggested that environmental dynamism does not moderate the
effects of strategic planning practice (use of strategic planning tools) and
organizational performance. This contradicts the prediction of this study. A possible
interpretation is that using a specific strategic planning tool may or may not have a
positive impact on organizational performance. In theory, some strategic planning
tools might have a stronger influence on organizational performance under high
environmental dynamism, while some strategic planning tools might have a weak
influence on organizational performance. When discussing the use of strategic
planning tools and organizational performance, the total effect may not vary, despite
different environmental conditions. Thus, further research could seek to separate the
strategic planning tools from one another and investigate the impact of each on

219
organizational performance, bearing in mind the moderating role of environmental
dynamism. This may help to explain the missing moderating role of environmental
dynamism on the link between strategic planning practice and performance.
6.2.6.2 Intensity of Strategic Planning
Our findings supported the moderating role of environmental dynamism on the
relationship between the intensity of the strategic planning and organizational
performance. Previous studies proposed different opinions on the moderating role of
environmental dynamism (Elbanna, 2006; Shepherd & Rudd, 2014). Some researchers
have argued that planning is more likely to achieve positive economic effects in
relatively stable environments where future conditions are easier to project (Daft,
2012; Mintzberg, 1973). However, the results of our study are consistent with the
argument of Andersen (2004) that planning encourages adaptive strategic thinking and
facilitates the generation of new actions that could be particularly useful in dynamic
industries; thus the intensity of strategic planning will allow managers to make better
and wiser decisions, in turn increasing the organizational performance.
6.2.6.2.1 Comprehensiveness of the strategic plan implementation
Consistent with the argument of this study, environmental dynamism
moderates the effects of the comprehensiveness of strategic plan implementation and
organizational performance. Some researchers have argued that in a high dynamic
environment, comprehensiveness does not lead to improved performance (Fredrickson
& Mitchell, 1984). Comprehensiveness is associated with performance only in a
relatively certain environment (Fredrickson & Mitchell, 1984). This is consistent with

220
the research of Atuahene-Gima and Murray (2004), in which the authors indicate that
the relationship between comprehensiveness and firm performance is complex and
contingent upon implementation speed, technological uncertainty and market
uncertainty. They find that strategy comprehensiveness positively influences
performance when it is combined with implementation speed, and diminishes
performance when market uncertainty is high. Similarly, Miller (2008) also suggests
that in turbulent environments, decision implementation is particularly difficult.
Strong commitment to implementation is critical in such a setting. High decision effort
(comprehensiveness) enhances commitment. The present study supports this causal
process by showing that decision effort at the strategic level is positively related to
firm performance in turbulent settings. Therefore, it is likely that high levels of
comprehensiveness enhance implementation commitment, thereby serving the
underlying goals of effective strategy and strong financial performance.
6.2.6.2.2 Alignment of strategic plan implementation
The results of this study suggest that environmental dynamism moderates the
effect of the alignment of strategic plan implementation on organizational
performance. In highly dynamic environments, organizations become more complex
and dynamic and they seek to innovate to deliver high-quality services and products
cheaper and faster (Santa, Vemuri, Ferrer, Bretherton, & Hyland, 2010). According to
Bessant and Boer (2002), recent developments in society, markets, technology and
industry suggest that leading organizations need to align the processes, procedures,
people, technologies and organizational arrangements that will allow them to become
continuously innovative. Therefore, in order to perform better, organizations, like
employees at different levels, must have a deep commitment to achieve quality in their

221
day-to-day operations, in particular when the environment is dynamic. Organizations
must also keep all the dimensions (processes, procedures, people, technologies and
organizational arrangements) in alignment to maximize the probability of achieving
team success and avoid conflicts.
6.2.6.2.3 Accountability
Managers who are highly accountable for their actions have more pressure to
work effectively and efficiently. As environmental conditions change, managers take
initiatives in order to increase the effectiveness of their responsive actions to the
dynamic circumstances, as a way to enhance organizational efficiency (Andersen,
2004). This reasoning is particularly forceful in dynamic environments where market
conditions often change in unexpected ways.
6.2.6.2.4 Strategic control
This study confirms that environmental dynamism moderates the effects of
strategic control on organizational performance. Davila, Foster, and Oyon (2009)
conclude that controls can assist intelligence gathering, which requires established
processes; idea recognition, which requires a structured process to move ideas from
any person in the organization to the people with resource allocation rights; and idea
selection which is enhanced by formal portfolio management tools. Strategic controls,
by way of internal auditing, can be used to overcome the potential drift from planned
activities. In highly turbulent environments, organizations face more new challenges
and are more likely to drift from planned activities. Strategic control enables

222
organizations to focus resources on the critical areas of the business, thus positively
influencing organizational performance.
6.3 Theoretical Contributions of the Study
The aim of this research was to enrich the knowledge of strategic planning
processes. As Grant (2003) noted, there is an abundance of strategic planning
literature, but in reality we still know very little about what happens behind closed
doors.
Our findings extend the strategic management field in a number of ways. First,
this study contributes significantly to the knowledge of the nature and dimensions of
the strategic management process. The current literature discusses the individual
relationships between firm performance and strategy formulation, implementation,
and evaluation and control (with most focus on formulation) (Elbanna, 2010; Elbanna
et al., 2015). This study is one of the few studies that integrates the three components
of the strategic management process in one framework and examines their impact on
organizational performance, promising the development of a more detailed model of
the strategic management process.
Second, the current research on the strategic management process has mainly
been conducted in the private (Elbanna, Thanos, & Colak, 2014; Hakimpoor, 2014)
and public sectors (Elbanna et al., 2015; Elbanna & Child, 2007). By investigating the
three elements of the strategic management process in the semi-government sector,
this study adds to the existing but limited knowledge in this less researched area.

223
Third, this study also explores the moderating role of environmental dynamism
in the link between strategic plan formulation, implementation, evaluation and
organizational performance. More specifically, our findings suggest that, with the
exception of strategic planning practice, the moderating effects of environmental
dynamism on the links between the intensity of strategic plan, comprehensiveness of
strategic plan implementation, alignment of strategic plan implementation,
accountability, strategic control and organizational performance are supported.
Fourth, this study extends current research by conducting a study in an Arab
country (Elbanna et al., 2015). While much is known of the practices of management
in Western countries, comparatively little is known about their equivalents in Arab
countries (Elbanna, 2008, 2010). The present study addressed this gap in the literature
by reporting the results of a study on strategic planning in the United Arab Emirates
(UAE), Abu Dhabi in particular.
6.4 Implications of the Study
On a practical note, our study has a number of implications for managers and
policy makers in the UAE semi-governmental sector in general and that of Abu Dhabi
in particular.
First, having discovered that organizational performance is a function of
strategic plan formulation, organizations should pay attention to choosing the strategic
planning tools that best fit their needs and should plan intensively. This is an important
implication for the people responsible for strategic planning practice in the semi-
government sector of Abu Dhabi. In other words, the message is: The harder
organizations practice strategic planning, the better their performance will be.

224
Second, our results highlight the importance of ensuring that planned strategic
decisions are effectively executed. No matter how sound the formulated strategies are,
organizations will not benefit if they are implemented incorrectly (Aldehayyat, Al
Khattab, & Anchor, 2011). While many managers commonly make statements to the
effect that “execution is everything”, in practice managers often allocate significantly
more time and attention to formulating strategic decisions than to planning and
following through their implementation (Bossidy, Charan, & Burck, 2002; Rosier,
Morgan, & Cadogan, 2010). Our study further draws attention to the importance of
strategy implementation and calls for managers’ attention to this area of work. As
argued by Nutt (1999), most strategic changes fail because of bad implementation. An
increasing number of authors have sought to bring the attention of managers to the
importance of implementation which policy makers and top managers in the sampled
organizations should be aware of in their actions (Elbanna, Thanos, & Colak, 2014).
Third, this study suggests that strategy evaluation is positively related to
organizational performance. If it is, then to achieve high performance on the part of
their organizations, top managers must have a strong sense of accountability and
effectively practice strategic control. This element of strategic management practice
still receives less attention from both scholars and managers than strategy formulation
and implementation do. So, the results of this study remind both scholars and
practitioners of the critical role that strategy evaluation can play in organizational
performance.
Fourth, since the thesis finds that environmental dynamism positively
moderates the relationship between the intensity of strategic planning,
comprehensiveness of the strategic plan’s implementation, alignment of the strategic

225
plan’s implementation, accountability, strategic control and organizational
performance, decision makers in organizations should give enough attention to the
environment in which their organizations are working and act accordingly. This is of
particular importance in the UAE and the Arab Middle East in general because this
troubled region of the world is highly turbulent.
Fifth, our findings are of special importance to the organizations operating in
the Abu Dhabi context. Strategic planning can help the Abu Dhabi semi-government
organizations to plan effectively and strategically, and thereby to perform better. This
finding is timely for policy makers and executives of the semi-government sector in
Abu Dhabi at present, now that they are working to diversify the economy of this
important emirate into non-oil activity. Strategic management practices are at the heart
of this transformation process and one of its main drivers.
6.5 Limitation and Suggestions for Future Research
We should recognize that this study has several limitations, which provide
some suggestions for future research.
First, as with other research done in this area, our study used a simple cross-
sectional design. This type of study cannot allow researchers to make more rigorous
inferences about the causal relationships implied by the model. Therefore, future
research could undertake a longitudinal study to capture the dynamic relationships of
strategic planning effects. Longitudinal studies produce data that show a dynamic view
of the way that variables and the relationships between variables change over time. In
longitudinal studies, researchers can make more rigorous inferences about the causal
relationship between the strategy planning processes and organizational performance.

226
Second, the context of the present study is semi-government organizations in
Abu Dhabi. There are some differences between Abu Dhabi and the other emirates in
the UAE and between it and other developing and developed countries. Such
differences restrict the generalizability of our conclusions. In addition, the strategic
planning activities of semi-government organizations may be different in other types
of organization. Hence, the findings of this study cannot be generalized to apply to all
types of organization or extended to other emirates in the UAE or to other countries.
This opens the door to replicating and extending this research to other sectors and
countries. Future researchers may also compare their findings from other sectors and
countries with the findings in this study.
Third, in terms of the moderating effect, further studies could also investigate
the significance and relative importance of other environmental factors which are not
considered in this study. This study focuses only on discussing environmental
dynamism. Other environmental factors, such as perceived environmental munificence
and complexity, could be examined for their impact on the relationship between
strategic planning and organizational performance.
Fourth, data were collected in several cases from respondents with lower
managerial positions and less than five years’ experience in their current organizations.
Although each respondent was given guidelines to complete the survey and part of
these guidelines related to his/her familiarity with strategic planning practices in the
organization to allow the respondents to identify whether or not they were eligible to
complete the survey, this limitation should be taken into account when interpreting the
study results and conducting related research in the future.

227
Fifth, researchers can integrate formal and informal strategic planning into this
study. More specifically, future research could examine whether formal strategic
planning impacts organizational performance differently from informal. Researchers
can also examine the impact on strategy implementation of blending formal strategic
planning with logical incrementalism and search for the optimal approach to using
them in practice, which may further develop management theory (Elbanna et al., 2015;
Elbanna & Child, 2007).
Sixth, it would benefit future research to carefully consider other factors that
may influence the relationship between strategy planning formulation (or between the
two other components of the strategic management process; namely, implementation
and evaluation and control) and organizational performance, since this relationship is
largely influenced by a host of variables, some reasonably controllable by semi-
government organizations (for example, organizational capabilities, systems and
processes) and others mostly beyond their control (for example, economic conditions
and political instability).
Seventh, future research can use ANOVA to compare the strategy planning
process (or the implementation and evaluation and control processes) across
organizations of different sizes, in different industries and at different stages of
strategy planning (or implementation, or evaluation and control).
Last, the dimensions of strategic plan formulation, implementation, and
evaluation are limited to certain aspects. Further research could explore the other
dimensions of strategic plan formulation, implementation and evaluation, and could
investigate their relationship with organizational performance.

228
6.6 Conclusions
This study addressed three objectives, first to understand the dimensions of
strategic plan formulation, implementation and evaluation; second, to examine the
relationship between strategic plan formulation, implementation and evaluation and
organizational performance; and third, to examine the moderating role of
environmental dynamism. Several applications of the research were discussed in this
chapter, which also detailed the limitations of this study and a number of avenues for
future research. Future researchers could substitute a longitudinal study and collect
data from multiple respondents. Future research could focus on identifying other
dimensions of strategic plan formulation, implementation and evaluation. Further
study could also discuss the moderating role of environmental complexity and
munificence. In conclusion, however, this study has provided some useful insights into
the nature and practice of strategic planning in the semi-government sector in the rich
emirate of Abu Dhabi. It is hoped that this study will draw further attention to and act
as a springboard for ongoing research in this important, yet under-researched domain.

229
Bibliography
Ackerman, R., Rosenblum, J., & Uyterhoeven, H. (1977). Strategy and organization: Text and cases in general management: Homewood, IL: Richard D. Irwin, Inc.
Ackoff, R. (1970). A concept of corporate planning. Long Range Planning, 3(1), 2-8.
ADCED. (2008). The Abu Dhabi economic vision 2030. Abu Dhabi: Abu Dhabi: Department of Planning and Economic
ADG. (2013). Abu Dhabi semi government companies. Retrieved 2013, May 27 https://www.abudhabi.ae/egovPoolPortal_WAR/appmanager/ADeGP/Citizen?_nfpb=true&_pageLabel=p_citizen_departments&lang=en
Ailawadi, K. L., Dant, R. P., & Grewal, D. (2004). The difference between perceptual and objective performance measures: An empirical analysis. Marketing Science Institute, 4, 1-25.
Ajitabh, A., & Momaya, K. S. (2004). Competitiveness of firms: Review of theory, frameworks and models. Singapore management review, 26(1), 45-61.
Akinyele, S., & Fasogbon, O. (2010). Impact of strategic planning on organizational performance and survival. Research Journal of Business Management, 4(1), 73-82.
Aldehayyat, J. S., Al Khattab, A. A., & Anchor, J. R. (2011). The use of strategic planning tools and techniques by hotels in Jordan. Management Research Review, 34(4), 477-490.
Aldehayyat, J. S., & Anchor, J. R. (2008). Strategic planning tools and techniques in Jordan: Awareness and use. Strategic change, 17(7‐8), 281-293.
Alterman, R., & Hill, M. (1978). Implementation of urban land use plans. Journal of the American Institute of Planners, 44(3), 274-285.
Ambos, K. (2000). Judicial accountability of perpetrators of human rights violations and the role of victims. Journal of International Peacekeeping, 6(2-3), i-76.
American Psychological Association. (1985). Standards for educational and psychological testing. Washington, DC: American Psychological Association.
Amit, R., & Schoemaker, P. J. (1993). Strategic assets and organizational rent. Strategic management journal, 14(1), 33-46.
Andersen, P. H., & Kragh, H. (2012). Managing creativity in business market relationships. Industrial Marketing Management.

230
Andersen, T. J. (2004). Integrating decentralized strategy making and strategic planning processes in dynamic environments. Journal of management studies, 41(8), 1271-1299.
Andrew, K. R. (1987). The concept of corporate strategy. Irwin, Homewood, IL.
Andrew Lihalo K, M. (2014). Barriers to strategy implementation by mid sized companies in Kenya. Global Journal of Management and Business Research, 13(12).
Andrews, K. R. (1971). The concept of corporate strategy. Revised Edition, RD Iruin.
Andrews, R., Boyne, G. A., Law, J., & Walker, R. M. (2011). Strategy implementation and public service performance. Administration & Society, 43(6), 643-671.
Andrews, R., Boyne, G. A., & Walker, R. M. (2006). Strategy content and organizational performance: An empirical analysis. Public Administration Review, 66(1), 52-63.
Ansoff, H. I. (1965). Corporate strategy: Business policy for growth and expansion: McGraw-Hill Book.
Ansoff, H. I. (1991). Critique of Henry Mintzberg's ‘the design school: Reconsidering the basic premises of strategic management’. Strategic management journal, 12(6), 449-461.
Argyris, C., & Schon, D. (1978). Organizational learning: A theory of action perspective. Reading, MA: Addison- Wesley.
Armstrong, J. S. (1982). The value of formal planning for strategic decisions: Review of empirical research. Marketing Papers, 22.
Arnold, T. (2013). Vision 2030: Abu Dhabi focusing on growth strategy. Available from The National http://www.thenational.ae/business/economy/vision-2030-abu-dhabi-focusing-on-growth-strategy
Atuahene-Gima, K., & Murray, J. Y. (2004). Antecedents and outcomes of marketing strategy comprehensiveness. Journal of Marketing, 68(4), 33-46.
Baer, W. C. (1997). General plan evaluation criteria: An approach to making better plans. Journal of the American Planning Association, 63(3), 329-344.
Bagozzi, R. P., & Heatherton, T. F. (1994). A general approach to representing multifaceted personality constructs: Application to state self‐esteem. Structural Equation Modeling: A Multidisciplinary Journal, 1(1), 35-67.

231
Bagozzi, R. P., Yi, Y., & Phillips, L. W. (1991). Assessing construct validity in organizational research. Administrative science quarterly, 421-458.
Baker, G. A., & Leidecker, J. K. (2001). Does it pay to plan?: Strategic planning and financial performance. Agribusiness, 17(3), 355-364.
Baker, M. J., Black, C., & Hart, S. J. (1988). The competitiveness of British industry: What really makes the difference? European Journal of Marketing, 22(2), 70-85.
Balsas, C. (2012). What about plan evaluation? Integrating evaluation in urban planning studio's pedagogy. Planning Practice and Research, 27(4), 475-494.
Barney, J. (1991). Firm resources and sustained competitive advantage. Journal of Management, 17(1), 99-120.
Barney, J. B. (2001). Resource-based theories of competitive advantage: A ten-year retrospective on the resource-based view. Journal of Management, 27(6), 643.
Baron, R. M., & Kenny, D. A. (1986). The moderator–mediator variable distinction in social psychological research: Conceptual, strategic, and statistical considerations. Journal of personality and social psychology, 51(6), 1173-1182.
Bartlett, C., & Ghoshal, S. (1989). Managing across borders (Harvard Business School Press, Boston, MA). BartlettManaging Across Borders1989.
Baum, R. J., & Wally, S. (2003). Strategic decision speed and firm performance. Strategic Management Journal, 24(11), 1107-1129.
Beer, M., & Eisenstat, R. A. (2000). The silent killers of strategy implementation and learning. MIT Sloan Management Review, 41(4), 29.
Bell, J. (2004). Managing evaluation projects. In H. H. K. N. J. Wholey (Ed.), Handbook of practical program evaluation (pp. 571-603). San Francisco, CA: Jossey-Bass.
Bennear, L. S., & Coglianese, C. (2005). Measuring progress: Program evaluation of environmental policies. Environment: Science and Policy for Sustainable Development, 47(2), 22-39.
Bensebaa, F. (2004). The impact of strategic actions on the reputation building of e-businesses. International Journal of Retail & Distribution Management, 32(6), 286-301.

232
Bergeron, F., Raymond, L., & Rivard, S. (2004). Ideal patterns of strategic alignment and business performance. Information & management, 41(8), 1003-1020.
Berke, P., Backhurst, M., Day, M., Ericksen, N., Laurian, L., Crawford, J., & Dixon, J. (2006). What makes plan implementation successful? An evaluation of local plans and implementation practices in New Zealand. ENVIRONMENT AND PLANNING B PLANNING AND DESIGN, 33(4), 581.
Berry, A. J., Coad, A. F., Harris, E. P., Otley, D. T., & Stringer, C. (2009). Emerging themes in management control: A review of recent literature. The British Accounting Review, 41(1), 2-20.
Berry, M. (1998). Strategic planning in small high tech companies. Long Range Planning, 31(3), 455-466.
Bessant, J., & Boer, H. (2002). Continuous innovation. Paper presented at the IPOS Seminar.
Bierly, P. E., & Daly, P. S. (2007). Alternative knowledge strategies, competitive environment, and organizational performance in small manufacturing firms. Entrepreneurship Theory and Practice, 31(4), 493-516.
Bodwell, W., & Chermack, T. J. (2010). Organizational ambidexterity: Integrating deliberate and emergent strategy with scenario planning. Technological Forecasting and Social Change, 77(2), 193-202.
Bonn, I., & Christodoulou, C. (1996). From strategic planning to strategic management. Long Range Planning, 29(4), 543-551.
Bossidy, L., Charan, R., & Burck, C. (2002). The discipline of getting things done. New South Wales: Random House Business Books.
Bourgeois, L., & Eisenhardt, K. (1988). Strategic decision processes in high velocity environments: Four cases in the microcomputer industry. Management Science, 34, 816-835.
Boyne, G. A., & Walker, R. M. (2004). Strategy content and public service organizations. Journal of Public Administration Research and Theory, 14(2), 231-252.
Braam, G. J., & Nijssen, E. J. (2004). Performance effects of using the balanced scorecard: A note on the Dutch experience. Long range planning, 37(4), 335-349.
Bremmer, I. (2010). The long shadow of the visible hand. The Wall Street Journal.

233
Brenes, E. R., Mena, M., & Molina, G. E. (2008). Key success factors for strategy implementation in Latin America. Journal of Business research, 61(6), 590-598.
Brews, P., & Purohit, D. (2007). Strategic planning in unstable environments. Long Range Planning, 40(1), 64-83.
Brews, P. J., & Hunt, M. R. (1999). Learning to plan and planning to learn: Resolving the planning school/learning school debate. Strategic Management Journal, 20(10), 889-913.
Brinckmann, J., Grichnik, D. & Kapsa, D. (2010). Should entrepreneurship plan or just storm the castle? A meta-analysis on contextual factors impacting the business planning performance relationship in small firms. Journal of Business Venture, 25: 24-40.
Bromwich, M., & Bhimani, A. (2005). Management accounting: Pathways to progress: Cima publishing.
Bruns, W. J., & Waterhouse, J. H. (1975). Budgetary control and organization structure. Journal of accounting research, 177-203.
Bryson, J. M. (2003). Strategic planning and management. Handbook of public administration, 1.
Bryson, J. M. (2011). Strategic planning for public and nonprofit organizations: A guide to strengthening and sustaining organizational achievement (Vol. 1): John Wiley & Sons.
Bryson, J. M., Crosby, B. C., & Bryson, J. K. (2009). Understanding strategic planning and the formulation and implementation of strategic plans as a way of knowing: The contributions of actor-network theory. International Public Management Journal, 12(2), 172-207.
Buckley, P. J., Pass, C. L., & Prescott, K. (1988). Measures of international competitiveness: A critical survey∗†. Journal of marketing management, 4(2), 175-200.
Campanelli, P. (2008). Testing survey questions. International handbook of survey methodology, 176-200.
Campbell, D. T., & Fiske, D. W. (1959). Convergent and discriminant validation by the multitrait-multimethod matrix. Psychological bulletin, 56(2), 81.

234
Canhada, D., & Rese, N. l. (2011). Implementing strategies: Barriers and facilitators in the specialized brazilian literature. Future studies research journal, 3(1), 37-57.
Carmona, M. (2007). Monitoring outcome quality in planning-challenges and possibilities. TOWN AND COUNTRY PLANNING-LONDON-TOWN AND COUNTRY PLANNING ASSOCIATION-, 76(6/7), S2.
Carmona, M., & Sieh, L. (2008). Performance measurement in planning—towards a holistic view. Environment and Planning C: Government and Policy, 26(2), 428-454.
Carnegie, G. D., & West, B. P. (2005). Making accounting accountable in the public sector. Critical perspectives on accounting, 16(7), 905-928.
Castrogiovanni, G. J. (1991). Environmental munificence; a theoretical assessment. Academy of Management Review, 16(3), 542-565.
Čater, T., & Pučko, D. (2010). Factors of effective strategy implementation: Empirical evidence from Slovenian business practice. Journal for East European Management Studies, 207-236.
Cavalluzzo, K. S., & Ittner, C. D. (2004). Implementing performance measurement innovations: Evidence from government. Accounting, Organizations and Society, 29(3–4), 243-267.
Chandler, A. D. (1962). Strategy and structure: Chapters in the history of the American enterprise. Massachusetts Institute of Technology Cambridge, MA.
Chapman, C. S. (2005). Controlling strategy: Management, accounting, and performance measurement: Oxford University Press, Oxford.
Chavunduka, D., Chimunhu, P., & Sifile, O. (2015). Strategic planning intensity and firm performance: A case of the Zimbabwe mining development corporation. European Journal of Business and Management, 7(5), 12-18.
Chenhall, R. H., Kallunki, J.-P., & Silvola, H. (2011). Exploring the relationships between strategy, innovation, and management control systems: The roles of social networking, organic innovative culture, and formal controls. Journal of Management Accounting Research, 23(1), 99-128.
Child, J. (1972). Organizational structure, environment and performance: The role of strategic choice. Sociology, 6(1), 1-22.
Churchill, G. A. (1979). A paradigm for developing better measures of marketing constructs. Journal of marketing research, 16(1), 64-73.

235
Churchill, G. A., & Iacobucci, D. (2002). Marketing research 8th ed. Florida: Harcourt College Publishers.
Clark, K. B., & Fujimoto, T. (1991). Product development performance: Strategy, organization, and management in the world auto industry: Harvard Business Press, MA.
Collis, D. J., & Montgomery, C. A. (2008). Competing on resources. Harvard Business Review, 86(7/8), 140-150.
Combs, J. G., Crook, T. R., & Shook, C. L. (2005). The dimensionality of organizational performance and its implications for strategic management research. Research methodology in strategy and management, 2(05), 259-286.
Cooper, D. J., & Ezzamel, M. (2013). Globalization discourses and performance measurement systems in a multinational firm. Accounting, Organizations and Society, 38(4), 288-313.
Cooper, P., & Schindler, D. (2001). Business research methods.
Cooper, R. G., & Kleinschmidt, E. J. (1986). An investigation into the new product process: Steps, deficiencies, and impact. Journal of product innovation management, 3(2), 71-85.
Corbett, C., Van Wassenhove, L., & de Constance, B. (1993). Trade-offs? What trade-offs? California Management Review(Summer), 107-122.
Creswell, J. (2003). Research design: Qualitative, quantitative and mixed methods approaches. UK: Sage Publications.
Creswell, J. W., & Clark, V. L. P. (2011). Designing and conducting mixed methods research. London: Sage Publications.
Crittenden, V. L., & Crittenden, W. F. (2008). Building a capable organization: The eight levers of strategy implementation. Business Horizons, 51(4), 301-309.
Crofts, K., & Bisman, J. (2010). Interrogating accountability: An illustration of the use of leximancer software for qualitative data analysis. Qualitative Research in Accounting & Management, 7(2), 180-207.
D’Cruz, J., & Rugman, A. (1992). New concepts for Canadian competitiveness. Kodak, Canada, 1-60.
Daft, R. (2012). Organization theory and design: Nelson Education.

236
Darke, P., Shanks, G., & Broadbent, M. (1998). Successfully completing case study research: Combining rigour, relevance and pragmatism. Information systems journal, 8(4), 273-289.
David, F. R., Ali, A., & Al-Aali, A. (2011). Strategic management: Concepts and cases. Essex, UK: Pearson.
Davidson, E. J. (2000). Ascertaining causality in theory‐based evaluation. New directions for evaluation, 2000(87), 17-26.
Davila, A., Foster, G., & Oyon, D. (2009). Accounting and control, entrepreneurship and innovation: Venturing into new research opportunities. European Accounting Review, 18(2), 281-311.
Day, G. S., & Wensley, R. (1988). Assessing advantage: A framework for diagnosing competitive superiority. Journal of Marketing, 52(2), 1-20.
Debarshi, B. (2011). Management accounting. India: Pearson Education.
DED. (2011). Annual economic report Abu Dhabi. Abu Dhabi: Ministry of Economy of UAE.
Demirag, I., Dubnick, M., & Khadaroo, M. I. (2004). A framework for examining accountability and value for money in the UK's private finance initiative. Journal of Corporate Citizenship, 2004(15), 63-76.
Demirag, I., & Khadaroo, I. (2011). Accountability and value for money: A theoretical framework for the relationship in public–private partnerships. Journal of Management & Governance, 15(2), 271-296.
Demopoulos, W. (2003). On the rational reconstruction of our theoretical knowledge. The British journal for the philosophy of science, 54(3), 371-403.
Dess, G. G. (1987). Consensus on strategy formulation and organizational performance: Competitors in a fragmented industry. Strategic management journal, 8(3), 259-277.
Dess, G. G., & Beard, D. W. (1984). Dimensions of organizational task environments. Administrative science quarterly, 52-73.
Diamantopoulos, A., Reynolds, N., & Schlegelmilch, B. B. (1994). Pretesting in questionnaire design: The impact of respondent characteristics on error detection. Journal of the Market Research Society.

237
Dibrell, C., Craig, J. B., & Neubaum, D. O. (2014). Linking the formal strategic planning process, planning flexibility, and innovativeness to firm performance. Journal of Business Research, 67(9), 2000-2007.
Dickson, P. R. (1992). Toward a general theory of competitive rationality. Journal of Marketing, 56(1), 69-83.
Dubnick, M. (2005). Accountability and the promise of performance: In search of the mechanisms. Public Performance & Management Review, 28(3), 376-417.
Dubnick, M. J. (1998). Clarifying accountability: An ethical theory framework.?
Dubnick, M. J. (2003). Accountability and ethics: Reconsidering the relationships. International Journal of Organization Theory and Behavior, 6(3), 405.
Duncan, R. B. (1972). Characteristics of organizational environments and perceived environmental uncertainty. Administrative science quarterly, 313-327.
Dunk, A. S. (2011). Product innovation, budgetary control, and the financial performance of firms. The British Accounting Review, 43(2), 102-111.
EIA. (2013). Hydrocarbon dependency in Gulf Cooperation Council (GCC) countries.
Eisenhardt, K. M. (1989). Making fast strategic decisions in high-velocity environments. Academy of Management journal, 32(3), 543-576.
Eisenhardt, K. M., & Martin, J. A. (2000). Dynamic capabilities: What are they? Strategic Management Journal, 21(10/11), 1105-1121.
Elbanna, S. (2006). Strategic decision‐making: Process perspectives. International Journal of Management Reviews, 8(1), 1-20.
Elbanna, S. (2007). The nature and practice of strategic planning in Egypt. Strategic Change, 16(5), 227-243.
Elbanna, S. (2008). Planning and participation as determinants of strategic planning effectiveness: Evidence from the Arabic context. Management Decision, 46(5), 779-796.
Elbanna, S. (2010). Strategic planning in the United Arab Emirates. International Journal of Commerce and Management, 20(1), 26-40.
Elbanna, S. (2012). Slack, planning and organizational performance: Evidence from the Arab Middle East. European Management Review, 9(2), 99-115.

238
Elbanna, S. (2013). Processes and impacts of strategic management: Evidence from the public sector in the United Arab Amirates. International Journal of Public Administration, 36(6), 426-439.
Elbanna, S., Andrews, R., & Pollanen, R. (2015). Strategic planning and implementation success in public service organizations: Evidence from Canada. Public Management Review, 1-26.
Elbanna, S., & Child, J. (2007). The influence of decision, environmental and firm characteristics on the rationality of strategic decision‐making*. Journal of Management Studies, 44(4), 561-591.
Elbanna, S., Child, J., & Dayan, M. (2013). A model of antecedents and consequences of intuition in strategic decision-making: Evidence from Egypt. Long Range Planning, 46(1), 149-176.
Elbanna, S., Di Benedetto, C. A., & Gherib, J. (2015). Do environment and intuition matter in the relationship between decision politics and success? Journal of Management & Organization, 21(01), 60-81.
Elbanna, S., & Fadol, Y. (2016). An analysis of the comprehensive implementation of strategic plans in emerging economies: The United Arab Emirates as a case study. European Management Review.
Elbanna, S., Thanos, I. C., & Colak, M. (2014). An exploratory study of the determinants of the quality of strategic decision implementation in Turkish industrial firms. Journal of General Management.
Fadol, Y., Barhem, B., Elbanna, S., Adcroft, A., & Bruce, K. (2015). The mediating role of the extensiveness of strategic planning on the relationship between slack resources and organizational performance. Management Decision, 53(5).
Falshaw, J. R., Glaister, K. W., & Tatoglu, E. (2006). Evidence on formal strategic planning and company performance. Management Decision, 44(1), 9-30.
Fiorito, S. S., & LaForge, R. W. (1986). A marketing strategy analysis of smallretailers. American Journal of Small Business Management, 10(4), 7-17.
Flamholtz, E. G., Das, T., & Tsui, A. S. (1985). Toward an integrative framework of organizational control. Accounting, organizations and society, 10(1), 35-50.
Fleisher, C. S., & Bensoussan, B. E. (2003). Strategic and competitive analysis: Methods and techniques for analysing business competition: Prentice Hall Upper Saddle River, NJ.

239
Flowerdew, R., & Martin, D. (2005). Methods in human geography: A guide for students doing a research project. New York: Pearson Education.
Floyd, S. W., & Wooldridge, B. (1992). Middle management involvement in strategy and its association with strategic type: A research note. Strategic management journal, 13(S1), 153-167.
Forbes, D. P. (2005). The effects of strategic decision making on entrepreneurial selfefficacy. Entrepreneurship theory and practice, 29(5), 599-626.
Frazier, G. L., & Howell, R. D. (1983). Business definition and performance. The Journal of Marketing, 59-67.
Fredrickson, J. W., & Mitchell, T. R. (1984). Strategic decision processes: Comprehensiveness and performance in an industry with an unstable environment. Academy of Management journal, 27(2), 399-423.
Fried, Y., & Slowik, L. H. (2004). Enriching goal-setting theory with time: An integrated approach. Academy of Management Review, 29(3), 404-422.
Frost, F. A. (2003). The use of strategic tools by small and medium‐sized enterprises: An Australasian study. Strategic change, 12(1), 49-62.
Furrer, O., Thomas, H., & Goussevskaia, A. (2008). The structure and evolution of the strategic management field: A content analysis of 26 years of strategic management research. International Journal of Management Reviews, 10(1), 23.
Galbraith, J. R., & Kazanjian, R. K. (1986). Organizing to implement strategies of diversity and globalization: The role of matrix designs. Human Resource Management, 25(1), 37-54.
Ghamdi, S. M. A. (2005). The use of strategic planning tools and techniques in Saudi Arabia: An empirical study. International Journal of Management, 22(3), 376.
Ghazinoory, S., Abdi, M., & Azadegan-Mehr, M. (2011). Swot methodology: A state-of-the-art review for the past, a framework for the future. Journal of Business Economics and Management, 12(1), 24-48.
Gibcus, P., & Kemp, R. G. M. (2003). Strategy and small firm performance: EIM Business & Policy Research.
Giglioni, G. B., & Bedeian, A. G. (1974). A conspectus of management control theory: 1900-1972. Academy of Management Journal, 17(2), 292-305.

240
Glaister, K. W., & Falshaw, J. R. (1999). Strategic planning: Still going strong? Long Range Planning, 32(1), 107-116.
Glöckner, A., & Witteman, C. (2010). Beyond dual-process models: A categorisation of processes underlying intuitive judgement and decision making. Thinking and Reasoning, 16(1), 1 – 25.
Goldsmith, A. (1995). Making managers more effective: Application of strategic management. USAID Implementing Policy Change Project.
Golgeci, I., & Ponomarov, S. Y. (2013). Does firm innovativeness enable effective responses to supply chain disruptions? An empirical study. Supply Chain Management: An International Journal, 18(6), 604-617.
Goll, I., & Rasheed, A. (2004). The moderating effect of environmental munificence and dynamism on the relationship between discretionary social responsibility and firm performance. Journal of Business Ethics, 49(1), 41-54.
Goll, I., & Rasheed, A. A. (2005). The relationships between top management demographic characteristics, rational decision making, environmental munificence, and firm performance. Organization studies, 26(7), 999-1023.
Goold, M., & Quinn, J. J. (1990). The paradox of strategic controls. Strategic Management Journal, 11(1), 43-57.
Govindarajan, V. (1988). A contingency approach to strategy implementation at the business-unit level: Integrating administrative mechanisms with strategy. Academy of management Journal, 31(4), 828-853.
Grant, R. M. (2003). Strategic planning in a turbulent environment: Evidence from the oil majors. Strategic management journal (24), 491-517.
Grant, R. M. (2008). Why strategy teaching should be theory based. Journal of Management Inquiry, 17(4), 276-281.
Gray, A., & Jenkins, B. (1993). Codes of accountability in the new public sector. Accounting, Auditing & Accountability Journal, 6(3), 52-69.
Greenley, G. E., Hooley, G. J., Broderick, A. J., & Rudd, J. M. (2004). Strategic planning differences among different multiple stakeholder orientation profiles. Journal of Strategic Marketing, 12(3), 163-182.
Griggs, H. E. (2002). Strategic planning system characteris- tics and organisational effectiveness in Australian small-scale firms. Irish Journal of Management, 23(1), 23-53.

241
Grover, V., & Segars, A. H. (2005). An empirical evaluation of stages of strategic information systems planning: Patterns of process design and effectiveness. Information & Management, 42(5), 761-779.
Guba, E. G. (1990). The paradigm dialog: Sage Publications.
Guba, E. G., & Lincoln, Y. S. (1994). Competing paradigms in qualitative research. Handbook of qualitative research, 2(163-194).
Guerra-López, I. J. (2008). Performance evaluation: Proven approaches for improving program and organizational performance (Vol. 21): John Wiley & Sons.
Guerras-Martín, L. Á., Madhok, A., & Montoro-Sánchez, Á. (2013). The evolution of strategic management research: Recent trends and current directions. Business Research Quarterly (2013).
Gunn, R., & Williams, W. (2007). Strategic tools: An empirical investigation into strategy in practice in the UK. Strategic Change, 16(5), 201-216.
Guthrie, J. P. (2001). High-involvement work practices, turnover, and productivity: Evidence from. New Zealand. Academy of management Journal, 44(1), 180-190.
Guyadeen, D., & Seasons, M. (2015). Plan evaluation: Challenges and directions for future research. Planning Practice & Research, 1-14.
Hair, J. F., Anderson, R. F., Tahtam, R. L., & Black, W. C. (2006). Multivariate data analysis. New Jersey: Prentice-Hall Inc.
Hakimpoor, H. (2014). Strategic planning process dimensions and smes performance. Paper presented at the Proceedings of 10th Global Business and Social Science Research Conference 23 -24 June 2014, Beijing.
Håkonsson, D. D., Burton, R. M., Obel, B., & Lauridsen, J. T. (2012). Strategy implementation requires the right executive style: Evidence from Danish smes. Long range planning, 45(2), 182-208.
Hamann, P. M., Schiemann, F., Bellora, L., & Guenther, T. W. (2013). Exploring the dimensions of organizational performance: A construct validity study. Organizational Research Methods, 16(1), 67-87.
Hamel, G., Doz, Y. L., & Prahalad, C. K. (1989). Collaborate with your competitors and win. Harvard business review, 67(1), 133-139.
Hamel, G., & Prahalad, C. K. (1990). The core competence of the corporation. Harvard business review, 68(3), 79-91.

242
Harrington, R. J., Lemak, D. J., Reed, R., & Kendall, K. W. (2004). A question of fit: The links among environment, strategy formulation, and performance. Journal of Business and Management, 10(1), 15.
Hart, S., & Banbury, C. (1994). How strategy-making processes can make a difference Strategic management journal, 15(4), 251- 269.
Hastie, R., & Dawes, R. (2003). Rational choice in an uncertain world. Journal of the Indian Academy of Applied Psychology, 107.
Hauc, A., & Kovač, J. (2000). Project management in strategy implementation—experiences in Slovenia. International Journal of Project Management, 18(1), 61-67.
Hax, A. C., & Majluf, N. S. (1990). The strategic concept and process: A pragmatic approach. Englewood Cliffs: NJ: Prentice Hall.
Heide, M., Grønhaug, K., & Johannessen, S. (2002). Exploring barriers to the successful implementation of a formulated strategy. Scandinavian Journal of Management, 18(2), 217-231.
Henri, J.-F. (2006). Management control systems and strategy: A resource-based perspective. Accounting, organizations and society, 31(6), 529-558.
Henson, R. K. (2001). Understanding internal consistency reliability estimates: A conceptual primer on coefficient alpha. Measurement and Evaluation in Counseling and Development, 34(3), 177-189.
Herrmann, P. (2005). Evolution of strategic management: The need for new dominant designs. International Journal of Management Reviews, 7(2), 111-130.
Herzlinger, R. E. (1995). Can public trust in nonprofits and governments be restored? Harvard business review, 74(2), 97-107.
Hickson, D. J., Miller, S. J., & Wilson, D. C. (2003). Planned or prioritized? Two options in managing the implementation of strategic decisions*. Journal of Management Studies, 40(7), 1803-1836.
Higgins, J. M. (2005). The eight ‘S’s of successful strategy execution. Journal of Change Management, 5(1), 3-13.
Hinkin, T. R. (1995). A review of scale development practices in the study of organizations. Journal of management, 21(5), 967-988.

243
Hitt, M. A., Ireland, R. D., & Lee, H.-u. (2000). Technological learning, knowledge management, firm growth and performance: An introductory essay. Journal of Engineering and Technology management, 17(3), 231-246.
Honig, B., & Karlsson, T. (2004). Institutional forces and the written business plan. Journal of Management, 30(1), 29-48.
Hope, J., & Fraser, R. (2003). New ways of setting rewards: The beyond budgeting model. California Management Review, 45(4), 104-119.
Hopkins, W. E., & Hopkins, S. A. (1997). Strategic planning-financial performance relationships in banks: A causal examination. Strategic Management Journal, 18(8), 635-652.
Hoque, Z., & James, W. (2000). Linking balanced scorecard measures to size and market factors: Impact on organizational performance. Journal of Management Accounting Research, 12, 1-17.
Hoskisson, R. E., Hitt, M. A., Wan, W. P., & Yiu, D. (1999). Theory and research in strategic management: Swings of a pendulum. Journal of management, 25(3), 417-456.
Hrebiniak, L. G., & Joyce, W. F. (1984). Implementing strategy: Macmillan New York, NY.
Hrebiniak, L. G., & Snow, C. C. (1980). Research notes: Industry differences in environmental uncertainty and organizational characteristics related to uncertainty. Academy of Management Journal, 23(4), 750-759.
Hudson, J., & Lowe, S. (2009). Understanding the policy process: Analysing welfare policy and practice: Policy Press.
Huisman, J., & Currie, J. (2004). Accountability in higher education: Bridge over troubled water? Higher Education, 48(4), 529-551.
Hussey, J., & Hussey, R. (1997). Business research. A practical guide for undergraduate and postgraduate students. Houndsmills: Macmillan.
Hutzschenreuter, T., & Kleindienst, I. (2006). Strategy-process research: What have we learned and what is still to be explored. Journal of Management, 32(5), 673-720.
Idris, W. M. S., & Momani, R. A. (2013). Impact of environmental dynamism on marketing strategy comprehensiveness and organizational performance. International Journal of Business and Management, 8(9), p40.

244
IKED. (2010). Towards innovation policy in A.abu Dhabi: Indicators, benchmarking and natural resources rich economics. Retrieved 2013 http://gsec.abudhabi.ae/Sites/GSEC/Content/EN/PDF/innovation-report-pdf,property=pdf.pdf
Jackson, E. (2013). Choosing a methodology: philosophical underpinning, Practitioner Research in Higher Education Journal, 7(1), 49-62.
Jacques, J. E. (2006). A importancia da analise do contexto organizacional durante a construcao e implementacao de recursos assistenciais na gestao da criacao do conhecimento: Uma contribuicao para o processo estrategico nas organizacoes hospitalares. Paper presented at the IEncontro Nacional da Associacao Nacional de Pesquisa e Pos-Graduacao em Administracao [National Meeting of the National Association of Research and Graduate Studies in Management]. Salvador – Anais Salvador, ANPAD.
Jansen, J. J., Van Den Bosch, F. A., & Volberda, H. W. (2006). Exploratory innovation, exploitative innovation, and performance: Effects of organizational antecedents and environmental moderators. Management science, 52(11), 1661-1674.
Jarzabkowski, P., & Balogun, J. (2009). The practice and process of delivering integration through strategic planning. Journal of Management Studies, 46(8), 1255-1288.
Johnson, G., Scholes, K., & Whittington, R. (2008). Exploring corporate strategy: Text and cases: Pearson Education.Harlow
Johnson, L. K. (2004). Execute your strategy—without killing it. Harvard Management Update, 9(12), 3-6.
Judge, W. Q., & Miller, A. (1991). Antecedents and outcomes of decision speed in different environmental contexts. Academy of Management Journal, 34(2), 449-463.
Jusoh, R., & Parnell, J. A. (2008). Competitive strategy and performance measurement in the Malaysian context: An exploratory study. Management decision, 46(1), 5-31.
Kahneman, D., Slovic, P., & Tversky, A. (1982). Judgment under uncertainty: Heuristics and biases. New York: Cambridge University Press.
Kaplan, R. S. (2001). Strategic performance measurement and management in nonprofit organizations. Nonprofit management and Leadership, 11(3), 353-370.

245
Keats, B. W., & Hitt, M. A. (1988). A causal model of linkages among environmental dimensions, macro organizational characteristics, and performance. Academy of Management journal, 31(3), 570-598.
Kennerley, M., & Neely, A. (2003). Measuring performance in a changing business environment. International Journal of Operations & Production Management, 23(2), 213-229.
Khandwalla, P. N. (1976/1977). Some top management styles, their context, and performance. Organization and administrative sciences, 7(4), 21-51.
Kober, R., Ng, J., & Paul, B. J. (2007). The interrelationship between management control mechanisms and strategy. Management Accounting Research, 18(4), 425-452.
Kołakowski, L. (1972). Positivist philosophy from Hume to the Vienna Circle.
Kosar, K. R. (2011). The quasi-government: Hybrid organizations with both government and private sector legal characteristics. CRS report for Congress. : U.S. Congressional Research Service.
Koseoglu, M. A., Barca, M., & Karayormuk, Kemal. (2009). A study on the causes of strategies failing to success. Journal of Global Strategic Management (JGSM), 3(2), 77-90.
Kotler, P., & Turner, R. E. (1979). Marketing management: Analysis, planning, and control: Prentice-Hall.
Koufopoulos, D. N., & Chrysochoidis, G. (2000). The effects of an uncertain country environment upon leadership and strategic planning practices. Strategic Change, 9(6), 379-395.
Koufopoulos, D. N., & Moorgan, N. A. (1994). Competitive pressures force Greek entrepreneurs to plan. Long Range Planning, 27(4), 112-124.
Kraus, S., Harms, R., & Schwarz, E. J. (2006). Strategic planning in smaller enterprises - new empirical findings. Management Research News, 29(6), 334-344.
Kumar, N., Stern, L. W., & Anderson, J. C. (1993). Conducting interorganizational research using key informants. Academy of management journal, 36(6), 1633-1651.
Kwon, T. H., & Zmud, R. W. (1987). Unifying the fragmented models of information systems implementation. Paper presented at the Critical issues in information systems research.

246
Laughlin, R. (1996). Principals and higher principals: Accounting for accountability in the caring professions. Accountability: Power, ethos and the technologies of managing, 225-244.
Laurian, L., Crawford, J., Day, M., Kouwenhoven, P., Mason, G., Ericksen, N., & Beattie, L. (2010). Evaluating the outcomes of plans: Theory, practice, and methodology. Environment and planning. B, Planning & design, 37(4), 740.
Laurian, L., Day, M., Berke, P., Ericksen, N., Backhurst, M., Crawford, J., & Dixon, J. (2004). Evaluating plan implementation: A conformance-based methodology. Journal of the American Planning Association, 70(4), 471-480.
Lavarda, R. A. B., Canet-Giner, M. T., & Peris-Bonet, F. J. (2010). How middle managers contribute to strategy formation process: Connection of strategy processes and strategy practices. Revista de Administração de Empresas, 50, 358-370.
Lawrence, P., & Lorsch, J. (1967). Organization and environment. Boston, MA: Harvard Business School Press.
Lee, G. G., & Pai, J.-C. (2003). Effects of organizational context and inter-group behaviour on the success of strategic information systems planning: An empirical study. Behaviour & Information Technology, 22(4), 263-280.
Lengnick-Hall, C. A., & Futterman, D. H. (1984). Designing a guidance system for complex units. Paper presented at the annual meeting of the Strategic Management Society, Philadelphia.
Leonard, J. (1984). Strategic control: A need for a new definition. Paper presented at the annual meeting of the Strategic Management Society, Philadelphia.
Li, D.-y., & Liu, J. (2014). Dynamic capabilities, environmental dynamism, and competitive advantage: Evidence from China. Journal of Business Research, 67(1), 2793-2799.
Li, S., Ragu-Nathan, B., Ragu-Nathan, T., & Rao, S. S. (2006). The impact of supply chain management practices on competitive advantage and organizational performance. Omega, 34(2), 107-124.
Lisiński, M., & Šaruckij, M. (2006). Principles of the application of strategic planning methods. Journal of Business Economics and Management, 7(2), 37-43.
Liviu, C., Sorina, G., & Radu, O. (2008). Strategic control and performance measurement systems. Annals of the University of Oradea, Economic Science Series, 17(4).

247
Long, E., & Franklin, A. L. (2004). The paradox of implementing the government performance and results act: Top-down direction for bottom-up implementation. Public Administration Review, 309-319.
Lorange, P. (1988). Co-operative strategies: Planning and control considerations. Strategies in global competition, 370-389.
Lorange, P., & Murphy, D. (1984). Considerations in implementing strategic control. The Journal of Business Strategy, 4(4), 27.
Lu, W., Shen, L., & Yam, M. C. (2008). Critical success factors for competitiveness of contractors: China study. Journal of construction engineering and management, 134(12), 972-982.
Lunt, N., Davidson, C., & McKegg, K. (2003). Evaluating policy and practice: A New Zealand reader: Pearson Prentice Hall.
Mackenzie, N., & Knipe, S. (2006). Research dilemmas: Paradigms, methods and methodology. Issues in educational research, 16(2), 193-205.
Malhotra, N., Hall, J., Shaw, M., & Oppenheim, P. (2002). Marketing research: An
applied orientation (2nd ed.). Australia: Frenchs Forest, NSW: Prentice Hall.
Malhotra, N. K., & Birks, D. F. (2007). Marketing research: An applied approach: Pearson Education.
Malmi, T., & Brown, D. A. (2008). Management control systems as a package—opportunities, challenges and research directions. Management accounting research, 19(4), 287-300.
Man, T. W. Y., Lau, T., & Chan, K. F. (2002). The competitiveness of small and medium enterprises: A conceptualization with focus on entrepreneurial competencies. Journal of Business Venturing, 17(2), 123-142.
Marginson, D. E. (2002). Management control systems and their effects on strategy formation at middle‐management levels: Evidence from a UK organization. Strategic management journal, 23(11), 1019-1031.
Martin, J., & Kloot, L. (2001). Local government accountability: Explaining differences. Accounting, Accountability & Performance, 7(1), 51.
Martinez, M. C., & Nilson, M. (2006). Assessing the connection between higher education policy and performance. Educational Policy, 20(2), 299-322.

248
Matanda, M. J., & Freeman, S. (2009). Effect of perceived environmental uncertainty on exporter–importer inter-organisational relationships and export performance improvement. International Business Review, 18(1), 89-107.
Matthews, C. H., & Scott, S. G. (1995). Uncertainty and planning in small and entrepreneurial firms: An empirical assessment. Journal of Small Business Management, 33(4), 34-52.
McCoy, M., & Hargie, O. D. (2001). Evaluating evaluation: Implications for assessing quality. International Journal of Health Care Quality Assurance, 14(7), 317-327.
McGinnis, M. A., & Vallopra, R. M. (1999). Purchasing and supplier involvement in process improvement: A source of competitive advantage. Journal of Supply Chain Management, 35(3), 42-50.
Mckeown, M. (2012). The strategy book. New Jersey: Prentice Hall.
Mcllquham-Schmidt, A. (2010). Strategic planning and corporate performance. What is the relationship? Aarhus University, Business School Working Paper 02, Retrieved from http://www.hha.dk/man/cmsdocs/WP/2010/wp2010_02.pdf on February 6, 2016.
Meier, K. J., & O’Toole, L. J. (2013). Subjective organizational performance and measurement error: Common source bias and spurious relationships. Journal of Public Administration Research and Theory, 23(2), 429-456.
Menon, A., Bharadwaj, S. G., Adidam, P. T., & Edison, S. W. (1999). Antecedents and consequences of marketing strategy making: A model and a test. The Journal of Marketing, 18-40.
Merchant, K. A. (1985). Control in business organization: Financial Times/Prentice Hall.
Merchant, K. A., & Otley, D. T. (2006). A review of the literature on control and accountability. Handbooks of management accounting research, 2, 785-802.
Miles, M. P., Covin, J. G., & Heeley, M. B. (2000). The relationship between environmental dynamism and small firm structure, strategy, and performance. Journal of Marketing Theory and Practice, 63-78.
Miles, R. E., Snow, C. C., Meyer, A. D., & Coleman, H. J., Jr. (1978). Organizational strategy, structure, and process. The Academy of Management Review, 3(3), 546-562.

249
Miller, C. C. (2008). Decisional comprehensiveness and firm performance: Towards a more complete understanding. Journal of Behavioral Decision Making, 21(5), 598-620.
Miller, C. C., Burke, L. M., & Glick, W. H. (1998). Cognitive diversity among upper-echelon executives: Implications for strategic decision processes. Strategic Management Journal, 19(1), 39-58.
Miller, C. C., & Ireland, R. D. (2005). Intuition in strategic decision making: Friend or foe in the fast-paced 21st century? The Academy of Management Executive, 19(1), 19-30.
Miller, D. (1983). The correlates of entrepreneurship in three types of firms. Management Science, 29(7), 770-791.
Miller, D., & Friesen, P. H. (1978). Archetypes of strategy formulation. Management science, 24(9), 921-933.
Miller, S. (1997). Implementing strategic decisions: Four key success factors. Organization Studies, 18(4), 577-602.
Mintzberg, H. (1973). Strategy-making in three modes. California Management Review, 16(2), 44-53.
Mintzberg, H. (1987). Crafting strategy: Harvard Business School Press Boston, MA.
Mintzberg, H. (2000). Rise and fall of strategic planning: Pearson Educational limited.
Mintzberg, H. (2003). The strategy process: Concepts, contexts, cases: Pearson Education.
Mintzberg, H., Ahlstrand, B., & Lampel, J. (1998). Safari strategy: A guided tour through the wilds of strategic management: New York: Free Press.
Mintzberg, H., & Waters, J. A. (1985). Of strategies, deliberate, and emergent.
Moe, R. C. (2001). The emerging federal quasi government: Issues of management and accountability. Public Administration Review, 61(3), 290-312.
Mohd, W., Idris, S., & Momani, R. A. (2013). Impact of environmental dynamism on marketing strategy comprehensiveness and organizational performance. International Journal of Business and Management, 8(9), 40.
Morgan, N. A., Katsikeas, C. S., & Vorhies, D. W. (2012). Export marketing strategy implementation, export marketing capabilities, and export venture performance. Journal of the Academy of Marketing Science, 40(2), 271-289.

250
Morris, M. H., Allen, J., Schindehutte, M., & Avila, R. (2006). Balanced management control systems as a mechanism for achieving corporate entrepreneurship. Journal of Managerial Issues, 468-493.
Mulcasteri, W. R. (2009). Three strategic frameworks. Business Strategy Series, 10(1), 68-75.
Narver, J. C., & Slater, S. F. (1990). The effect of a market orientation on business profitability. The Journal of Marketing, 54(4), 20-35.
Nazemi, S., Asadi, S. T., & Asadi, S. T. (2015). Barriers to strategic planning implementation; case of: Mashhad electricity distribution company. Procedia - Social and Behavioral Sciences, 207, 2-9.
Neely, A., Filippini, R., Forza, C., Vinelli, A., & Jasper, H. (2001). A framework for analysing business performance, firm innovation and related contextual factors: Perceptions of managers and policy makers in two European regions. Integrated Manufacturing Systems, 12(2), 114-124.
Neilson, G. L., Martin, K. L., & Powers, E. (2008). The secrets to successful strategy execution. Harvard Business Review, 86(6), 60.
Nilsson, F. (2002). Strategy and management control systems: A study of the design and use of management control systems following takeover. Accounting & Finance, 42(1), 41-71.
Niven, P. R. (2005). "Adapting the balanced scorecard to fit the public and nonprofit sectors". The Senalosa Group paper.
Noble, C. H. (1999). The eclectic roots of strategy implementation research. Journal of business research, 45(2), 119-134.
Noble, C. H., & Mokwa, M. P. (1999). Implementing marketing strategies: Developing and testing a managerial theory. Journal of Marketing, 63(4), 57-73.
Nonaka, I. (1994). A dynamic theory of organizational knowledge creation. Organization science, 5(1), 14-37.
Norton, D., & Kaplan, R. (1992). The balanced scorecard. Measures that drive performance”, Harvard Business Review, enero-febrero. 70, 71-79.
Norusis, M. (1993). SPSS for Windows, Base System User's Guide. USA, SPSS Inc.
Nutt, P. C. (1999). Surprising but true: Half the decisions in organizations fail. The Academy of Management Executive, 13(4), 75-90.

251
Oakes, L. S., & Young, J. J. (2008). Accountability re-examined: Evidence from Hull House. Accounting, Auditing & Accountability Journal, 21(6), 765-790.
Okeyo, W. O. (2014). The influence of business environmental dynamism, complexity and munificence on performance of small and medium enterprises in Kenya. International Journal of Business and Social Research, 4(8).
Oliveira, V., & Pinho, P. (2011). Bridging the gap between planning evaluation and programme evaluation: The contribution of the PPR methodology. Evaluation, 17(3), 293-307.
Olson, D. L., Chae, B., & Sheu, C. (2005). Issues in multinational ERP implementation. International Journal of Services and Operations Management, 1(1), 7-21.
Orlikowski, W. J., & Baroudi, J. J. (1991). Studying information technology in organizations: Research approaches and assumptions. Information systems research, 2(1), 1-28.
Osborne, D., & Gaebler, T. (1992). Reinventing government: How the entrepreneurial spirit is transforming government. Reading Mass. Addison Wesley Public Comp.
Papadakis, V., & Barwise, P. (1998). What can we tell managers about making strategic decisions? Strategic decisions (pp. 267-287): Springer.
Papadakis, V. M., Lioukas, S., & Chambers, D. (1998). Strategic decision-making processes: The role of management and context. Strategic management journal, 19(2), 115-147.
Pappas, J. M., & Wooldridge, B. (2007). Middle managers' divergent strategic activity: An investigation of multiple measures of network centrality. Journal of Management Studies, 44(3), 323-341.
Park, N. K., & Mezias, J. M. (2005). Before and after the technology sector crash: The effect of environmental munificence on stock market response to alliances of e-commerce firms. Strategic Management Journal, 26(11), 987.
Pasanen, M. (2003). In search of factors affecting sme performance. University of Kuopio, Kuopio.
Patton, M. Q. (1997). Utilization-focused evaluation (3 ed.). Beverly Hills, CA: Sage.
Paul, S. (1992). Strengthening public service accountability: World Bank.

252
Pearce, I., & Robinson, J. (2008). Rb and Mital, a. Strategic management: Formulation, implementation and control: Tata McGraw-Hill, New Delhi.
Pearce, J. A., Freeman, E. B., & Robinson, R. B. (1987). The tenuous link between formal strategic planning and financial performance. Academy of Management Review, 12(4), 658-675.
Pershing, J. A. (2006). Human performance technology fundamentals. Handbook of human performance technology, 5-34.
Peteraf, M. A. (1993). The cornerstones of competitive advantage: A resource‐based view. Strategic management journal, 14(3), 179-191.
Peters, T. J., Waterman, R. H., & Jones, I. (1982). In search of excellence: Lessons from america's best-run companies.
Pfeffer, J. S., & Salancik, G. (1978). Gr (1978). The external control of organizations: A resource dependence perspective. New York.
Phillips, P. A., & Moutinho, L. (2000). The strategic planning index: A tool for measuring strategic planning effectiveness. Journal of Travel Research, 38(4), 369-379.
Pindur, W. (1992). Public sector strategic planning for the year 2000. Strategic Change, 1(2), 101-117.
Poister, T. H. (2010). The future of strategic planning in the public sector: Linking strategic management and performance. Public Administration Review, 70(s1), s246-s254.
Poister, T. H., Edwards, L. H., Pasha, O. Q., & Edwards, J. (2013). Strategy formulation and performance: Evidence from local public transit agencies. Public Performance & Management Review, 36(4), 585-615.
Poister, T. H., & Streib, G. (2005). Elements of strategic planning and management in municipal government: Status after two decades. Public administration review, 45-56.
Porter, M. E. (1980). Competitive strategy. New York: FreePress.
Porter, M. E. (2008). Competitive strategy: Techniques for analysing industries and competitors: Simon and Schuster.
Preble, J. F. (1992). Towards a comprehensive system of strategic control*. Journal of Management Studies, 29(4), 391-408.

253
Priem, R. L., Rasheed, A. M., & Kotulic, A. G. (1995). Rationality in strategic decision processes, environmental dynamism and firm performance. Journal of Management, 21(5), 913-929.
Pryor, M. G., Anderson, D., Toombs, L. A., & Humphreys, J. H. (2007). Strategic implementation as a core competency: The 5Ps model. Journal of Management Research, 7(1), 3.
Purba, R., & Diane, H. (2005). Do green supply chains lead to competitiveness and economic performance?Null. International Journal of Operations & Production Management, 25(9), 898-916.
Rainer, F., & Kazem, C. (1994). Defining competitiveness: A holistic approach. Management Decision, 32(2), 49-58.
Raps, A. (2004). Implementing strategy. Strategic Finance (June), 49-53.
Revilla, E., Rodriguez-Prado, B., & Prieto, I. M. (2008). Dynamism and complexity as antecedents of the knowledge strategy in product development. Available at SSRN 1139925.
Reynolds, C. R., & Fletcher-Janzen, E. (2007). Encyclopedia of special education (Vol. 3): John Wiley & Sons.
Robinson, R. B., & Pearce, J. A. (1983). The impact of formalized strategic planning on financial performance in small organizations. Strategic Management Journal, 4(3), 197-207.
Robinson, R. B., Pearce, J. A., Vozikis, G. S., & Mescon, T. S. (1984). The relationship between stage of development and small firm planning and performance. Journal of Small Business Management (pre-1986), 22(000002), 45.
Robson, C. (1993). Real world research: A resource for social scientists and practitioners-researchers. Massachusetts: Blackwell Pushers.
Rosier, E. R., Morgan, R. E., & Cadogan, J. W. (2010). Marketing strategy and the efficacy of procedural justice: The mid-level marketing manager in industrial service firms. Industrial Marketing Management, 39(3), 450-459.
Ruekert, R. W., Walker Jr, O. C., & Roering, K. J. (1985). The organization of marketing activities: A contingency theory of structure and performance. The Journal of Marketing, 13-25.
Safdari Ranjbar, M., Akbarpour Shirazi, M., & Lashkar Blooki, M. (2014). Interaction among intra-organizational factors effective in successful strategy execution: An analytical view. Journal of Strategy and Management, 7(2), 127-154.

254
Salge, T. O. (2012). The temporal trajectories of innovative search: Insights from public hospital services. Research Policy, 41(4), 720-733.
Salmela, H., Lederer, A. L., & Reponen, T. (2000). Information systems planning in a turbulent environment. European Journal of Information Systems, 9(1), 3-15.
Santa, R., Vemuri, R., Ferrer, M., Bretherton, P., & Hyland, P. (2010). Understanding the impact of strategic alignment on the operational performance of post implemented technological innovations. Paper presented at the Proceedings of the 11th International CINet Conference: Practicing Innovation in the Times of Discontinuity.
Sarason, Y., & Tegarden, L. F. (2003). The erosion of the competitive advantage of strategic planning: A configuration theory and resource based view*. Journal of Business and Management, 9(1), 1.
Saunders, J., & Wong, V. (1985). In search of excellence in the UK. Journal of Marketing Management, 1(1-2), 119-137.
Saunders, M. N., Saunders, M., Lewis, P., & Thornhill, A. (2011). Research methods for business students, 5/e: Pearson Education India.
Schaap, J. I. (2012). Strategy implementations - can organizations attain outstanding performance? Strategic Management Review, 6(1), 98-121.
Schäffer, U., & Willauer, B. (2003). Strategic planning as a learning process. Schmalenbach Business Review, 55(2), 86-107.
Schedler, A., Diamond, L., & Plattner, M. (1999). Restraining the state: Conflicts and agents of accountability. The self-restraining state: Power and accountability in new democracies, 333-350.
Schendel, D., & Hofer, C. W. (1979). Strategic management: A new view of business policy and planning: Little, Brown.
Schreyögg, G., & Steinmann, H. (1987). Strategic control: A new perspective. The Academy of Management Review, 12(1), 91-103.
Schwab, K., & Sala-i-Martin, X. (2012). The global competitiveness report 2012-2013.
Scotland, J. (2012). Exploring the philosophical underpinnings of research: Relating ontology and epistemology to the methodology and methods of the scientific, interpretive, and critical research paradigms. English Language Teaching, 5(9), p9.

255
Seasons, M. (2003). Monitoring and evaluation in municipal planning: Considering the realities. Journal of the American Planning Association, 69(4), 430-440.
Sekaran, U. (2000). Research methods for business: A skill-building approach. USA: John Wiley & sons: Inc.
Sekaran, U. (2003). Research methods for business: A skill building approach. New York: John Wiley and Sons.
Shafritz, J. M., & Shafritz. (1992). The HarperCcollins dictionary of American government and politics: HarperPerennial.
Sharfman, M. P., & Dean, J. W. (1991). Conceptua.
lizing and measuring the organizational environment: A multidimensional approach. Journal of Management, 17(4), 681-700.
Shepherd, N. G., & Rudd, J. M. (2014). The influence of context on the strategic decision‐making process: A review of the literature. International Journal of Management Reviews, 16(3), 340-364.
Shi, W., Markoczy, L., & Dess, G. G. (2009). The role of middle management in the strategy process: Group affiliation, structural holes, and Tertius Iungens. Journal of Management.
Shin, J. C. (2010). Impacts of performance-based accountability on institutional performance in the US. Higher Education, 60(1), 47-68.
Sikes, P. (2004). Methodology Procedures And Ethical Concerns, in Opie, C. (ed.). (2004). Doing Educational Research. London: Sage.
Simons, R. (1991). Strategic orientation and top management attention to control systems. Strategic Management Journal, 12(1), 49-62.
Simons, R. (2000). Performance measurement and control systems for implementing strategies. New York: Prentice Hall.
Sinclair, A. (1995). The chameleon of accountability: Forms and discourses. Accounting, organizations and Society, 20(2), 219-237.
Sitkin, S. B., Cardinal, L. B., & Bijlsma-Frankema, K. M. (2010). Organizational control: Cambridge University Press.
Slater, S. F., & Olson, E. M. (2000). Strategy type and performance: The influence of sales force management. Strategic Management Journal, 21(8), 813-829.

256
Sledgianowski, D., Luftman, J. N., & Reilly, R. R. (2006). Development and validation of an instrument to measure maturity of IT business strategic alignment mechanisms. Innovative Technologies for Information Resources Management, 19(3), 18-33.
Slotegraaf, R., & Dickson, P. (2004). The paradox of a marketing planning capability. Journal of the Academy of Marketing Science, 32(4), 371-385.
Sniezek, J. A. (1992). Groups under uncertainty: An examination of confidence in group decision making. Organizational Behavior and Human Decision Processes, 52(1), 124-155.
Snyman, J. H., & Drew, D. V. (2003). Complex strategic decision processes and firm performance in a hypercompetitive industry. The Journal of American Academy of Business, 2(2), 293-298.
Somekh, B., & Lewin, C. (2005). Research methods in the social sciences: Sage.
Song, M., Im, S., Bij, H. v. d., & Song, L. Z. (2011). Does strategic planning enhance or impede innovation and firm performance?*. Journal of Product Innovation Management, 28(4), 503-520.
Stewart, J. D. (1984). The role of information in public accountability. Issues in public sector accounting, 17, 13-34.
Stonehouse, G., & Pemberton, J. (2002). Strategic planning in smes – some empirical findings. Management Decision, 40(9), 853-861.
Streib, G., Slotkin, B. J., & Rivera, M. (2001). Public administration research from a practitioner perspective. Public Administration Review, 61(5), 515-525.
Styles, C. (1998). Export performance measures in Australia and the United Kingdom. Journal of International Marketing, 12-36.
Tang, Z., & Brody, S. D. (2009). Linking planning theories with factors influencing local environmental-plan quality. Environment and Planning B: Planning and Design, 36(3), 522-537.
Tashakkori, A., & Teddlie, C. (1998). Mixed methodology: Combining qualitative and quantitative approaches (Vol. 46): Sage.
Teece, D. J. (2007). Explicating dynamic capabilities: The nature and microfoundations of (sustainable) enterprise performance. Strategic Management Journal, 28(13), 1319-1350.

257
Teece, D. J., Pisano, G., & Shuen, A. (1997). Dynamic capabilities and strategic management. Strategic Management Journal, 18(7), 509-533.
Tegarden, L. F., Sarason, Y., Childers, J. S., & Hatfield, D. E. (2005). The engagement of employees in the strategy process and firm performance: The role of strategic goals and environment. Journal of Business Strategies, 22(2), 75-99.
Thorpe, E. R., & Morgan, R. E. (2007). In pursuit of the “ideal approach” to successful marketing strategy implementation. European Journal of Marketing, 41(5/6), 659-677.
Tracey, M., Vonderembse, M. A., & Lim, J.-S. (1999). Manufacturing technology and strategy formulation: Keys to enhancing competitiveness and improving performance. Journal of Operations Management, 17(4), 411-428.
Tversky, A., & Kahneman, D. (1974). Judgment under uncertainty: Heuristics and biases. science, 185(4157), 1124-1131.
U.S. Energy information administration. (2015). United Arab Emirates: International energy data and analysis.
Veliyath, R., & Shortell, S. M. (1993). Strategic orientation, strategic planning system characteristics and performance, Journal of Management Studies, 30(3), 359-381.
Venkatesh, V., Brown, S. A., & Bala, H. (2013). Bridging the qualitative-quantitative divide: Guidelines for conducting mixed methods research in information systems. MIS quarterly, 37(1), 21-54.
Venkatesh, V., Chan, F. K., & Thong, J. Y. (2012). Designing e-government services: Key service attributes and citizens’ preference structures. Journal of Operations Management, 30(1), 116-133.
Volkwein, J. F., & Tandberg, D. A. (2008). Measuring up: Examining the connections among state structural characteristics, regulatory practices, and performance. Research in Higher Education, 49(2), 180-197.
Vorhies, D. W., & Morgan, N. A. (2005). Benchmarking marketing capabilities for sustainable competitive advantage. Journal of Marketing, 69(1), 80-94.
Waheeduzzaman, A., & Ryans, J. K. (1996). Definition, perspectives, and understanding of international competitiveness: A quest for a common ground. Competitiveness Review: An International Business Journal, 6(2), 7-26.
Waldner, L. S. (2004). Planning to perform: Evaluation models for city planners. Berkley Planning Journal, 17, 1-28.

258
Wall, T. D., Michie, J., Patterson, M., & Wood, S. J. (2004). On the validity of subjective measures of company performance. Personnel Psychology, 57(1), 95-118.
Webster, F. E., Jr. (1992). The changing role of marketing in the corporation. The Journal of Marketing, 56(4), 1-17.
Weiss, B., Berger, E., & Hatcher, B. (2008). A guidebook to strategy evaluation: Evaluating your city’s approach to community safety and youth violence prevention. Los Angeles.
Weiss, C. H. (1972). Methods for assessing program effectiveness. Baltimore, MD: John Hopkins University Press.
Weiss, C. H. (1997). Theory‐based evaluation: Past, present, and future. New directions for evaluation, 1997(76), 41-55.
White, C. J., Conant, J. S., & Echambadi, R. (2003). Marketing strategy development styles, implementation capability, and firm performance: Investigating the curvilinear impact of multiple strategy-making styles. Marketing Letters, 14(2), 111-124.
Wiesner, R., & Millett, B. (2012). Strategic approaches in Australian smes: Deliberate or emergent? Journal of Management & Organization, 18(01), 98-122.
Wijewardena, H., De Zoysa, A., Fonseka, T., & Perera, B. (2004). The impact of planning and control sophistication on performance of small and medium-sized enterprises: Evidence from Sri Lanka. Journal of Small Business Management, 42(2), 209-217.
Wilensky, H. L. (1967). Organizational intelligence: Knowledge and policy in government and industry. Vol. 1: Basic Books, Nova Iorque.
Wiltbank, R., Dew, N., Read, S., & Sarasvathy, S. D. (2006). What to do next? The case for non‐predictive strategy. Strategic management journal, 27(10), 981-998.
Woods, M., & Grubnic, S. (2008). Linking comprehensive performance assessment to the balanced scorecard: Evidence from Hertfordshire County Council. Financial Accountability & Management, 24(3), 343-361.
Yamin, S., Gunasekaran, A., & Mavondo, F. T. (1999). Relationship between generic strategies, competitive advantage and organizational performance: An empirical analysis. Technovation, 19(8), 507-518.

259
Yang, j. q. (2010). The current situation, issues and strategies of food industry development in Jiang Xi province. Enterprise Economy (10), 100-103.
Zikmund, W. G. (2000). Business research methods (8th ed.). Orlando, Florida, U.S.A.: Dryden Press.
Zinn, J., & Flood, A. B. (2009). Commentary: Slack resources in health care organizations—fat to be trimmed or muscle to be exercised? Health services research, 44(3), 812-820.
Zuriekat, M., Salameh, R., & Alrawashdeh, S. (2011). Participation in performance measurement systems and level of satisfaction. International Journal of Business and Social Science, 2(8), 159-169.

260
Appendix A
Determinants of Organizational Performance in the Semi-Government Sector of Abu Dhabi: Strategic Management
Perspective
Dear Executive:
This study is conducted by Bakheet Al Katheeri, a DBA student at the UAEU, to investigate the determinants of organization performance from a strategic perspective.
We invite you to participate in this study. The study is designed to help managers of semi-government sector firms better understand strategic planning practices and how they can contribute to enhance the performance of these firms. A summary report of the results will be available to all participants. Please indicate your interest by providing us with your email below.
Email: ____________________________________
Your participation is critical for the success of this study. Please be assured that your responses will be held strictly confidential. Only aggregated results will be reported, with no references made to individual responses, respondents, or companies.
If you have questions regarding this study, please do not hesitate to contact the researcher directly (as per contact information below).
Thank you in advance for your valuable contribution to this important and timely study.
Bakheet Al Katheeri

261
Appendix B
SECTION A - 7STRATEGIC PLAN FORMULATION
Q.1. Please tell us how often the following tools are used in developing your strategic plans.
If you are not familiar with any tool(s), please, check the last column (Not familiar with).
Never Seldom Some-times Often Always
Not familiar
with 1.1. Pro forma financial statements
(e.g., cash flow, income statement and budget)
1 2 3 4 5 6
1.2. Cost- benefit analysis 1 2 3 4 5 6
1.3. Benchmarking 1 2 3 4 5 6
1.4. Gap analysis 1 2 3 4 5 6
1.5. Balanced scorecard 1 2 3 4 5 6
1.6. Value chain analysis 1 2 3 4 5 6
1.7. Spreadsheet “what if ” analysis 1 2 3 4 5 6
1.8. SWOT analysis 1 2 3 4 5 6
1.9. PEST (Political, Economic, Social and Technological) analysis
1 2 3 4 5 6
1.10. Portfolio analysis (e.g., Boston consulting matrix or General Electric matrix)
1 2 3 4 5 6
1.11. Porter’s five forces analysis 1 2 3 4 5 6

262
Q.2. To what extent do you agree or disagree with each one of the following statements about the planning process in your organization?
Strongly Disagree Disagree
Neither Disagree Nor Agree
Agree Strongly Agree
2.1. Everything that has to be planned is studied carefully during the process of strategic planning.
1 2 3 4 5
2.2. During the process of strategic planning, we analyse each decision very carefully.
1 2 3 4 5
2.3. During the process of strategic planning, many alternatives are evaluated carefully.
1 2 3 4 5
2.4. Those who are involved in strategic planning analyse and evaluate projects carefully.
1 2 3 4 5
2.5. Strategic planning is a very demanding process. 1 2 3 4 5
2.6. Those who are involved in strategic planning spare no effort.
1 2 3 4 5

263
SECTION B - STRATEGIC PLAN IMPLEMENTATION
Q.3. To what extent do you agree or disagree with each one of the following statements to best the current situation of strategic plan implementation at your organization?
Strongly Disagree Disagree
Neither Disagree
Nor Agree
Agree Strongly Agree
3.1. We use a diverse set of ideas from internal and external sources (rather than from limited internal sources) in implementing our strategic plan.
1 2 3 4 5
3.2. We evaluate thoroughly each possible action before implementing our strategic plan.
1 2 3 4 5
3.3. We attempt to determine optimal courses of action for how to best implement our strategic plan.
1 2 3 4 5
3.4. We use the experiences of managers from different management levels while implementing our strategic plan.
1 2 3 4 5
3.5. We search extensively for possible implementation actions before we actually implement our strategic plan.
1 2 3 4 5

264
Q.4. Please identify to what extent you agree or disagree with each one of the following statements on to the current situation within your organization.
Strongly Disagree Disagree
Neither Disagree
Nor Agree Agree Strongly
Agree
4.1. Our people have the necessary skills to implement our strategic plan effectively.
1 2 3 4 5
4.2. When our people don’t have the necessary skills for implementing our strategic plan, we hire new staff with the necessary skills.
1 2 3 4 5
4.3. Our systems and processes (e.g., reward systems, manufacturing processes, information systems, etc.) are aligned to make our strategic plan work.
1 2 3 4 5
4.4. We have formal assignment of organizational specializations, authority and responsibility.
1 2 3 4 5
4.5. Our organizational culture (e.g., values that are shared by employees) is in alignment with our strategic plan.
1 2 3 4 5
4.6. The behaviors/ decisions of our managers are consistent with the requirements of our strategic plan.
1 2 3 4 5

265
4.7. We allocate the resources (e.g., money, technology, staff, etc.) that are necessary to support our strategic plan.
1 2 3 4 5
4.8. We plan and decide according to our established strategic plan.
1 2 3 4 5

266
SECTION C - STRATEGIC PLAN EVALUATION
Q.5. To what extent do you agree or disagree with each of the following statements regarding rial accountability practices in your organization?
Strongly Disagree Disagree
Neither Disagree Nor Agree
Agree Strongly Agree
5.1. Our organization conducts regular audits /reviews of our programs/activities.
1 2 3 4 5
5.2. Our organization benchmarks its performance on key indicators against comparable organizations.
1 2 3 4 5
5.3. Managers at my level are held accountable for the results of their activities.
1 2 3 4 5
5.4. The individual to whom I report periodically reviews my results with me.
1 2 3 4 5
Q.6. To what extent do you agree or disagree with each one of the following statements that best strategic plan evaluation at your organization?
Strongly Disagree Disagree
Neither Disagree Nor Agree
Agree Strongly Agree
6.1. After we develop and implement our strategic plan, we engage in a systematic and continuous effort to identify if the environmental conditions (e.g., forecasts of inflation or market growth rate, etc.) forming the basis of our plan have changed so that we can update our assumptions and strategic plan.
1 2 3 4 5
6.2. We focus on the accomplishment of the objectives of our strategic plan.
1 2 3 4 5
6.3. Once implementation of our strategic plan has begun, we engage in a systematic and continuous effort to identify and appraise unforeseen effects of the implemented decisions so
1 2 3 4 5

267
that we can assess whether we should change our course of actions.
6.4. During the development and implementation of our strategic plan, we engage in a systematic and continuous effort to monitor the full range of emerging events inside and outside our organization which are likely to threaten the course of our strategic action, so that we can uncover important yet unanticipated information and safeguard our strategic plan on a continuous basis.
1 2 3 4 5

268
SECTION D - ORGANIZATIONAL OUTCOMES
Q.7. Relative to similar organizations at the present time, how do you rate your organization’s ance in each of the following dimensions?
Much Worse Worse Similar Better Much
Better 7.1. Quality of products or services provided 1 2 3 4 5
7.2. Development of products/services 1 2 3 4 5
7.3. Employee satisfaction 1 2 3 4 5
7.4. Customer satisfaction 1 2 3 4 5
7.5. Sales/revenue growth 1 2 3 4 5
7.6. Market share 1 2 3 4 5
7.7. Return on investment 1 2 3 4 5
7.8. Social responsibilities 1 2 3 4 5
7.9. Operational efficiency 1 2 3 4 5
Q.8. To what extent is your organization able to attain each of the followings?
Never Seldom
Sometimes Often Alway
s 8.1. Adapting to the changes in competitors’ market strategies.
1 2 3 4 5
8.2. Rapid adaptation of products or services to changes in clients’ needs.
1 2 3 4 5
8.3. Rapid reaction to new threats in the market.
1 2 3 4 5
8.4. Rapid exploitation of new market opportunities. 1 2 3 4 5

269
SECTION E - ENVIRONMENTAL DYNAMISM
Q.9. To what extent do you agree or disagree with each of the following statements regarding ustry.
Strongly Disagree Disagree
Neither Disagree Nor
Agree Agree Strongly
Agree
9.1. Products or services in our industry are updated quickly.
1 2 3 4 5
9.2. The acts of our competitors are difficult to predict.
1 2 3 4 5
9.3. The technology in our industry develops/ changes quickly.
1 2 3 4 5
9.4. It is difficult to predict the changes in customer needs.
1 2 3 4 5

270
SECTION F - GENERAL INFORMATION
Q.10. To what extent are the following individuals involved in the development of your ation’s strategic plan?
Never Seldom Sometimes Often Always
10.1. CEO/managing director 1 2 3 4 5
10.2. Board of directors 1 2 3 4 5
10.3. Planning committee/specialists 1 2 3 4 5
10.4. Senior managers 1 2 3 4 5
10.5. Middle managers 1 2 3 4 5
10.6. Members of the supervisory management/lower managers
1 2 3 4 5
Q.11. Please provide me with the following general information.
11.1. When did your organization develop its first strategic plan (mention the year)?
Less Than 5 Years
5 Years More than 5 Years
11.2. What is the long-term planning horizon of your current strategic plan?
Less Than 5 Years
5 Years More than 5 Years
11.3. How long did your organization take to prepare its current strategic plan?
Less than 4 months
4-8 months More than 8 months
11.4. Number of full-time employees at your organization who are charged exclusively with strategic planning activities
Fewer than 100 100-249 250-
499
500- 999
More than 1000
11.5. Main activity of your organization
11.6. Number of full time employees �< 100 �< 100-249 �< 250-499 �< 500-999 �>1000 11.7. Number of expatriate employees �< 100 �< 100-249 �< 250-499 �< 500-999 �>1000
11.8. Number of years you have spent at this organization Less than 5 years 5-10
years More than 10 years

271
11.9. Your managerial level � Top management � Middle management � Lower management � Other, please specify
11.10. Number of years at your current position
Less than 5 years
5-10 years
More than 10 years
11.11. The organizational level of the unit responsible for strategic planning � Division/sector � Department � Section/unit � Others (please mention) � There is no specific organizational unit responsible for strategic planning. 11.12. What is the percentage of foreign ownership in your organization?
0% Foreign
Ownership
1-25% Foreign
Ownership
26-49% Foreign
Ownership 11.13. Gender � Male � Female
If there are any comments that you would like to add regarding this questionnaire, please do so below.
THANK YOU! I REALLY APPRECIATE YOUR PARTICIPATION.
Bakheet Al Katheeri (Researcher)

272
Appendix C
Table (1-A) illustrates the summary of missing data in the study. This may be due to
the length of the questionnaire although efforts were made to minimize the effect of
this problem (see Section 3.9.4 in Chapter 3).
Table (1-A)
A summary of the missing data
Variables Valid Missing
1.1. Pro forma financial statements 182 0
(e.g., cash flow, income statement and budget) 182 0
1.2. Cost- benefit analysis 182 0
1.3. Benchmarking 182 0
1.4. Gap analysis 182 0
1.5. Balanced scorecard 182 0
1.6. Value chain analysis 182 0
1.7. Spreadsheet “what if ” analysis 182 0
1.8. SWOT analysis 182 0
1.9. PEST (Political, Economic, Social and Technological) analysis
182 0
1.10. Portfolio analysis (e.g., Boston consulting matrix or General Electric matrix)
182 0

273
2.1. Everything that has to be planned is studied carefully during the process of strategic planning.
182 0
2.2. During the process of strategic planning, we analyse each decision very carefully.
182 0
2.3. During the process of strategic planning, many alternatives are evaluated carefully.
182 0
2.4. Those who are involved in strategic planning analyse and evaluate projects carefully.
182 0
2.5. Strategic planning is a very demanding process. 182 0
2.6. Those who are involved in strategic planning spare no effort. 182 0
3.1. We use a diverse set of ideas from internal and external sources (rather than from limited internal sources) in implementing our strategic plan.
182 0
3.2. We evaluate thoroughly each possible action before implementing our strategic plan.
182 0
3.3. We attempt to determine optimal courses of action for how to best implement our strategic plan.
182 0
3.4. We use the experiences of managers from different management levels while implementing our strategic plan.
182 0
3.5. We search extensively for possible implementation actions before we actually implement our strategic plan.
182 0
4.1. Our people have the necessary skills to implement our strategic plan effectively.
182 0
4.2. When our people don’t have the necessary skills for implementing our strategic plan, we hire new staff with the necessary skills.
182 0
4.3. Our systems and processes (e.g., reward systems, manufacturing processes, information systems, etc.) are aligned to make our strategic plan work.
182 0
4.4. We have formal assignment of organizational specializations, authority and responsibility.
182 0
4.5. Our organizational culture (e.g., values that are shared by employees) is in alignment with our strategic plan.
182 0
4.6. The behaviors/ decisions of our managers are consistent with the requirements of our strategic plan.
182 0

274
4.7. We allocate the resources (e.g., money, technology, staff, etc.) that are necessary to support our strategic plan.
182 0
4.8. We plan and decide according to our established strategic plan. 182 0
5.1. Our organization conducts regular audits /reviews of our programs/activities.
182 0
5.2. Our organization benchmarks its performance on key indicators against comparable organizations.
182 0
5.3. Managers at my level are held accountable for the results of their activities. 182 0
5.4. The individual to whom I report periodically reviews my results with me. 182 0
6.1. After we develop and implement our strategic plan, we engage in a systematic and continuous effort to identify if the environmental conditions (e.g., forecasts of inflation or market growth rate, etc.) forming the basis of our plan have changed so that we can update our assumptions and strategic plan.
182 0
6.2. We focus on the accomplishment of the objectives of our strategic plan. 182 0
6.3. Once implementation of our strategic plan has begun, we engage in a systematic and continuous effort to identify and appraise unforeseen effects of the implemented decisions so that we can assess whether we should change our course of actions.
182 0
6.4. During the development and implementation of our strategic plan, we engage in a systematic and continuous effort to monitor the full range of emerging events inside and outside our organization which are likely to threaten the course of our strategic action, so that we can uncover important yet unanticipated information and safeguard our strategic plan on a continuous basis.
182 0
7.1. Quality of products or services provided 182 0
7.2. Development of products/services 182 0
7.3. Employee satisfaction 182 0
7.4. Customer satisfaction 182 0

275
7.5. Sales/revenue growth 182 0
7.6. Market share 182 0
7.7. Return on investment 182 0
7.8. Social responsibilities 182 0
7.9. Operational efficiency 182 0
8.1. Adapting to the changes in competitors’ market strategies.
182 0
8.2. Rapid adaptation of products or services to changes in clients’ needs.
182 0
8.3. Rapid reaction to new threats in the market. 182 0
8.4. Rapid exploitation of new market opportunities. 181 1
9.1. Products or services in our industry are updated quickly. 179 3
9.2. The acts of our competitors are difficult to predict. 179 3
9.3. The technology in our industry develops/ changes quickly. 180 2
9.4. It is difficult to predict the changes in customer needs. 179 3

276
Appendix D
Model

277
Appendix E
Notes for Model (Default model)
Computation of degrees of freedom (Default model)
Number of distinct sample moments: 45 Number of distinct parameters to be estimated: 39
Degrees of freedom (45 - 39): 6
Result (Default model)
Minimum was achieved Chi-square = 27.266 Degrees of freedom = 6 Probability level = .000
Variable Summary (Group number 1)
Observed, endogenous variables Q9 Q10 Observed, exogenous variables Q2 Q3 Q4 Q5 Q6 Q8 Employees Unobserved, exogenous variables e2 e1
Variable counts (Group number 1)
Number of variables in your model: 11 Number of observed variables: 9 Number of unobserved variables: 2 Number of exogenous variables: 9 Number of endogenous variables: 2
Estimates (Group number 1 - Default model)
Scalar Estimates (Group number 1 - Default model)
Maximum Likelihood Estimates

278
Regression Weights: (Group number 1 - Default model)
Estimate S.E. C.R. P Label Q9 <--- Q2 .091 .068 1.340 .180 par_1 Q9 <--- Q3 -.311 .092 -3.370 *** par_2 Q9 <--- Q4 .107 .060 1.793 .043 par_3 Q9 <--- Q5 .296 .070 4.205 *** par_4 Q9 <--- Q6 .333 .078 4.280 *** par_5 Q9 <--- Q8 .288 .070 4.082 *** par_6 Q9 <--- Employees .123 .031 4.042 *** par_23 Q10 <--- Q9 .707 .082 8.625 *** par_7 Q10 <--- Employees .065 .040 1.623 .051 par_24
Standardized Regression Weights: (Group number 1 - Default model)
Estimate Q9 <--- Q2 .071 Q9 <--- Q3 .211 Q9 <--- Q4 .148 Q9 <--- Q5 .278 Q9 <--- Q6 .275 Q9 <--- Q8 .273 Q9 <--- Employees .253 Q10 <--- Q9 .658 Q10 <--- Employees .124
Covariances: (Group number 1 - Default model)
Estimate S.E. C.R. P Label Q2 <--> Q3 .064 .021 3.078 .002 par_8 Q2 <--> Q4 .128 .042 3.044 .002 par_9 Q2 <--> Q5 .124 .030 4.186 *** par_10 Q2 <--> Q6 .056 .025 2.258 .024 par_11 Q2 <--> Q8 -.009 .028 -.320 .749 par_12 Q3 <--> Q8 .043 .025 1.767 .077 par_13 Q4 <--> Q8 .370 .059 6.308 *** par_14 Q5 <--> Q8 .089 .034 2.596 .009 par_15 Q6 <--> Q8 .112 .031 3.619 *** par_16 Q3 <--> Q6 .132 .024 5.493 *** par_17 Q4 <--> Q6 .166 .045 3.666 *** par_18 Q5 <--> Q6 .155 .032 4.840 *** par_19 Q3 <--> Q5 .138 .027 5.150 *** par_20 Q4 <--> Q5 .290 .055 5.309 *** par_21 Q3 <--> Q4 .049 .035 1.369 .171 par_22 Q2 <--> Employees .195 .063 3.109 .002 par_25

279
Estimate S.E. C.R. P Label Q3 <--> Employees .063 .053 1.200 .230 par_26 Q4 <--> Employees .712 .123 5.792 *** par_27 Q5 <--> Employees .318 .077 4.111 *** par_28 Q6 <--> Employees .342 .070 4.860 *** par_29 Q8 <--> Employees .263 .077 3.426 *** par_30
Correlations: (Group number 1 - Default model)
Estimate Q2 <--> Q3 .276 Q2 <--> Q4 .273 Q2 <--> Q5 .388 Q2 <--> Q6 .199 Q2 <--> Q8 -.028 Q3 <--> Q8 .154 Q4 <--> Q8 .650 Q5 <--> Q8 .230 Q6 <--> Q8 .329 Q3 <--> Q6 .539 Q4 <--> Q6 .334 Q5 <--> Q6 .460 Q3 <--> Q5 .497 Q4 <--> Q5 .516 Q3 <--> Q4 .119 Q2 <--> Employees .279 Q3 <--> Employees .104 Q4 <--> Employees .578 Q5 <--> Employees .380 Q6 <--> Employees .463 Q8 <--> Employees .310
Variances: (Group number 1 - Default model)
Estimate S.E. C.R. P Label Q2 .265 .032 8.185 *** par_31 Q3 .201 .025 8.185 *** par_32 Q4 .827 .101 8.185 *** par_33 Q5 .382 .047 8.185 *** par_34 Q6 .298 .036 8.185 *** par_35 Q8 .392 .048 8.185 *** par_36 Employees 1.836 .224 8.185 *** par_37 e1 .124 .015 8.185 *** par_38 e2 .224 .027 8.185 *** par_39

280
Squared Multiple Correlations: (Group number 1 - Default model)
Estimate Q9 .716 Q10 .554
Matrices (Group number 1 - Default model)
Implied Covariances (Group number 1 - Default model)
Employees Q8 Q6 Q5 Q4 Q3 Q2 Q9 Q1
0 Employees 1.836
Q8 .263 .392
Q6 .342 .112 .298
Q5 .318 .089 .155
.382
Q4 .712 .370 .166
.290
.827
Q3 .063 .043 .132
.138
.049
.201
Q2 .195 -.009
.056
.124
.128
.064
.265
Q9 .585 .234 .201
.229
.421
.053
.095
.436
Q10 .532 .183 .165
.183
.343
.042
.080
.346
.503
Implied Correlations (Group number 1 - Default model)
Employees Q8 Q6 Q5 Q4 Q3 Q2 Q9 Q10
Employees 1.000
Q8 .310 1.000
Q6 .463 .329 1.000
Q5 .380 .230 .460 1.000
Q4 .578 .650 .334 .516 1.000
Q3 .104 .154 .539 .497 .119 1.000

281
Employees Q8 Q6 Q5 Q4 Q3 Q2 Q9 Q10
Q2 .279 -.028 .199 .388 .273 .276 1.00
0
Q9 .654 .567 .560 .562 .701 .181 .279 1.000
Q10 .554 .411 .425 .417 .532 .132 .218 .738 1.000
Residual Covariances (Group number 1 - Default model)
Employees Q8 Q6 Q5 Q4 Q3 Q2 Q9 Q10 Employees .000 Q8 .000 .000 Q6 .000 .000 .000 Q5 .000 .000 .000 .000 Q4 .000 .000 .000 .000 .000 Q3 .000 .000 .000 .000 .000 .000 Q2 .000 .000 .000 .000 .000 .000 .000 Q9 .000 .000 .000 .000 .000 .000 .000 .000 Q10 .000 .032 .042 .079 -.003 .049 .000 .000 .000
Standardized Residual Covariances (Group number 1 - Default model)
Employees Q8 Q6 Q5 Q4 Q3 Q2 Q9 Q1
0 Employees .000
Q8 .000 .000
Q6 .000 .000 .000
Q5 .000 .000 .000 .000
Q4 .000 .000 .000 .000 .000
Q3 .000 .000 .000 .000 .000 .000
Q2 .000 .000 .000 .000 .000 .000 .000
Q9 .000 .000 .000 .000 .000 .000 .000 .00
0
Q10 .000 .782
1.158
1.929
-.045
1.756
-.013
.000
.000
Factor Score Weights (Group number 1 - Default model)

282
Model Fit Summary
CMIN
Model NPAR CMIN DF P CMIN/DF Default model 39 27.266 6 .000 4.544 Saturated model 45 .000 0 Independence model 9 656.273 36 .000 18.230
RMR, GFI
Model RMR GFI AGFI PGFI Default model .016 .961 .705 .128 Saturated model .000 1.000 Independence model .239 .389 .236 .311
Baseline Comparisons
Model NFI Delta1
RFI rho1
IFI Delta2
TLI rho2 CFI
Default model .958 .751 .967 .794 .966 Saturated model 1.000 1.000 1.000 Independence model .000 .000 .000 .000 .000
Parsimony-Adjusted Measures
Model PRATIO PNFI PCFI Default model .167 .160 .161 Saturated model .000 .000 .000 Independence model 1.000 .000 .000
NCP
Model NCP LO 90 HI 90 Default model 21.266 8.667 41.391 Saturated model .000 .000 .000 Independence model 620.273 540.834 707.136
FMIN
Model FMIN F0 LO 90 HI 90 Default model .203 .159 .065 .309 Saturated model .000 .000 .000 .000 Independence model 4.898 4.629 4.036 5.277
RMSEA

283
Model RMSEA LO 90 HI 90 PCLOSE Default model .092 .104 .227 .002 Independence model .259 .335 .383 .000
AIC
Model AIC BCC BIC CAIC Default model 105.266 111.556 218.571 257.571 Saturated model 90.000 97.258 220.737 265.737 Independence model 674.273 675.725 700.421 709.421
ECVI
Model ECVI LO 90 HI 90 MECVI Default model .786 .692 .936 .833 Saturated model .672 .672 .672 .726 Independence model 5.032 4.439 5.680 5.043
HOELTER
Model HOELTER .05
HOELTER .01
Default model 62 83 Independence model 11 12
Observations farthest from the centroid (Mahalanobis distance) (Group number 1)
Observation number Mahalanobis d-squared p 34 35.630 .000 10 27.631 .001 35 25.762 .002 28 25.148 .003
122 24.889 .003 18 22.819 .007 33 22.407 .008 19 20.255 .016
134 20.151 .017 16 18.999 .025 21 17.989 .035 2 17.028 .048
45 15.918 .069 60 15.918 .069 71 15.918 .069 44 14.943 .093

284
Observation number Mahalanobis d-squared p 59 14.943 .093 70 14.943 .093 29 14.612 .102 3 14.188 .116
15 13.987 .123 14 13.867 .127 97 13.820 .129 9 13.722 .133
23 13.561 .139 98 13.238 .152
123 13.057 .160 43 12.844 .170 30 12.744 .175
101 12.676 .178 37 12.651 .179 57 12.651 .179 68 12.651 .179 27 12.627 .180
100 12.584 .182 99 12.538 .185
109 12.457 .189 139 12.432 .190
96 12.283 .198 159 12.236 .200
49 12.204 .202 64 12.204 .202 74 12.204 .202 86 12.204 .202 40 11.886 .220 41 11.696 .231 5 11.504 .243
20 11.443 .247 26 11.363 .252 17 11.006 .275 24 11.006 .275 82 10.845 .286 93 10.684 .298 95 10.582 .305 81 10.439 .316 6 10.408 .318
149 10.376 .321 22 10.326 .325 32 10.159 .338

285
Observation number Mahalanobis d-squared p 112 10.032 .348 110 9.895 .359 144 9.860 .362 115 9.846 .363 118 9.739 .372 137 9.677 .377 108 9.567 .387
12 9.433 .398 4 9.249 .415
133 9.197 .419 36 9.085 .430 56 9.085 .430 67 9.085 .430
106 9.036 .434 113 8.981 .439
38 8.754 .460 58 8.754 .460 69 8.754 .460
161 8.754 .460 128 8.630 .472 141 8.630 .472 146 8.604 .475 111 8.595 .476 125 8.411 .493 117 8.382 .496
54 8.302 .504 78 8.302 .504 91 8.302 .504
160 8.270 .507 140 8.208 .513 177 8.002 .534 143 7.925 .542
94 7.925 .542 119 7.804 .554 126 7.664 .568
11 7.623 .573 80 7.594 .576 52 7.525 .583 66 7.525 .583 89 7.525 .583
104 7.525 .583


![Samsung Ln-s3292d Ln-s4092d Ln-s4692d Bn94-01037a Schematic Diagram [Sch]](https://static.fdocuments.in/doc/165x107/563db88d550346aa9a94b946/samsung-ln-s3292d-ln-s4092d-ln-s4692d-bn94-01037a-schematic-diagram-sch.jpg)

![ACCESSORIOS Magnum Pistolas semiautomáticas...Lincoln Electric ® Serie LN-7, LN-8, LN-9, LN-25 [Alambre de hasta .052 pulg. (1.4 mm)] K489-1 Serie LN-8, LN-9, LN-25 [Alambre de 1/16](https://static.fdocuments.in/doc/165x107/5f37ed334803986d4a61858a/accessorios-magnum-pistolas-semiautomticas-lincoln-electric-serie-ln-7.jpg)