Determinants of Demand for Participation in Wildlife Hunting: A
21
Determinants of Demand for Participation in Wildlife Hunting: A County level Analysis Neelam C. Poudyal , Seong-Hoon Cho and J. M. Bowker (Selected Paper for presentation at the Annual Conference of Southern Agricultural Economics Association (SAEA), Mobile, Alabama, February 4-7, 2007) Authors are respectively the Graduate Research Assistant at the College of Agricultural Science and Natural Resources, the University of Tennessee, Assistant Professor at the Department of Agriculture Economics, The University of Tennessee, and Research Social Scientist at the USDA Forest Service, Southern Research Station, Athens, Georgia. The contact author is Neelam C. Poudyal and can be reached by phone: (865)-974-7483 or E-Mail: [email protected] . Acknowledgement: Authors are thankful to Ken Cordell and Carter Betz of USDA forest service, Southern Research Station for providing data on land cover types.
Transcript of Determinants of Demand for Participation in Wildlife Hunting: A

Determinants of Demand for Participation in Wildlife Hunting: A
County level Analysis
Neelam C. Poudyal, Seong-Hoon Cho and J. M. Bowker
(Selected Paper for presentation at the Annual Conference of Southern Agricultural Economics
Association (SAEA), Mobile, Alabama, February 4-7, 2007)
Authors are respectively the Graduate Research Assistant at the College of Agricultural Science and Natural Resources, the University of Tennessee, Assistant Professor at the Department of Agriculture Economics, The University of Tennessee, and Research Social Scientist at the USDA Forest Service, Southern Research Station, Athens, Georgia. The contact author is Neelam C. Poudyal and can be reached by phone: (865)-974-7483 or E-Mail: [email protected]. Acknowledgement: Authors are thankful to Ken Cordell and Carter Betz of USDA forest service, Southern Research Station for providing data on land cover types.

1
Determinants of Demand for Participation in Wildlife Hunting: A County level Analysis
Abstract
We developed an economic demand model of wildlife hunting and found that
sociodemograpahic and ecological characteristics of county are its strong predictors. Result
shows that the hunting is not popular among younger generation; and promoting hunting clubs
and lease-hunting, recruiting young hunters could be effective policy considerations for
retaining/promoting hunting.
Keywords: Wildlife hunting; License sales; Demand model
JEL Classification: Q21, Q26, L83

2
Introduction
The hunting business in the United States has an important social and economic
contribution. In addition to price of the license itself, cost of a hunting trip includes expenses for
various equipment, transportation and accommodation. For example, expenditure of about 13
million people for hunting and related service activities contributed over $ 20 billion in 2001.
Average expenditure of a hunter on trip and equipments was about $ 800 (US fish and wildlife
service, 2001). Such expenses certainly have a multiplier effect on local and regional economy.
Economic impact of hunting in some of the southern states such as Georgia is estimated to be
higher than that of some famous agriculture crops ie; peanuts (IAFWA, 2002). In addition to
economic impact of the hunting, hunting is found to be helpful in regional ecology as the hunters
harvest the overpopulated numbers of a species every season (Shaw, 1985).
As there is a growing concern of low hunting adaptation among younger generation,
studies such as Mehmood et al (2003) reported that no policy instrument could re-motivate the
hunters to bring back once they quit hunting. Recently the wildlife management agencies in the
United States have experienced revenue loss due to decline in license sale (Sun et al 2005;
Anderson et al 1985). The revenue from sale of these licenses is a major source of budget for the
conservation agencies that have the challenge to meet the growing demand of nature
conservation with limited fund (Anderson et al 1985; Teisl et al 1999; Floyd and Lee 2002). The
drop in license sales can have twofold effects. First is declining budget for conservation
agencies. Second is increasing human-wildlife conflict around rural-urban interfaces due to
overpopulation of species.
Unlike other consumer commodities, price of hunting license is determined by state
agencies rather than market equilibrium. Because of the very small share of the license price in

3
the total expense for hunting, one could argue that the hunters might be relatively less responsive
to price change. As Teisl et al. (1999) concluded that the increase in price would not have
significant effect on the demand of license among resident hunters. So, there might be factors
other than price that determine the demand for hunting licenses. Bissell et al. (1998) concluded
that broad demographic and social changes in the country are influencing the hunting
participation. The need of an empirical study stems out from the fact that such factors on hunting
demand are still not well understood. Moreover, there is a need for developing a hunting demand
model to predict future demand of licenses and revenue associated with them. Besides,
understanding the social and economic factors associated with the hunting activities have
implication for various issues such as social support for hunting promotion and recruitment and
retention of hunters. The state agencies might be interested in such studies because the total
number of hunters in a state partly determines the conservation fund to be allocated for that state
(Floyd and Lee 2002).
Despite of long list of literature on the recreational demand studies, very little has
focused on hunting demand. Because the hunting is different from other recreational activities
such as wildlife viewing and cycling, the results from other recreational demand studies may not
applicable to understand hunting demand. During the recent decades, many studies have
discussed the issues related to demand of sportsman hunting and related outdoor recreation
(Anderson et al. 1985; Walsh et al. 1992; Heberlein and Thompson 1996; Bissel et al. 1998;
Floyd and Lee 2002; Sun et al. 2005; Ziemer et al. 1980; Miller and Hay 1981; Mehmood et al.
2003; and Brown and Connelly 1994). Floyd and Lee 2002 used a logistic regression model and
survey data to find the demographic characteristics of respondents who purchased the hunting
license. They found age and race as the major predictors of hunting and fishing participation.

4
Result from other surveys used a model to describe gender wise participation in hunting
(Heberlein and Thompson 1996; Bissel et al. 1998). Heberlein and Thompson (1996) pointed
out that conducting telephone or questionnaire survey is often considered time consuming and
expensive. Thus a cost effective model that uses the readily available data on license sales and
demography is needed.
Many of the studies in hunting and outdoor recreation have estimated the linear and log-
linear demand model with ordinary least square (OLS) method. Anderson et al. 1985; Brown and
Connelley 1994; Sun et al. 2005; and Ziemer et al. 1980 have used such models. These studies
explained the number of licenses sold as the function of primarily license fee, demographic
variables and other variables related with hunting resources such as deer density. One of the
limitations of the earlier studies was on the questions of the generalization of their findings
because the studies did not cover a large geographical area.
This paper examines the determinants of demand for wildlife hunting of Southern United
States at the county level. The focus of this study is to identity the socio-economic, ecological
and institutional factors and their extent of association with the hunting demand. Finding from
this study will be useful to forecast how the ongoing trends in social and demographic factors are
likely to affect hunting demand and revenue from license sales in the future.
Empirical Model
In contrast to the previous models of hunting or fishing recreation, the proposed model
uses a cross sectional analysis of hunting license demand at the county level. Different from the
other models, it includes both the demand and supply related factors that determine the
equilibrium quantity of license demand and supplied in the counties. Following Sun et al (2005),
Brown and Connelley (1994), and Anderson et al. (1985), we apply an equation of hunting

5
license demand on a cross-sectional data of large geographical coverage of Southeast United
States. We estimate a log-linear model, which is one of the most popular functional forms in
recreation demand models (Ziemer et al. 1980).
k kLnY 0 ……………………….…………………1
Where, lnYi is a N by 1 vector of the natural logarithm of number of license sold in
counties; X is a N by K matrix of the explanatory (demographic or ecological) variables
explaining the socio-demographic and ecological characteristics of the county. Similarly, the last
term ε is N by 1 vector of the residual capturing errors. A test on heteroscedasticity rejected the
null hypothesis of homoscedasticity (F- value of 259.20, degree of freedom 151 and p-value of
less than 0.0001). Although the estimations in presence of heteroscedasticity are unbiased and
consistent, they will not be efficient. In such case, the OLS cannot be used. Since the exact form
of heteroscedasticity is unknown, the above specified model was estimated using feasible
generalized least square (FGLS) method (Greene, 2003). Using FGLS, the parameters are
estimated using the following equation.
yXXX 111 ˆ)ˆ(ˆ …………………..…………………………..2
Where, the term Ω is a N by N diagonal matrix of error term. Note that the y in error term is in
logarithmic form as modified by equation 1. The estimated error variance and specification of
the model is found in Greene (2003).
Since, we adopt the concept of economic demand model, the model explains the
demanded quantity of hunting license as a function of price, availability of substitutes as well as
complements and other socio-demographic factors. We used a set of economic and demographic
variables those are commonly found in existing literatures on hunter’s characteristics, survey of
hunting demand. Following the literature (Heberlein and Thompson 1996; Mehmood et al. 2003;

6
Floyd and Lee, 2002; Bissell et al. 1998), variables including age, education, income, race, and
residence have been considered in the model. The detail definition and description of the
explanatory variables has been presented in table 1. We also used variables including
employment status and family status such as households with children but no wife. According to
Mehmood et al. (2003), the families with childcare responsibilities might influence the time for
participation in hunting trips. Likewise, the proportion of people in the county with full time
employment has been used to capture the effect of employment status. Based on the literatures,
we expect that the county dominated by the white population will have higher demand for
hunting than anywhere else. The natural log of personnel income has been used to estimate the
income elasticity of demand among resident hunters. It is expected that the people with higher
level of economic prosperity are likely to participate in hunting.
Regarding education, we used two different variables to see how the people with different
level of education influence the demand for participation in hunting activities. Given the
opportunity cost of time, we expect that the people with higher level of education are more likely
to participate in hunting as compared to those with less income. We have used two sub-
categories of likely hunters population in this study. Since there is a growing concern of non-
adoption of hunting activity by younger generation as a means of recreation, analyzing the
individual effect of younger and elder population might give clear policy. For this purpose, we
have separate variables capturing the proportion of people between 16 and 35 years, and between
35 and 65. A dummy variable capturing whether the county is metro or non-mtero is included.
We expect that the urban residents are less likely to be involved in hunting as they have access to
various alternative recreational opportunities.

7
We used the percentage of public forest land in the county assuming that the easy
accessibility of public hunting grounds influences the demand for hunting, as traveling further
away increases the cost. Since the pasture and wetlands are the essential components of habitat
for commonly hunted deer and bird species (Shaw, 1985), we include the proportion of these
habitat types to capture the availability of hunting site and abundance of species to be hunted.
Inclusion of such factors in the model is also in line with Mehmood et al. (2003), who found that
lack of public hunting ground was one of the reasons for quitting hunting. Since the hunting and
fishing share some common features that people can recreate from, easy access and availability
of fishing resources in the neighborhood might influence the people’s participation on hunting.
Therefore, we used the availability of fishing camps in county to captures such substitution
effect. Similarly, the hunting is a trip-based outdoor recreation activity; we expect that the
availability of ancillary amusement and recreation attractions in the county might influence
people’s decision to plan for joint outdoor trips. So, number of other amusement/sports
attractions in the county has been included to capture such complementary effect.
As the price of license is not fixed at county level but state, we used a state level fee
proxy to capture the price effect of license on demand for participation. As the different license
types do have different price level, we used a general proxy of per hunter capita cost for license
fee. This means the total revenue from license sale in the state was divided by total resident
hunters for that particular year. Even though, this is not an exact measure of license price, we
believe that this can at least measure the state level variation in price and is the best proxy
available. Also, the exclusion of price from the model can induce omitted variable bias, this
proxy instrument, which changes with price among state but not with error term, is expected to
correct the endogeneity issue. Since, we have taken the natural log of this variable, it gives the

8
elasticity measure of license price. Another variable measuring the number of hunting clubs in
the county has been included in the model. We expect that such institutional platforms can have
direct relationship with the demand for participation in hunting activities.
Although the heteroscedasticity was corrected using GLS method, there is another
empirical issue of multicollinearity, we have to control for. Multicollinearity is caused by the
strong relationship among independent variables in the model, and can often overestimate the
variance thereby limiting the accurate estimation (Greene, 2003). Literatures suggest variance
inflation factor ie; 1/(1-R2) as a measure of multicollinearity and values exceeding 20 is
considered to induce serious statistical problem (Greene, 2003). We used VIF to eliminate some
other demographic variables including rural-urban population ratio, number of kids in the family
to address this issue. We also omitted variables such as average precipitation and temperatures in
the county because of this issue, and also because Teisl et al. 1999 argued that those do not have
effect on license sales. So, we used a set of explanatory variables, which is considered to be free
of multicollinearity in our final model. The VIF value for each of the independent variable
included in model has been given in table 3.
Data Sources
This study used data from different sources. The state offices responsible for hunting
license sales were requested to provide the county level sales record of all kind of residential
hunting permit sold to county residents in year 2000. The quantity of licenses sold under
different license types were summed to get the total quantity of license sold for county residents.
In that sense, we treat this county sum as total demand for participation in hunting. Since, the
total sale of license varies greatly among the counties, we take the natural log of quantity to
minimize empirical issues of outlier effect, heteroscedasticity etc. Counties from ten southern

9
states including Alabama, Georgia, North Carolina, South Carolina, Tennessee, Virginia,
Kentucky, Arkansas, Lousiana and Texas have been included in this study. It should also be
noted that couple of counties in Georgia and Texas has been excluded from this study because
the zero license sale in those counties in 2000 could not fit into our log-linear empirical model.
Sales record by county was available for Florida only after 2004, which we did not include here
whereas we failed to receive sales record from Mississippi State even after several
correspondences. We assume that exclusion of Florida and Mississippi from the study does not
seriously affect the empirical validity of the model we estimate here. Total number of county
included in the analysis is 1066.
Data on demographic and economic variables including age, education, race,
employment, and family with children status were obtained from the US Census 2000 and
Economic Research Service (ERS) of USDA. Since, the demographic variables can have a big
variation according to size of county population, the demographic variables were computed in
percentage. Those include percentage of white people living in county, college graduates and full
time employees each as a percentage of county population. Similarly, people with 9 or less years
of schooling, and those with college degree as proportion of county population; and households
having children but no wife as a percentage of county total were among other variables in
percentage. Binary information on rural or metropolitan status of county was obtained from the
ERS. A county is considered of metro status if the total population exceeds 100, 000. The per
hunter capita expenditure was obtained from the National Shooting Sports Foundation (NSSF).
The foundation keeps the record of resident and non-resident hunting license sales by state,
obtained from the US Fish and Wildlife Services.
10
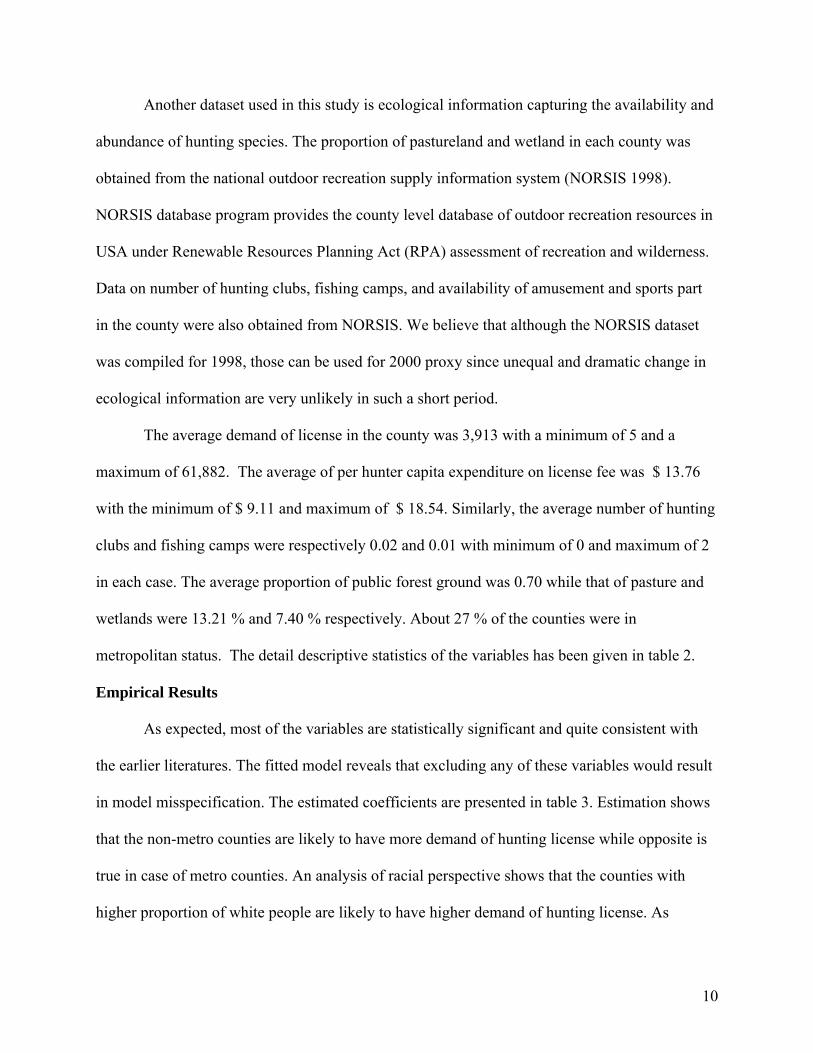
Another dataset used in this study is ecological information capturing the availability and
abundance of hunting species. The proportion of pastureland and wetland in each county was
obtained from the national outdoor recreation supply information system (NORSIS 1998).
NORSIS database program provides the county level database of outdoor recreation resources in
USA under Renewable Resources Planning Act (RPA) assessment of recreation and wilderness.
Data on number of hunting clubs, fishing camps, and availability of amusement and sports part
in the county were also obtained from NORSIS. We believe that although the NORSIS dataset
was compiled for 1998, those can be used for 2000 proxy since unequal and dramatic change in
ecological information are very unlikely in such a short period.
The average demand of license in the county was 3,913 with a minimum of 5 and a
maximum of 61,882. The average of per hunter capita expenditure on license fee was $ 13.76
with the minimum of $ 9.11 and maximum of $ 18.54. Similarly, the average number of hunting
clubs and fishing camps were respectively 0.02 and 0.01 with minimum of 0 and maximum of 2
in each case. The average proportion of public forest ground was 0.70 while that of pasture and
wetlands were 13.21 % and 7.40 % respectively. About 27 % of the counties were in
metropolitan status. The detail descriptive statistics of the variables has been given in table 2.
Empirical Results
As expected, most of the variables are statistically significant and quite consistent with
the earlier literatures. The fitted model reveals that excluding any of these variables would result
in model misspecification. The estimated coefficients are presented in table 3. Estimation shows
that the non-metro counties are likely to have more demand of hunting license while opposite is
true in case of metro counties. An analysis of racial perspective shows that the counties with
higher proportion of white people are likely to have higher demand of hunting license. As

11
expected, it reveals that the white people are more likely to hunt as compared to others. This
finding is in line with conclusion of Floyd and Lee 2002’s survey of hunters, who found that the
African American and Hispanics are less likely to purchase hunting license. Similarly, the
counties with higher proportion of resident with full-time job are less likely to participate in
wildlife hunting. The casual observation behind this might be due to the lack of time. The
household with children but without wife has significant and negative effect is an evidence of
that. It can be interpreted that the time needed for intensive childcare in the family is likely to
affect people’ participation in hunting. This is consistent with Mehmood et al. 2003, since they
found that the time, money and energy required to rear children could influence the people’s
willingness to participate in hunting.
We found that the personal income is one of the strong predictor of demand for wildlife
hunting. Our analysis shows that the income elasticity of license demand among resident hunters
is as high as 0.83. That means a percentage increase in average personal income of resident can
increase the license demand by 0.83 %. This indicates that the hunting in recent days is a kind of
luxury good due to its recreation value, although it used to be a traditional way of gathering
subsistence food. Similarly, the counties with higher proportion of people with fewer years
(below 9) of schooling are more likely to hunt in contrast to college graduates who are less likely
to hunt. We speculate that the higher opportunity cost of time for college graduates might be the
reason behind this, as hunting trips often require commitment of time and physical efforts. The
college graduates with white-collar job might find other time saving and less physically involved
means of entertainment. In addition, hunting is considered often a traditional pride in some rural
communities, where population of farmers or less educated people predominates.
12
As expected, the percentage of public forests in the county has significant and positive
effect in demand of hunting license. It might be because of the availability and easy access to
public hunting ground. Mehmood et al. 2003 concluded that the Alabama hunters quit hunting
due to lack of public grounds. Lack of such forest areas might need hunters to lease private
forests involving extra cost of hunting trips. Likewise, we noticed higher license demand in the
counties with higher proportion of areas in pasture and wetlands. Intuitively this is true, because
the pasture and wetlands are the habitats for many game and bird species. Increase in proportion
of land under such cover types might increase the abundance of game and bird species in the
county. This can further ensure the hunting success of hunters, which further encourages the
hunters to come in next season. We had expected the availability of fishing camps to have
negative effect on hunting license demand, because the fishing could be a close substitute of
hunting, as it is another physically involved wildlife related recreation. Insignificant coefficient
reveals that hunting activities might not be affected by increased supply of fishing resources.
Interestingly, result indicates that there is a significant variation in the behavior of
younger (16-34) and elder (35-65) population of potential hunters. The coefficient of elder hunter
group was significant and positive but it was not significant in case of younger. However, there
was a similarly in sign ie; positive in both case. It reveals that the younger people might not be
adopting the hunting as a recreation activity. This result supports the ongoing debate that the
hunting is not being popular in young generation, for which some state agencies are now
considering recruitment policies. If younger generation is not joining hunting, then the state
agencies will face even more decline in hunting license demand in days to come, which could
result into more revenue loss. To keep the hunting business alive, the state agencies might focus
in this age group for hunting promotion and hunter’s recruitment.

13
The proxy for the license fee was found to have a negative but insignificant effect. The
negative effect found here is consistent with the findings of Teisl et al. 1999; Sun et al. 2005.
Although, the sign is consistent with the economic intuition of inverse relationship between price
and quantity demanded, the insignificant effect suggests that the price does not have much effect
in license sales. There might be few possible reasons behind this. First, the hunting involves a lot
of logistic and trip related costs, compared to which the price of a license worth very less to
hunters. Assuming this to be true, the state agencies might have potential to increase their
revenue for nature conservation by raising the license price reasonably. However, it needs a
cautious interpretation, as the variable is proxy. Second, this price is fixed at state level rather
than counties; the proxy used might not have much variation in price itself among the states. In
addition, unlike other commodities where market determines the price, the state agencies control
the license price and also there is not a perfect substitute of hunting adventure, buyers might
have very little influence on its equilibrium price. Purchasing license from neighboring state
would not make them better off sine they will be charged the non-resident fee in those states.
Our result also indicates that the hunting clubs can be effective institutions for retaining
and promoting hunting activities. The counties with higher number of hunting club were found to
have higher demand of license. The casual intuition behind it is that these clubs might offer more
companions and organized trips in the counties. Increasing either price or the quantity can
increase the revenue. State agencies might have long-term benefit by increasing the quantity,
which also ensures the sustainability of hunting business. For this, state agencies could plough
back a small portion of license revenue in promoting such clubs in the counties to increase
hunters and license demand both. We also found the availability of ancillary outdoor attractions
such as sports and amusement parks to have positive effect on hunting license demand. Since, all

14
of those recreations are outdoor activities like hunting, cultural fabric of such recreations in
counties might motivate people to jointly organize hunting trips with other activities.
Conclusion
Since, the hunting is beneficial for generating operating budget of conservation agencies
and maintaining the optimum population of wildlife species, noticed decline in sale of hunting
license has been a matter of concern in recent days. Unlike other commodities, price of hunting
permits are fixed by state agencies and consumers have little or not control on it. Understanding
what determines the demand of hunting license is important to project demand for license and
shooting game population. This paper developed an economic framework for analysis demand of
hunting license among resident hunters in US south counties. The proposed model could be used
in analyzing the effect of any particular sociodemogrpahic or economic attribute on the license
demand in further researches. Particularly, this model can serve as pioneer model for predicting
hunting demand of some specific license types or animals. Agencies could use this model to
compare the hunter’s response to alternative license combinations for eg; individual license vs.
combo licenses.
In addition, our study provides some empirical evidence on relationship between
sociodemogrpahic factors and demand for wildlife hunting. The social and demographic factors
are the strong predictors of hunting license sales in American communities. We also draw some
policy implication relevant for state agencies in hunting promotion, revenue adjustment and new
hunters’ recruitment. As there might not be a close substitute of hunting experience, the
insignificant effect of price reveals that the resident hunters might be relatively less responsive to
slight increase in license fee. Since, the availability of public hunting ground matters much, some
incentive policy to motivate private forest landowners could provide hunters more hunting land

15
in a reasonable cost. Promoting the leasing option could be an alternative. Furthermore, the
issues like decreasing license sales and low adoption of hunting activity by young generation
could be better addressed by promoting institutional mechanisms such as hunting clubs, and
adopting some policy instruments to encourage younger people to join hunting (eg; awareness,
campaign, fairs and recruitment programs). Assuming that the hunters are less responsive to
price of license itself, a reasonable increase in fee could raise revenue, a part of which could be
ploughed back to recruit younger hunters, promote hunting clubs and encourage the lease
hunting in non-industrial private forests.

16
References:
Anderson, M. W., S. D. Reiling, G. K. Criner. “Consumer Demand Theory and Wildlife Agency Revenue Structure.” Wildlife Society Bulletin 13 (1985): 375-84.
Bissell, S. T., M. D. Duda and K. C. Young. “Recent Studies on Hunting and Fishing Participation in the United States.” Human Dimensions of Wildlife 3: 1 (1988): 75-80.
Brown, T. L. and N. A. Connelly. “Predicting Demand for Big Game and Small Game Hunting Licenses: The New York Experiences”. Wildlife Society Bulletin 22: 2 (1994): 172-178.
Floyd, M. F. and I. Lee. “Who Buys Fishing and Hunting Licenses in Texas? Results from a Statewide Household Survey”. Human Dimensions of Wildlife 7 (2002): 91-106.
Greene, W. H. Econometric Analysis. Fifth Edition. Pearson Education Inc. 2003.Heberlein, T. and E. Thomson. “Changes in US Hunting Participation, 1980-90”. Human
Dimensions of Wildlife 1: 1 (1996): 85-86.International Association of Fish and Wildlife Agencies (IAFWA). “Economic Importance of
Hunting in America”. 2002. Available online at http://georgiawildlife.dnr.state.ga.us/assets/documents/Hunting%20Economic%20Impact%202001.pdf
Mehmood, S.; D. Zhang; and J. Armostrong. “Factors Associated With Declining Hunting License Sales in Alabama”. Human Dimensions of Wildlife 8 (2003): 243-62.
Miller, J. R., and M. J. Hay. “Determinants of Hunter Participation: Duck Hunting in the Missisippi Flyway”. American Journal of Agriculture Economics, 63 (4) 1981: 677-84.
Shaw, J. Introduction to Wildlife Management. McGraw-Hill Science. First Edition (1985).Sun, L., G. Cornelis Van Kooten, and G. M. Voss. “Demand for Wildlife Hunting in British
Columbia.” Canadian Journal of Agricultural Economics 53 (2005): 25-46.Teisl, M. F., K. J. Boyle, and R. E. Record. “Licenses Sales Revenues: Understanding angler and
hunters reactions to changes in price changes.” Human Dimension of Wildlife 4 (1999): 1-17.
Walsh, R. G., K. H. John, J. R. McKean and J. H. Hof. “Effect of Price on Forecasts of Participation in Fish and Wildlife Recreation: An Aggregate Demand Model.” Journal of Leisure Research 24: 2 (1992): 140-56.
Ziemer, R. F., W. N. Musser, and R. C. Hill. “Recreation Demand Equations: Functional Form and Consumer Surplus.” American Journal of Agricultural Economics 62: 1(1980): 136-41.

17
Table 1. Definition of VariablesVariable DescriptionDemographic and economic VariablesPersonal income Average Personal income of the county residents Employment Percentage of people in the county holding full time job positionsLow education People with less than 9 year of schooling as a percentage of county
populationCollege graduate College graduates as a percentage of county population Population (16-34) Percentage of county population between 16 and 34 yearsPopulation (35-65) Percentage of county population between 35 and 65 yearsChildren but no wife Households with underage children but no wife as a percentage of county
totalWhite White population as a percentage of county total
Ecological VariablesPublic forest Land under public forest type as a percentage of county areaPastureland Land under pasture cover type as a percentage of county areaWetland Area under wetland cover type as a percentage of county area
Institutional and Other Attraction VariablesHunting clubs Number of hunting clubs in the countyFishing camps Number of fishing camps in the countyAmusement Number of ancillary amusement and sports park
Other VariablesPrice Proxy Per hunter capita expenditure on license fee in the state. (Revenue from
resident license sale divided by total number of resident hunters of that year)
Metro Dummy variables, if county is in metropolitan area 1, otherwise 0

18
Table 2. Descriptive StatisticsVariables Mean Standard
DeviationMinimum Maximum
Demographic and economic VariablesPersonal income (in thousands dollar)
1774.715 6068.661 4.188 12800.000
Employment 43.709 6.975 22.610 71.640Low education 7.338 3.381 0 22.380College graduate 12.203 4.957 4.420 40.370Population (16-34) 21.975 3.986 4.480 47.660Population (35-65) 38.661 2.969 25.240 59.700Children but no wife 3.152 1.008 0 10.140White 77.981 16.886 13.960 99.290
Ecological VariablesPublic forest 0.700 1.845 0 23.830Pastureland 13.216 12.743 0 71.810Wetland 7.408 11.593 0 65.530
Institutional and Other Attraction VariablesHunting clubs 0.026 0.171 0 2Fishing camps 0.018 0.155 0 2Amusement 0.163 1.090 0 24
Other VariablesPrice proxy 13.763 2.922 9.115 18.541Metro 0.271 0.444 0 1

19
Table 3: GLS Estimation of ParametersVariables Coefficient VIF`Intercept -4.542***
(0.606)---
Demographic and economic Variablesln(Personal income) 0.830***
(0.022)2.872
Employment -0.013***(0.003)
1.691
Low education 0.034***(0.007)
2.270
College graduate -0.036***(0.006)
2.878
Population (16-34) 0.010(0.006)
1.924
Population (35-65) 0.021**(0.008)
2.008
Children but no wife -0.054***(0.019)
1.165
White 0.014***(0.001)
1.783
Ecological VariablesPublic forest 0.024*
(0.013)1.042
Pastureland 0.007***(0.001)
1.259
Wetland 0.008***(0.001)
1.488
Institutional and Other Attraction VariablesHunting clubs 0.205**
(0.091)1.049
Fishing camps 0.029(0.117)
1.013
Amusement 0.015**(0.006)
1.156
Other Variablesln(Price proxy) -0.053
(0.101)1.147
Metro -0.202***(0.055)
1.988
Adj. R- Square 0.72

20
Number of Observations 1066Note: ***, ** and * indicates the statistical significant of parameter at 1%, 5% and 10% level respectively. The numbers in parenthesis are the standard errors. ` Variables with VIF values exceeding 20 can induce the multi-collinearity.