
Determinants of Cartel Duration Margaret Levenstein Valerie Suslow
33
1 Determinants of Determinants of Cartel Duration Cartel Duration Margaret Levenstein Margaret Levenstein Valerie Valerie Suslow Suslow ESRC Centre for Competition Policy University of East Anglia June 2009
-
Upload
octavius-roberts -
Category
Documents
-
view
21 -
download
0
description
Determinants of Cartel Duration Margaret Levenstein Valerie Suslow. ESRC Centre for Competition Policy University of East Anglia June 2009. AGENDA. Sample of Contemporary International Cartels Determinants of Cartel Duration Economic Theory Empirical Results. - PowerPoint PPT Presentation
Transcript of Determinants of Cartel Duration Margaret Levenstein Valerie Suslow

1
Determinants of Cartel Determinants of Cartel DurationDuration
Margaret LevensteinMargaret Levenstein Valerie Suslow Valerie Suslow
ESRC Centre for Competition Policy University of East Anglia
June 2009

2
AGENDAAGENDA
• Sample of Contemporary International Cartels
• Determinants of Cartel Duration
–Economic Theory
–Empirical Results

3
• 1930s: – 30 to 40% of world trade controlled by international cartels
• 1950s through 1980s: Don’t ask, don’t tell– “we didn’t have any evidence that international cartels
continued to be a problem” (Klein, 1999) • 1990s: Vigorous extraterritorial application of U.S. antitrust
law– Mark Whitacre and ADM lead DOJ to revise Corporate
Leniency Policy » Amnesty from all U.S. criminal penalties automatically
granted to first firm to confess (if no pre-existing investigation). EU changed to automatic amnesty in 2002.
» Amnesty Plus Program: Substantial reduction in penalties by admitting to cartel practices in other markets that are not being investigated.
International Cartel PrevalenceInternational Cartel Prevalence

4
Sample Criteria1. involve more than one producer2. include producers from more than one
country3. attempt to set prices or divide markets4. convicted by US or EU in 1990s or 2000s
• Yields a sample of 81 cartels for which we have been able to collect cartel and market characteristics.Sample selection bias: Are only the fragile
or careless cartels caught?
Cross-Section SampleCross-Section Sample

5
Who Colludes?Who Colludes?• Answer #1: Everyone, but it varies by time and
place» Previous studies: industry composition reflects legal
and institutional environment, extent of market integration, and sample selection criteria
» This sample: primarily sophisticated manufactured goods and services
• Answer #2: Firms in highly concentrated industries
» Average C4 in our sample is 80%» Mean # firms = 7.1 and Median = 5
• Maximum # firms = 35, but of the 12 cartels with more than 10 members, 10 of these involved a trade association

6
Cartel DurationCartel Duration• On average, cartels in our sample last 8 years
0
2
4
6
8
10
12
1 2 3 4 5 6 7 8 9 10 11 12 13 14 16 17 18 19 21 22 23 29
Cartel Duration (Years)
Nu
mb
er
of
Car
tels

7
Basic Theory of Cartel DurationBasic Theory of Cartel Duration• In a market with identical price-setting firms, infinitely
repeated interaction among these firms, and perfect information, collusion can be sustained if
collusive (monopoly) price charged by firm i in period tprice charged by firm i if it chooses to defectprice charged by firm i in continuation equilibrium after defection
, , ,0 ,0 , ,0 1
( , ) ( , ) ( , )t i M M i D M t i C Ci t i t i i i t i t
t t
p p p p p p
• Permanent collusion can be an equilibrium if firms are Permanent collusion can be an equilibrium if firms are sufficiently patient and if the difference between the profits sufficiently patient and if the difference between the profits earned while colluding and the profits earned after a firm earned while colluding and the profits earned after a firm cheats is sufficiently highcheats is sufficiently high

8
Basic Theory of Cartel DurationBasic Theory of Cartel Duration• So, what can this model tell us about how long an So, what can this model tell us about how long an
existing cartel will last?existing cartel will last?• Some theories of cartel behavior have tried to answer this
question by considering equilibria in which collusion does last, but in which firm behavior fluctuates. These behavioral fluctuations are often observationally equivalent to cartel breakup.
• We also consider the possibility that, while firms expect this inequality to hold when a cartel is formed, the constraint is violated by future unanticipated shocks.
• Must distinguish between those that broke up because– They fell apart– They got caught

9
• Hypothesis: Cartel organization matters to cartel duration. – Successful cartels develop mechanisms to
prevent and punish defection without expensive price wars.
» Rarely included in cross-sections. Several case studies provide rich detail, e.g., Genesove and Mullin (2001), Spar (1994), Baker and Faulkner (1993)
Determinants of Cartel DurationDeterminants of Cartel Duration
10
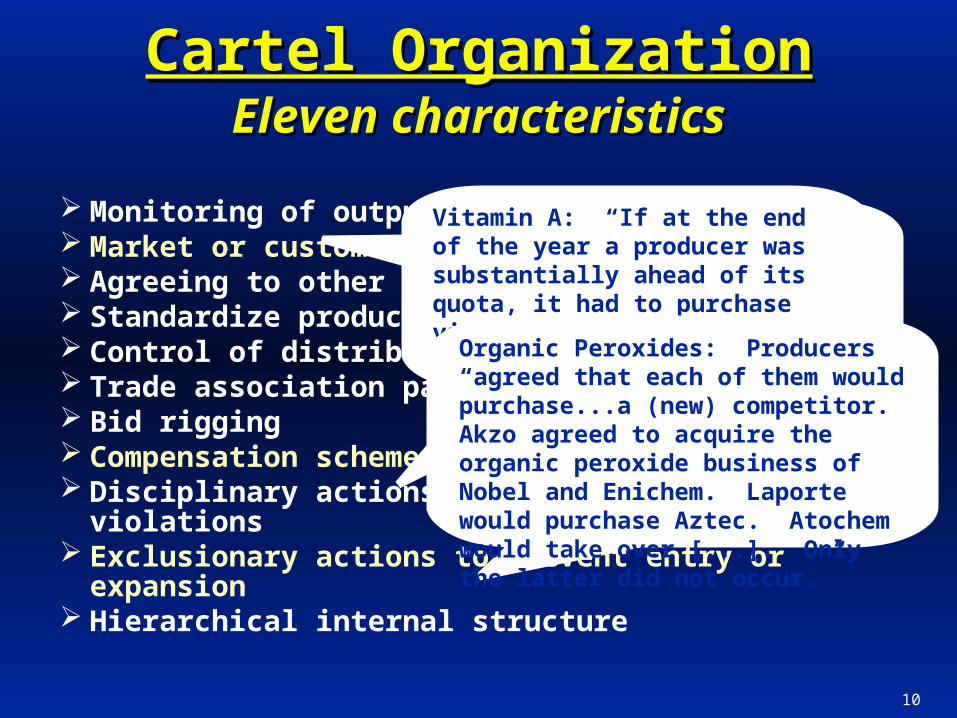
Monitoring of output and pricing Market or customer allocation Agreeing to other terms & conditions of sale Standardize product characteristics or quality Control of distribution Trade association participation Bid rigging Compensation scheme for exceeding cartel quotas Disciplinary actions in response to cartel violations Exclusionary actions to prevent entry or expansion Hierarchical internal structure
Cartel OrganizationCartel OrganizationEleven characteristicsEleven characteristics
Vitamin B2: Hoffman-LaRoche monitored Japanese government export data knowing that there
was only one cartel member, Takeda, producing in that
geographic location.
Vitamin A: “If at the end of the year a producer was substantially ahead of its quota, it had to purchase vitamins from the others in order to compensate them for the corresponding shortfall in their allocation.”Organic Peroxides: Producers “agreed
that each of them would purchase...a (new) competitor. Akzo agreed to acquire the organic peroxide business of Nobel and Enichem. Laporte would purchase Aztec. Atochem would take over [...]. Only the latter did not occur.”

11
• Discount rate
• External shocks
– Demand variability
– Exchange rate variability
• Industry structure
– Number of firms
– Industry concentration
Other Determinants of Cartel DurationOther Determinants of Cartel Duration

12
Variable Definitions & Descriptive StatisticsVariable Definitions & Descriptive StatisticsN = 81N = 81
Variable Min Max Mean StdDev
MEMNUM 2 35 7.1 5.9
MINC4 24 100 74.8 18.4
BIDRIGORG 0 1 0.24 0.43
MKTALLOCORG 0 1 0.80 0.40
STDIZEORG 0 1 0.08 0.27
OTHERTERMSORG 0 1 0.45 0.50
DISTNORG 0 1 0.15 0.36
TAORG 0 1 0.31 0.47
continued...

13
Variable Definitions & Descriptive StatisticsVariable Definitions & Descriptive Statistics
Variable Min Max Mean StdDev
MONITORORG 0 1 0.79 0.41
DISCIPLINORG 0 1 0.19 0.39
COMPENSORG 0 1 0.33 0.47
EXCLUSORG 0 1 0.36 0.48
HIERARCHORG 0 1 0.43 0.50

14
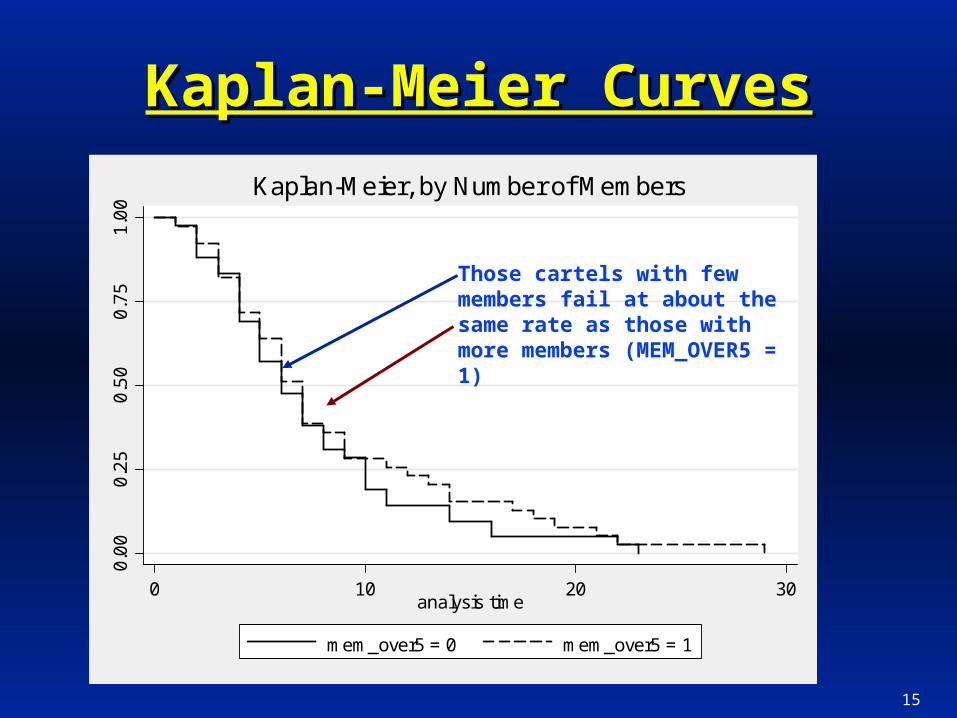
Kaplan-Meier CurvesKaplan-Meier CurvesNonparametric: probability of failure after time tNonparametric: probability of failure after time t
Shows basic shape of raw survival dataShows basic shape of raw survival data0.
00
0.2
50.
50
0.7
51.
00
0 10 20 30analysis time
Kaplan-Meier Survival Probability, Entire Sample
15
Kaplan-Meier CurvesKaplan-Meier Curves0.
00
0.2
50.
50
0.7
51.
00
0 10 20 30analysis time
mem_over5 = 0 mem_over5 = 1
Kaplan-Meier, by Number of Members
Those cartels with few members fail at about the same rate as those with more members (MEM_OVER5 = 1)

16
Kaplan-Meier CurvesKaplan-Meier Curves0
.00
0.2
50
.50
0.7
51
.00
0 10 20 30analysis time
org_over3 = 0 org_over3 = 1
Kaplan-Meier, by Organizational Index
Those cartels with few organizational mechanisms fail more quickly than those with more sophisticated organization (ORGINDX > 3)

17
Kaplan-Meier CurvesKaplan-Meier Curves0.
00
0.2
50.
50
0.7
51.
00
0 10 20 30analysis time
taorg = 0 taorg = 1
Kaplan-Meier, by Trade Association Involvement

18
Kaplan-Meier CurvesKaplan-Meier Curves0.
00
0.2
50.
50
0.7
51.
00
0 10 20 30analysis time
discinplinorg = 0 discinplinorg = 1
Kaplan-Meier, by Cheaters Disciplined

19
Kaplan-Meier CurvesKaplan-Meier Curves0.
00
0.2
50.
50
0.7
51.
00
0 10 20 30analysis time
compensorg = 0 compensorg = 1
Kaplan-Meier, by Compensation System

20
Kaplan-Meier CurvesKaplan-Meier Curves0.
00
0.2
50.
50
0.7
51.
00
0 10 20 30analysis time
exclusorg = 0 exclusorg = 1
Kaplan-Meier, by Exclusionary Action Against Non-members

21
Kaplan-Meier CurvesKaplan-Meier Curves0.
00
0.2
50.
50
0.7
51.
00
0 10 20 30analysis time
mktallocorg = 0 mktallocorg = 1
Kaplan-Meier, by Markets Allocated

22
Kaplan-Meier CurvesKaplan-Meier Curves0.
00
0.2
50.
50
0.7
51.
00
0 10 20 30analysis time
Death by Antitrust Death by ConfessionOther Death
Kaplan-Meier, by Cause of Death
Those cartels that break up on their own fail more quickly than either those ended by antitrust investigation or those ended by confession.

23
Competing Hazards ModelCompeting Hazards ModelDeath by Anti-trustDeath by Anti-trust
Variable Hazard Ratio
Whitacre 7.56**Number Members 1.08 Market Allocation 0.12**Trade Association 2.05**Punishments Implemented
0.58**
Producer C4 1.01High Customer Concentration
1.17
Coefficient > 1 indicates that the variable increased the probability of cartel breakup. Coefficient < 1 indicates that the variable decreased the probability of breakup.

24
Competing Hazards ModelCompeting Hazards Model“Natural Death” Organizational Effects“Natural Death” Organizational Effects
Variable Hazard Ratio
Whitacre 4.43**Number Members 0.95Trade Association 0.21**Punishments Implemented
3.94**
Compensation plan 0.16**Exclusive tactics 2.14*

25
Competing Hazards ModelCompeting Hazards Model“Natural Death” Industry Structure Non-effects“Natural Death” Industry Structure Non-effects
Variable Hazard Ratio Hazard Ratio
Whitacre 2.06** 4.07**
Number Members 0.98 0.95
Trade Association 0.20** 0.23**
Punishments Implemented 2.47* 3.21*
Compensation plan 0.15** 0.17**
Exclusive tactics 1.81* 2.08*
Producer C4 1.00
High consumer concentration
0.41

26
Variable Hazard Ratio
Whitacre 2.82 ** Number Members 0.93Trade Association 0.23 ** Punishments Implemented
3.43*
Compensation plan 0.17 ** Exclusive tactics 2.35*Interest coverage 3.30 ** T-bill 0.96
Competing Hazards ModelCompeting Hazards Model“Natural Death” Discount rate effects“Natural Death” Discount rate effects

27
Variable Hazard Ratio Hazard Ratio
Whitacre 2.68 ** 2.24 ** Number Members 0.93 0.91Trade Association 0.24 ** 0.24 ** Punishments Implemented 3.42 * 3.25 *Compensation plan 0.17 ** 0.15 ** Exclusive tactics 2.41 * 2.98**
GDP change 1.14
HP Gap 1.003**
Competing Hazards ModelCompeting Hazards Model“Natural Death” Macroeconomic shocks“Natural Death” Macroeconomic shocks
28
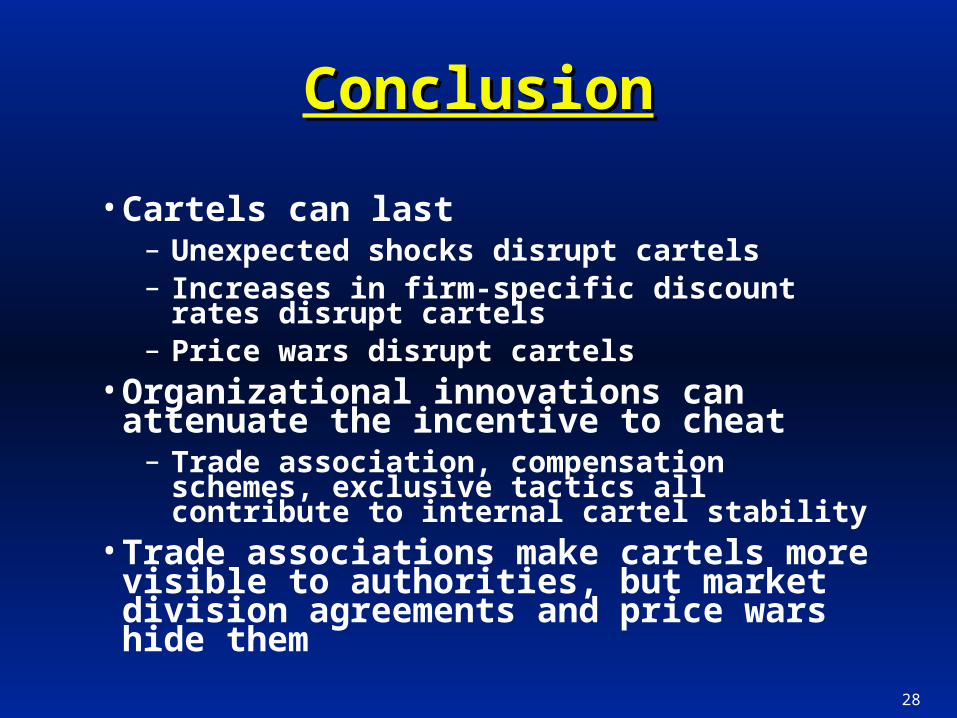
• Cartels can last– Unexpected shocks disrupt cartels– Increases in firm-specific discount rates disrupt
cartels– Price wars disrupt cartels
• Organizational innovations can attenuate the incentive to cheat
– Trade association, compensation schemes, exclusive tactics all contribute to internal cartel stability
• Trade associations make cartels more visible to authorities, but market division agreements and price wars hide them
ConclusionConclusion

29
Comparison of Cartel OrganizationComparison of Cartel Organization
Contemp. Intl.
Cartels
Hay & Kelley
Fraas & Greer
Posner Gallo et al
Mean # firms 7.1 7.3 16.7 29.1 3.9
Median # firms 5 7 8 6 – 10
< 10 firms 81% 79% 60% 64%
Trade Association 31% 29% 36% 44% 23%
Bid Rigging 23% 29% 19% 14% 30%
Market Allocation 80% 35% 26% 26% 27%
Other Terms Set 44% 14% 5% 14%
Disciplinary or Exclusionary Actions
43% 5% 12%
Monitoring 80%

30
Cartel DurationCartel DurationComparison of StudiesComparison of Studies
Contemp. Intl.
Cartels (N=72; intl, 1971-2002, convicted
after 1990)
Eckbo (N=51;
intl, 1819-1964)
Griffin (N=54;
intl, 1888-1984)
Suslow (N=71;
intl, 1920-1939)
Posner (N=1551;US, 1890-
1969)
Gallo (N=1348;US, 1955-
1997)
Mean (yrs)
8.1 5.3 7.3 8.3 7.5 5.4
Std Dev 5.8 6.3 6.2
Range 1-29 1-18 1-29 1-13
% 5 yrs 30% 40%
% 10 yrs
23% 37%

31
INDUSTRY DURATION INDUSTRY DURATION
(years) (years)Aluminum Phosphide 1 Paper, Carbonless 3Bromine 3 Plastic Dinnerware 1Cable-stayed Bridges 1 Polyester Staple 3Carbon Cathode Block 2 Rubber Chemicals 7Cartonboard 5 Shipping, Cent. W. African 21Cement 11 Sodium Erythorbate 3Citric Acid 4 Sodium Gluconate 9Explosives 5 Sorbates 17Ferrosilicon 2 Stamp Auctions 22Fine Arts 6 Stainless Steel 1Graphite Electrodes 5 Steel Beam 6 Graphite, Isostatic 9 Steel Heating Pipe 4Laminated Plastic Tubes 9 Steel Tube, Seamless 5 Lysine 3 Tampico Fiber 5Memory Chips 4 Thermal Fax Paper 1Methionine 11 Vitamins 9Methylglucamine 10 Zinc Phosphate 4
Examples of Cases in our SampleExamples of Cases in our Sample

32
Sectoral CompositionSectoral Composition
Sector Percent
Chemicals 39.51
Metal and Minerals 16.05
Non-manufacturing 19.75
Other Manufacturing 24.69

33
Cause of Breakup Number Average Duration (years)
Government-Initiated Breakup Triggered By:
Amnesty application 17 10.29
Follow-on investigation 13 8.77
Customer complaint 7 4.00
Other sources (including whistleblowers) 29 8.17
Other Breakup
Cheating 6 7.67
Growing fringe 7 6.43
Unknown Cause of Breakup 2 4.50
Total 81 8.07