Determinants of Business Taxpayers’ Return Filing ...
18
Determinants of Business Taxpayers’ Return Filing Compliance: An Empirical Study of Malaysian Firms Saw Sor Tin School of Graduate Studies, Asia e University, Malaysia, E-mail: [email protected] A B S T R A C T The purpose of this study is twofold. It investigates the relationship between business taxpayers’ return filing compliance (TRFC) and three important variables: taxable sales, tax penalty, and licensing experience. It also seeks to present new insight into the association between licensing experience and TRFC. The study sample consists of 150 business firms with service tax adjustment. Data are sourced from tax audit reports and a supporting database over the period of 2010 to 2012. The hypotheses are tested using multiple regression and ANOVA analysis. The results show that taxable sales and licensing experience are positively related to TRFC, whereas proportional penalty is significantly negative. There is a significant difference among the tax experience groups. The highest mean of tax returns is reached at 12 15 years of experience. The findings of this paper indicate that business TRFC is likely to improve with higher penalties and longer tax experience. Some taxpayers who file returns regularly and ‘on time’ may fail to file correct taxable sales. The study contributes to knowledge of tax research and would ultimately assist tax administration to enhance taxpayers’ filing compliance and audit planning. 1. INTRODUCTION Taxable persons or business entities are required to be licensed (or registered) and file accurate tax returns in accordance with their respective country’s tax laws and regulations. In order to ensure the correct amount of tax is declared or reported in the returns and all taxes due are paid, revenue authorities need to conduct tax audit. Selecting tax returns based on predetermined criteria can be computer generated using software application, and/ or performed manually through explicit knowledge, work experience and expertise in riskbased audits. Generally, important issues or inconsistent items on tax returns could trigger an audit. In the case of the US Internal Revenue Service (IRS), the audit triggers for small businesses are: (i) business owners with high cash income; (ii) filing returns with International Journal of Auditing and Accounting Studies Volume 3; Number 1; 2021 : pp. 23-40 A R T I C L E I N F O Received: 1 January 2021 Revised: 5&12 March 2021 Accepted: 15 March 2021 Online: 19 April 2021 Keywords: Filingcompliance, licensing experience, penalty, sales JEL Code: H32; K42; M4. ARF INDIA Academic Open Access Publishing www.arfjournals.com
Transcript of Determinants of Business Taxpayers’ Return Filing ...
Determinants of Business Taxpayers’ Return FilingCompliance: An Empirical Study of Malaysian Firms
Saw Sor Tin
School of Graduate Studies, Asia e University, Malaysia, E-mail: [email protected]
A B S T R A C T
The purpose of this study is twofold. It investigates therelationship between business taxpayers’ return filingcompliance (TRFC) and three important variables: taxable sales,tax penalty, and licensing experience. It also seeks to presentnew insight into the association between licensing experienceand TRFC. The study sample consists of 150 business firms withservice tax adjustment. Data are sourced from tax audit reportsand a supporting database over the period of 2010 to 2012. Thehypotheses are tested using multiple regression and ANOVAanalysis. The results show that taxable sales and licensingexperience are positively related to TRFC, whereas proportionalpenalty is significantly negative. There is a significant differenceamong the tax experience groups. The highest mean of taxreturns is reached at 12 15 years of experience. The findings ofthis paper indicate that business TRFC is likely to improve withhigher penalties and longer tax experience. Some taxpayers whofile returns regularly and ‘on time’ may fail to file correct taxablesales. The study contributes to knowledge of tax research andwould ultimately assist tax administration to enhance taxpayers’filing compliance and audit planning.
1. INTRODUCTION
Taxable persons or business entities are required to be licensed (orregistered) and file accurate tax returns in accordance with their respectivecountry’s tax laws and regulations. In order to ensure the correct amountof tax is declared or reported in the returns and all taxes due are paid,revenue authorities need to conduct tax audit. Selecting tax returns basedon predetermined criteria can be computer generated using softwareapplication, and/ or performed manually through explicit knowledge, workexperience and expertise in riskbased audits. Generally, important issuesor inconsistent items on tax returns could trigger an audit. In the case ofthe US Internal Revenue Service (IRS), the audit triggers for small businessesare: (i) business owners with high cash income; (ii) filing returns with
International Journal of Auditing and Accounting StudiesVolume 3; Number 1; 2021 : pp. 23-40
A R T I C L E I N F O
Received: 1 January 2021
Revised: 5&12 March 2021
Accepted: 15 March 2021
Online: 19 April 2021
Keywords:Filingcompliance,licensing experience,penalty, sales
JEL Code:H32; K42; M4.
ARF INDIAAcademic Open Access Publishingwww.arfjournals.com
24 Saw Sor Tin
mathematical errors; (iii) returns with several claims or deductions; (iv)filing incomplete returns or nonfiling; and (v) huge increases or decreasesin profit from year to year (Americans for Community Cooperation inOther Nations (ACCION), 2020). In general, the IRS targets for field auditare: (i) taxpayers with abusive issues related to offshore accounts orinternational issues, had audit rate at 5.2% in 2017; (ii) businesses with specificdomestic abusive transactions and tax shelter activity; (iii) taxpayers withearnings of more than $1,000,000 a year, had audit rate at 4.4% ; (iv) cashbusiness, online sales or cryptocurrency; (v) fraud or illegal income cases;(vi) computer selected based on taxpayer’s DIF (Discriminant Function)scores, had audit rates at 12%; and lastly (vii) ongoing legacy projects (USTIGTA Department of the Treasury, 2019, p.2, cited Buttonow, 2019).
As far as we know, most empirical research conducted were related tovarious demographic, cultural, behavioural, regulatory, and economicfactors of tax evasion (Kirchler, 2007; Dell’Anno, 2009; Khlif & Achek, 2015).However, there seems to be a lack of research into the key variables affectingbusiness taxpayers’ return filing (TRF) compliance. Although there are afew economic or demographic characteristics that can affect business TRFcompliance, nevertheless this research will focus on exploring three majorcharacteristics of business TRF compliance for assessing risk of filingnoncompliance as well as underreporting of taxable sales on tax return.Moreover, existing research in Malaysia are mostly related to direct taxes,particularly income tax; whilst there are not many indirect tax compliancestudies on business firms or service tax collection agents.
Since year 2003, IRS had been using tax returns data for research andselection of mediumhigh risk cases for audit examination. In 2018, the IRSrate of collection had been reported in TAS (Taxpayer Advocate Service)2018 Annual Report as dependent on both the type of audit conducted andthe outcome of the examination (Erard et al., 2018, p.79). Similarly, taxauthority in Malaysia has also used tax return data (with particular attentionto nil returns) for audit examination; however there have been few researchstudies carried out using tax return data or actual audit data. Therefore, itis important to examine the determinants of business taxpayers’ returnfiling compliance and understand how it could help improve audit selectioneffectiveness and efficiency. To ensure the best data analysis, data qualityand accurate findings in the study, audit data are utilised and verified by asupporting database to avoid errors and maintain data accuracy. Hence,this study will contribute to the knowledge on business TRFC, assistresearchers close the gap and, ultimately help tax administration to enhancefiling compliance and strategic audit planning.
Determinants of Business Taxpayers’ Return Filing Compliance 25
The purpose of this study is twofold. It investigates the relationshipbetween business taxpayers’ return filing compliance (TRFC) and threeimportant variables taxable sales, tax penalty, and licensing experience,and proceeds to further analyse and better understand the relationshipbetween licensing experience and business TRFC. It in fact seeks to presentnew insight into the influence of licensing experience on TRFC.
2. HYPOTHESIS DEVELOPMENT AND LITERATURE
2.1. Hypothesis development
In 1972, Allingham and Sandmo developed a model of tax evasion basedon four main economic factors: tax rate, audit probability, income, andpenalty. The model explained how much income the taxpayer would reportand evade. If evasion is not detected by tax authority, the net income of thetaxpayer (Y) would be
Y = W t (WE) = (1t) W + tE
Whereby W denotes the taxpayer’s gross income; t is the tax rate; E isthe amount of underreporting or evaded amount; and the reported incomeis WE.
On the contrary, if evasion is detected by tax authority, he will pay apenalty rate of tax on the evaded amount, such that the net income of thetaxpayer (Z) would be
Z = (1t) W + t(E) ?E = (1t) W – (? t) E
Therefore, any increase in either penalty rate or probability of detectionmay reduce the Z net income of the rational expected utility maximizerand tend to deter evasion.
Further development of this neoclassical model or paradigm has shownthat: (i) as the tax rate increases, the income evaded decreases, if penalty isimposed on the evaded tax (Yitzhaki, 1974); (ii) an increase in tax rate mayreduce compliance rate, only if taxpayers can determine their desired levelof compliance (Lin & Yang, 2001); (iii) a lower tax rate is not likely to reducebusiness tax evasion (NurTegin, 2008); and (iv) higher tax rates wouldencourage compliance assuming that higher tax rates lead to higher penaltypayments (on evaded tax) at the initial optimum when caught(Gahramanov, 2009).
Several additional studies have found that: (i) the compliance rate willincrease if taxpayers are informed of audit certainty and amount ofunreported income (Alm & McKee, 2006); (ii) behaviour predictions are
26 Saw Sor Tin
obtainable using the tax compliance demand curve i.e., a graphicalrepresentation of the optimum condition (Yaniv, 2009); (iii) the taxpayerdecisions (to evade or comply) are affected by the time and average burdenfrom all kinds of taxes (Dalamagas, 2011); and (iv) tax uncertainty seemslikely to have a greater influence on business decision in developingcountries than in other member countries (OECD, 2019).
In this study, the original model of basic tax evasion (Allingham & Sandmo,1972) is chosen as the framework and basis for understanding the phenomenonof: (a) what are the variables influencing business taxpayers’ return filingcompliance level; (b) why people comply or do not comply with tax laws andregulations; and (c) how to improve taxpayer filing compliance.
2.2. TRFC studies using tax return data or audit data
A brief review of previous tax compliance studies on determinants of taxreturn filing compliance (TRFC) that utilised tax return data is as follows.Using county and state level data on nonfiling rates for the tax year 2000that is obtained directly from Internal Revenue Service (IRS), Alm et al.(2016) examined the role of socioeconomic diversity on tax complianceand they found that (a) nonfiling is increasing with heterogeneity by race;(b) nonfiling is decreasing with heterogeneity by religious membership;(c) nonfiling rates tend to fall with the enforcement index. In particular,Small and Brown (2019) revealed that when enforcement (of taxpayerservices) is relatively weak, there is null ‘filing and payment compliance’effect for the corporate income tax; but when such enforcement is relativelystronger, there is positive effect for the general consumption tax. Similarly,Santoro and Mdluli (2019) used Eswatini administrative data for the period2013 2017 to analyse nil returns and they estimated that (a) nil filing risesto 40% per year in certain specific sectors such as construction, ICT andservices; (b) nil filing is more common for SMEs (30%) than large firms(57%); (c) nil filing is more frequent in newly registered firms (46%) thanolder firms (26%); and lastly (d) the percentage of nil returns per year i.e.submitted over the 5year period is as high as 29%.
In addition, a brief outline of the related studies using audit data is asfollows. Using past Internal Revenue Service (IRS) operational audits upto 2002 and appeal data merged with confidential tax return data from the‘Voluntary Compliance Baseline Management’, Hanlon et al. (2007)examined the extent and nature of corporate tax noncompliance. In general,they found that foreign controlled firms have a smaller deficiency thantheir domestic counterpart; larger firms were more compliant; and thatmultinational firms have a greater tax deficiency than nonmultinational
Determinants of Business Taxpayers’ Return Filing Compliance 27
firms. They also found there is no relation between governance qualityand the proposed deficiency; and there is little evidence that lower effectivetax rates are related to deficiencies.
2.3. Related studies on the determinants of TRFC
Indeed, there seems to be a lack of research into the direct relationshipbetween ‘taxable sales or income, tax penalty, licensing experience’ andbusiness taxpayers’ return filing compliance (which could be consideredas proxy for tax noncompliance). This could be due to the confidentialityof tax returns and return information such as audits, appeals, and any effortto collect unpaid ‘back taxes’.
Early studies of tax compliance have found that an increase in theprobability of audit or audit rate have resulted in significantly higher levelsof taxable income being reported (Coltfelter, 1983; Dublin & Wilde, 1988;Beck et al., 1991). Different level of income may also affect tax noncompliance as taxpayers may feel it is acceptable to underreport smallamount of income (Worsham, 1996). Tax evasion increases with income(Giese & Hoffman, 1999). In a later study using IRS data for the tax year2001, it was found that for reported income adjusted for underreporting,the ratio of aggregated misreported income to true income generallyincreases with income while the ratio of underreported tax to true tax ishighest for lowerincome taxpayers (Johns & Slemrod, 2010).
Brink and White (2015) conducted an experiment using 147 taxpayers withaudit experience and found that shared interest in tax savings and penaltiesreduce the subjects’ voluntary decision to evade taxes. Besides, a persistentregret salience from an unfavourable audit also decreases tax evasionbehaviour. Choo et al. (2016) found that higher fines increase compliance.
It has long been known that licensing experience is associated withworking experience, knowledge, information, human mistakes, taking risksand learning things1. Nkwe (2013) examined small businesses in Botswanaand found that the number of years of working experience in the sameoccupation does influence the taxpayers’ compliance level of paying taxes.As to whether, the business firm would pay taxes correctly or not, thismay depend on its costbenefit analysis, social norms, or other influences.AwunyoVitor and Mbawuni (2015) utilised survey data from a sample of244 retail traders in Ghana to examine the determinants of the VAT FlatRate Scheme (VFRS) compliance. The regression results showed thateducation level, ‘years of experience’ as the business owner, and knowledgeof penalty for noncompliance significantly influence taxpayers’ decisionto comply with the law.
28 Saw Sor Tin
Finally, an economic and political explanation for business tax return filingcompliance is proposed by referring to the Expected Utility Theory (since the1940’s) and Rawl’s Ideal Theory (1999). In brief, the Expected Utility (EU) theoryassumes that individuals are EU maximizers. They may be riskneutral,riskaverse or riskseeking having utility functions that are linear (with constantmarginal utility), concave (with diminishing marginal utility) or convex (withincreasing marginal utility) respectively. Whereas Ideal theory assumes thereis full compliance with ideal moral principles under favourable circumstancessuch as economic, social, political and historical conditions.
3. METHODOLOGY
The sample consists of 150 Malaysian business firms that were audited inyear 2012 and have ‘tax dues’ over the period of 2010 to 2012. This samplesize is larger than 30, hence 150 can be regarded as an appropriate samplesize for research (Sekaran, 2003). Data are obtained from accounts inspectionreports completed in 2012 on the 20102012 tax returns and crosscheckedfor accuracy by using database information. The statistical analysis isperformed using IBM SPSS. Descriptive statistics are used to describe thetax return data; and a simple graphics analysis is added to explain thelicensing experience (LE) variable compliance curve. The hypotheses aretested using multiple linear regression (MLR) and ANOVA analysis.
Although the data are about 8 to 10 years old, however, it is still relevantfor explaining or predicting current business behaviour due to the followingreasons: (i) there are no other database2 available to support this research,that is to verify or crosscheck the audited data for accuracy; (ii) quantitativedata quality is good for generating reliable results; (iii) taxpayers arebasically rational expected utility maximizers, thus their motivation to payor evade tax is dependent on tax rate and maximum penalty rate whichdid not change much over the time tax rate on services3 has been fixed at6 percent from 2011 to 2020, and maximum failuretopay penalty rate hasbeen fixed at 40 to 50 percent.
3.1. Explanation of data and variables
There are two types of data: direct type and interfaced data used in thestudy. The interfaced data are chosen to estimate the filing compliancefunction, depending on the type of model and the statistical methods usedin the analysis. It is derived from multiplication and addition of two sets ofdata from reports and tax returns source. A new value for a specific variableis computed based on a common criterion, basis or a point of referencethat have the same dimension (e.g., audit period) and according to theprescribed formula or calculation method. The computed variable is then
Determinants of Business Taxpayers’ Return Filing Compliance 29
used in this research to overcome data analysis problem such asmulticollinearity and homoscedascity issues (Saw, 2016).
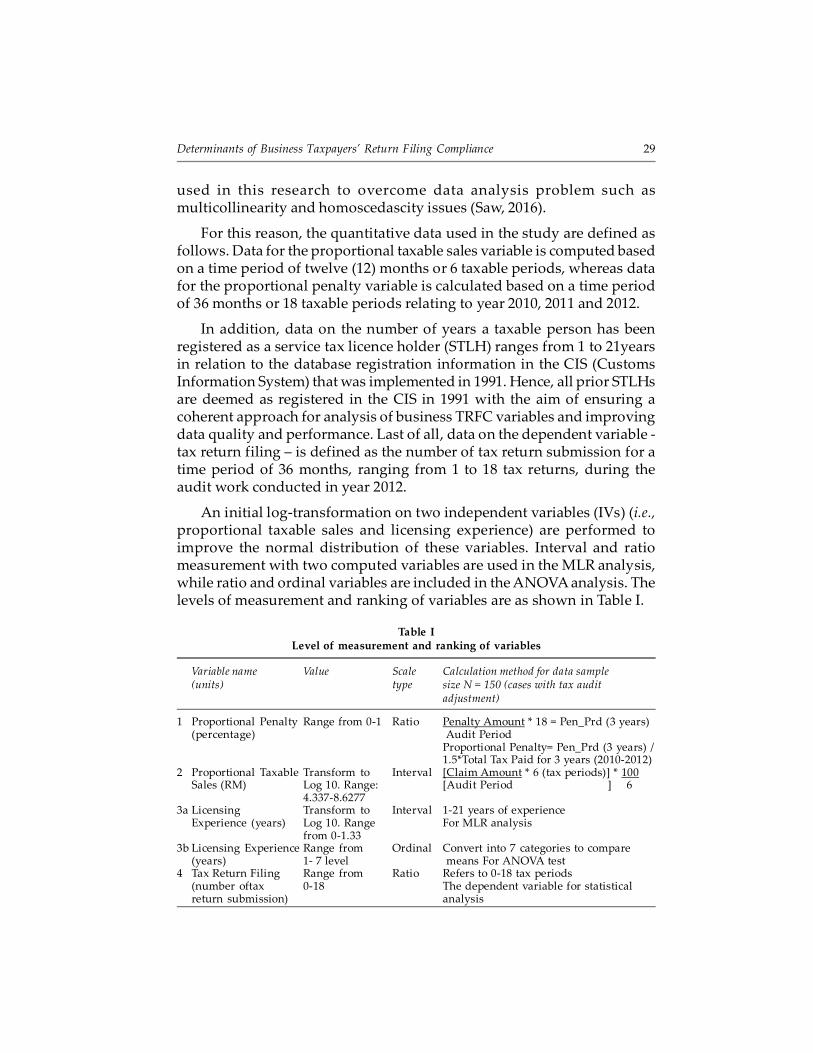
For this reason, the quantitative data used in the study are defined asfollows. Data for the proportional taxable sales variable is computed basedon a time period of twelve (12) months or 6 taxable periods, whereas datafor the proportional penalty variable is calculated based on a time periodof 36 months or 18 taxable periods relating to year 2010, 2011 and 2012.
In addition, data on the number of years a taxable person has beenregistered as a service tax licence holder (STLH) ranges from 1 to 21yearsin relation to the database registration information in the CIS (CustomsInformation System) that was implemented in 1991. Hence, all prior STLHsare deemed as registered in the CIS in 1991 with the aim of ensuring acoherent approach for analysis of business TRFC variables and improvingdata quality and performance. Last of all, data on the dependent variable tax return filing – is defined as the number of tax return submission for atime period of 36 months, ranging from 1 to 18 tax returns, during theaudit work conducted in year 2012.
An initial logtransformation on two independent variables (IVs) (i.e.,proportional taxable sales and licensing experience) are performed toimprove the normal distribution of these variables. Interval and ratiomeasurement with two computed variables are used in the MLR analysis,while ratio and ordinal variables are included in the ANOVA analysis. Thelevels of measurement and ranking of variables are as shown in Table I.
Table ILevel of measurement and ranking of variables
Variable name Value Scale Calculation method for data sample(units) type size N = 150 (cases with tax audit
adjustment)
1 Proportional Penalty Range from 01 Ratio Penalty Amount * 18 = Pen_Prd (3 years)(percentage) Audit Period
Proportional Penalty= Pen_Prd (3 years) /1.5*Total Tax Paid for 3 years (20102012)
2 Proportional Taxable Transform to Interval [Claim Amount * 6 (tax periods)] * 100Sales (RM) Log 10. Range: [Audit Period ] 6
4.3378.62773a Licensing Transform to Interval 121 years of experience
Experience (years) Log 10. Range For MLR analysisfrom 01.33
3b Licensing Experience Range from Ordinal Convert into 7 categories to compare(years) 1 7 level means For ANOVA test
4 Tax Return Filing Range from Ratio Refers to 018 tax periods(number oftax 018 The dependent variable for statisticalreturn submission) analysis
30 Saw Sor Tin
Using Daniel Soper’s Apriori sample size calculator for MLR, theanticipated effect size is 0.80 (large) with 3 predictors when probabilitylevel is 0.01, power level is excellent (0.999) at a minimum required samplesize of 55. It is thus highly possible to obtain the highest statistical powerlevel in this MLR analysis.
3.2. Multiple regression analysis
The multiple regression analysis is first conducted to examine the influenceof the three explanatory variables on tax return filing compliance. Both theindependent and dependent variables are of interval and ratio scalerespectively and all variables are normally distributed.
The research model4 consists of three (3) observed independent variablei.e., proportional taxable sales (hereinafter referred to as ‘taxable sales’),proportional penalty, and licensing experience. The dependent variable istax return filing compliance (TRFC). Therefore, the hypothesis isconstructed as follows:
H1: There is a significant relationship between “Proportional penalty,
Taxable sales, Licensing experience” and TRF compliance.
The multiple regression equation used is:
TRFC = b0 + b
1 Penalty + b
2 Tax sales + b
3 Lic experience
Where b1, b
2, and b
3 are the coefficients for each variable and b
0 is the
constant.
3.3. Analysis of variance (ANOVA)
The second statistical method ANOVA is performed to test differencesbetween groups in TR filing compliance behaviour. The licensing experiencevariable has been converted into a categorical or ranked, ordinal scalevariable that works best for ANOVA analysis. The test result is then usedto describe in more depth the relationship between licensing experienceand TRF compliance. The second hypothesis is thus constructed as follows:
H2: There is a significant difference among the licensing experience
groups in TRF compliance.
The posthoc Tukey HSD test is then performed to analyse the differencefurther.
3.4. Descriptive analysis
Statistical description provides useful summaries and helps to find patternsin the data, while inference helps to identify meaningful patterns and make
Determinants of Business Taxpayers’ Return Filing Compliance 31
prediction. Hence, a table and a mean plot graph are presented to explainon the business firm’s filing compliance tendency in terms of ‘years ofexperience’.
4. RESULTS AND ANALYSIS
4.1. Descriptive analysis
Prior to the efiling, tax returns for audits could be selected based on boththe number of returns filed by the business firms and nil returns. To give abetter understanding of this issue, descriptive statistics are used to analyseand interpret the data of two main variables.
Firstly, the tax return filing data reveal that 13.3% of the auditedtaxpayers with ‘notice of deficiency’ do not submit tax returns; howeverthere are not much percentage differences among these audited taxpayerswho have submitted 3 to 15 returns for the past three years prior to year2012; whilst about 40% of them have submitted ‘1618 returns’5.This infersthat it would be of high priority to audit the taxpayers who have uptodate tax return submission to authority, but at the same time, have filed niltax returns even though business operations is ongoing or active. On theother hand, the reasons for irregular filing of returns may possibly be dueto business closure, dormant company status, employee’s negligence, ormere human errors, irrespective of whether the act of failure to pay wasintentional or not. Generally, it is essential to highlight further some otherimportant issues on filing noncompliance in planning an audit, so as toensure that auditors can focus on areas of higher risk and perform theiraudits efficiently.
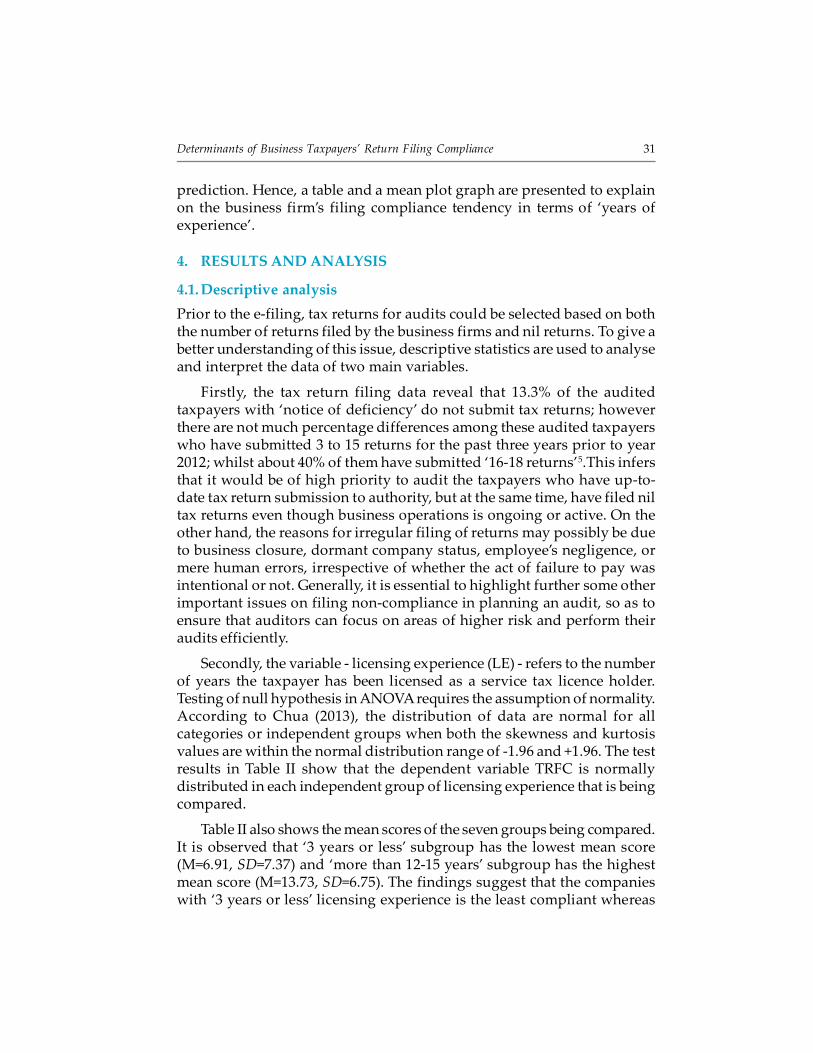
Secondly, the variable licensing experience (LE) refers to the numberof years the taxpayer has been licensed as a service tax licence holder.Testing of null hypothesis in ANOVA requires the assumption of normality.According to Chua (2013), the distribution of data are normal for allcategories or independent groups when both the skewness and kurtosisvalues are within the normal distribution range of 1.96 and +1.96. The testresults in Table II show that the dependent variable TRFC is normallydistributed in each independent group of licensing experience that is beingcompared.
Table II also shows the mean scores of the seven groups being compared.It is observed that ‘3 years or less’ subgroup has the lowest mean score(M=6.91, SD=7.37) and ‘more than 1215 years’ subgroup has the highestmean score (M=13.73, SD=6.75). The findings suggest that the companieswith ‘3 years or less’ licensing experience is the least compliant whereas
32 Saw Sor Tin
Table IILicensing experience and Tax return filing compliance
Licensing experience group N Mean Std. Skewness Kurtosisdeviation
3 years or less 22 6.91 7.37 0.61 1.39
More than 36 years 51 9.90 6.64 0.19 1.31
More than 69 years 16 10.94 7.15 0.24 1.90
More than 912 years 30 11.40 6.46 0.54 1.26
More than 1215 years 11 13.73 6.75 1.15 0.72
More than 1518 years 6 13.17 7.11 1.32 0.42
More than 1821 years 14 13.50 6.76 1.11 0.55
Total 150 10.62 6.97 0.29 1.53
*Statistically significant at 0.05 level
the companies with ‘more than 1215 years’ licensing experience is the mostcompliant among the seven LE subgroups.
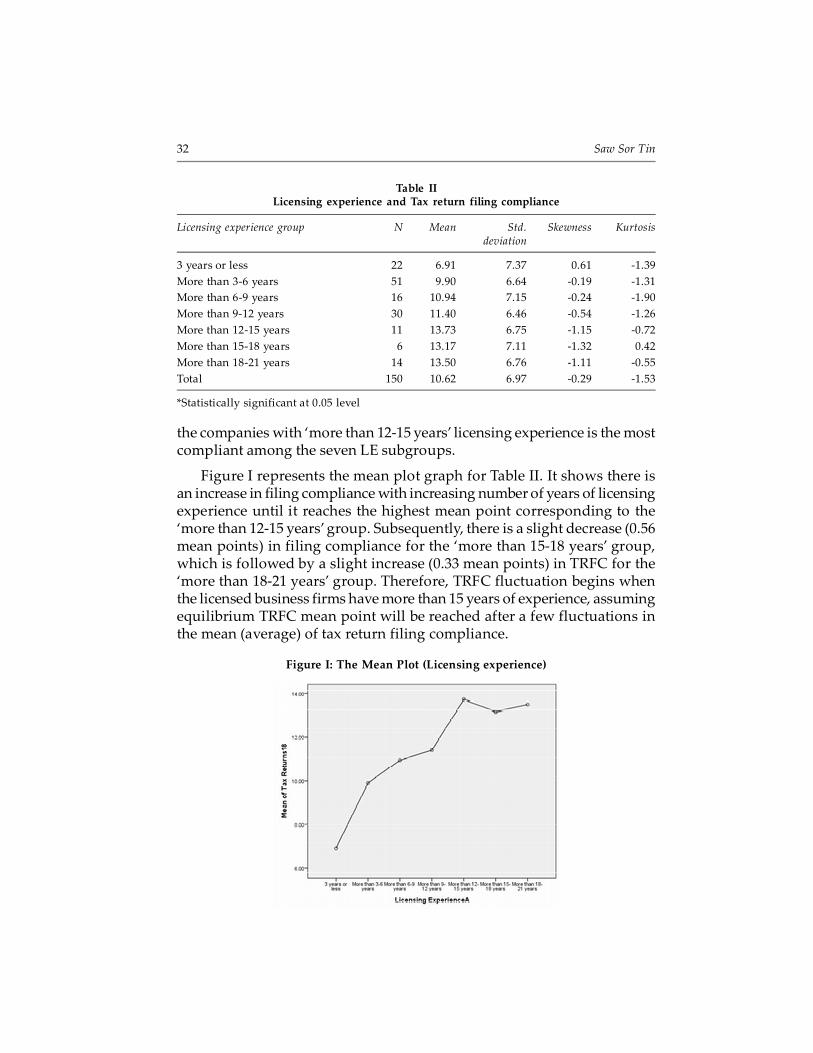
Figure I represents the mean plot graph for Table II. It shows there isan increase in filing compliance with increasing number of years of licensingexperience until it reaches the highest mean point corresponding to the‘more than 1215 years’ group. Subsequently, there is a slight decrease (0.56mean points) in filing compliance for the ‘more than 1518 years’ group,which is followed by a slight increase (0.33 mean points) in TRFC for the‘more than 1821 years’ group. Therefore, TRFC fluctuation begins whenthe licensed business firms have more than 15 years of experience, assumingequilibrium TRFC mean point will be reached after a few fluctuations inthe mean (average) of tax return filing compliance.
Figure I: The Mean Plot (Licensing experience)
Determinants of Business Taxpayers’ Return Filing Compliance 33
This infers that audits on newly registered service tax payers are equallyimportant to monitor and enforce filing and tax compliance behaviour.Further to this, audits on highly experienced business taxpayers shouldfocus on identifying areas of high deficiencies either due to tax avoidanceor other highrisk factors relevant to the audit, so as to minimise revenueloss and curb tax evasion.
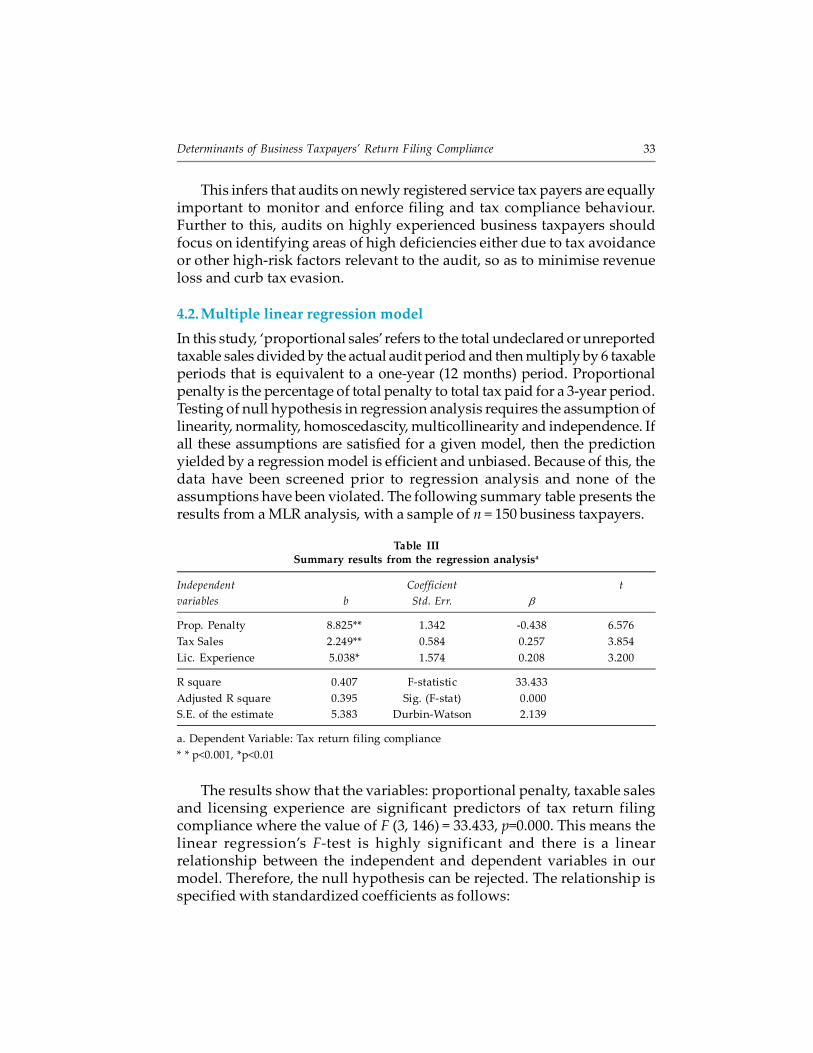
4.2. Multiple linear regression model
In this study, ‘proportional sales’ refers to the total undeclared or unreportedtaxable sales divided by the actual audit period and then multiply by 6 taxableperiods that is equivalent to a oneyear (12 months) period. Proportionalpenalty is the percentage of total penalty to total tax paid for a 3year period.Testing of null hypothesis in regression analysis requires the assumption oflinearity, normality, homoscedascity, multicollinearity and independence. Ifall these assumptions are satisfied for a given model, then the predictionyielded by a regression model is efficient and unbiased. Because of this, thedata have been screened prior to regression analysis and none of theassumptions have been violated. The following summary table presents theresults from a MLR analysis, with a sample of n = 150 business taxpayers.
Table IIISummary results from the regression analysisa
Independent Coefficient t
variables b Std. Err. �
Prop. Penalty 8.825** 1.342 0.438 6.576
Tax Sales 2.249** 0.584 0.257 3.854
Lic. Experience 5.038* 1.574 0.208 3.200
R square 0.407 Fstatistic 33.433
Adjusted R square 0.395 Sig. (Fstat) 0.000
S.E. of the estimate 5.383 DurbinWatson 2.139
a. Dependent Variable: Tax return filing compliance
* * p<0.001, *p<0.01
The results show that the variables: proportional penalty, taxable salesand licensing experience are significant predictors of tax return filingcompliance where the value of F (3, 146) = 33.433, p=0.000. This means thelinear regression’s Ftest is highly significant and there is a linearrelationship between the independent and dependent variables in ourmodel. Therefore, the null hypothesis can be rejected. The relationship isspecified with standardized coefficients as follows:
34 Saw Sor Tin
TRFC = 0 – 0.438(Penalty) + 0.257(Tax Sales) + 0.208(Lic Experience)
Taxable sales and licensing experience were found to be significantlypositively associated with tax return filing (TRF) compliance, whereaspenalty is significantly negative.
The adjusted R square of the model is 0.395, and the R2 is equal to 0.407;this means the linear regression explains 40.7 per cent of the variance inthe data. Using Cohen’s ƒ2 effect size measure for multiple regressions, theeffect size for this MLR model is large (since it is higher than 0.35) and it iscalculated as follows:
22
2
0.407 0.4070.686
1 1 0.407 0.593R
fR
where R2 is the squared multiple correlation
The DurbinWatson d = 2.139, which is between the two critical valuesof 1.5 <d < 2.5 and therefore it is assumed that there is no linearautocorrection in the multiple linear regression data. The magnitude ofthe t statistics provides a mean to judge relative importance of theindependent variable. In this case, proportional penalty (t = 6.576) is themost significant variable, followed by taxable sales (t = 3.8254) and licensingexperience (t = 3.200).
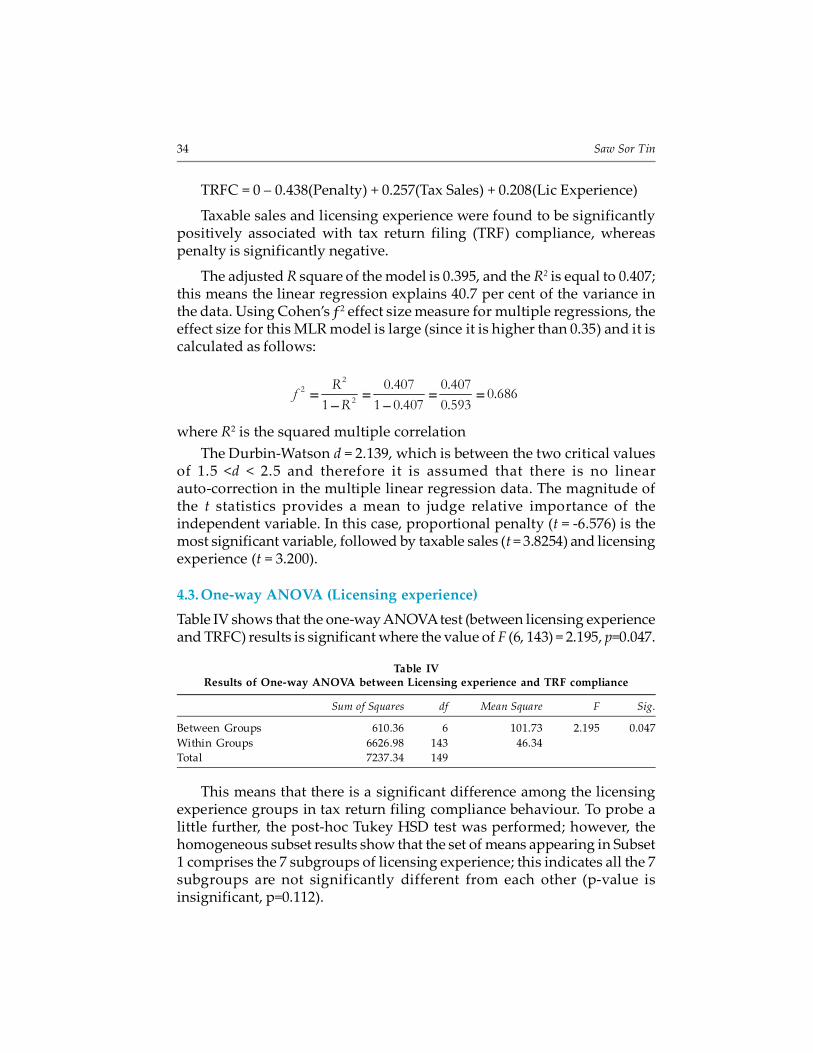
4.3. Oneway ANOVA (Licensing experience)
Table IV shows that the oneway ANOVA test (between licensing experienceand TRFC) results is significant where the value of F (6, 143) = 2.195, p=0.047.
Table IVResults of Oneway ANOVA between Licensing experience and TRF compliance
Sum of Squares df Mean Square F Sig.
Between Groups 610.36 6 101.73 2.195 0.047
Within Groups 6626.98 143 46.34
Total 7237.34 149
This means that there is a significant difference among the licensingexperience groups in tax return filing compliance behaviour. To probe alittle further, the posthoc Tukey HSD test was performed; however, thehomogeneous subset results show that the set of means appearing in Subset1 comprises the 7 subgroups of licensing experience; this indicates all the 7subgroups are not significantly different from each other (pvalue isinsignificant, p=0.112).
Determinants of Business Taxpayers’ Return Filing Compliance 35
5. DISCUSSION AND CONCLUSION
In this paper, two theories are used to explain business tax return filingcompliance. Ideal theory as established by John Rawl (1999) who believedin justice as fairness, “assumes strict or full compliance by all relevant agentsin a wellordered society under favourable circumstances”. On the contrary,nonideal theory corresponds to partial compliance where conditions arenot as perfect as assumed in ideal theory. In a realistic situation, tax evasion,fraud, or noncompliance may occur due to partial compliance (especiallyon filing true returns and paying taxes correctly) by taxpayers (or agents)who are acting unfairly in an unjust society.
On the other hand, the Expected Utility Theory (EUT) “assumes thatindividuals may be riskneutral, riskaverse or riskseeking, who ismotivated by utility maximization”.
The AllinghamSandmo model of tax evasion explained how muchincome the taxpayer would report and evade, based on four main economicfactors: tax rate, audit probability, income, and penalty. If business firmsseek profitmaximisation options to pay the minimum amount of tax i.e.,legally possible or pay less than the actual amount due when taxable salesand level of experience is high; then the motivation to comply with filingand payment requirements would be low and taxable sales declared wouldbe lower. In contrast, firms may perceive that a certain tax avoidancepractice would not provide the highest utility value or satisfaction anddecide to pay the correct amount of taxes, when audit probability is high,penalty is high while tax rate remains the same; hence the motivation tocomply with filing and payment requirements would be high. In addition,assuming the existing social and political ‘circumstances or conditions’ areperceived as additional risk (with diminishing marginal utility), then thetaxpayer may comply fully with filing and payment requirements; therebyimproving voluntary compliance and total tax revenue from indirect taxes.
The ANOVA test results show that there is a slight fluctuation in themean scores, starting from the mean point of ‘more than 1518 years’ ofexperience. Indeed, the more experienced taxpayers should be morecompliant as they are relatively more knowledgeable about tax matters,tax audit requirements and penalties; have a better sense of moralobligation; more abiding to tax laws and regulations and financially morestable. However, a taxpayer’s filing compliance behaviour may change andadjust over time due to several reasons such as changes in economic,political, legal, social, psychological, or financial conditions. Whencircumstances are highly favourable, the fluctuations in taxreturn filingcompliance may diminish and reach a selffulfilling equilibrium level at a
36 Saw Sor Tin
favourable point of time. Supposing an equilibrium TRFC point will bereached after a few fluctuations in the mean scores, it is probably not thefull or 100% compliance scores unless all ideal circumstances and conditionsexist as stated in the Ideal Theory (Rawl, 1999).
To sum up, the results show that taxable sales and licensing experience(LE) are positively related to TRFC, whereas proportional penalty issignificantly negative. There is a significant difference among the LE groups.On the whole, the findings of this paper indicate that business TRFC islikely to improve with higher penalties and longer tax experience. Sometaxpayers who file returns regularly and ‘on time’ may fail to file accurateand correct taxable sales.
At the country level, tax authority may take the initiative to enhancetaxpayer compliance through tax education, awareness or collaborationprogrammes by: (i) helping taxpayers to solve tax issues more effectivelyand at minimum cost; (ii) understanding taxpayer behaviour in responseto existing tax system and collection procedures and recommendingappropriate methods and procedures to resolve the mechanical, technicalor operational issues; (iii) ensuring or enforcing true declaration of taxreturn and full payment of tax declared and payable; and lastly (iv)conducting lowcost research to resolve relevant, current or controversialtax issues.
Further research is suggested to establish a model with highercoefficient of variation for greater accuracy and wider analysis. Futureresearch could analyse complex prediction model that can successfullyimprove audit outcomes and tax compliance. However, it may be too costlyor not feasible for some countries to use big data analytics, predictivealgorithms, or pattern recognition algorithms to detect fraud or to identifypotential tax offenders, due to data privacy, infrastructure, or other pertinentissues.
Last but not least, in line with emerging trends in managing taxcompliance risks, governments and authorities have started to developaudit policies that create sustainable taxpayer compliance, not justtemporary compliance after the tax audit process. Continuous compliance,however, can only be seen a few years or more after the policies have beencarried out.
Acknowledgements
The author would like to thank the Royal Malaysian Customs Department forcontinuous support of this research study. The author would also like to thank the
Determinants of Business Taxpayers’ Return Filing Compliance 37
School of Graduate Studies, Asia e University, KL and University of Malaya KL Libraryfor their assistance during the course of this research.
Notes
1. The supporting wise quotes on ‘experience and knowledge’ are as follows. Theonly source of knowledge is experience (Albert Einstein); experience is simply thename we give our mistakes (Oscar Wilde); be brave, take risks, nothing cansubstitute experience (Paulo Coelho); experience is the teacher of all things (JuliusCaesar); it is costly wisdom that is bought by experience (Roger Ascham); andinformation’s pretty thin stiff unless mixed with experience (Clarence Day).
2. The Customs Information System (CIS) was replaced by: (i) the myGST (TAP &GenTax) system with effect from 1 April 2015; and (ii) the mySST system witheffect from 1 September 2018.
3. Service tax was first introduced on 1st March 1975. It is an ad valorem tax.
4. see Appendix I for legal notes on the variables.
5. Calculation for the number of returns submitted by those ‘with less than 3 yearsold service tax licence’ is based on a prorata basis. For example, if a company hasbeen licensed for 2 years and has submitted 8 returns, then the prorata rate ofreturns submission for 3 years will be 8/12 *18= 12 returns. This will fall under the‘1012 returns’ category.
References
Allingham, M.G., & Sandmo, A., (1972). Income tax evasion: A theoretical analysis.
Journal of Public Economics, 1(34), pp. 323338.
Americans for Community Cooperation in Other Nations (ACCION) (2010). Availableat: https://us.accion.org/resource/top10irsaudittriggersandwhatdoif audited/(Accessed 17 May 2020).
Alms, J., & McKee, M., (2006). Audit certainty, audit productivity, and taxpayercompliance. National Tax Journal, 59(4), pp. 801816.
alms, J., Clark, J., & Leibel, K., (2016). Enforcement, socioeconomic diversity, and taxfiling compliance in the United States, Southern Economic Journal, SouthernEconomic Association, 82(3), pp. 725747.
AwunyoVitor, D. & Mbawuni, J., (2015). Drivers of value added tax flat rate schemecompliance by traders in Kumasi Metropolis, Ghana. IUP Journal of AccountingResearch & Audit Practices, 14(2), 29.
Beck, P. J., Davis, J. S. & Jung, W., (1991). Experimental evidence on taxpayer reportingunder uncertainty. The Accounting Review, 66(3), pp. 535558.
Brink, W. D., & White, R. A., (2015). The effects of a shared interest and regret salienceon tax evasion. Journal of The American Taxation Association, 37(2), pp. 109135.
Buttonow, J., (2019). IRS office and field audit priority areas, IRS Mind, viewed 16 May2020, https://www.irsmind.com/audits/irsofficeandfieldauditpriorityareas/
Choo, C.L., Fonseca, M.A. & Myles, G.D., (2016). Do students behave like real taxpayersin the lab? Evidence from a real effort tax compliance experiment. Journal of EconomicBehavior & Organization, 124, pp.102114.
38 Saw Sor Tin
Chua Y.P., (2013). Mastering Research Statistics. Malaysia, Selangor: McGraw HillEducation (M) Sdn. Bhd., p. 123, p. 219.
Clotfelter, C. T., (1983). Tax evasion and tax rates: An analysis of individual returns.Review of Economics and Statistics, 65(3), pp. 363373.
Cohen, J., (1988). Statistical power analysis for the behavioral sciences. Routledge. ISBN978 1134742707.
Dalamagas, B., (2011). A dynamic approach to tax evasion. Public Finance Review, 39(2),pp. 309326.
Davis, J. A., (1971). Elementary survey analysis. Englewood Cliffs, NJ: Prentice–Hall.
Dublin, J. A., & Wilde, L. L., (1988). An empirical analysis of federal income tax auditingand compliance. National Tax Journal, 41(1), pp. 6174.
Dell’Anno, R., (2009). Tax evasion, tax morale and policy maker ’s effectiveness. TheJournal of SocioEconomics, 38(6), pp. 988997.
Erard, B., Kasper, M., Kirchler, E., & Olsen, J., (2018). What influence co IRS auditshave on taxpayer attitudes and perceptions? Evidence from a national survey. InNational Taxpayer Advocate Annual Report (NTAAR) to Congress, 2, pp.77130.
Gahramanov, E., (2009). The theoretical analysis of income tax evasion revisited.Economic Issues, 14(1). pp. 3542
Giese, S., & Hoffmann, A., (2000). Tax evasion and risky investments in an intertemporalcontext: An experimental study (No. 2000, 30). Discussion Papers, InterdisciplinaryResearch Project 373: Quantification and Simulation of Economic Processes.
Hanlon, M., Mills, L., & Slemrod, J., (2007). An empirical examination of big businesstax noncompliance in taxing corporate income in the 21st Century.
Johns, A., & Slemrod, J., (2010). The distribution of income tax noncompliance. NationalTax Journal, 63(3), pp. 397418.
Khlif, H., & Achek, I., (2015). The determinants of tax evasion: a literature review.International Journal of Law and Management, 57(5), pp. 486497.
Kirchler, E., (2007). The economic psychology of tax behaviour. Cambridge University Press.
Lin, W.Z., & Yang, C.C., (2001). A dynamic portfolio choice model of tax evasion:Comparative statics of tax rates and its implication for economic growth. Journal ofEconomic Dynamics and Control, 25(11), pp. 18271840.
Nkwe, N., (2013). Tax payers’ attitude and compliance behavior among Small MediumEnterprises (SMEs) in Botswana. Business and Management Horizons, 1(1), pp. 113137.
NurTegin, K.D., (2008). Determinants of business tax compliance. The BE Journal ofEconomic Analysis & Policy, 8(1), pp. 128.
OECD., (2019). Tax morale: What drives people and business to pay tax? The Organizationfor Economic Cooperation and Development Publishing, Paris.
Rawl, J., (1999). A Theory of Justice: Revised Edition. Cambridge: The Belknap Press ofHarvard University Press, 1999, p. 216.
Santoro, F., & Mdluli, W. , (2019). Nil Filing in Eswatini: Should the Revenue Authoritybe Bothered? ICTD Research in Brief, Issue 44, Brighton, IDS, June.
Determinants of Business Taxpayers’ Return Filing Compliance 39
Saw, S.T., (2016). Taxpayer Compliance in Service Tax: An Indirect Compliance Study(Doctoral dissertation, Asia e University).
Sekaran, U. (2003). Research methods for business. A skill building approach (4th ed.). NewYork: John Wiley & Sons, Inc.
Service Tax Act 1975(2015). (ACT 151) and regulations and order, laws of Malaysia.Malaysia: International Law Book Services.
Small, O., & Brown, L., (2019). Taxpayer service provision and tax compliance: Evidencefor large taxpayers in Jamaica. Public Finance Review, 2020; 48(2), pp. 250277.
Soper, D.S., (2020). Apriori sample size calculator for Multiple Regression (software).Available from http://www.danielsoper.com/statcalc (Accessed January 2020).
United States. Treasury Inspector General for Tax Administration, Department of theTreasury, (2019). Improvement in return scoring and resource allocation at thestrategic level could enhance examination productivity. Available at: treasury.gov/tigta/auditreports/2019reports/201930024_oa_highlights.html (Accessed 17 May2020).
Worsham Jr, R.G., (1996). The effect of tax authority behavior on taxpayer compliance:A procedural justice approach. The Journal of the American Taxation Association, 18(2),pp. 1939.
Yaniv, G., (2009). The tax compliance demand curve: a diagrammatical approach toincome tax evasion. The Journal of Economic Education, 40(2), pp. 213224.
Yitzhaki, S., (1974). Income tax evasion: A theoretical analysis. Journal of Public Economics,3(2), pp. 201202.
40 Saw Sor Tin
APPENDIX ILegal Notes on the Independent and Dependent Variables
a. Taxable sales
Under Section 14 of the Service Tax Act (STA) 1975, the service tax chargeableshall be due either at the time when payment is received for the taxable serviceprovided to the customer by the taxable period or after a period of twelve calendarmonths from the date of the invoice for the taxable service provided. Therefore,the term ‘taxable sales’ refers to the value of sales that a business entity is requiredto charge and collect the service tax from customers and subsequently pay thecorrect service tax amount to the proper authority or tax agency.
b. Proportional penalty
Under section 16 of the STA 1975, penalty will be imposed for late payment of taxor late filing of a return. The penalty rate ranges from ten percent to a maximumof fifty percent of the tax due but unpaid by the due date of the return.
c. Licensing experience
Under section 8 of the STA 1975, every taxable person who carries on a business ofproviding taxable services is required to apply for a service tax licence to carry onsuch a business, when the registration threshold is reached. The term ‘licensingexperience’ is related to the licence period or the ‘period of ‘years’ from the effectivedate of the service tax licence.
d. Tax return filing – the dependent variable
Under section 12 of the STA 1975, every taxable person shall within 28 days afterthe end of each taxable period, submit a return in the prescribed form to theauthority and declare the aggregate amount of the proceeds received during thattaxable period.