Determinants of Agricultural and Mineral Commodity Prices Jeffrey A. Frankel, Harvard University, &...
50
Determinants Determinants of Agricultural and of Agricultural and Mineral Mineral Commodity Prices Commodity Prices Jeffrey A. Frankel, Jeffrey A. Frankel, Harvard University, & Harvard University, & Andrew K. Rose, Andrew K. Rose, University of California, Berkeley University of California, Berkeley Reserve Bank of Australia, August 2009. Reserve Bank of Australia, August 2009.
-
Upload
barrie-garrett -
Category
Documents
-
view
218 -
download
0
Transcript of Determinants of Agricultural and Mineral Commodity Prices Jeffrey A. Frankel, Harvard University, &...

Determinants Determinants of Agricultural and Mineralof Agricultural and MineralCommodity PricesCommodity Prices
Jeffrey A. Frankel,Jeffrey A. Frankel, Harvard University, &Harvard University, & Andrew K. Rose,Andrew K. Rose, University of California, BerkeleyUniversity of California, Berkeley
Reserve Bank of Australia, August 2009. Reserve Bank of Australia, August 2009.

22
Determination of Prices for Oil and Determination of Prices for Oil and Other Mineral & Agricultural Other Mineral & Agricultural CommoditiesCommodities
Predominantly microeconomic. Predominantly microeconomic. Still, difficult to ignore macroeconomic Still, difficult to ignore macroeconomic
influences sometimes.influences sometimes. Examples: many commodity prices Examples: many commodity prices
move far in same direction at the move far in same direction at the same time:same time: The decade of the 1970s. The decade of the 1970s. The decade of the 2000s.The decade of the 2000s.

33
► ► Increase in Increase in oil price oil price can can be explained by “peak oil” be explained by “peak oil” fears, a risk premium on fears, a risk premium on Gulf instability, or political Gulf instability, or political developments in Russia, developments in Russia, Nigeria or Venezuela... Nigeria or Venezuela...
► Some ► Some farm prices farm prices might be explained by might be explained by drought in Australia, drought in Australia, shortages in China, or shortages in China, or ethanol subsidies in the ethanol subsidies in the US.US.

44
But it But it Cannot be Coincidence Cannot be Coincidence that that almost all commodity prices rose almost all commodity prices rose together during much of the together during much of the decade, and peaked abruptly in decade, and peaked abruptly in mid-2008.mid-2008.
Nominal and Real Commodity Price IndicesNatural logarithms
Nominal DJ/AIG
1960 1975 1990 20083.5
4
4.5
5
5.5
Nominal Bridge/CRB
1960 1975 1990 20084.5
5
5.5
6
Real DJ/AIG
1960 1975 1990 2008-.5
0
.5
1
Real Bridge/CRB
1960 1975 1990 2008.5
1
1.5
2

Our InnovationOur Innovation
Combine Combine Macro and Micro Macro and Micro Determinants Determinants of Commodity Pricesof Commodity Prices
Hope: Get macro swings nested inside Hope: Get macro swings nested inside well-grounded micro modelwell-grounded micro model
Need Good Micro Data on Determinants Need Good Micro Data on Determinants of Individual Commoditiesof Individual Commodities
55

66
Three “Aggregate” Theories Explain Three “Aggregate” Theories Explain the Recent Rise of Commodity Pricesthe Recent Rise of Commodity Prices
1.1. Destabilizing SpeculationDestabilizing Speculation. . Storability & Homogeneity Storability & Homogeneity
=> Asset-like Speculation => Asset-like Speculation
2.2. Monetary: Monetary: Low Real Interest RatesLow Real Interest Rates Or High Expected InflationOr High Expected Inflation
3.3. Global Demand Growth.Global Demand Growth. Actual/Future Growth (China …)Actual/Future Growth (China …)

Issues Exist with All Issues Exist with All Three “Explanations”Three “Explanations”
In Theory, Speculation may be StabilizingIn Theory, Speculation may be Stabilizing
Empirical Issues with All Three TheoriesEmpirical Issues with All Three Theories
77

88
Counter-Evidence to Claims of Counter-Evidence to Claims of Destabilizing SpeculationDestabilizing Speculation
1. Futures price of oil initially lagged behind 1. Futures price of oil initially lagged behind spot price.spot price.
2. High volume of trading 2. High volume of trading ≠≠ net short position net short position
3. Commodities that lack futures markets are 3. Commodities that lack futures markets are as volatile as those that have them. as volatile as those that have them.
4. Historical efforts to ban speculative futures 4. Historical efforts to ban speculative futures markets have failed to reduce volatility. markets have failed to reduce volatility.

99
Monetary ExplanationMonetary Explanation
1.1. Some argue that high prices for oil & other Some argue that high prices for oil & other commodities in the 1970s were not exogenous, commodities in the 1970s were not exogenous, but rather a result of easy monetary policy.but rather a result of easy monetary policy.
Perhaps inflation directly raises commodity prices? Commodities Perhaps inflation directly raises commodity prices? Commodities may be an inflation hedge.may be an inflation hedge.
2.2. Conversely, a rise in US real interest rates in the Conversely, a rise in US real interest rates in the early 1980searly 1980s. . helped drive commodity prices downhelped drive commodity prices down ..
3.3. The Fed cut real interest rates sharply,2001-04, The Fed cut real interest rates sharply,2001-04, and again in 2008-09. Did this help push prices and again in 2008-09. Did this help push prices first up, then down?first up, then down?

1010
High Interest Rates in High Interest Rates in TheoryTheory
1.1. Lower inventory demand; Lower inventory demand; andand
2.2. Encourage faster pumping of oil, Encourage faster pumping of oil, mining of deposits, harvesting of crops, etc.,mining of deposits, harvesting of crops, etc., because owners can invest the proceeds at interest because owners can invest the proceeds at interest
rates higher than the return to saving the reserves.rates higher than the return to saving the reserves.
3.3. Both channels – fall in demand and rise in Both channels – fall in demand and rise in supply – work to lower commodity price.supply – work to lower commodity price.

1111
But … Counter-arguments ExistBut … Counter-arguments Exist
Inventories of oil & other commodities said to be low Inventories of oil & other commodities said to be low in 2008, contrary to the theory (Krugman, Kohn)in 2008, contrary to the theory (Krugman, Kohn)
Perhaps inventory numbersPerhaps inventory numbers do not capture all inventories, ordo not capture all inventories, or are less relevant than (larger) reserves.are less relevant than (larger) reserves.
King of Saudi Arabia (2008): King of Saudi Arabia (2008): “we might as well leave the reserves “we might as well leave the reserves in the ground for our grandchildren.”in the ground for our grandchildren.”
How Important are Monetary Effects? How Important are Monetary Effects?

1212
Global Boom Theory Global Boom Theory Reasonable?Reasonable?
Sub-prime Mortgage Crisis Sub-prime Mortgage Crisis hit US, August 2007. hit US, August 2007.
Thereafter, Growth Forecasts Fell GloballyThereafter, Growth Forecasts Fell Globally But Commodity Prices did not But Commodity Prices did not DeclineDecline; their ; their
rise actually rise actually AcceleratedAccelerated. .

Quick Peek at Aggregate Data: Quick Peek at Aggregate Data: LittleLittle
````
1313
Bivariate Macro Scatter Plots
DJ/AIG and Real Interest rateslope=-.04 (.02)
-5 0 5-.5
0
.5
1
Bridge/CRB and Real Interest rateslope=-.02 (.02)
-5 0 5.5
1
1.5
2
DJ/AIG and World GDP Growthslope=.06 (.03)
0 2 4 6 8-.5
0
.5
1
Bridge/CRB and World GDP Growthslope=.06 (.03)
0 2 4 6 8.5
1
1.5
2

But Perhaps Too Macro?But Perhaps Too Macro?
Need to Control for Micro Determinants Need to Control for Micro Determinants of Commodity Pricesof Commodity Prices
Our Objective: Our Objective: IntegrateIntegrate Micro and Macro Micro and Macro Commodity Price DeterminationCommodity Price Determination TheoryTheory Empirical EstimationEmpirical Estimation
1414

1515
““Overshooting” Theory of Overshooting” Theory of Real Commodity PricesReal Commodity Prices
ss ≡ the spot price, ≡ the spot price, S ≡ its long run equilibrium, S ≡ its long run equilibrium, p p ≡ the economy-wide price index, ≡ the economy-wide price index, q ≡ s-pq ≡ s-p, the real price of the commodity, , the real price of the commodity,
andand Q Q ≡ ≡ the long run equilibrium real price of the long run equilibrium real price of
the commodity;the commodity; all in log form. all in log form.

1616
Derive Relationship for Real Derive Relationship for Real Commodity from Two Commodity from Two Equations:Equations:
Regressive Expectations (can be Rational):Regressive Expectations (can be Rational): E (Δs) = - θ (q-Q)E (Δs) = - θ (q-Q) + + E(ΔpE(Δp))
““Arbitrage-like” condition links Inventories & Bonds:Arbitrage-like” condition links Inventories & Bonds: E Δs + c = iE Δs + c = i
where where c ≡ cy – sc – rp .c ≡ cy – sc – rp . cycy ≡ ≡ convenience yield from holding the stock (e.g., the insurance value of convenience yield from holding the stock (e.g., the insurance value of
having an assured supply of a critical input in the event of a disruption)having an assured supply of a critical input in the event of a disruption)scsc ≡≡ storage costs (e.g., rental rate on oil tanks, etc.) storage costs (e.g., rental rate on oil tanks, etc.) rp rp ≡ ≡ E Δs – (f-s) E Δs – (f-s) ≡≡ risk premium, risk premium, >0 if being long in commodities is risky, and>0 if being long in commodities is risky, andii ≡≡ the interest rate the interest rate

1717
Combining:Combining:
q - Q = - (1/q - Q = - (1/θθ) (i - E() (i - E(ΔΔpp) – c) ) – c)
This inverse relationship between q & r This inverse relationship between q & r has already been somewhat studiedhas already been somewhat studied Event studies Event studies (monetary announcements)(monetary announcements) Regressions of Regressions of q q against against rr in Frankel (2008):in Frankel (2008):
Significant for half of the individual commoditiesSignificant for half of the individual commodities and in a panel studyand in a panel study and for various aggregate commodity price indicesand for various aggregate commodity price indices
But much is left out of this equation.But much is left out of this equation. Especially variation in Especially variation in cc
1818
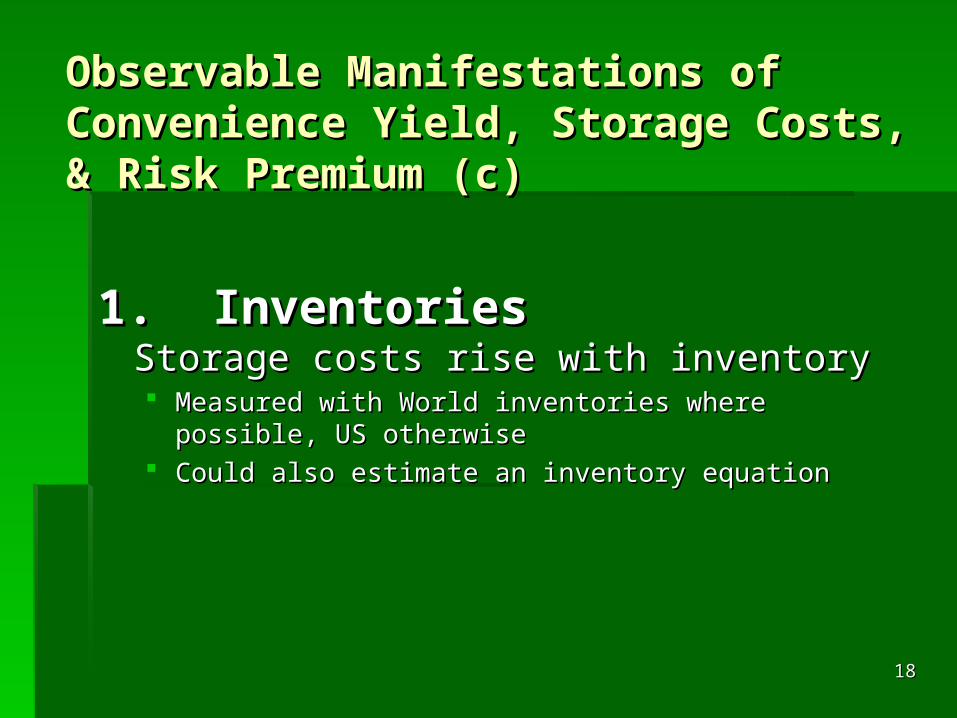
Observable Manifestations of Observable Manifestations of Convenience Yield, Storage Costs, Convenience Yield, Storage Costs, & Risk Premium (c)& Risk Premium (c)
1. Inventories1. InventoriesStorage costs rise with inventoryStorage costs rise with inventory Measured with World inventories where possible, US Measured with World inventories where possible, US
otherwiseotherwise Could also estimate an inventory equationCould also estimate an inventory equation

1919
Other DeterminantsOther Determinants
2. Real GDP2. Real GDP Transactions Demand for Inventories, Transactions Demand for Inventories,
determinant of convenience yield determinant of convenience yield cycy Measured with real World GDP, Measured with real World GDP, Also try OECD output gap, de-trend, G-7, IP …Also try OECD output gap, de-trend, G-7, IP …
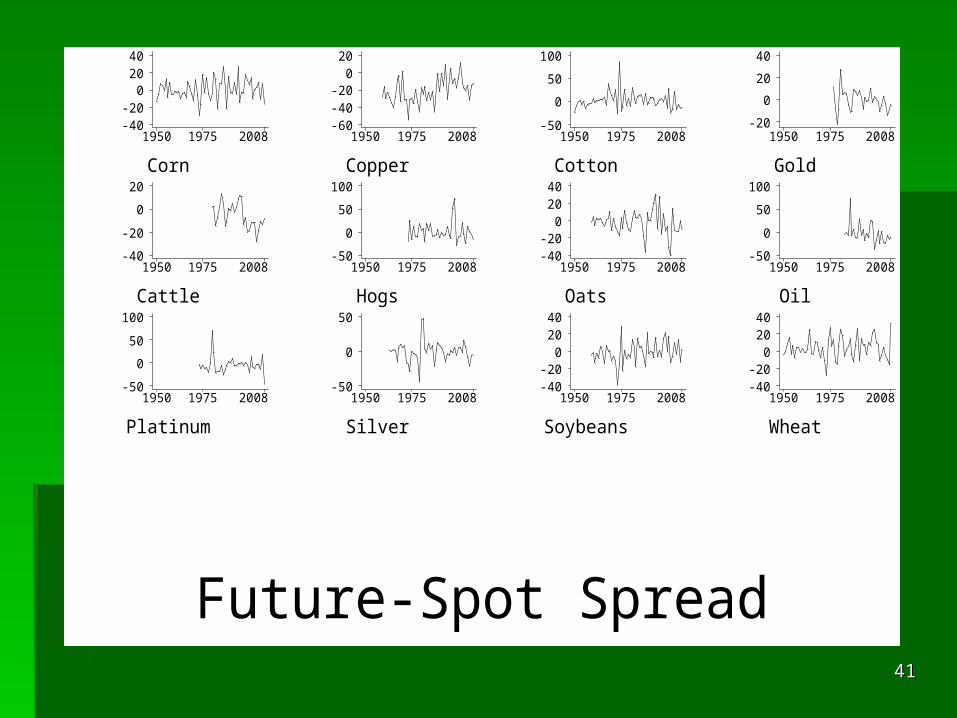
3. The spot-futures spread, 3. The spot-futures spread, s-fs-f High spread (“normal backwardation:) signifies High spread (“normal backwardation:) signifies
low speculative return, hence negative effect on low speculative return, hence negative effect on inventory demand and pricesinventory demand and prices Measurement more straightforwardMeasurement more straightforward

2020
Uncertainty MeasuresUncertainty Measures
4. Medium-term volatility4. Medium-term volatility (σ) (σ) Volatility a determinant of convenience yield, Volatility a determinant of convenience yield,
and so of commodity pricesand so of commodity prices May also be determinant of risk premiumMay also be determinant of risk premium
Measured as standard deviation of spot price Measured as standard deviation of spot price Can also extract implicit forward-looking expected Can also extract implicit forward-looking expected
volatility from options pricesvolatility from options prices

2121
5. Risk5. Risk (political, financial, & economic) (political, financial, & economic) Theoretical effect ambiguous: Theoretical effect ambiguous:
Risk a determinant of Risk a determinant of cycy (fear of (fear of
supply disruption), should havesupply disruption), should have
a a positivepositive effect on commodity prices effect on commodity prices Also a determinant of rp, riskAlso a determinant of rp, risk
premium, should have a premium, should have a negativenegative effect on prices effect on prices
Measured (e.g., for oil) by weighted average of Measured (e.g., for oil) by weighted average of (inverse) political risk for 12 top (oil) producers(inverse) political risk for 12 top (oil) producers Data availability issues; hence not always includedData availability issues; hence not always included

2222
Complete EquationComplete Equation
q = Q - (1/q = Q - (1/θθ) r ) r + + (1/ (1/θθ)) γγ(Y) + (1/(Y) + (1/θθ)Ψ )Ψ ((σσ)) - (1/ - (1/θθ) ) Φ (Φ (INVENTORIES)INVENTORIES)-δ(-δ(s-fs-f)) Objective: Determine (log) real commodity Objective: Determine (log) real commodity
priceprice 3 Micro determinants3 Micro determinants
Volatility; spread; inventoriesVolatility; spread; inventories
2 Macro determinants2 Macro determinants World GDP; real interest ratesWorld GDP; real interest rates

2323
Estimation StrategyEstimation Strategy
Gather, use dis-aggregated data on 11 Gather, use dis-aggregated data on 11 commodity panelcommodity panel Annual data from 1960s to 2008Annual data from 1960s to 2008 Commodities, span, frequency chosen to Commodities, span, frequency chosen to
maximize data availabilitymaximize data availability

2424Log Real Spot Price
Corn
1950 1975 2008-4
-3.5
-3
-2.5
Copper
1950 1975 2008-.5
0.51
1.5
Cotton
1950 1975 2008-1
-.5
0
.5
Gold
1950 1975 20080
1
2
3
Cattle
1950 1975 2008-.5
0
.5
Hogs
1950 1975 2008-1
-.5
0
.5
Oats
1950 1975 2008-4.5
-4
-3.5
-3
Oil
1950 1975 2008-2.5
-2-1.5
-1-.5
Platinum
1950 1975 20081
1.5
2
2.5
Silver
1950 1975 2008-3
-2
-1
Soybeans
1950 1975 2008-3.5
-3-2.5
-2-1.5
Wheat
1950 1975 2008-4
-3.5-3
-2.5-2
Booms around 1974-75 and 2008

2525
Table 3a: Panel Results, Table 3a: Panel Results, for logfor log real commodity prices,real commodity prices,
Ln(World Ln(World Real GDP)Real GDP)
VolatilityVolatility Spot-Spot-Futures Futures SpreadSpread
Inven-Inven-toriestories
Real Real USUS
interest interest raterate
.60.60 2.29**2.29** -.003*-.003* -.15**-.15** -.01-.01
(.27)(.27) (.40)(.40) (.001)(.001) (.02)(.02) (.01)(.01)
** (*) => significantly different from zero at .01 (.05) significance level. Robust standard errors in parentheses; Intercept & trend included, not reported.

Results Seem SensibleResults Seem Sensible
Micro Factors all “correctly” signedMicro Factors all “correctly” signed Statistically significantStatistically significant
Macro Factors correctly signedMacro Factors correctly signed World GDP: statistically marginal effectWorld GDP: statistically marginal effect Real Interest Rate Real Interest Rate consistently unreliableconsistently unreliable
Biggest DisappointmentBiggest Disappointment
2626

Results Also RobustResults Also Robust
Results insensitive to exact econometric Results insensitive to exact econometric specification, model of world activityspecification, model of world activity Many variants reported in Table 3aMany variants reported in Table 3a Results from first-differences in Table 3bResults from first-differences in Table 3b
Possibly relevant because of (lack of) co-Possibly relevant because of (lack of) co-integrationintegration
2727

Reasonable Fit to DataReasonable Fit to Data
Fitted Against Actual (Log Real) Commodity PricesBasic Equation, Table 3
Fitted, with FE
-4 -2 0 2 4-4
-2
0
2
4
Without FE
-4 -2 0 2 4-4
-2
0
2
4
Add Bandwagon Effect, Table 4
-4 -2 0 2 4
-4
-2
0
2
4
Add Inflation Effect, Table 5
-4 -2 0 2 4-4
-2
0
2
4
2828

2929
Table 4: To Look for Table 4: To Look for Bandwagon Expectations, Add Bandwagon Expectations, Add
Lagged Rate of Commodity Lagged Rate of Commodity Price RisePrice Rise
Ln(WorldLn(World
Real GDP)Real GDP)
VolatilityVolatility Spot-Spot-Futures Futures SpreadSpread
Inven-Inven-toriestories
Real Real USUS
interest interest raterate
Lag of Lag of NominalNominal
Price Price GrowthGrowth
.50.50 1.84**1.84** -.004**-.004** -.13**-.13** .00.00 .0061**.0061**
(.27)(.27) (.40)(.40) (.001)(.001) (.02)(.02) (.01)(.01) (.0005)(.0005)
** (*) => significantly different from zero at .01 (.05) significance level. Robust standard errors in parentheses; Intercept & trend included, not reported.
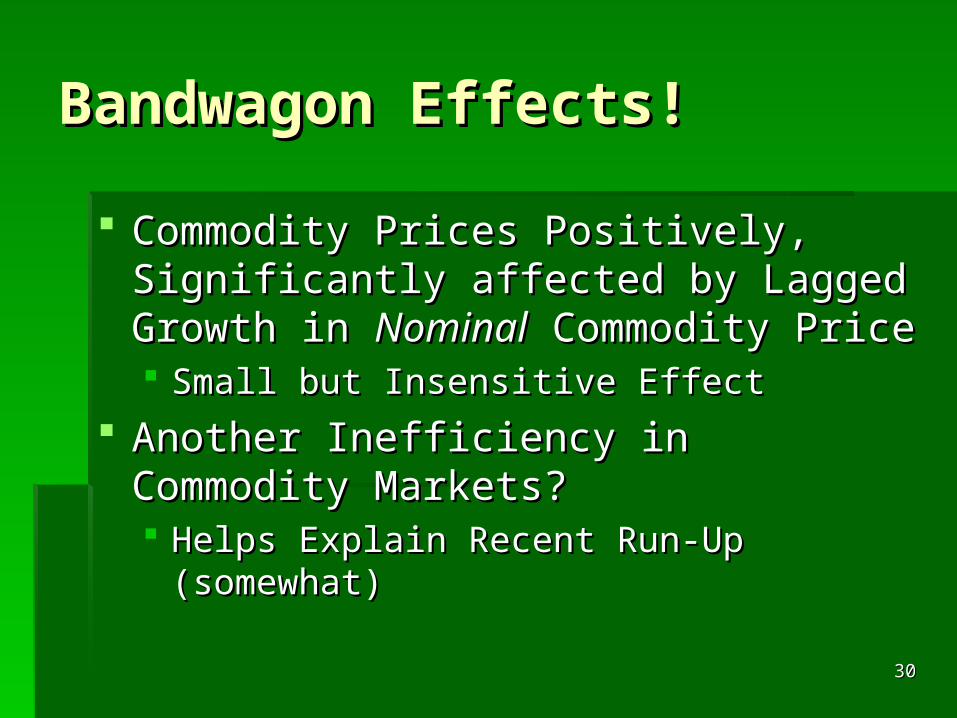
Bandwagon Effects!Bandwagon Effects!
Commodity Prices Positively, Commodity Prices Positively, Significantly affected by Lagged Growth Significantly affected by Lagged Growth in in NominalNominal Commodity Price Commodity Price Small but Insensitive EffectSmall but Insensitive Effect
Another Inefficiency in Commodity Another Inefficiency in Commodity Markets?Markets? Helps Explain Recent Run-Up (somewhat)Helps Explain Recent Run-Up (somewhat)
3030

3131
Table 5: To Look for Another Table 5: To Look for Another indicator of Monetary Ease, indicator of Monetary Ease,
Add Aggregate InflationAdd Aggregate Inflation
Ln(WorldLn(World
Real GDP)Real GDP)
VolatilityVolatility Spot-Spot-Futures Futures SpreadSpread
Inven-Inven-toriestories
Real Real USUS
interest interest raterate
InflationInflation
-2.11**-2.11** 2.12**2.12** -.003**-.003** -.14**-.14** .02.02 .082**.082**
(.61)(.61) (.27)(.27) (.001)(.001) (.02)(.02) (.01)(.01) (.015)(.015)
** (*) => significantly different from zero at .01 (.05) significance level. Robust standard errors in parentheses; Intercept & trend included, not reported.

Inflation Effects!Inflation Effects!
Commodity Prices Positively, Commodity Prices Positively, Significantly affected by InflationSignificantly affected by Inflation Again: Robust Results, but SmallAgain: Robust Results, but Small Probably negligible effect for conduct of Probably negligible effect for conduct of
monetary policymonetary policy
Hedge against Inflation?Hedge against Inflation? Doesn’t Explain Recent Run-UpDoesn’t Explain Recent Run-Up
3232

3333
Other Tests: IndicesOther Tests: Indices
Construct Commodity Price IndicesConstruct Commodity Price Indices Use 6 Weighting SchemesUse 6 Weighting Schemes
Dow-Jones/AIG; S&P GCSI; CRB Dow-Jones/AIG; S&P GCSI; CRB Reuters/Jefferies; Grilli-Yang; Economist; EqualReuters/Jefferies; Grilli-Yang; Economist; Equal
3 Different Periods of Time3 Different Periods of Time Data availability => longer span has fewer Data availability => longer span has fewer
commoditiescommodities
Similar (Weaker) ResultsSimilar (Weaker) Results Micro work OK; poor real interest rate resultsMicro work OK; poor real interest rate results

3434
Other Tests: Hi-TechOther Tests: Hi-Tech
Unit root testsUnit root tests Philips-Perron on individual commoditiesPhilips-Perron on individual commodities Panel unit-root testsPanel unit-root tests
Co-integration testsCo-integration tests Johansen on individual commoditiesJohansen on individual commodities Panels tooPanels too Vector error correction resultsVector error correction results

3535
Overall Model PerformanceOverall Model Performance
The commodity-specific explanatory factors The commodity-specific explanatory factors work (surprisingly) well:work (surprisingly) well: Inventory holdingsInventory holdings Spot-futures spreadSpot-futures spread VolatilityVolatility
Macroeconomic variables work (surprisingly) Macroeconomic variables work (surprisingly) poorly:poorly: Economic activityEconomic activity (Especially) Real interest rates(Especially) Real interest rates

3636
Possible ExtensionsPossible Extensions
Survey data as direct measure of Survey data as direct measure of expectationsexpectations
Higher Frequency data (on fewer Higher Frequency data (on fewer commodities, shorter time-span)commodities, shorter time-span)
Modeling non-linearitiesModeling non-linearities Estimate simultaneous system in Estimate simultaneous system in
inventories, expectations, and commodity inventories, expectations, and commodity prices, tied directly to the theoryprices, tied directly to the theory

ConclusionConclusion
Model works reasonably:Model works reasonably: Micro determinants work wellMicro determinants work well Macro phenomena Macro phenomena not not as importantas important
Real growth raises real commodty pricesReal growth raises real commodty prices As does inflationAs does inflation But real interest rate channel fails here.But real interest rate channel fails here.
Evidence of Bandwagon EffectsEvidence of Bandwagon Effects ““Speculative Bubble” possible in CommoditiesSpeculative Bubble” possible in Commodities Helps explains 2007-9 boom and bust?Helps explains 2007-9 boom and bust?
3737

3838
AppendicesAppendices
Graphs of data Why American interest rates? Commodity-specific Results Full Panel Results

3939Volatility
Corn
1950 1975 20080
.05.1
.15.2
Copper
1950 1975 20080
.2
.4
Cotton
1950 1975 20080
.1
.2
.3
Gold
1950 1975 20080
.1
.2
.3
Cattle
1950 1975 20080
.05.1
.15.2
Hogs
1950 1975 20080
.05.1
.15.2
Oats
1950 1975 20080
.1
.2
Oil
1950 1975 20080
.2
.4
Platinum
1950 1975 20080
.1
.2
.3
Silver
1950 1975 20080.1.2.3.4
Soybeans
1950 1975 20080
.1
.2
.3
Wheat
1950 1975 20080
.1
.2
.3

4040
Log Inventory
Corn
1950 1975 200810.5
1111.5
1212.5
Copper
1950 1975 200811
12
13
14
Cotton
1950 1975 20089.5
10
10.5
11
Gold
195019752008-1-.5
0.51
Cattle
1950 1975 200811.2
11.4
11.6
11.8
Hogs
1950 1975 2008
10.710.810.9
1111.1
Oats
1950 1975 200811
12
13
Oil
1950 1975 20087.8
8
8.2
8.4
Platinum
1950 1975 2008-20246
Silver
1950 1975 200845678
Soybeans
1950 1975 2008789
1011
Wheat
1950 1975 200811
11.5
12
12.5
4141
Future-Spot Spread
Corn
1950 1975 2008-40-20
02040
Copper
1950 1975 2008-60-40-20
020
Cotton
1950 1975 2008-50
0
50
100
Gold
1950 1975 2008-20
0
20
40
Cattle
1950 1975 2008-40
-20
0
20
Hogs
1950 1975 2008-50
0
50
100
Oats
1950 1975 2008-40-20
02040
Oil
1950 1975 2008-50
0
50
100
Platinum
1950 1975 2008-50
0
50
100
Silver
1950 1975 2008-50
0
50
Soybeans
1950 1975 2008-40-20
02040
Wheat
1950 1975 2008-40-20
02040

4242
Risk
Corn
1950 1975 200801234
Copper
1950 1975 20080
.5
1
1.5
Cotton
1950 1975 20080
1
2
3
Gold
1950 1975 20080
.5
1
1.5
Cattle
1950 1975 20080
.2
.4
Hogs
1950 1975 2008
01234
Oats
1950 1975 20080.51
1.52
Oil
1950 1975 200801234
Platinum
1950 1975 20080
1
2
3
Silver
1950 1975 20080.51
1.52
Soybeans
1950 1975 20080
2
4
Wheat
1950 1975 20080
.1
.2
.3

4343
Real Activity
Log Real World GDP
1950 1975 200829.5
30
30.5
31
31.5
World Growth Rate
1950 1975 20080
2
4
6
8
OECD output gap
1950 1975 2008-4
-2
0
2
4
Log Real World GDP - HP Trend
1950 1975 2008
-.02
0
.02

Why American Real Why American Real Interest Rates?Interest Rates?
Assume commodity markets integratedAssume commodity markets integrated If so, denomination doesn’t matterIf so, denomination doesn’t matter Data availability issues for G-3/G-7 Data availability issues for G-3/G-7
interest ratesinterest rates Inevitable EMU issuesInevitable EMU issues
4444

Table 2a: Commodity-Specific ResultsTable 2a: Commodity-Specific ResultsReal World
GDP (+)Volatility
+Spot-Future Spread (-)
Inventories(-)
Real Interest Rate (-)
Corn 1.53*(.69)
1.52(.89)
-.003(.003)
-.18(.17)
-.01(.02)
Copper .03(.68)
1.92**(.54)
-.005(.003)
-.21**(.06_
-.03(.01)
Cotton .66(.85)
1.07(.57)
-.002(.002)
-.12(.14)
.01(.01)
Cattle 7.37**(1.03)
-.65(.34)
-.007(.002)
2.37**(.48)
-.06**(.01)
Hogs -.57(1.64)
.64(.71)
-.004*(.002)
.18(.31)
-.03**(.01)
Oats 2.66**(.71)
3.28(1.69)
-.006**(.002)
-.59**(.11)
-.02(.01)
Oil .05(8.60)
.57(1.69)
-.003(.003)
-2.52(5.02)
-.01(.07)
Platinum 1.22(2.17)
1.78*(.87)
.002(.002)
-.21**(.03)
.08**(.01)
Silver 2.69(2.13)
3.32**(.73)
.003(.003)
-.37*(.18)
.01(.03)
Soybeans 1.94**(.70)
2.68**(.55)
-.001(.002)
-.05(.07)
-.01(.01)
Wheat -5.98*(2.79)
1.90**(.47)
.008*(.003)
-1.42**(.27)
.03(.02)
4545

Full Panel Results Full Panel Results Table 3a: Table 3a: LevelsLevels
Real World GDP (+)
Volatility(+)
Spot-Future Spread (-)
Inventories(-)
Real Interest Rate (-)
Basic .60(.27)
2.29**(.40)
-.003*(.001)
-.15**(.02)
-.01(.01)
Drop Fixed Effects .56(.31)
2.65(1.40)
-.023**(.006)
-.20**(.03)
.02(.04)
Substitute Time Effects
n/a 2.32(1.80)
-.026**(.007)
-.20**(.01)
n/a
Time and Fixed Effects
n/a 1.61**(.29)
-.002*(.001)
-.13**(.01)
n/a
Drop Spread .58(.30)
2.36**(.38)
n/a -.15**(.02)
-.01(.01)
Growth (not log) of World GDP
-.01(.01)
2.36**(.40)
-.003(.001)
-.15**(.02)
-.00(.01)
OECD Output Gap .01(.01)
2.34**(.44)
-.002*(.001)
-.15**(.02)
-.01(.01)
HP-Filtered GDP 2.35(1.47)
2.32**(.43)
-.003*(.001)
-.14**(.02)
-.01(.01)
Add Quadratic Trend
.48(.40)
2.30**(.40)
-.003*(.001)
-.15**(.02)
-.01(.01) 4646

Table 3b: Panel Results, First-Table 3b: Panel Results, First-DifferencesDifferences
RealWorld GDP
+
Volatility+
Spot-Future Spread-
Inventories-
Real Interest Rate-
Basic .03**(.01)
.75**(.24)
-.002**(.001)
-.10*(.05)
.00(.01)
Drop Fixed Effects .03**(.01)
.78**(.17)
-.002**(.001)
-.11**(.04)
.00(.01)
Substitute Time Effects
n/a .55**(.19)
-.002**(.001)
-.08*(.04)
n/a
Time and Fixed Effects
n/a .53**(.18)
-.002**(.001)
-.07(.04)
n/a
Drop Spread .04**(.01)
-.0020**(.0005)
-.10(.05)
-.00(.01)
OECD Output Gap .03**(.01)
.77*(.25)
-.0018**(.0005)
-.12*(.04)
.01(.01)
HP-Filtered GDP 4.91**(.97)
.78*(.23)
-.002**(.001)
-.12*(.04)
.01(.01)
Add Quadratic Trend .03**(.01)
.75**(.24)
-.002**(.001)
-.10*(.05)
.00(.01)
4747

Table 4: Panel Results, BandwagonsTable 4: Panel Results, Bandwagons
Real World GDP (+)
Volatility(+)
Spot-Future Spread (-)
Inventories(-)
Real Interest Rate (-)
Lagged PriceChange (+)
Basic .50(.27)
1.84**(.40)
-.004**(.001)
-.13**(.02)
.00(.01)
.0061**(.0005)
Drop Fixed Effects .57(.31)
1.92(1.42)
-.025**(.006)
-.19**(.03)
.04(.04)
.0104*(.0044)
Substitute Time Effects
n/a 1.84(1.90)
-.028**(.007)
-.19**(.01)
n/a .0101(.0067)
Time and Fixed Effects
n/a 1.37**(.28)
-.004**(.001)
-.12**(.01)
n/a .0050**(.0008)
Drop Spread .48(.32)
2.01**(.37)
-.14**(.02)
-.00(.01)
.0053**(.0005)
Growth (not log) of World GDP
-.01(.01)
1.90**(.40)
-.005**(.001)
-.13**(.02)
.01(.01)
.0061**(.0005)
OECD Output Gap -.00(.01)
1.90**(.43)
-.004**(.001)
-.13**(.02)
.01(.01)
.0063**(.0005)
HP-Filtered GDP -.71(1.58)
1.92**(.42)
-.004**(.001)
-.13**(.02)
.01(.01)
.0062**(.0005)
Add Quadratic Trend
.26(.37)
1.85**(.41)
-.004**(.001)
-.13**(.02)
.01(.01)
.0062**(.0005)
Drop post-2003 data 1.21**(.28)
1.26(.58)
-.004**(.001)
-.11**(.04)
.01(.01)
.0049**(.0005)
With AR(1) Residuals
2.08*(.81)
.89**(.13)
-.0033**(.00004)
-.10**(.03)
.00(.01)
.0031**(.0004) 4848

Table 5: Panel Results, Adding InflationTable 5: Panel Results, Adding Inflation
Real World GDP +
Volatility+
Spot-Future Spread -
Inventories-
Real Interest Rate -
Inflation
Basic -2.11**(.61)
2.12**(.27)
-.0032**(.0007)
-.14**(.02)
.019(.012)
.082**(.015)
Drop Fixed Effects
.70*(.32)
2.25(1.43)
-.023**(.006)
-.19**(.03)
.040(.038)
.075(.041)
Drop Spread -2.04**(.63)
2.21**(.26)
-.15**(.02)
.015(.012)
.079**(.015)
Growth (not log) of World GDP
.02(.01)
2.01**(.32)
-.0027**(.0007)
-.15**(.02)
.006(.011)
.058**(.010)
OECD Output Gap
-.00(.01)
2.09**(.28)
-.0030**(.0007)
-.15**(.02)
.014(.012)
.083**(.014)
HP-Filtered GDP
.19(1.64)
2.03**(.33)
-.0031**(.0008)
-.15**(.02)
.005(.013)
.051**(.009)
Add Quadratic Trend
-2.47**(.76)
2.14**(.27)
-.0032**(.0006)
-.14**(.02)
.017(.011)
.085**(.015)
4949

5050

![[PPT]Energy Economics – II Jeffrey Frankel Harpel Professor ... · Web viewEnergy Economics – III Jeffrey Frankel Harpel Professor, Harvard University ADA Summer School, Baku,](https://static.fdocuments.in/doc/165x107/5ab0cb237f8b9abc2f8bdb54/pptenergy-economics-ii-jeffrey-frankel-harpel-professor-viewenergy-economics.jpg)