Determinants and Consequences of Peasant Labor Migration in Contemporary China
INTERNAL MIGRATION DYNAMICS IN RUSSIA, 1985-2001:
Determinants, Motivations and Consequences
Ted Gerber
University of Wisconsin – Madison
The National Council for Eurasian and East European Research 910 17th Street, N.W.
Suite 300 Washington, D.C. 20006
TITLE VIII PROGRAM

ii
Project Information* Principal Investigator: Ted Gerber Council Contract Number: 819-07g Date: November 1, 2005
Copyright Information
Scholars retain the copyright on works they submit to NCEEER. However, NCEEER possesses the right to duplicate and disseminate such products, in written and electronic form, as follows: (a) for its internal use; (b) to the U.S. Government for its internal use or for dissemination to officials of foreign governments; and (c) for dissemination in accordance with the Freedom of Information Act or other law or policy of the U.S. government that grants the public access to documents held by the U.S. government. Additionally, NCEEER has a royalty-free license to distribute and disseminate papers submitted under the terms of its agreements to the general public, in furtherance of academic research, scholarship, and the advancement of general knowledge, on a non-profit basis. All papers distributed or disseminated shall bear notice of copyright. Neither NCEEER, nor the U.S. Government, nor any recipient of a Contract product may use it for commercial sale.
* The work leading to this report was supported in part by contract or grant funds provided by the National Council for Eurasian and East European Research, funds which were made available by the U.S. Department of State under Title VIII (The Soviet-East European Research and Training Act of 1983, as amended). The analysis and interpretations contained herein are those of the author.
iii
Executive Summary
This report presents the main findings from a study of internal migration in contemporary
Russia based on individual level survey data. The Survey on Stratification and Migration
Dynamics in Russia (SMDR) provides migration histories spanning 1985-2001 for a
representative sample of 7167 Russian adults. The survey results yield novel insights that cannot
be derived from analyses of aggregate migration data. Although the individual and regional
factors identified by economic theories of migration generally shape economic migration within
Russia, only about 25% of internal migrations are motivated by economic incentives, and non-
economic migration responds to different. Neither the rates of overall migration and of
economic migration nor the effects of individual characteristics on migration behavior were
demonstrably affected by the collapse of the Soviet Union and the attendant economic shocks
and political changes. Economic migrants appear to have enhanced access to employment
relative to non-migrants with similar characteristics.
1
Introduction
How, if at all, have the frequency, patterns, motives, and consequences of internal
migration in Russia evolved since the collapse of the Soviet system? Internal migration can play
a vital role in redistributing the work force from struggling regions to economically dynamic
regions within a country, thereby allocating labor more efficiently and ameliorating inter-
regional disequilibria in employment and wages. The potential economic benefits of internal
migration should be especially pronounced in a country like Russia that has experienced severe
and regionally uneven exogenous economic shocks. The collapse of the Soviet system removed
many legal barriers to migration. In principle, the demise of the planned economy and the
growth of market institutions should have created substantial economic incentives to migrate.
However, poorly developed housing and credit markets, some remaining residential restrictions
in major cities like Moscow, and a general lack of information regarding job opportunities in
other regions due to weak existing migrant networks might hinder migration. Thus, from a
policy perspective the study of recent patterns of internal migration in Russia can reveal whether
it has fulfilled its potential role in revitalizing Russia’s economy. From a theoretical perspective,
contemporary Russia offers an interesting case for assessing the relative weight of economic
motivations and forces in shaping migration behavior.
A growing number of studies have examined internal migration in post-Soviet Russia
(Bond 1994; Mitchneck and Plane 1995a, 1995b; Heleniak 1997, 1999; Zayonchkovskaya 1999;
Andrienko and Guriev 2004, 2005; Gerber forthcoming). However, these studies all rely on
highly aggregated official data, in some cases supplemented with highly selective surveys of
migrants or potential migrants. While this type of data is useful for many purposes, it also has
some limitations. The research project reported here takes a novel empirical approach, analyzing

2
individual-level data from a unique, nationally representative survey containing the migration
histories from 1985-2001 of 7,167 Russian aged 16 and older. In this paper, I report the main
findings from the survey data. First, I examine trends over this period in the overall internal
migration rate, as well as in different types of migration as defined by the self-reported motives
of the migrants. Next, I estimate statistical models that reveal how individual, local, and regional
variables are associated with the internal migration behavior of individuals. I then examine
whether economically-motivated migrants have improved labor market outcomes compared to
non-migrants with similar characteristics. Before presenting the results, I provide some
background on the topic and describe the data.
Background
Russia is a federation of 89 territorial units, the rough equivalent of American states.
These legal “subjects” of the Russian federation fall under several administrative categories:
oblasts, krais, “autonomous okrugs,” “autonomous republics,” one “autonomous oblast”, and two
“gorods” (cities) – Moscow and St.Petersburg – which have subject-level status. They are
conventionally referred to as Russia’s “regions” (or “oblasts”). I define internal migration a
change of permanent residence within Russia that involves the crossing of an oblast boundary.1
Note that changes of residence within an oblast do not count as internal migration, nor do moves
across international borders.
1 I do not count moves across boundaries that separate “autonomous okrugs” from the larger oblasts of which they are part: for example, a move from the Khanti-Mansiiskii autonomous okrug to another part of Tiumen oblast would not qualify as an inter-regional move. This is necessitated by the problematic way that Goskomstat reports statistics on oblasts that contain autonomous okrugs: it is not possible to treat the autonomous okrugs as independent oblasts because no data are provided on the parts of the larger oblasts that fall outside of the autonomous okrugs. Thus, for the sake of consistency across analyses, it is preferable to subsume the eleven autonomous okrugs into the larger territories of which they are part.
3
Spanning over 6.5 million square miles of territory, 11 time zones, and latitudes from
above the Arctic circle to northern Turkey, Russia’s oblasts are highly diverse climactically,
geographically, and culturally. Despite their nominal autonomy, regions had little or no leeway
to pursue independent economic policies during the Soviet era. In the absence of market forces,
disparities in natural resource endowments, industrial structure, and, as a result, growth rates (see
Shaw 1999) did not translate into correspondingly large differences in average real wages, living
standards, and labor market conditions. Instead, regional economic conditions were made
relatively uniform by the integrating force of the Soviet administrative system. Full employment
prevailed, reflecting the lack of technological innovation, low labor productivity, an “extensive”
development pattern, and soft budget constraints that characterized the Soviet economy (Kornai
1981). What differences in labor market conditions did exist were purposefully introduced by
authorities to realize policy objectives. For example, the Soviet regime instituted wage bonuses
to attract workers to under-populated but resource-rich northern and eastern regions (Bond 1994;
Heleniak 1999).
The relative uniformity of labor market conditions removed the key incentive for inter-
regional mobility posited by the neo-classical economic explanation of migration. According to
the neo-classical approach, individuals move from one region to another when the economic
benefits of doing so exceed the costs (Greenwood 1997). In aggregate terms, this means that
migrants flow predominantly from regions with relatively low wage levels to regions with
relatively high wage levels, and, because wage gains are contingent upon securing employment,
from regions with relatively high unemployment to those with relatively low unemployment
(Sjaastad 1962; Todaro 1969). Soviet authorities implicitly adhered to the neo-classical model
when they used wage incentives to attract migrants to the far northern and eastern regions of the

4
country as part of their development strategies. But aside from these campaigns, low regional
disparities in employment and wages gave Russians little economic incentive to migrate
internally.
Soviet citizens who wished to change regions despite the uniformity of wages and labor
market conditions throughout the country often faced serious obstacles. Mandatory residential
permits (propiski) – which were often not forthcoming, depending on labor migration policies,
political or security considerations, and housing availability – closed cities, and the national
passport system posed practical, if imperfect barriers (Matthews 1993; Buckley 1995). Housing
was very scarce in attractive areas, given the absence of a housing market, administrative
allocation of housing via waiting lists, and the chronic shortage of new housing. The
distribution of housing and social benefits through employing organizations on the basis of
seniority provided incentives for staying put. These various restrictions and incentives could not
be entirely effective at limiting internal migration that did not conform to the plans of the
authorities (Buckley 1995). Nonetheless, Soviet economic and institutional conditions of the
limited both the incentives and opportunities for inter-regional migration, making it relatively
rare, and responsive mainly to state-sponsored regional development projects, the desire to live
in Moscow, and the pursuit of more plentiful consumer goods and services (Mitchneck 1991;
Mitchneck and Plane 1995a, 1995b; Lee and Struyk 1996).
Post-Soviet Changes
The collapse of the Soviet state in late 1991 eliminated most, though not all, of the
conditions discouraging inter-regional migration. The new Russian government introduced
sweeping market reforms in January 1992. Initiated in a context of general institutional and

5
economic breakdown, Russia’s market transition quickly led to recession, hyper-inflation,
spiraling inequality, and labor market turmoil (Gerber and Hout 1998; Clarke 1998; Gerber
2002). Economic motives become more pressing in times of crisis. Regional disparities in
incomes, living standards, and labor market conditions have tended to grow in post-Soviet era
(Sutherland and Hanson 1996; Van Selm 1998). Political changes also paved the way for freer
migration: the Russian Constitution adopted in 1993 formally banned residence restrictions,
though they persist in Moscow and other cities. Thus, post-Soviet developments created both
incentives and opportunity for increased inter-regional migration. From a policy perspective,
internal migration has great potential to re-equilibrate the national labor market and improve
overall economic productivity by redistributing the workforce from economically struggling to
economically thriving regions (see Andrienko and Guriev 2005).
Yet, the presumed economic benefits will only be realized if the internal migration
behavior of Russians responds to economic incentives in the manner proposed by the neo-
classical economic theory. There are grounds for skepticism on this count. Decades of Soviet
experience, in which migration was not a realistic option for improving one’s economic status,
may have inculcated a habitual disinclination to view migration as such an option.
Malfunctioning housing markets, particularly in more desirable regions, and the lack of access to
credit deter migration. Poor information about economic conditions in other regions and
concerns about finding housing may impede economic incentives. Finally, recent work on
migration behavior emphasizes how migrant networks foster additional migration (Massey and
Espinosa 1997; Massey et al. 1998). Given that migration in the Soviet era tended to be
relatively infrequent, migrant networks are probably poorly developed within Russia.
6
Recent studies based on official aggregate panel data conclude that absolute region-to-
region flows (Andrienko and Guriev 2004) and regional net migration rates (Gerber
forthcoming) respond to regional economic characteristics (unemployment and mean wages) in
the manner predicted by the neo-classical economic approach. However, the aggregate data do
not show an increase after the Soviet collapse in the volume of inter-regional migration, which
remains low by international standards (Andrienko and Guriev 2004). In any case, definitive
conclusions about individual-level behavior cannot be reached using aggregate-level data: while
the aggregate patterns are consistent with the economic explanation of migration, the patterns
may not be driven by the mechanisms specified by that theory. As a result, the aggregate
analyses do not provide convincing refutation of assertions that migration behavior of Russians
tends not to be shaped by the standard economic incentives (e.g. Zayonchkovskaya 1999; Earle
and Sabirianova 2002).
Aggregate data also leave key questions unanswered: which Russians are more (and less)
likely to migrate? How important are economic motives relative to other motives? How does
migration affect the labor market outcomes of migrants? Only by addressing these questions
can we assess whether the economic perspective and findings from the broad literature on the
individual-level determinants of migration apply (e.g. Sandefur and Scott 1981; Long 1982) to
the Russian context. Also, these questions are essential for evaluating whether internal migration
is playing the positive role anticipated by economic theories and, if not, what policies might help
it do so. In short, the only way to obtain a satisfactory understanding of internal migration in
Russia and to see if the transition has affected migration patterns, is to analyze individual-level
data.

7
Data
The data are from the Survey on Stratification and Migration Dynamics in Russia
(SMDR), which combines three nationally representative samples of adult Russians surveyed by
the Moscow-based survey firm, VTsIOM (subsequently renamed the Levada Analytic Center), in
September 2001-January 2002 (total N=7,167).2 The samples were drawn using VTsIOM’s
standard multi-stage procedure.3 A special battery of questions obtained information about the
respondent’s place of residence in December 1984 and the month and year of all changes in
residence from that date through the month of the survey. I constructed a spell file containing
the complete residential histories for respondents from December 1984 through the time of the
survey. The survey elicited the oblast (or country), the number of inhabitants, and whether close
friends and/or relatives were present for each place where the respondent lived for at least six
months. I restricted the operational definition of migration to moves involving residence of at
least six months to eliminate temporary labor migrations and other short-term stays.
I merged official data on oblast-level characteristics (Goskomstat 1998, 2002) with the
individual spells, obtaining time-varying measures of the regional labor market and other
conditions experienced by respondents. The official data are reported annually, so regional
characteristics are time-varying covariates even when respondents do not change region of
2 I acknowledge support for data collection in the form of a grant from the National Science Foundation (SBR-0096607) 3 All urban population points and rural administrative areas were divided into 65 strata according to region, a proxy for ethnic composition, size, and administrative status. A total of 110 PSUs were systematically selected within strata with probabilities proportionate to size (Moscow and St.Petersburg were self-representing.) SSUs consisting of either electoral districts (in urban PSUs) or villages (in rural PSUs) were selected within each PSU such that 8-12 interviews were conducted in each SSU. Addresses within SSUs were selected using a random walk algorithm. At each address, the respondent with the nearest birthday was selected for interview. Among target respondents who could be contacted in three or fewer attempts (the minimum required by the field protocol), the response rate was 63%. Originally 7,267 interviews were conducted. However, subsequent checks revealed misconduct on the part of an interviewer. As a result, all 100 interviews (across the three waves) conducted at that interviewer’s regional office were deleted. Further investigation revealed no other evidence of systematic misconduct by the interviewers. All analyses apply post-stratification weights to correct the sample distributions by gender, age, education, and type of locality (urban vs. rural).
8
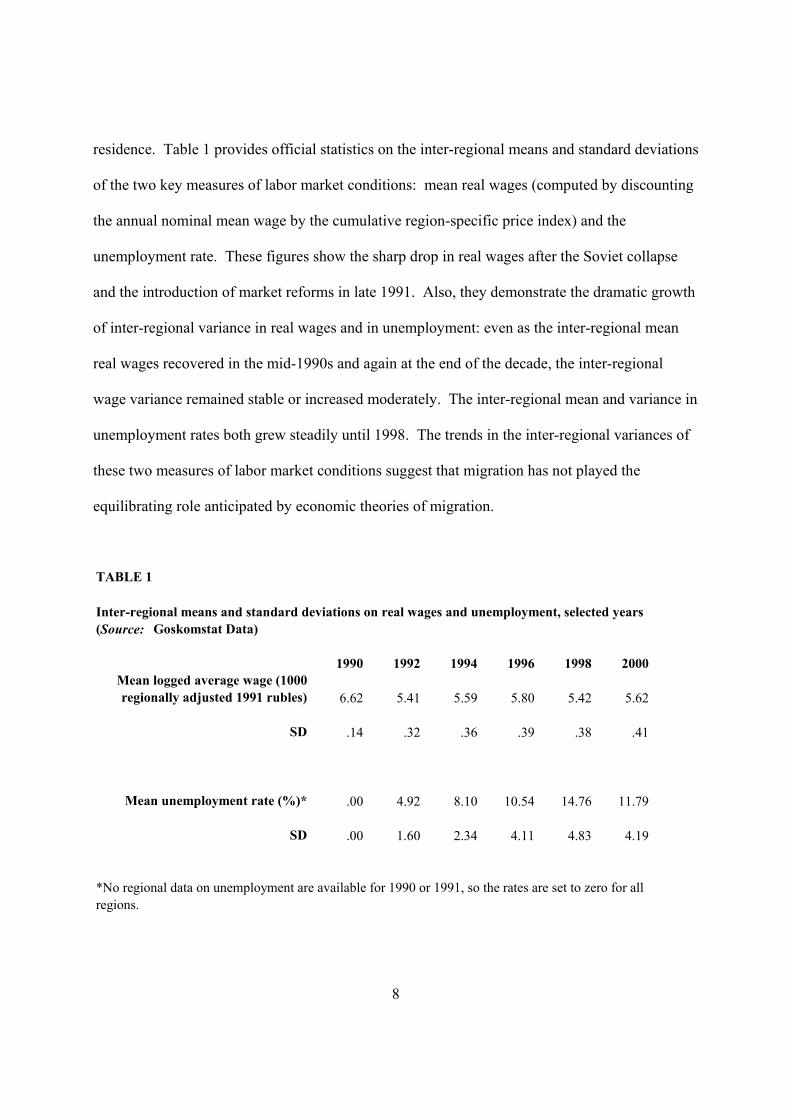
residence. Table 1 provides official statistics on the inter-regional means and standard deviations
of the two key measures of labor market conditions: mean real wages (computed by discounting
the annual nominal mean wage by the cumulative region-specific price index) and the
unemployment rate. These figures show the sharp drop in real wages after the Soviet collapse
and the introduction of market reforms in late 1991. Also, they demonstrate the dramatic growth
of inter-regional variance in real wages and in unemployment: even as the inter-regional mean
real wages recovered in the mid-1990s and again at the end of the decade, the inter-regional
wage variance remained stable or increased moderately. The inter-regional mean and variance in
unemployment rates both grew steadily until 1998. The trends in the inter-regional variances of
these two measures of labor market conditions suggest that migration has not played the
equilibrating role anticipated by economic theories of migration.
TABLE 1
1990 1992 1994 1996 1998 2000Mean logged average wage (1000 regionally adjusted 1991 rubles) 6.62 5.41 5.59 5.80 5.42 5.62
SD .14 .32 .36 .39 .38 .41
Mean unemployment rate (%)* .00 4.92 8.10 10.54 14.76 11.79
SD .00 1.60 2.34 4.11 4.83 4.19
Inter-regional means and standard deviations on real wages and unemployment, selected years (Source: Goskomstat Data)
*No regional data on unemployment are available for 1990 or 1991, so the rates are set to zero for all regions.

9
TABLE 2Descriptive statistics, cross-sections of SMDR analysis sample on January 1, selected years
1985 1988 1992 1995 1998 2001N 4761 5062 5545 5951 6382 6866
Woman .57 .56 .56 .55 .55 .54Age (-18) 20.25 21.65 23.18 24.16 25.57 26.89University .10 .10 .11 .11 .12 .12Specialized secondary .25 .26 .26 .26 .27 .26General secondary .17 .17 .18 .18 .17 .18Vocational .16 .17 .18 .18 .19 .19Less than secondary .32 .30 .27 .26 .25 .24Working for hire .76 .71 .64 .58 .54 .49Unemployed .01 .01 .02 .03 .04 .06Self-employed .00 .00 .01 .01 .02 .02Maternity leave .03 .04 .03 .02 .02 .02Not in labor force .01 .02 .03 .04 .05 .06Retired .12 .16 .21 .25 .28 .31Studying, university .02 .01 .02 .02 .02 .01Studying, other .03 .02 .02 .03 .02 .03Military service .02 .02 .02 .01 .01 .00"Other" activity .00 .00 .00 .00 .00 .00Never married .19 .17 .16 .17 .16 .16Married .69 .68 .65 .62 .57 .54Divorced/separated .05 .06 .07 .08 .10 .11Cohabiting .02 .02 .03 .03 .04 .06Widowed .06 .07 .09 .10 .12 .14Ln(children at home + 1) .52 .52 .51 .50 .49 .47Ln(years current oblast) 3.19 3.27 3.35 3.40 3.44 3.48Family current oblast .81 .81 .81 .81 .81 .81Friends current oblast .80 .80 .80 .80 .79 .79Village .18 .18 .18 .18 .18 .17Moscow .06 .06 .06 .06 .06 .06Sampled oblast .98 .99 .99 .99 .99 1.00Regional variables (centered at annual means for all regions): Logged wages (1991 rubles) -.06 -.05 -.03 .03 .03 .05Unemployment rate .00 .00 .03 -.65 -1.55 -1.60Small business employment rate .00 .02 .21 .04 1.28 1.72Murder rate -.10 -.10 -.10 -.09 -.14 -.14Male life expectancy 64.15 64.15 62.29 58.51 61.32 58.96
The survey also obtained employment and family structure histories, which I used to
prepare time-varying measures of respondents’ main activity (employed, in school, retired,
unemployed etc.), marital status, and the number of children in the household. Age and

10
education are also time-varying, the latter based on imputed year when the highest degree was
attained. Finally, I created a time-varying measure of duration (in years) of residence in current
oblast. To understand the structure of the data analyzed, consider the descriptive statistics in
Table 2. This table presents “snapshots” of the analysis sample – those 18 years or older residing
in a Russian oblast other than Chechnya in the given month – taken in January of the respective
years.4 The sample size increases over time as more respondents turn 18. The distributions of
variables within the sample change over time, due to the addition of respondents who turn 18,
move to Russia, or leave Chechnya, the loss of those who leave Russia or move to Chechnya,
and, more importantly, changes (in marital status, number of children, education, main activity,
place of residence) experienced by respondents. The SMDR data capture well-known trends in
Russia over this period in time, such as the growth of unemployment and non-participation in the
labor force, the decline of marriage, and the increase in cohabitation and divorce, suggesting the
data are reliably representative of the Russian population.
To assess their suitability for the analysis of internal migration, I compare the observed
rates of internal migration in the SMDR data to the available official figures. Figure 1 plots the
annual estimates of the rates of internal migration from the SMDR residential histories (number
migrations in the course of the year per 1000 residents at the start of the year), along with the
95% confidence intervals around those estimates, and the official rates (from Goskomstat 2000).5
4 I exclude the few spells formed by respondents living in Chechnya because the military conflict there makes it unsuitable for analyzing typical patterns of migration behavior. An argument can be made for excluding elderly respondents – e.g., those above working age – but doing so has no influence on the findings. 5 These rates were estimated on the entire SMDR sample for each year rather than the analysis sample as defined above, because the entire sample yields the greatest degree of comparability with the official rates (because the latter include, presumably, the migrations of those under 18). The confidence bars are not symmetrical because the estimates are calculated based on dummy variable coefficients and their respective upper and lower confidence limits from a hazard model: the non-linear relationship between the logged hazard and the estimated rate inherently produces this asymmetry.

11
Figure 1. Internal migration rates, 1985-2000: sample and official estimates
0
2
4
6
8
10
12
14
16
18
1985 1986 1987 1988 1989 1990 1991 1992 1993 1994 1995 1996 1997 1998 1999 2000
Official data (migrations per 1000)Sample estimate (weighted SMDR data)
Over the period for which official data are available, the sample estimates are consistently below
the official rates. The official rates are within the 95% confidence interval in five of the nine
years. Yet the overall picture suggests that the SMDR data may underestimate migration rates
somewhat. In fact, this divergence from the official figures is to be expected, since the official
figures relate to all migrations while the SMDR only capture those that lead to a stay of at least 6
months in the destination region. The SMDR data also exclude movements across the
boundaries of autonomous okrugs that do not involve a change in the larger oblast of which they
part. In light of these considerations, the SMDR data should in fact exhibit lower levels of
migration than the official rates. Altogether, Figure 1 indicates that the SMDR data are well-
suited analysis of internal migration. In addition, the annual migration rates based on the SMDR
data exhibit trendless fluctuation rather than a clear pattern. In any given year, the estimated rate
might be unusually high or unusually low. Therefore, for all further analyses I aggregated the

12
years into five more-or-less equal periods: 1985-87, 1988-91, 1992-94, 1995-97, and 1998-
2001. Smoothing the annual fluctuations in this manner is justified, given the apparently
arbitrary nature of the year-to-year variations.
Results
Motives for Migration
Although the economic approach emphasizes the role of economic incentives in driving
migration behavior, migration can result from other motives as well: unification or re-unification
with family members, the pursuit of educational opportunities, a desire to return to one’s place of
origin, political reasons (avoiding persecution), pursuit of better climate, quality of life, or other
non-economic amenities, or even a wish for new experiences and challenges. Many individuals
migrate as a result of decisions made by other household members. A major advantage of
individual-level migration data is that they permit one to distinguish different forms of migration
based on the motivations for migration. By doing so, we can evaluate what proportion of
migrations are in fact inspired by economic motives rather than assume that all or most are.
The SMDR asked respondents to indicate which of fourteen possible motives was the
primary reason for each move they undertook during the observation period. I grouped the
response categories into six broad groups: economic (post-graduation job assignment, to look
for a job, to start a new job, to pursue new business opportunities), education (attending
university, pursuing opportunities for oneself or one’s children), family (joining or moving closer
to family members, getting married), political (fleeing conflicts or persecution, nationalism),
return to one’s place of origin, and other or no reasons (including migrations undertaken as the
result of somebody else’s decision). The results reveal that the majority of migrations

13
undertaken by Russia from 1985-2001 were not motivated by economic incentives: instead,
family reasons were the most frequently cited motive (Table 3). Generally, only about 25% of
migrations were motivated primarily by economic incentives. Moreover, the relative importance
of economic incentives declined in the most recent period. Economic incentives play a relatively
minor role (though a greater one than political factors, a desire to return to one’s origins, and
education) in shaping the migrations that do take place in Russia.
TABLE 3Main reason for inter-regional migrations, by period (Source: SMDR data)
1985-1988 1989-1991 1992-1994 1995-1997 1998-2001 Total NEconomic 26.0% 22.8% 23.2% 27.5% 17.8% 23.7% 105Education 3.9% 7.8% 10.3% 4.2% 6.3% 6.0% 27Family 39.9% 27.2% 45.3% 51.6% 44.9% 42.4% 189Political 0.0% 3.2% 0.0% 0.4% 0.6% 0.7% 3Return 10.8% 12.4% 0.0% 4.7% 4.9% 6.9% 31Other/none 19.4% 26.5% 21.3% 11.6% 25.5% 20.4% 91
Total 27.3% 14.7% 14.6% 21.6% 21.7% 445
Economically-motivated internal migration is even less frequent than Russia’s already
low migration rates imply. Of course, retrospective accounts for the motives behind migration
may not be entirely reliable, and some migrants who were motivated by economic motives may
erroneously cite other factors instead. Perhaps some of those who did not make the decision to
migrant (and thus are coded in the “other/none” category) could be considered economic
migrants, if whoever did make the decision for them had economic motives. These caveats
notwithstanding, the data strongly imply that a relatively small and declining proportion of the
migrations undertaken by Russians during this period were motivated by economic incentives.

14
Who migrates? Individual and locality characteristics
To determine which groups of Russians are most likely to migrate internally – an issue
both for migration theories and for policy makers – I estimated multivariate hazard models with
repeated events for any type of migration, economic migration, and non-economic migration.
The preferred model specifications exhibit a great deal of similarity with the patterns of effects
identified in studies of individual-level migration behavior in other contexts (Sandefur and Scott
1981; Long 1992). Women are less likely to undertake economic migration and age reduces
migration rates.6 Higher and specialized secondary education increase the rate of economic
migration, as anticipated by human capital theories, but education has no effect on non-economic
migration. Compared to employed Russians, the unemployed are considerably more likely to
migrate, particularly for economic reasons. The self-employed are less likely to migrate for non-
economic reasons, while women on maternity leave and retirees are more likely to do so (though
neither group differs significantly with respect to economic migration). Non-participants in the
labor force and students have higher net rates of both types of migration.
Somewhat surprisingly, marital status does not affect individual migration rates; the
inhibiting effect of having children in the house only applies to non-economic migration.
Duration of residence exerts a negative effect: the longer one lives in a place, the less likely one
is to leave, though the logarithmic form of this effect suggests it declines in strength over time.7
All these effects, aside from the null finding regarding marital status, are intuitively plausible and
consistent with findings from other contexts. The distinctions between the patterns for economic
and non-economic migration enhance confidence in the reliability of our measures that
distinguish economic from non-economic migration.
6 Various curvilinear specifications of the age effect did not improve the fit of any of the models. 7 Here too I tested and rejected various non-monotonic specifications.

15
The presence of family members in one’s locality reduces the rate of non-economic
migration, but not economic migration, and the presence of friends has no effect at all.
Otherwise, locality characteristics do not exert much of an effect. Naturally, migration rates are
far lower in sampled oblasts.8
Figure 2. Period specific inter-regional migration rates estimated from SMDR (Migrations per 1000 population aged 18+)
0
5
10
15
20
25
30
35
40
1985-1988 1989-1991 1992-1994 1995-1997 1998-2001
Any migration: unadjustedAny migration: adjustedEconomic migration: unadjustedEconomic migration: adjustedNon-economic migration: unadjustedNon-economic migration: adjusted
Finally, net of the individual variables in the models, migration rates exhibit no pattern of
change over the five 3-4 year periods. The dramatic social and economic dislocations
accompanying the Soviet collapse in late 1991 had no statistically discernable effect on 8 While the SMDR sample might reasonably be viewed as a probability sample of the Russian adult population in late 2001, it cannot be viewed as representative of the Russian population in some earlier year because members of that population who were living abroad or in non-sampled oblasts at the time of the survey were excluded by design. Since migration behavior obviously affects the probability of residing abroad or in a non-sampled oblast, the sample may be biased. Moreover, respondents who lived in prior years in oblasts that were not included in the sample perforce must have migrated to a sample oblast prior to the survey. Thus, they on average had substantially higher probabilities of migrating at any given month than did those who lived in sampled oblasts. Unfortunately, there is no ready solution to this problem: it inheres in the multistage sampling design, which is unavoidable in modern surveys of large societies like Russia. Of course, the impact of this potential bias on results will be most severe if residence in non-sampled oblasts at prior times correlates with individual or local characteristics. To minimize the possible impact, I therefore include a dummy variable denoting residence in a sampled oblast in all models.

16
migration behavior: neither economic nor non-economic migration rates increased as a result.
Although none of the period effects is statistically significant, it is still useful to consider the net
patterns of change over time (the “adjusted”) and the gross (“unadjusted”) patterns implied by
the corresponding point estimates of the dummy variable coefficients and constants in Table 4
and from the equivalent reduced form models (Figure 2). First, the patterns are nearly identical,
implying that aggregate trends cannot be attributed to changes in population composition.
Second, if we look only at developments during the post-transition era, it might appear that
migration rates increased after 1992 then decreased later in the decade. However, the
magnitudes of these changes (which, it should be remembered, are not statistically significant)
are smaller than the decline in migration that took place during the late 1980s: based on the
SMDR data, there was as much or more internal migration taking place in the mid-1980s as in
the mid-1990s. Thus, any patterns in the 1990s should not be casually interpreted as reflecting
the impact of Russia’s economic transition. Overall, the emerging picture is one of tremendous
stability in internal migration rates. Furthermore, I tested for changes over time in the effects of
education, unemployment, gender, and age on each form of migration: I found no statistically
significant changes.
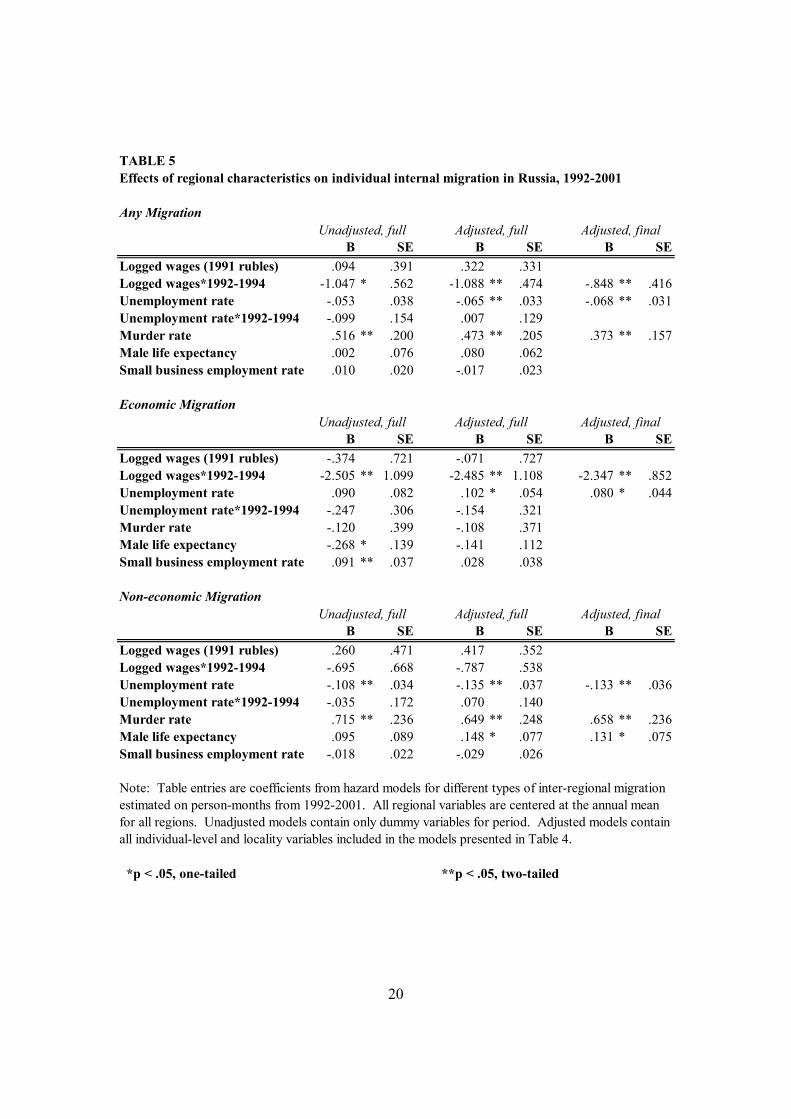
Regional effects
The existing empirical literature focuses on how regional labor market characteristics
affect aggregate migration flows or net rates, as economic theories of migration would clearly
predict (Andrienko and Guriev 2004; Gerber forthcoming). To see if regional characteristics
exert “push” or “retention” effects on each form of migration using individual data, I first
estimated hazard models incorporating only regional characteristics and time (to obtain

17
TABLE 4Hazard models for inter-regional migration
B SE B SE B SEWoman -.271 * .159 -.865 ** .284 -.099 .184Age (-18) -.030 ** .009 -.047 ** .017 -.027 ** .010Education (General Secondary) University .471 ** .223 1.442 ** .394 .170 .273 Specialized secondary .271 .202 1.183 ** .408 -.004 .220 Vocational -.129 .221 .152 .480 -.207 .241 Less than secondary -.105 .320 .059 .970 -.197 .378Main activity (Working for Hire) Unemployed 1.095 ** .311 1.349 ** .555 .998 ** .370 Self-employed -1.220 ** .479 -.573 .695 -1.676 ** .728 Maternity leave .605 * .338 -.782 1.109 .813 ** .347 Not in labor force 1.700 ** .228 1.282 ** .463 1.776 ** .264 Retired .459 * .270 -.136 .971 .490 * .290 Studying, university 1.067 ** .366 1.382 ** .408 .908 * .479 Studying, other .954 ** .338 1.347 ** .586 .776 ** .387 Military service .601 .419 .741 .511 .520 .581 "Other" activity .698 .744 -15.697 ** .359 .985 .749Marital Status (Never Married) Married .149 .273 -.141 .351 .208 .337 Cohabiting .008 .468 -1.111 .944 .201 .518 Divorced/separated .295 .319 .640 .600 .164 .360 Widowed .268 .427 -13.463 ** .460 .359 .468Ln(children at home + 1) -.397 * .206 .057 .357 -.506 ** .237Ln(years current oblast) -.453 ** .091 -.359 ** .151 -.482 ** .109Family in current oblast -.443 ** .219 .012 .454 -.570 ** .250Friends in current oblast -.063 .212 -.382 .412 .029 .239Village -.133 .201 -.146 .376 -.141 .251Moscow -.020 .297 .693 .501 -.391 .389Sampled oblast -2.996 ** .218 -3.149 ** .377 -2.965 ** .250Period (1985 to 1988) 1989 to 1991 .295 .210 .436 .409 .248 .239
1992 to 1994 -.018 .228 -.031 .501 -.010 .276 1995 to 1997 .315 .224 .446 .409 .275 .280 1998 to 2001 .089 .231 -.144 .497 .152 .258Constant -3.195 ** .326 -5.149 ** .625 -3.322 ** .342
N respondents N events Person months at risk Log-likelihood
*p < .05, one-tailed **p < .05, two-tailed
Any migrationEconomic Migration
Non-economic Migration
Note: Dummy variables denoting missing data on locality type, children at home, main activity
6864448
1132653
6864106
1132653-450-1488
6864342
1132653-1242
18
“unadjusted” estimates of the effects of regional characteristics), then I adjusted the regional
effects by incorporating the individual and locality characteristics from the models in Table 4. I
trim the non-significant regional variables to arrive at preferred specifications of regional effects.
Economic theory dictates a focus on regional wages and unemployment, but I also included
measures of quality of life (the murder rate), health conditions (male life expectancy), and the
extent of reforms (relative size of small business employment), on the expectation that non-
economic migration might respond more strongly to these non-economic factors. In addition, I
included interaction variables to test whether the effects of regional labor market conditions were
especially strong in 1992-1994, the period when the exogenous shocks should have exerted the
greatest force (see Gerber forthcoming).9
Regional characteristics affect overall migration rates, but in a puzzling fashion: higher
real wages do reduce out-migration (at least in 1992-4, when their effects should be strongest)
and higher murder rates exert push effects, but higher unemployment reduces out-migration,
contrary to theoretical expectations. This pattern makes more sense when we analyze economic
and non-economic migration separately. For economic migration, both wages and
unemployment have the effects predicted by economic theory, while the other regional
characteristics exert no effects at all, at least net of controls for individual characteristics. Thus,
the individual-level regional effects are consistent with the results obtained in studies analyzing
aggregate data, but only when the analysis is limited to economically-motivated migration. Also
broadly consistent with the economic approach, the analysis suggests that the effects of wages on
economic migration were strongest in the immediate aftermath of the shock of transition. The
counter-intuitive unemployment effect applies only to non-economic migration, as does the
9 Due to the limited availability of regional data prior to 1990, I estimated the models testing for regional effects only on spells that began in January 1990 or later.

19
predictable effect of high murder rates. Once again, these results point to the value of
distinguishing empirically between economic and non-economic forms of migration.
Benefits of migration?
Another question that can be addressed most effectively using individual-level data is
whether economic migration actually improves the labor market fortunes of migrants. It is risky
to make inferences about the general impact on the basis of the observed patterns in the data
because of obvious endogeneity of migration to its returns: if individuals act rationally, then
those who actually migrate are precisely those who are most likely to benefit from doing so;
therefore, we are likely to overestimate its positive benefits. The problem is compounded in our
current application, because many migrations may have resulted from job offers, rather than vice
versa, and our data do not permit us to distinguish these two situations. Given the complexity of
various statistical approaches to deal with this issue and the lack of other empirical evidence
bearing on the question, I limit myself here to descriptively analyzing the “effects” of recent
economic migration using regressions for different labor market outcomes. I operationalize
“economic migrants” as those who migrated for economic reasons within the last year.
Hazard models for employment entry estimated on spells comprised by, respectively,
unemployed respondents and non-participants show evidence of superior outcomes for economic
migrants (Table 6). Controlling for age, education, gender, duration in current oblast, and
period, economic migrants have substantially higher rates of getting new jobs than non-migrants
do: the hazard ratio among the unemployed is roughly 2.0 for the unemployed and 3.0 for non-
participants, implying that migrants are, respectively, twice and three times more likely to get
jobs than non-migrants with the same values on the other variables. These findings should be
20
TABLE 5
Any Migration
B SE B SE B SELogged wages (1991 rubles) .094 .391 .322 .331Logged wages*1992-1994 -1.047 * .562 -1.088 ** .474 -.848 ** .416Unemployment rate -.053 .038 -.065 ** .033 -.068 ** .031Unemployment rate*1992-1994 -.099 .154 .007 .129Murder rate .516 ** .200 .473 ** .205 .373 ** .157Male life expectancy .002 .076 .080 .062Small business employment rate .010 .020 -.017 .023
Economic Migration
B SE B SE B SELogged wages (1991 rubles) -.374 .721 -.071 .727Logged wages*1992-1994 -2.505 ** 1.099 -2.485 ** 1.108 -2.347 ** .852Unemployment rate .090 .082 .102 * .054 .080 * .044Unemployment rate*1992-1994 -.247 .306 -.154 .321Murder rate -.120 .399 -.108 .371Male life expectancy -.268 * .139 -.141 .112Small business employment rate .091 ** .037 .028 .038
Non-economic Migration
B SE B SE B SELogged wages (1991 rubles) .260 .471 .417 .352Logged wages*1992-1994 -.695 .668 -.787 .538 Unemployment rate -.108 ** .034 -.135 ** .037 -.133 ** .036Unemployment rate*1992-1994 -.035 .172 .070 .140Murder rate .715 ** .236 .649 ** .248 .658 ** .236Male life expectancy .095 .089 .148 * .077 .131 * .075Small business employment rate -.018 .022 -.029 .026
*p < .05, one-tailed **p < .05, two-tailed
Unadjusted, full Adjusted, full Adjusted, final
Note: Table entries are coefficients from hazard models for different types of inter-regional migration estimated on person-months from 1992-2001. All regional variables are centered at the annual mean for all regions. Unadjusted models contain only dummy variables for period. Adjusted models contain all individual-level and locality variables included in the models presented in Table 4.
Unadjusted, full
Effects of regional characteristics on individual internal migration in Russia, 1992-2001
Unadjusted, full Adjusted, full Adjusted, final
Adjusted, full Adjusted, final

21
TABLE 6Hazard models for employment entry
Sample:B SE B SE
Economic migrant (within one year) .724 ** .352 1.114 ** .375
Woman -.378 ** .115 -1.460 ** .148Age (-18) -.012 * .007 -.015 * .008Education (General Secondary) University .461 ** .171 1.174 ** .235 Specialized secondary .235 .173 .530 ** .226 Vocational .240 .161 .230 .242 Less than secondary .134 .231 .128 .321Regional unemployment -.044 ** .018 -.034 * .019Years in current oblast .005 .005 -.011 ** .006Year (1985)
1986 -.950 ** .414 .342 .2651987 -.299 .264 .421 .2911988 -.811 ** .385 -.088 .2461989 -.636 * .346 -.222 .2881990 -.813 ** .384 .137 .2621991 -.554 .339 -.265 .2741992 -.798 ** .314 .006 .2561993 -1.029 ** .306 -.154 .2731994 -.969 ** .306 -.583 ** .2541995 -1.104 ** .308 -.670 ** .2891996 -.939 ** .295 -.651 ** .2771997 -1.154 ** .317 -.792 ** .2821998 -1.391 ** .307 -.782 ** .2921999 -1.213 ** .302 -.697 ** .2712000 -1.238 ** .303 -.647 ** .2692001 -1.153 ** .297 -.012 .257
Constant -1.864 ** .308 -1.771 ** .311
N respondents N eventsPerson months at riskLog-likelihood
*p < .05, one-tailed **p < .05, two-tailed
Unemployed Not in Labor Force
28532 401931491 1571
1404 15771601 1805

22
interpreted cautiously, in light of the potential endogeneity: they should not be taken to indicate
that others will benefit in the same fashion from migrating. But at least they provide some
evidence that Russians who have migrated internally for economic reasons have, on average,
enjoyed better labor market opportunities than non-migrants in a similar position. The
government might use this information in campaigns to promote more economic migration. I
also tested for “effects” of economic migration on the occupational earnings associated with new
jobs and on earnings at the time of the survey using OLS and fixed effects regressions. In
neither case did economic migrant status have a statistically significant effect.
Conclusion
The analysis of individual-level migration behavior yields several new insights into
internal migration in contemporary Russia. First, only about 25% of the migrations undertaken
by Russians since 1985 were motivated by economic incentives. This underscores the need to
distinguish empirically and theoretically between economic and non-economic migration when
analyzing migration patterns in Russia (and, presumably, elsewhere). Although the economic
explanation of migration is the most developed and commonly applied theory, it may account for
only a fraction of the migrations that take place. The broader economic impact of internal
migration will depend on the patterns and volume of both economic and non-economic
migration. Future research should analyze these two types of migration separately, as they
respond to different individual, local, and regional influences. Broadly speaking, economic
migration within Russia is shaped by the factors identified by economic theories of migration;
non-economic migration less so. Since non-economic migrations account for the lion’s share of
migrations, more theorizing and empirical study of them would be useful to advance theoretical

23
understanding of migration, as well as the goal of formulating policies to increase the overall
levels of migration.
Second, the rates of overall migration and of economic migration were not demonstrably
affected by the collapse of the Soviet Union and the attendant economic shocks and political
changes. Nor were the effects of individual characteristics on migration behavior. This suggests
that severe barriers to internal migration remain in Russia. These barriers may take the form of
continuing residency restrictions, housing and credit shortages, poor information, or weak
migrant networks.10 Additional research on these barriers is required to determine which are the
most significant and to develop policies to overcome them: otherwise, Russia will fail to enjoy
the economic benefits that higher levels of economically-motivated internal migration might
offer. From the perspective of migration theory, it will be helpful to gain an empirical
understanding of why exactly Russian migration behavior appears relatively impervious to
change in response to severe exogenous shocks.
Finally, there is some evidence, albeit tentative, that economic migration does typically
improve the labor market opportunities of migrants. In particular, non-employed migrants have
greater probabilities of securing employment than those who do not migrate. More data and
more sophisticated statistical modeling (to control for the endogeneity of migration to labor
market opportunities) are necessary before this finding can be considered definitive. However, it
may prove useful for the development of campaigns to promote economic migration.
10 Alternatively, the Russian labor market may be in inter-regional equilibrium, whereby non-economic amenities and disamenities offset wage and employment differentials. This seems highly unlikely, however.

24
References
Andrienko, Yuri and Sergei Guriev. 2004. “Determinants of Interregional Mobility in Russia: Evidence From Panel Data.” Economics of Transition. 12: 1-27.
__________. 2005. “Understanding Migration in Russia: A Policy Note.” Prepared for the
World Bank. Bond, Andrew. 1994. “Outmigration, Economic Dislocation, and Reassessment of the Labor
Resource in the Russian Far North.” Post-Soviet Geography. 5:299-308. Buckley, Cynthia. 1995. “The Myth of Managed Migration: Migration Control and Market in
the Soviet Period.” Slavic Review. 54:896-916. Clarke, Simon. 1998. “Structural Adjustment Without Mass Unemployment? Lessons from
Russia.” Pp.9-86 in Simon Clarke (ed.) Structural Adjustment Without Mass Unemployment? Lessons From Russia.” Cheltenham: Edward Elgar.
Earle, John S. and Klara Z. Sabirianova. 2002. “How Late to Pay? Understanding Wage Arrears
in Russia.” Journal of Labor Economics. 20: 661-707. Gerber, Theodore P. Forthcoming. “Regional Economic Performance and Net Migration Rates
in Russia, 1993-2001.” International Migration Review. Gerber, Theodore P. and Michael Hout. 1998. “More Shock Than Therapy: Market Transition,
Employment, and Income in Russia, 1991-1995.”American Journal of Sociology.104:1-50.
Goskomstat Rossii. 1998. Regiony Rossii, 1998. Moskva: Goskomstat. Goskomstat Rossii. 2000. Sotsial’noe Polozhenie i Uroven’ Zhizni Naseleniia Rossii. Moskva:
Goskomstat. ___________. 2002. Regiony Rossii, 2002. Moskva: Goskomstat. CD-ROM version. Greenwood, Michael J.. 1997. “Internal Migration in Developed Countries.” Pp. 648-720 in
Mark R. Rozenzweig and Oded Stark. Handbook of Population and Family Economics. Vol. 2. New York: Elsevier.
Heleniak, Timothy. 1997. “Internal Migration in Russia During the Economic Transition.” Post-
Soviet Geography and Economics. 38:81-104 ___________. 1999. “Out-Migration and De-Population of the Russian North During the
1990s.” Post-Soviet Geography and Economics. 40:155-205. Kornai, Janos. 1981. The Economics of Shortage. Amsterdam: North Holland.

25
Lee, Lisa and Raymond Struyk. 1996. “Residential Mobility in Moscow During the Transition.”
International Journal of Urban and Regional Research. 20: 656-70. Long, Larry. 1992. “Changing Residence: Comparative Perspectives on its Relationship to Age,
Sex, and Marital Status.” Population Studies. 46:141-58. Massey, Douglas S. and Kristin E. Espinosa. 1997. “What’s Driving Mexico-US Migration? A
Theoretical, Empirical, and Policy Analysis.” American Journal of Sociology.102:939-99.
Massey, Douglas S., Joaquin Arango, Graeme Hugo, Ali Kouauci, Adela Pellegrino, and
J.Edward Taylor. Worlds in Motion: Understanding International Migration at the End of the Millenium. Oxford: Clarendon Press.
Matthews, Mervyn. 1993. The Passport Society: Controlling Movement in Russia and the
USSR. Boulder: Westview. Mitchneck, Beth. 1991. “Geographic and Economic Determinants of Interregional Migration in
the USSR, 1968-1985.” Soviet Geography. 32:168-89. Mitchneck, Beth and David A. Plane. 1995a. “Migration Patterns During a Period of Political
and Economic Shocks in the Former Soviet Union: A Case Study of Yaroslavl’ Oblast.” Professional Geographer. 47:17-30.
___________. 1995b. “Migration and the Quasi-labor Market in Russia.” International Regional
Science Review. 18:267-88. Sandefur, Gary D. and Wilbur J. Scott. 1981. “A Dynamic Analysis of Migration: An
Assessment of the Effects of Age, Family and Career Variables.” Demography. 18:355-68.
Shaw, Denis. 1999. Russia in the Modern World: A New Geography. Oxford: Blackwell. Sutherland, Douglas and Philip Hanson. 1996. “Structural Change in the Economies of Russia's
Regions.” Europe-Asia Studies. 48:367-92. Todaro, Michael P. 1969. “A Model of Labor Migration and Urban Unemployment in Less
Developed Countries.” American Economic Review. 59: 138-48. Van Selm, Bert. 1998. “Economic Performance in Russia’s Regions.” Europe-Asia Studies.
50:603-18. Zayonchkovskaya, Zhanna. 1999. “Recent Migration Trends in Russia.” Pp. 107-30 in George
J. Demko, Grigory Ioffe, and Zhanna Zayonchkovskaya (eds.) Population Under Duress: The Geodemography of Post-Soviet Russia. Boulder: Westview.