Deterioration Greenhouse Gas - EPA Archives · Deterioration Greenhouse Gas Permit Application for...
154
Transcript of Deterioration Greenhouse Gas - EPA Archives · Deterioration Greenhouse Gas Permit Application for...


Prevention of Significant Deterioration Greenhouse Gas Permit Application for the Tenaska Roans Prairie Generating Station
Prepared for Tenaska Roans Prairie Partners, LLC Grimes County, Texas
July 22, 2013
www.erm.com
Texas Registered Engineering Firm F-2393
Prevention of Significant Deterioration Greenhouse Gas Permit Application for the Tenaska Roans Prairie Generating Station
July 22, 2013
Project No. 0189555 Tenaska Roans Prairie Generating Station Peter T. Belmonte, P.E. Partner-in-Charge Siddharth (Sid) Rajmohan Project Manager Environmental Resources Management 15810 Park Ten Place, Suite 300 Houston, Texas 77084-5140 T: 281-600-1000 F: 281-600-1001

Environmental Resources Management ii 0189555\A5469 Final Tenaska GHG PSD Rpt.docx Texas Registered Engineering Firm F-2393
TABLE OF CONTENTS
1.0 INTRODUCTION 1
1.1 PROJECT PURPOSE AND DESCRIPTION 1 1.2 APPLICATION ORGANIZATION 2
2.0 SITE LOCATION AND PROCESS DESCRIPTION 3
2.1 SITE LOCATION 3 2.2 PROCESS DESCRIPTION 3
3.0 REGULATORY REVIEW 7
3.1 FEDERAL REGULATIONS 7 3.1.1 Federal Major New Source Review 7 3.1.2 Compliance Assurance Monitoring (CAM) 40 CFR 64 7 3.1.3 Mandatory GHG Reporting Rule 8
4.0 BEST AVAILABLE CONTROL TECHNOLOGY (BACT) ANALYSIS 9
4.1 SUMMARY OF PROPOSED BACT 10 4.2 BACT FOR COMBUSTION TURBINES 11
4.2.1 Step 1: Identify All Available Control Technologies 11 4.2.2 Step 2: Eliminate Technically Infeasible Options 14 4.2.3 Step 3: Rank Remaining Control Technologies 17 4.2.4 Step 4: Evaluate and Document Remaining Control
Technologies 17 4.2.5 Step 5: Select BACT 20
4.3 NATURAL GAS FUGITIVE EMISSIONS 25 4.3.1 Step 1: Identify All Available Control Technologies 25 4.3.2 Step 2: Eliminate Technically Infeasible Options 25 4.3.3 Step 3: Rank Remaining Control Technologies 25 4.3.4 Step 4: Evaluate and Document Remaining Control
Technologies 25 4.3.5 Step 5: Select BACT 25
4.4 DIESEL FIRED EMERGENCY ENGINES 26 4.4.1 Step 1: Identify All Available Control Technologies 26 4.4.2 Step 2: Eliminate Technically Infeasible Options 27 4.4.3 Step 3: Rank Remaining Control Technologies 27 4.4.4 Step 4: Evaluate and Document Remaining Control
Technologies 27 4.4.5 Step 5: Select BACT 27
4.5 FUGITIVE SF6 EMISSIONS FROM ELECTRICAL COMPONENTS 28 4.5.1 Step 1: Identify All Available Control Technologies 28 4.5.2 Step 2: Eliminate Technically Infeasible Options 28 4.5.3 Step 3: Rank Remaining Control Technologies 28

Environmental Resources Management iii 0189555\A5469 Final Tenaska GHG PSD Rpt.docx Texas Registered Engineering Firm F-2393
4.5.4 Step 4: Evaluate and Document Remaining Control Technologies 29
4.5.5 Step 5: Select BACT 29
5.0 GREENHOUSE GAS EMISSION CALCULATIONS 30
5.1 POTENTIAL EMISSIONS CALCULATIONS 30 5.1.1 Combustion Turbines 30 5.1.2 Diesel Fired Emergency Engines 31 5.1.3 Fugitive SF6 Emissions from Electrical Equipment 32 5.1.4 GHG Emissions from Fugitive Natural Gas Losses due to
Leaks and Equipment Maintenance 33 5.1.5 Summary of GHG Emissions from Project 33
6.0 ADDITIONAL REQUIREMENTS UNDER PSD 35
6.1 IMPACT EVALUATION PURSUANT TO FEDERAL ACTION 35 6.1.1 Federal Endangered Species Act 35 6.1.2 National Historic Preservation Act 35

Environmental Resources Management iv 0189555\A5469 Final Tenaska GHG PSD Rpt.docx Texas Registered Engineering Firm F-2393
LIST OF APPENDICES A PERMIT APPLICATION FORMS B EMISSION RATE CALCULATIONS C RECENTLY ISSUED PERMITS AND PENDING APPLICATIONS D SUPPORTING DOCUMENTATION E CONFIDENTIAL SUPPORTING DOCUMENTATION LIST OF FIGURES 2-1 AREA MAP 2-2 USGS MAP 2-3 PROCESS FLOW DIAGRAM
LIST OF TABLES 3-1 PSD APPLICABILITY SUMMARY TABLE 4-1 SUMMARY OF PROPOSED BACT FOR COMBUSTION TURBINES 4-2 SUMMARY OF PROPOSED BACT FOR NATURAL GAS FUGITIVE
EMISSIONS 4-3 SUMMARY OF PROPOSED BACT FOR EMERGENCY ENGINES 4-4 SUMMARY OF PROPOSED BACT FOR FUGITIVE SF6 EMISSIONS 4-5 EMISSIONS OF CO2 FROM SOLID AND GASEOUS FUELS AVAILABLE FOR
USE IN COMBUSTION TURBINES 4-6 RANKING OF TECHNICALLY FEASIBLE EMISSIONS REDUCTION
OPTIONS OF GREENHOUSE GASES FROM COMBUSTION TURBINES 4-7 MEA CAPTURE COST ESTIMATE 4-8 RANKING OF TECHNICALLY FEASIBLE EMISSIONS REDUCTION
OPTIONS OF GREENHOUSE GASES FROM NATURAL GAS FUGITIVES 4-9 RANKING OF TECHNICALLY FEASIBLE EMISSIONS REDUCTION
OPTIONS OF GREENHOUSE GASES FROM EMERGENCY ENGINES 4-10 RANKING OF TECHNICALLY FEASIBLE EMISSIONS REDUCTION
OPTIONS OF GREENHOUSE GASES FROM FUGITIVE SF6 EMISSIONS 5-1 TURBINE MAXIMUM HEAT INPUT CAPACITIES 5-2 NATURAL GAS-FIRED TURBINE GHG EMISSION FACTORS 5-3 GLOBAL WARMING POTENTIALS 5-4 TOTAL GHG (CO2E) EMISSIONS FROM THE NATURAL GAS TURBINES 5-5 GHG EMISSIONS FROM THE NATURAL GAS BURNER 5-6 EMERGENCY ENGINE GHG EMISSION FACTORS 5-7 GHG EMISSIONS FROM THE EMERGENCY ENGINES 5-8 GLOBAL WARMING POTENTIAL OF SULFUR HEXAFLUORIDE 5-9 GHG EMISSIONS FROM THE HIGH VOLTAGE ELECTRICAL EQUIPMENT 5-10 SUMMARY OF POTENTIAL GHG (CO2E) EMISSIONS FROM THE TENASKA
FACILITY

Environmental Resources Management 1 0189555\A5469 Final Tenaska GHG PSD Rpt.docx Texas Registered Engineering Firm F-2393
1.0 INTRODUCTION
Tenaska Roans Prairie Partners, LLC (TRPP) is submitting this permit application to authorize the construction of a peaking power generation facility near Shiro in Grimes County, Texas. The Roans Prairie Generating Station (RPGS) will provide up to 694 nominal gross megawatts (MW) of power to supplement the Electric Reliability Council of Texas (ERCOT) power grid during peak power demand. TRPP is proposing three simple cycle gas-fired turbines for power generation, one diesel-fired emergency generator and one diesel-fired fire pump engine. Per the Greenhouse Gas (GHG) tailoring rule published in the Federal Register on June 3, 2010, new sources having the potential to emit (PTE) GHG emissions 100,000 tons per year (tpy) or more of carbon dioxide equivalents (CO2e) are subject to Prevention of Significant Deterioration (PSD) review under 40 CFR 52.21. Although the state of Texas is the delegated authority for New Source Review (NSR) and PSD under its State Implementation Plan (SIP) for criteria air pollutants, it has yet to revise its SIP to implement the GHG Tailoring Rule. On December 23, 2010, the United States Environmental Protection Agency (USEPA) signed the Federal Implementation Plan (FIP) authorizing the USEPA Region 6 to issue permits in Texas until approval of a SIP. The PTE from the Tenaska Roans Prairie Generating Station exceeds 100,000 tpy CO2e. Therefore, the project is subject to PSD review for GHG emissions, and TRPP submits this application for a GHG PSD permit. This application includes a description of project scope, calculation of GHG emissions, and review of Best Available Control Technology (BACT). Further, the project triggers PSD for criteria air pollutants. As such, TRPP will be submitting an application for an air quality permit for construction to the Texas Commission on Environmental Quality (TCEQ) and a copy of this application will be submitted to USEPA Region 6 when available.
1.1 PROJECT PURPOSE AND DESCRIPTION The Roans Prairie Station is being designed as a natural gas-fueled power generating facility to serve the peaking segment of the ERCOT wholesale power market. This market segment is characterized by increases in daytime demand during the summer months, and relatively infrequent, high-demand “peak” periods that occur when demand is extraordinarily high and supply decreases substantially due to plants going off-line (including renewable wind resources). For example, between May 2011 and March 2013, there were more than 700 instances where the ERCOT load increased by more than 1,000 MW in less than 15 minutes. The high penetration of renewables in ERCOT also creates volatility and intermittency. During this same period, there were 100 instances per year where wind generation decreased by 400 MW or more in 15 minutes. Natural gas fueled peaking units, which are capable of quickly providing supplemental power to the electric grid, are ideal for providing generation and load balancing against unanticipated or uncontrollable changes in load or generation. Peaking
Environmental Resources Management 2 0189555\A5469 Final Tenaska GHG PSD Rpt.docx Texas Registered Engineering Firm F-2393
plants have traditionally been configured with simple cycle combustion units, and there is ample operational evidence showing that they can reliably meet peaking demand. To meet this peak power demand, TRRP is proposing a power generation system that will include either three Siemens SGT6-5000F (5ee), GE 7FA.05, or GE 7FA.04 simple cycle turbines. Each unit will be limited to 33% capacity factor, approximately equivalent to 2,920 hours per year of operation at full load. Peaking plants have traditionally been configured with simple cycle combustion units because they can achieve the necessary output quickly and can be shut down quickly when the peak demand abates. Although other technologies for producing the necessary power are available, they cannot meet demand quickly, are not designed for rapid load cycling, or are not cost-effective for the desired business purpose. In addition, the Roans Prairie Station will operate two emergency diesel-fired engines, one each to provide power for plant control systems in case of grid power loss and operate a fire pump in case of an emergency. As a simple cycle unit, this facility does not operate a steam turbine and has no requirements for a heat rejection system.
1.2 APPLICATION ORGANIZATION This Technical Support Document and the enclosed application forms in Appendix A constitute the application for a permit to construct under 40 CFR 52.21 for the proposed Roans Prairie Generating Station. Please note that confidential information (Appendix E) is being submitted to the USEPA Region 6 under a separate cover. The remainder of the application is organized as follows:
Section 2.0 – Site Location, Process Description, and Area Map
Section 3.0 – Federal Applicability to the Proposed Project
Section 4.0 – BACT and Lowest Achievable Emission Rate (LAER) Analyses
Section 5.0 – Emission Rate Calculations
Section 6.0 – Additional Requirements under PSD
Appendix A – Permit Application Forms
Appendix B – Emission Rate Calculations and Gas Turbine Data
Appendix C – Recently Issued Permits
Appendix D – Supporting Documentation

Environmental Resources Management 3 0189555\A5469 Final Tenaska GHG PSD Rpt.docx Texas Registered Engineering Firm F-2393
2.0 SITE LOCATION AND PROCESS DESCRIPTION
2.1 SITE LOCATION
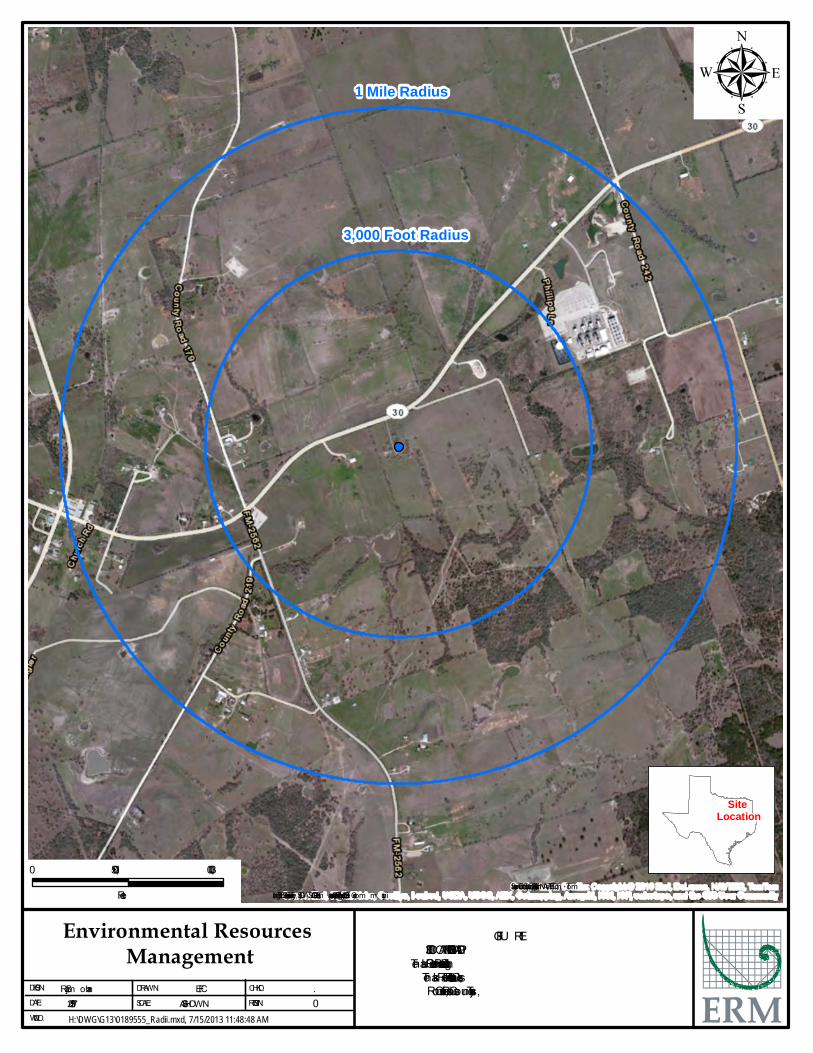
The location of the proposed project is in Grimes County, Texas near Shiro. This location was chosen because it is proximate to existing natural gas supply and electricity transmission lines near the target market. The location is shown on the area and USGS maps provided as Figures 2-1 and 2-2, respectively.
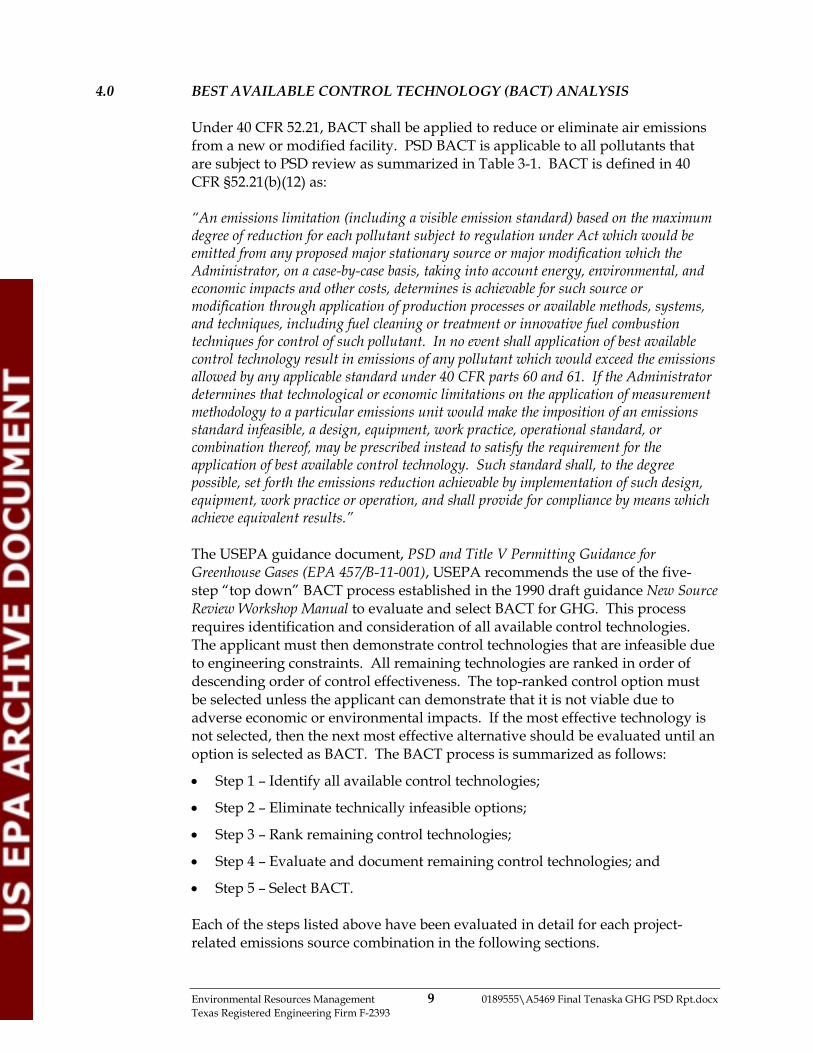
2.2 PROCESS DESCRIPTION The Roans Prairie Station project will be a peaking power production facility which will include three gas turbines, one diesel-powered emergency generator, and one diesel-powered fire pump engine. Gas Turbine (GT): The three Siemens SGT6-5000F(5ee), GE 7FA.05, or GE 7FA.04 simple cycle turbines are the current basis for the process design. The gas turbines will combust natural gas exclusively and will be capable of generating a total nominal gross output of 507 to 694 MWe, depending upon turbine model and ambient conditions. Each combustion turbine will utilize low NOX burners to minimize NOX emissions. Two Diesel-Fired Emergency Engines: Two diesel fired emergency engines will be installed. One of these engines (2,937 hp) will be used to provide emergency electric power for control systems, and the other (575 hp) will be used to power a firewater pump. Process Flow Diagram for the facility is presented in Figure 2-3.
0 1,500 3,000
Feet
FIGU RE 13000 FOOT AND 1 MILE RADII MAP
Tenask a Roan’s Prairie Generating StationTenask a Roans's Praire Partners, LLCRoans Praire, Grim es County , TexasS. Rajm ohan
7/15/2013EFC
AS SHOWN.0
H:\DWG\G13\0189555_Radii.mxd, 7/15/2013 11:48:48 AM
µ
W.O.NO.:DATE:DESIGN: DRAWN:
SCALE:CHKD.:REVISION:
Environmental Resources Management
Site Location
1 Mile Radius
3,000 Foot Radius
Service Lay er Cred its: Copy right:© 2013 Esri, DeLorm e, NAVTEQ, Tom TomSource: Esri, DigitalGlobe, GeoEy e, i-cubed , U SDA, U SGS, AEX, Getm apping, Aerogrid , IGN, IGP, swisstopo, and the GIS U ser Com m unity

0 1,500 3,000
Feet
FIGURE 2SITE LOCATION
Ten aska Ro an ’s Prairie Gen eratin g Statio nTen aska Ro an s's Praire Partn ers, LLCRo an s Praire, Grim es Co un ty, TexasS. Rajm o h an
7/15/2013EFC
AS SHOW N.0
H:\DWG\G13\0189555_Site.mxd, 7/15/2013 11:51:42 AM
µ
W .O.NO.:DATE:DESIGN: DRAW N:
SCALE:CHKD.:REVISION:
Environmental Resources Management
Site Location
Service Layer Credits: Co p yrigh t:© 2013 Natio n al Geo grap h ic So ciety, i-cubed
SITE

Diesel Generator
T1
T2
T3
Stack
SF6 Circuit
Stack
POC
Stack
POC
Electricity Out
CO2e
EPN: CBFUG
FIN: CBFUG
FIN: TURB3
FIN: TURB2
FIN: TURB1
Natural Gas
Simple-Cycle Turbines
POC
Diesel Fire Pump
POC
EPN: FWPUMP
FIN: FWPUMP
G:\wo\Tenaska\0189555\A5469 Fig 2-3 PFD.vsd, 7/18/2013
EPN: EMGEN
FIN: EMGEN
EPN: TURB3
EPN: TURB2
EPN: TURB1
POC
FIGURE 2-3PROCESS FLOW DIAGRAM
Tenaska Roans Prairie Partners, LLCGrimes County, Texas

Environmental Resources Management 7 0189555\A5469 Final Tenaska GHG PSD Rpt.docx Texas Registered Engineering Firm F-2393
3.0 REGULATORY REVIEW
The proposed project will be subject to federal and state environmental laws and regulatory requirements as outlined in the following sections. Only those regulations that are potentially applicable to the proposed project were reviewed in this application. On May 3, 2011, the USEPA promulgated a Federal Implementation Plan (FIP) for Texas in which USEPA assumed the role of PSD permitting authority for large GHG-emitting sources in Texas in accordance with the thresholds established under the Tailoring Rule, which USEPA published on June 3, 2010. All other pollutants are regulated by the TCEQ under the SIP and are beyond the scope of this application.
3.1 FEDERAL REGULATIONS 3.1.1 Federal Major New Source Review
The GHG PSD Tailoring rule defines a new major source of GHG emissions as emitting 100,000 tpy of CO2e and 100 tpy/250 tpy (depending on the source category) on a mass basis. A major modification under the rule is defined as an emission increase and net emissions increase of 75,000 tons or more of GHGs on a CO2e basis and greater than zero tpy of GHGs on a mass basis. [40 CFR 52.21(b)(49)(iv)] Table 3-1 shows the estimated project potential to emit (PTE) for each PSD-regulated GHG. The project PTE of each pollutant was compared to its PSD significance threshold to evaluate the applicability of PSD for each pollutant. The project is a new major source with emissions greater than 100,000 tpy CO2e and 100 tpy of GHGs on a mass basis.
3.1.2 Compliance Assurance Monitoring (CAM) 40 CFR 64
The provisions of 40 CFR Part 64 (Compliance Assurance Monitoring [CAM]) apply to each Pollutant-Specific Emissions Unit (PSEU) when it is located at a facility that is required to obtain Part 70 or 71 permit, and the PSEU meets all of the following criteria:
1. The unit is subject to an emission limitation or standard;
2. The unit uses an active control device to achieve compliance with an emission limitation or standard; and
3. The unit has potential pre-control device emissions in the amount of tons per year required to classify that unit as a major source under Part 70 or 71.
The proposed turbines and engines will not use active control devices to control GHG emissions. Therefore, CAM requirements will not apply to these pollutant emissions.

Environmental Resources Management 8 0189555\A5469 Final Tenaska GHG PSD Rpt.docx Texas Registered Engineering Firm F-2393
3.1.3 Mandatory GHG Reporting Rule Under the Mandatory Reporting Rule (40 CFR Part 98), beginning in 2010 facilities with fuel burning equipment with actual CO2e emissions greater than or equal to 25,000 metric tons per year must submit an annual report for all source categories for which calculation methodologies are provided in subparts C of the rule. The PTE of GHG exceeds the reporting threshold. Therefore, TRPP will report GHG emissions under 40 CFR Part 98.
TABLE 3-1: PSD APPLICABILITY SUMMARY TABLE
Pollutant
Project Emissions Increases Siemens Turbines
(tpy)
Project Emissions Increases
GE 7FA.05 Turbines
(tpy)
Project Emissions Increases
GE 7FA.04 Turbines
(tpy)
PSD Significance Threshold
(tpy)
PSD Triggered? (Yes/No)
GHG (CO2e) 1,279,559 1,246,107 1,152,224 100,000 Yes
CO2 1,278,052 1,244,632 1,150,839 100 Yes
CH4 26.99 26.37 24.64 100 Yes
N2O 2.36 2.30 2.12 100 Yes
Environmental Resources Management 9 0189555\A5469 Final Tenaska GHG PSD Rpt.docx Texas Registered Engineering Firm F-2393
4.0 BEST AVAILABLE CONTROL TECHNOLOGY (BACT) ANALYSIS
Under 40 CFR 52.21, BACT shall be applied to reduce or eliminate air emissions from a new or modified facility. PSD BACT is applicable to all pollutants that are subject to PSD review as summarized in Table 3-1. BACT is defined in 40 CFR §52.21(b)(12) as: “An emissions limitation (including a visible emission standard) based on the maximum degree of reduction for each pollutant subject to regulation under Act which would be emitted from any proposed major stationary source or major modification which the Administrator, on a case-by-case basis, taking into account energy, environmental, and economic impacts and other costs, determines is achievable for such source or modification through application of production processes or available methods, systems, and techniques, including fuel cleaning or treatment or innovative fuel combustion techniques for control of such pollutant. In no event shall application of best available control technology result in emissions of any pollutant which would exceed the emissions allowed by any applicable standard under 40 CFR parts 60 and 61. If the Administrator determines that technological or economic limitations on the application of measurement methodology to a particular emissions unit would make the imposition of an emissions standard infeasible, a design, equipment, work practice, operational standard, or combination thereof, may be prescribed instead to satisfy the requirement for the application of best available control technology. Such standard shall, to the degree possible, set forth the emissions reduction achievable by implementation of such design, equipment, work practice or operation, and shall provide for compliance by means which achieve equivalent results.” The USEPA guidance document, PSD and Title V Permitting Guidance for Greenhouse Gases (EPA 457/B-11-001), USEPA recommends the use of the five-step “top down” BACT process established in the 1990 draft guidance New Source Review Workshop Manual to evaluate and select BACT for GHG. This process requires identification and consideration of all available control technologies. The applicant must then demonstrate control technologies that are infeasible due to engineering constraints. All remaining technologies are ranked in order of descending order of control effectiveness. The top-ranked control option must be selected unless the applicant can demonstrate that it is not viable due to adverse economic or environmental impacts. If the most effective technology is not selected, then the next most effective alternative should be evaluated until an option is selected as BACT. The BACT process is summarized as follows:
Step 1 – Identify all available control technologies;
Step 2 – Eliminate technically infeasible options;
Step 3 – Rank remaining control technologies;
Step 4 – Evaluate and document remaining control technologies; and
Step 5 – Select BACT. Each of the steps listed above have been evaluated in detail for each project-related emissions source combination in the following sections.

Environmental Resources Management 10 0189555\A5469 Final Tenaska GHG PSD Rpt.docx Texas Registered Engineering Firm F-2393
4.1 SUMMARY OF PROPOSED BACT
A summary of BACT limits and technologies proposed in this permit application are summarized in Tables 4-1 to Table 4-4. TABLE 4-1: Summary of Proposed BACT for Combustion Turbines
Pollutant Limit
(Siemens) Limit
(GE 7FA.05) Limit
(GE 7FA.04)
Control Technology/
Standard
Averaging Time /
Compliance Method
CO2 (lb CO2/MWhgross)
1,363 1,356 1,355 Good combustion practices, operations and maintenance Fuel Selection
720 hour rolling average/fuel monitoring / Records
CO2e (tpy) 1,279,088 1,245,636 1,151,754 12 month rolling average/Fuel Monitoring
TABLE 4-2: Summary of Proposed BACT for Natural Gas Fugitives
Pollutant Limit Control
Technology/Standard Averaging Time /
Compliance Method CO2e 70 tpy (12 month
rolling average) AVO1, maintenance plan
12 month rolling average/ Maintenance and AVO plan documentation
1 AVO (audio/visual/olfactory)
TABLE 4-3: Summary of Proposed BACT for Emergency Engines
Pollutant Limit Control
Technology/Standard Averaging Time /
Compliance Method CO2 163 lb/MMBtu
(HHV) Good combustion practices, operation and maintenance
12 month rolling average / fuel monitoring

Environmental Resources Management 11 0189555\A5469 Final Tenaska GHG PSD Rpt.docx Texas Registered Engineering Firm F-2393
TABLE 4-4: Summary of Proposed BACT for Fugitive SF6 Emissions
Pollutant Limit Control
Technology/Standard Averaging Time /
Compliance Method CO2e 210 tpy (12 month
rolling average) AVO, maintenance program, state-of-the-art circuit breakers
12 month rolling average / Maintenance and AVO program documentation
4.2 BACT FOR COMBUSTION TURBINES
4.2.1 Step 1: Identify All Available Control Technologies
TRPP performed a search of the USEPA RACT/BACT/LAER Clearinghouse (RBLC) for natural-gas fired turbines and recently issued PSD permits for GHG emissions from gas turbines. A summary of previous BACT determinations are provided in Table C-1 in Appendix C. While all gas fired turbines were considered and included in this search for completeness, only comparable simple cycle peaking power production facilities were considered in the final BACT analysis. TRPP reviewed the GHG BACT analysis of the Pio Pico Energy Center which includes three 100 MW GE LMS100, aero-derivative, simple cycle turbines. Therein, USEPA Region 9 reviewed the thermal efficiency of several power frames with thermal efficiencies ranging from 9,254 to 9,790 BtuHHV/kW-hrgross, and established a BACT limit of 1,328 lb CO2/MW-hr on a 720 rolling hour basis. This efficiency limit was based on the thermal efficiency of the turbines at 50% load, including a 7.4% factor to account for non-standard conditions, site variability, and equipment degradation over time. Similarly, the York Generating Station was recently issued a permit by the Pennsylvania Department of Environmental Protection (PaDEP) for two aero-derivative LM6000 units rated at a combined heat input of 634 MMBtu/hr. PaDEP established a 1,330 lb CO2/MW-hr limit commensurate with the Region 9 permit for Pio Pico. TRPP also reviewed the GHG BACT analysis of the Montana Power Station which includes four 100 MW GE LMS100, aero-derivative, simple cycle turbines. The proposed BACT limits for the facility are an efficiency limit of 1,194 lb CO2/MW-hr on a 365 day rolling average, and an annual limit on CO2e emissions. This proposed limit was based on the thermal efficiency at 50% load, but appears to be artificially low, as it does not take into account performance degradation, site variability, or variability in fuel carbon density. As such, TRPP does not consider the proposed limit on the Montana station a viable comparison, until those factors listed above are taken into account. The Pio Pico and EPE Montana projects are much smaller, at 300 MW and 400 MW, respectively, than the proposed TRPGS at 660 MW (all nominal values). Each of these projects identified specific needs for relatively small incremental capacity to respond to very localized needs, including up to four daily starts per turbine. Thus, smaller turbines may be more appropriate for

Environmental Resources Management 12 0189555\A5469 Final Tenaska GHG PSD Rpt.docx Texas Registered Engineering Firm F-2393
those projects. In contrast, the RPGS is being designed to provide larger amounts of peaking power with longer run times without specific service territory or contract restraints. Based upon this design model, Section 4.2.4.2 demonstrates the proposed turbines have the lowest cost of avoided CO2 emissions.
4.2.1.1 Inherently Low Emitting Design High Efficiency Generators There are five general categories of inherently low emitting design sources for the generation of electricity.
Combined Cycle Frame Gas Turbines
Conventional combined cycle frame turbines combine a simple cycle turbine with a heat recovery steam generator (HRSG) and steam turbine to generate electricity. These turbines are designed primarily to provide base load power and require start times ranging from one to six hours. They are not designed to be cycled up and down repeatedly as is required for a peaking unit. Operating in this manner would cause significant maintenance and operational issues. Due to these design limitations, they do not meet the business purpose of peaking power.
Combined Cycle Fast Start Options
Fast start combined cycle turbines are similar to conventional combined cycle in that they combine a simple cycle turbine with a HRSG and steam turbine to generate electricity. There are two broad types of fast start combined cycle: 1) fast start type 1 (as exemplified by the Siemens Flex Plant 30 and GE FlexEfficiency 60), that require approximately 30 minutes to achieve full load and retain full-load operating efficiency similar to a conventional combined cycle and 2) fast start type 2 (as exemplified by the Siemens FlexPlant 10 that require 10-15 minutes to achieve full load, but has reduced efficiency compared to a conventional combined cycle built around the same gas turbine.
Reciprocating Engines
Reciprocating engines are often used to generate small amounts of electricity, for isolated sources or to provide back-up power in case of an emergency. Though they are not typically used for peaking power production, there are some commercial models capable of generating approximately 18MW of gross power, as exemplified by the Wartsila 50SG.
Simple Cycle Aero-derivative Gas Turbines
Aero-derivative simple cycle turbines are simple cycle turbines derived from jet engine design, exemplified by the GE LMS100 series turbines. They are typically lighter weight, slightly more efficient, and are more expensive per unit of power produced than traditional frame turbines. They are modularly designed, use anti-friction rather than hydraulic bearings, and require a higher inlet pressure of fuel and air, compared to frame turbines.

Environmental Resources Management 13 0189555\A5469 Final Tenaska GHG PSD Rpt.docx Texas Registered Engineering Firm F-2393
Simple Cycle Frame Gas Turbines
Frame simple cycle turbines are the traditional design for simple cycle power generation. They have a quick start time of 10-15 minutes even from a cold start, and they have a strong track record as a reliable source of peak power.
4.2.1.2 Good Combustion, Operating and Maintenance Practices
Good combustion, operating and maintenance practices improve fuel efficiency of the combustion turbines by ensuring optimal combustion efficiencies are achieved as intended in the design of the burner. Good operating practices include the use of operating procedures including startup, shutdown and malfunction procedures, the use of instrumentation and controls for operational control, and maintaining manufacturer recommended combustion parameters. Maintenance practices include performing manufacturer recommended preventative maintenance.
4.2.1.3 Fuel Selection The use of fuels with low carbon intensity and high heat intensity is appropriate BACT for GHG. The use of natural gas fuels meets these criteria as demonstrated in Table 4-5 summarizing emission factors for various turbine fuels. TABLE 4-5: Emissions of CO2 from Gaseous and Liquid Fuels Available For Use in Combustion Turbines
Fuel Option Emission Factor
(kg CO2/MMBtu) Carbon Intensity
(relative to natural gas)
Natural Gas 53.02 --
Propane Gas 61.46 1.16
Distillate No. 2 73.96 1.39
Biomass Liquids1 68.44 – 81.55 1.29 – 1.54
1 Includes biodiesel and various bioethanols.
4.2.1.4 Carbon Capture and Sequestration
In addition to reduction of GHG emissions by reducing fuel consumption through efficient design and optimal operation, control technologies to capture and sequester GHG emissions must be considered. Carbon Capture and Sequestration (CCS) has three main approaches including oxy-fuel combustion, pre-combustion capture, and post-combustion capture.

Environmental Resources Management 14 0189555\A5469 Final Tenaska GHG PSD Rpt.docx Texas Registered Engineering Firm F-2393
Oxy-fired technology involves the replacement of combustion air with pure oxygen to create a more concentrated CO2 flow in the combustion exhaust. This technology is in the early stages of review and has not reached a commercial stage of deployment for coal fired boiler or gas turbine applications. As such, it will not be further considered. Pre-combustion capture is primarily applicable to gasification plants and is, therefore, not applicable to this project. Of these approaches, post-combustion capture is applicable to gas turbines. Post-combustion capture involves separating CO2 from the exhaust gas stream. Methods of post-combustion capture include adsorption, physical and chemical absorption, cryogenic separation, and membrane separation. If CO2 capture can be reliably and economically achieved, transportation and reliable long-term storage are still required. This requires proximate access to a transport pipeline capable of delivering the enriched flue gases to a geologic formation suitable for long-term sequestration of CO2.
4.2.2 Step 2: Eliminate Technically Infeasible Options Of the technologies that meet the business purpose of providing peaking power when needed; only CCS is technologically infeasible. As described below in section 4.2.2.2, it is TRPP’s opinion that carbon capture is not feasible for an intermittent source, such as a peak power generating facility. While TRPP believe carbon capture and sequestration to be infeasible, this report will later show that the economic and environmental costs of carbon capture and sequestration are also too high.
4.2.2.1 Inherently low-emitting design The remaining technologies listed below, are technologically feasible:
Inherently low emitting design
o Fast Start Combined Cycle
o Reciprocating Engines
o Aero-derivative simple cycle turbines
o Frame simple cycle turbines
Fuel selection
Good combustion and maintenance practices
4.2.2.2 Carbon Capture and Sequestration There are three main types of CO2 capture systems being developed for fossil power plants – (1) pre-combustion capture, (2) oxy-combustion, and (3) post-combustion capture. Among these, the only potentially applicable type for a simple cycle natural gas peaking plant would be the post combustion type. Due to the low concentration of CO2 and low pressure of combustion flue gases, the leading technology for post combustion systems is chemical solvent absorption/desorption which work by contacting upward flowing flue gases
Environmental Resources Management 15 0189555\A5469 Final Tenaska GHG PSD Rpt.docx Texas Registered Engineering Firm F-2393
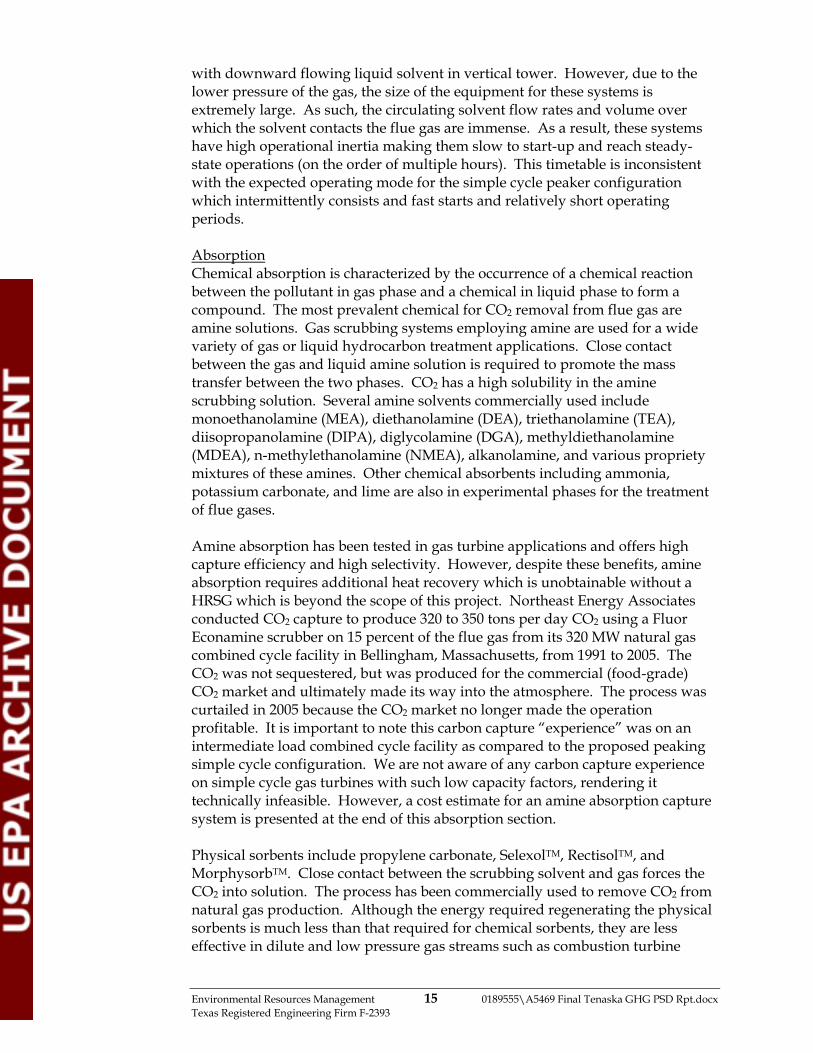
with downward flowing liquid solvent in vertical tower. However, due to the lower pressure of the gas, the size of the equipment for these systems is extremely large. As such, the circulating solvent flow rates and volume over which the solvent contacts the flue gas are immense. As a result, these systems have high operational inertia making them slow to start-up and reach steady-state operations (on the order of multiple hours). This timetable is inconsistent with the expected operating mode for the simple cycle peaker configuration which intermittently consists and fast starts and relatively short operating periods. Absorption Chemical absorption is characterized by the occurrence of a chemical reaction between the pollutant in gas phase and a chemical in liquid phase to form a compound. The most prevalent chemical for CO2 removal from flue gas are amine solutions. Gas scrubbing systems employing amine are used for a wide variety of gas or liquid hydrocarbon treatment applications. Close contact between the gas and liquid amine solution is required to promote the mass transfer between the two phases. CO2 has a high solubility in the amine scrubbing solution. Several amine solvents commercially used include monoethanolamine (MEA), diethanolamine (DEA), triethanolamine (TEA), diisopropanolamine (DIPA), diglycolamine (DGA), methyldiethanolamine (MDEA), n-methylethanolamine (NMEA), alkanolamine, and various propriety mixtures of these amines. Other chemical absorbents including ammonia, potassium carbonate, and lime are also in experimental phases for the treatment of flue gases. Amine absorption has been tested in gas turbine applications and offers high capture efficiency and high selectivity. However, despite these benefits, amine absorption requires additional heat recovery which is unobtainable without a HRSG which is beyond the scope of this project. Northeast Energy Associates conducted CO2 capture to produce 320 to 350 tons per day CO2 using a Fluor Econamine scrubber on 15 percent of the flue gas from its 320 MW natural gas combined cycle facility in Bellingham, Massachusetts, from 1991 to 2005. The CO2 was not sequestered, but was produced for the commercial (food-grade) CO2 market and ultimately made its way into the atmosphere. The process was curtailed in 2005 because the CO2 market no longer made the operation profitable. It is important to note this carbon capture “experience” was on an intermediate load combined cycle facility as compared to the proposed peaking simple cycle configuration. We are not aware of any carbon capture experience on simple cycle gas turbines with such low capacity factors, rendering it technically infeasible. However, a cost estimate for an amine absorption capture system is presented at the end of this absorption section. Physical sorbents include propylene carbonate, SelexolTM, RectisolTM, and MorphysorbTM. Close contact between the scrubbing solvent and gas forces the CO2 into solution. The process has been commercially used to remove CO2 from natural gas production. Although the energy required regenerating the physical sorbents is much less than that required for chemical sorbents, they are less effective in dilute and low pressure gas streams such as combustion turbine

Environmental Resources Management 16 0189555\A5469 Final Tenaska GHG PSD Rpt.docx Texas Registered Engineering Firm F-2393
exhaust and would not be able to provide adequate reduction of CO2. As such, this technology is considered technically infeasible. Adsorption Laboratory evaluations of natural zeolite, manufactured zeolite sieves, and activated carbon have all shown that these materials preferentially adsorb CO2 over nitrogen, oxygen, and water vapor at elevated pressures. Although these materials show promise for CO2 capture from high pressure gas streams, they are unsuited for low pressure combustion exhaust streams. Therefore, adsorption is considered technically infeasible. Separation Polymer-based membrane separation of CO2 is currently under investigation. Currently, potential membrane materials are prone to chemical and thermal degradation. Like physical sorbents, they are less effective in dilute and low pressure gas streams such as combustion turbine exhaust. This technology is still experimental and not commercially available. Membrane technology is considered technically infeasible for this project. In cryogenic separation of CO2, the gas is cooled and compressed to condense CO2. This process is only effective on dry gas streams with high CO2 concentrations and is not technically feasible for the dilute gas streams from combustion exhaust. Transportation and Sequestration Provided CO2 capture and compression could be reliably achieved, the high-volume stream must be transported by pipeline to long-term storage to a geologic formation capable of long-term storage. The U.S. Department of Energy National Energy Technology Laboratory (DOE-NETL) states: “The majority of geologic formations considered for CO2 storage, deep saline or depleted oil and gas reservoirs, are layers of porous rock underground that are “capped” by a layer or multiple layers of non-porous rock above them. Under high pressure, CO2 turns to liquid and can move through a formation as a fluid. Once injected, the liquid CO2 tends to be buoyant and will flow upward until it encounters a barrier of non-porous rock, which can trap the CO2 and prevent further upward migration. Coal seams are another formation considered a viable option for geologic storage, and their storage process is slightly different. When CO2 is injected into the formation, it is adsorbed onto the coal surfaces, and methane gas is released and produced in adjacent wells. There are other mechanisms for CO2 trapping as well: CO2 molecules can dissolve in brine: react with minerals to form solid carbonates; or adsorb in the pores of the porous rock. The degree to which a specific underground formation is amenable to CO2 storage can be difficult to discern.”1
1 DOE-NETL. Carbon Sequestration: Storage. http:///www.netl.doe.gov/technologies/carbon_seq/core_rd/storage.html

Environmental Resources Management 17 0189555\A5469 Final Tenaska GHG PSD Rpt.docx Texas Registered Engineering Firm F-2393
The Gulf Coast Carbon Center (GCCC) has identified numerous potential sites along the Texas Gulf Coast that may be suitable for sequestration, the capacity and reliability of these sites remains untested.2 In particular, a modeling study of the Frio Formation in the Texas Gulf Coast conducted by the GCCC indicated long-term CO2 loss from the geologic formation despite high intrinsic capacity and determined further study is required to determine the long-term capacity of geologic formations.3
4.2.3 Step 3: Rank Remaining Control Technologies
These remaining technologically and economically feasible options have been ranked based on their control of GHG from combustion turbines. Table 4-6 provides a summary of the remaining technologies. TABLE 4-6: Ranking of Technically Feasible Emissions Reduction Options of Greenhouse Gases from Combustion Turbines
Emission Reduction Option
Performance Level
(% control) Rank (x)
Fuel selection 15% - 55% 1
Good combustion, operating and maintenance practices 5-25% 2
Inherently low emitting design 5-20% 3
Uncontrolled -- --
4.2.4 Step 4: Evaluate and Document Remaining Control Technologies
4.2.4.1 Carbon Capture and Sequestration
Despite the technical infeasibility of CCS for the proposed project, TRPP evaluated the cost of carbon capture using MEA based on published methodologies. This analysis is shown in Table 4-7. The cost of capture and sequestration using MEA is approximately $89/ton of CO2 removed. This CCS cost analysis assumes that the carbon must be sequestered, and cannot be used in enhanced oil recovery (EOR). Because a peaking unit is only producing CO2 a fraction of the year, and only for a few hours at a time, there is no market for that kind of CO2 supply for EOR. The RPGS will be located on the Gulf Coast Oligocene brine formation (of which the Frio formation is a part). As an absolute best case scenario, the cost analysis for sequestration assumes that
2 Susan Hovorka, et. al. University of Texas, Bureau of Economic Geology – Gulf Coast Carbon Center. New Developments: Solved and Unsolved Questions Regarding Geologic Sequestration of CO2 as a Greenhouse Gas Reduction Method. GCCC Digital Publication #08-13. April 2008. 3 Christine Doughty, et. al. University of Texas, Bureau of Economic Geology – Gulf Coast Carbon Center. Capacity Investigation of Brine-bearing Sands of the Frio Formation for Geologic Sequestration of CO2. GCCC Digital Publication #01-03. 2001.

Environmental Resources Management 18 0189555\A5469 Final Tenaska GHG PSD Rpt.docx Texas Registered Engineering Firm F-2393
the Oligocene structure is capable of long term storage, despite contrary evidence from the Frio Project. The analysis further assumes that a suitable sequestration well can be drilled within 10 miles of the facility in the Oligocene structure. The cost analysis also assumes a typical control level of 90% for the carbon capture system. In practice carbon capture will not be this high because the carbon capture system will not be operational during periods of start-up. Since TRPGS is a peaking facility, the amount of time it spends in start-up is not insignificant. As such, not capturing the CO2 emissions generated during start-up reduces the effective carbon capture efficiency below the 90% typically claimed for carbon capture processes. For comparison purposes, one could calculate the threshold value of cost effectiveness for CO2e based on the relative cost effectiveness of control of a criteria pollutant at some threshold value per ton of pollutant removed and the major source threshold of 100 tpy. This approach is supported by USEPA’s rulemaking under the “Tailoring Rule.” Through rulemaking the USEPA has “tailored” greenhouse gasses such that 100,000 tons of CO2e is equal to 100 tons of a criteria pollutant for the purpose of PSD applicability. So, by USEPA’s own rulemaking construct. The cost of carbon capture alone would be equivalent to $89,000 per ton of criteria air pollutant. Based on this criterion, the CCS demonstration system for the Tenaska Roans Prairie Generating Station is found to be infeasible based on cost. TABLE 4-7: MEA Capture Cost Estimate*
Item Value Basis Total Hours per year 2,920 Economic Life, years 20 Interest Rate (%) 1,2 10
Source(s) Controlled Three Gas
Turbines Nominal Generating Capacity (MW-gross) 665 Gross Nominal Generation (kWh/yr) 1,941,800,000 Capital Cost ($) 607,056,627 Total Annualized Cost ($) 102,432,806 Before Capture Annual Emissions (ton/yr) 1,278,052 Capture Efficiency 90% Total CCS Cost ($/ton CO2, 2012 dollars) 89
* A more detailed cost estimate table can be found in Table B-1 in Appendix B. In addition to being economically infeasible, there are additional environmental costs associated with additional capture. The MEA system that would be most readily available requires additional energy representing approximately 15% of the load generated by the power plant. Therefore, to generate a comparable amount of net electricity, the facility would be emitting 15% more criteria pollutants such as NOX, VOC, and particulate as well as hazardous air pollutants such as formaldehyde, which is also a highly reactive VOC (HRVOC) that contributes to ground-level ozone formation. Since this project is located near

Environmental Resources Management 19 0189555\A5469 Final Tenaska GHG PSD Rpt.docx Texas Registered Engineering Firm F-2393
the Houston ozone non-attainment area, reducing emissions of ozone precursors is more of a concern than reducing greenhouse gas emissions. Finally, carbon sequestration has other potential environmental impacts that should be considered before declaring sequestration viable as BACT including:
Impacts from brine displacement into fresh water aquifers or surface water;
CO2 leakage into underground or surface drinking water supplies resulting in acidification of water supplies; and
Subsequent impacts to local flora and fauna.
4.2.4.2 Inherently Low Emitting Design Fast start combined cycle (Siemens FP10 and Siemens FP30), reciprocating engines, aero-derivative simple cycle, and frame simple cycle turbines are still in consideration as inherently low emitting (ILE) design. For the following economic analysis, frame simple cycle turbines are considered as the base case. Table 4-8 below shows that the cost of avoided CO2 emissions for these four alternative options at the maximum allowable peaking capacity factor of 33%. The detailed economic calculations for this cost of avoided CO2 are shown in the confidential Appendix E. TABLE 4-8 Cost of Avoided CO2 for Generating Technologies at 33% Capacity Factor
Generating Technology Cost of avoided CO2
($/ton) Frame Simple Cycle N/A1
Siemens FP30 & GE FE 60 Fast Start Combined Cycle 39.9 Siemens FP10 Fast Start Combined Cycle 215.8
Aero-derivative Simple Cycle 249.2 Reciprocating Engines 375.7
1 Frame simple cycle turbines are the baseline for this comparison. At the maximum annual capacity factor of 33% (approximately 2,920 hours of operation), the costs of avoided CO2 for the fast start type 1 combined cycle turbines (Siemens FP 30 and GE FE 60) are significantly lower than that for the other fast start combined cycle, aero-derivative simple cycle and reciprocating engines. As such, fast start combined cycle type 2 (FP 10), aero-derivative simple cycle turbines, and reciprocating engines are eliminated due to the higher cost of avoided CO2 emissions in comparison to the fast start type 1 combined cycle turbine for the stated business purpose.

Environmental Resources Management 20 0189555\A5469 Final Tenaska GHG PSD Rpt.docx Texas Registered Engineering Firm F-2393
Since the cost for avoided CO2 for the fast start type 1 combined cycle turbines is $39.9/ton (or $39,900/ton equivalent to criteria pollutants) at the given capacity factor, it is also considered economically infeasible compared to frame simple cycle turbines for the stated business purpose.
4.2.4.3 Fuel selection, good combustion, operation, and maintenance practices, and fuel preheating TRPP has determined that the remaining control technologies have no adverse impacts that require additional consideration or evaluation.
4.2.5 Step 5: Select BACT TRPP proposes the following design and work practices as BACT for combustion turbines:
Inherently low emitting design (Frame simple cycle turbine);
Use of natural gas;
Good combustion, operation and maintenance practices; and
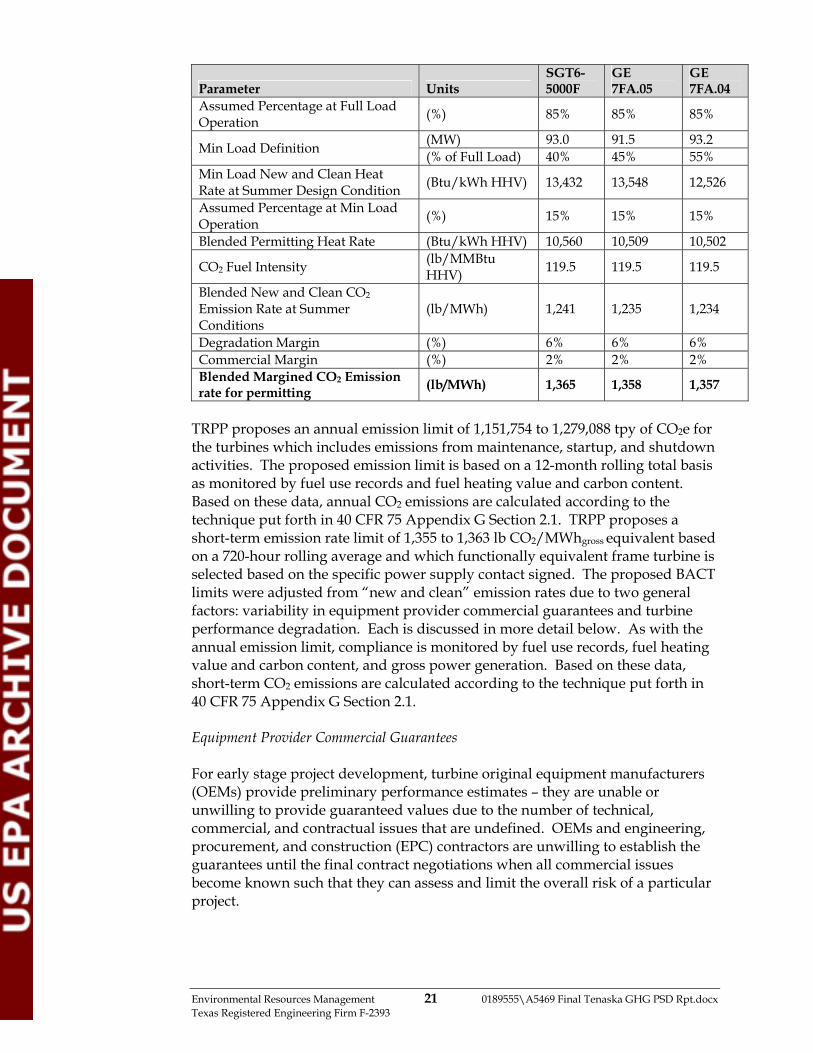
Installation of a fuel preheater. BACT is proposed as three F class frame combustion turbines fueled by natural gas incorporating good combustion, operating, and maintenance practices. The proposed short-term quantitative BACT limits for each of the turbine options being considered are shown in Table 4-9 (applicable at an operational scenario of baseload for 85% of the operating hours and minimum load for the remaining 15%. Minimum load is different for each turbine (40.2% load for the Siemens, 50.3% load for the GE 7FA.04 and 47.9% load for the GE 7FA.05). The ultimate turbine model chosen will be selected based upon several operational and economic factors, including the total plant capacity that best fits expected power supply contract signed by TRPP. Table 4-9 below shows the calculations demonstrating the mass emission rate of CO2 for each of the three turbines in lb/MW-hr. Table 4-9. CO2 Mass Emission Rate Determination
Parameter Units SGT6-5000F
GE 7FA.05
GE 7FA.04
Full Load New and Clean Output at Summer Design Condition -- per Turbine
(MW) 231.1 204.5 168.7
Full Load New and Clean Output at Summer Design Condition-- Plant (3 turbines)
(MW) 693.4 613.5 506.1
Full Load New and Clean Heat Rate at Summer Design Condition (Btu/kWhHHV) 10,053 9,972 10,144
Environmental Resources Management 21 0189555\A5469 Final Tenaska GHG PSD Rpt.docx Texas Registered Engineering Firm F-2393
Parameter Units SGT6-5000F
GE 7FA.05
GE 7FA.04
Assumed Percentage at Full Load Operation (%) 85% 85% 85%
Min Load Definition (MW) 93.0 91.5 93.2 (% of Full Load) 40% 45% 55%
Min Load New and Clean Heat Rate at Summer Design Condition (Btu/kWh HHV) 13,432 13,548 12,526
Assumed Percentage at Min Load Operation (%) 15% 15% 15%
Blended Permitting Heat Rate (Btu/kWh HHV) 10,560 10,509 10,502
CO2 Fuel Intensity (lb/MMBtu HHV) 119.5 119.5 119.5
Blended New and Clean CO2 Emission Rate at Summer Conditions
(lb/MWh) 1,241 1,235 1,234
Degradation Margin (%) 6% 6% 6% Commercial Margin (%) 2% 2% 2% Blended Margined CO2 Emission rate for permitting
(lb/MWh) 1,365 1,358 1,357
TRPP proposes an annual emission limit of 1,151,754 to 1,279,088 tpy of CO2e for the turbines which includes emissions from maintenance, startup, and shutdown activities. The proposed emission limit is based on a 12-month rolling total basis as monitored by fuel use records and fuel heating value and carbon content. Based on these data, annual CO2 emissions are calculated according to the technique put forth in 40 CFR 75 Appendix G Section 2.1. TRPP proposes a short-term emission rate limit of 1,355 to 1,363 lb CO2/MWhgross equivalent based on a 720-hour rolling average and which functionally equivalent frame turbine is selected based on the specific power supply contact signed. The proposed BACT limits were adjusted from “new and clean” emission rates due to two general factors: variability in equipment provider commercial guarantees and turbine performance degradation. Each is discussed in more detail below. As with the annual emission limit, compliance is monitored by fuel use records, fuel heating value and carbon content, and gross power generation. Based on these data, short-term CO2 emissions are calculated according to the technique put forth in 40 CFR 75 Appendix G Section 2.1. Equipment Provider Commercial Guarantees For early stage project development, turbine original equipment manufacturers (OEMs) provide preliminary performance estimates – they are unable or unwilling to provide guaranteed values due to the number of technical, commercial, and contractual issues that are undefined. OEMs and engineering, procurement, and construction (EPC) contractors are unwilling to establish the guarantees until the final contract negotiations when all commercial issues become known such that they can assess and limit the overall risk of a particular project.

Environmental Resources Management 22 0189555\A5469 Final Tenaska GHG PSD Rpt.docx Texas Registered Engineering Firm F-2393
However, because TRPP intends to finance the project, these preliminary estimates will need to be converted to guarantees prior to financial closing and commissioning of the project. The prospective lenders will require that guaranteed figures be consistent with both the economic projections and the permitted emissions. The guaranteed heat rate figures are likely to be higher than the preliminary estimates due to the following issues:
• The preliminary figures do not include test measurement uncertainty. Every measurement is the combination of the true value plus measurement error. Thus, there is inherent uncertainty in the measurement. This uncertainty has two parts: (1) systematic error (also known as bias or fixed error) which is a function of the particular measurement device type/vendor and installation and (2) random or statistical error which results from the scatter of repeated measurements using the same instrumentation. Since the specific CO2 emissions are the result of several measurements and calculations, the total uncertainty will be the square root of the sum of the squares of the product of the individual measurement uncertainties and their respective sensitivities. In previous projects, total uncertainty was 1.0 to 1.5%. TRPP would expect something similar to be established for Roans Prairie as it appears to be typical total uncertainty for the types of instrumentation used and which the OEMs are willing to accept. The definitions for test uncertainty and the gas turbine performance test codes can be found in ASME 19.1 and 22, respectively.
• The detailed project scope (the basis for the guarantee) is not fully defined. A number of design elements are not fully decided until detailed engineering. For example: determination of vendor and geometry of inlet filter media, its associated pressure drop, and the resultant effect on performance.
• Each combustion turbine is unique. During commissioning, the OEM observes the combustion dynamics and tunes the unit performance by adjusting the base load firing curve, the base load inlet guide vane angle, and other control parameters. The OEM is expected to include safety margin in its final guarantee values to cover this issue, once all the performance and emission guarantee parameters are defined.
• Guaranteeing CO2 emissions is a new requirement for the OEMs/EPCs and, as such, adds risk to their commercial offering. In order to manage this risk, they are likely to be conservative by including margin in their guaranteed value.
Given the typical value of uncertainty of 1.0-1.5%, plus the other unquantified issues, TRPP elected to use a 2.0% margin for converting the current preliminary estimates to guarantee-able values. CT Performance Degradation Even under the best possible operating conditions, the performance of a gas turbine is subjected to deterioration due to compressor fouling and corrosion,

Environmental Resources Management 23 0189555\A5469 Final Tenaska GHG PSD Rpt.docx Texas Registered Engineering Firm F-2393
inlet filter clogging, thermal fatigue and oxidization of hot-gas path components such as combustion liners and turbine blades. Collectively, these mechanisms reduce the electrical output and efficiency (i.e., increase the heat rate) of combustion turbines. The heat rate increase causes a corresponding increase in the specific CO2 emission rate. Performance degradation can be grouped into two types: non-recoverable and recoverable. The contributions from these two types and the time period over which they occur is a function of the plant operating profile – i.e., the capacity factor and the number of starts as dictated by market forces. OEMs define the timing for major maintenance in terms of “equivalent operation hours” (EOH). The formulation of EOH varies among the OEMs, but conceptually consists of actual operating hours plus number of starts times a multiplier. The starts multiplier is generally relatively large because the thermal cycling of the unit during a start has a much larger impact on long term operations than an hour spent at steady-state operations. Non-recoverable degradation occurs and continues throughout the operating life of the combustion turbine. OEMs provide a projection of this impact versus EOH. These trends consist of relatively rapid initial heat rate degradation of 0.3 to 0.5% per 1,000 EOH for the first few thousand EOH which then flattens to a long term degradation rate of 0.02 to 0.05% per 1,000 EOH. The long term impact is a 2.5 to 3.0% increase in heat rate at high EOH over new and clean performance. The figure below depicts curves from two major OEMs: Figure 4-1. Non-Recoverable Heat Rate Degradation

Environmental Resources Management 24 0189555\A5469 Final Tenaska GHG PSD Rpt.docx Texas Registered Engineering Firm F-2393
Recoverable degradation is that which may be recovered through compressor washes and the performance of major maintenance, and accumulates over time between major maintenance intervals. The rate of change is minimized by performing compressor washes. When an off-line wash and major maintenance are performed, the unit heat rate should return to the new and clean heat rate plus the non-recoverable degradation (described above). As a result, total degradation (non-recoverable plus recoverable) appears as a saw-tooth type curve, as shown in Figure 4-2. However, there is significant uncertainty in whether the performance will be recovered in practice. For example, TRPP has experienced essentially no performance recovery after major maintenance for a few units in its fleet. Figure 4-2. Recoverable Thermal Efficiency Degradation
Based on vendor curves and operating fleet experience (including plant performance tests executed before and after major maintenance), TRPP has determined that recoverable degradation can reach 3 to 4% between maintenance intervals. As previously mentioned, the individual contributions from these types of degradation are dependent on the run profile. However, TRPP cannot definitively predict the future market conditions for the life of the plant. Thus, TRPP modeled a matrix of plausible run profiles (with various combinations of starts and capacity factors) to compute the degradation profile. Then, TRPP selected the highest heat rate for the worst year from the worst run profile (the highest peak of the saw tooth) curve. This value was nominally 6% above new and clean performance. This result makes sense because the individual contributions of non-recoverable degradation and recoverable degradation can be 2.5 to 3% and 3 to 4%, respectively, for high EOH at the end of a run (nearing a major maintenance event).

Environmental Resources Management 25 0189555\A5469 Final Tenaska GHG PSD Rpt.docx Texas Registered Engineering Firm F-2393
Combining both adjustment factors, variability from the vendor guarantee (2%), and performance degradation (6%); TRPP proposes that an 8% factor be applied to the new and clean thermal efficiency provided by the turbine manufacturers, as shown in Table 4-9.
4.3 NATURAL GAS FUGITIVE EMISSIONS
4.3.1 Step 1: Identify All Available Control Technologies TRPP performed a search of the USEPA RBLC for fugitive emissions from gas fired turbines for power generation; a summary of these results is shown in Table C-2 in Appendix C. Based on that and a review of the available literature, TRPP has identified the following control options for natural-gas fugitive emissions:
Good operations and preventative maintenance plan;
Implementing an AVO program to identify and repair leaks; and
Use of leakless components.
4.3.2 Step 2: Eliminate Technically Infeasible Options Of the identified control technologies, only leakless components are technologically infeasible. Leakless components are only currently used in industries that use highly hazardous gases and liquids. Given that the environmental impact of GHGs have not yet been fully quantified, and GHGs do not present any acute hazards, consideration of leakless components as BACT is unwarranted.
4.3.3 Step 3: Rank Remaining Control Technologies TABLE 4-10: Ranking of Technically Feasible Emissions Reduction Options of Greenhouse Gases from Natural Gas Fugitives
Emission Reduction Option
Performance Level
(% control) Rank (x)
AVO Program 93-97%% 1
Good operating and maintenance practices 5-25% 2
Uncontrolled -- --
4.3.4 Step 4: Evaluate and Document Remaining Control Technologies
TRPP has determined that the control technologies identified in Table 4-10 have no adverse impacts that require additional consideration or evaluation.
4.3.5 Step 5: Select BACT TRPP proposes the following design and work practices as BACT for fugitive components:

Environmental Resources Management 26 0189555\A5469 Final Tenaska GHG PSD Rpt.docx Texas Registered Engineering Firm F-2393
Implementing an AVO inspection program; and
Good operation and maintenance practices. TRPP proposes an emission limit of 70 tpy of CO2e (12-month rolling average) for the facility. Compliance with be demonstrated by proper documentation of the maintenance and AVO programs.
4.4 DIESEL FIRED EMERGENCY ENGINES
4.4.1 Step 1: Identify All Available Control Technologies TRPP performed a search of the USEPA RBLC for diesel fired emergency engines and the results are shown in Table C-3 in Appendix C. The BACT identified for these emergency generators were good combustion practices or fuel-efficient design. Based on this information, TRPP has identified the following control options for emergency generators and fire pump engines:
Good combustion practices, operation and maintenance;
Alternative fuels; and
Carbon Capture and Sequestration.
4.4.1.1 Good Combustion Practices, Operation and Maintenance Proper combustion, operation and maintenance ensure the boilers maintain optimal efficiency and perform as designed. These operational practices include:
Combustion optimization;
Operation procedures including startup, shutdown, and malfunction;
Instrumentation and controls;
Reduce air leakages; and
Preventative maintenance.
4.4.1.2 Alternative Fuels The use of fuels like natural gas or propane may reduce carbon emissions by changing the carbon to energy density of the fuel. The use of these fuels does not meet the purpose of the emergency engines, namely being able to supply power quickly and reliably in case of an emergency; necessitating a self-contained, stable and independent fuel supply. As such, lower carbon to energy density fuels do not meet the business purpose of the emergency engines, and are not considered for BACT.
4.4.1.3 Carbon Capture and Sequestration Carbon capture and sequestration is discussed in Section 4.2.1.4.

Environmental Resources Management 27 0189555\A5469 Final Tenaska GHG PSD Rpt.docx Texas Registered Engineering Firm F-2393
4.4.2 Step 2: Eliminate Technically Infeasible Options
4.4.2.1 Carbon Capture and Sequestration
Carbon capture and sequestration on a highly intermittent process like an emergency generator is not technically feasible. The process equipment used in carbon capture requires significant start-up time, such that it would not be operational in time to capture emissions from the engine which will primarily be used for short periods of time.
4.4.3 Step 3: Rank Remaining Control Technologies The remaining technologically feasible options have been ranked based on their GHG emissions reductions performance levels. Table 4-11 provides a summary of the remaining technologies.
TABLE 4-11: Ranking of Technically Feasible Emissions Reduction Options of Greenhouse Gases from Emergency Engines
Emission Reduction Option
Performance Level
(% control) Rank (x)
Good combustion, operating and maintenance practices 5-25% 1
None -- --
4.4.4 Step 4: Evaluate and Document Remaining Control Technologies
TRPP has determined that good combustion, operating and maintenance practices have no adverse impacts that require additional consideration or evaluation.
4.4.5 Step 5: Select BACT TRPP proposes the following design and work practices as BACT for the emergency generators:
Good combustion, operation and maintenance practices. TRPP proposes a short-term emission limit of 164 pounds of CO2e per MMBtu (12-month rolling average) for each diesel engine including emissions from maintenance, startup, and shutdown activities. This value of 180 was based on the EPA emission factor of 163.6 lb/MMBtu for diesel engines. Compliance with be demonstrated by monitoring fuel usage and fuel higher heating value. CO2 emissions will be calculated using the EPA emission factor from table 40 CFR 98 C-1.

Environmental Resources Management 28 0189555\A5469 Final Tenaska GHG PSD Rpt.docx Texas Registered Engineering Firm F-2393
4.5 FUGITIVE SF6 EMISSIONS FROM ELECTRICAL COMPONENTS
4.5.1 Step 1: Identify All Available Control Technologies
TRPP performed a search of the USEPA RBLC for SF6 containing circuit breakers in addition to reviewing the literature on emissions reductions methods. A summary of the RBLC results is included in Table C-4 in Appendix C. Based on this information, TRPP has identified the following control options for SF6 containing circuit breakers:
Use of materials other than SF6 (air blast or dielectric oil);
Use of state-of-the-art circuit breakers that are gas-tight and require minimal SF6;
Good operations and preventative maintenance plan; and
Implementing an AVO program to identify and repair leaks.
4.5.2 Step 2: Eliminate Technically Infeasible Options
4.5.2.1 Alternative Circuit Breaker Insulation Material No alternative materials exist that are as easily implemented as SF6; per the EPA’s Report “SF6 emission Reduction Partnership for Electric Power Systems” ( http://www.epa.gov/electricpower-sf6/),
“No clear alternative exists for this gas that is used extensively in circuit breakers, gas-insulated substations, and switch gear due to its inertness and dielectric properties.”
4.5.3 Step 3: Rank Remaining Control Technologies
The remaining technologically feasible options have been ranked based on their GHG emissions reductions performance levels. Table 4-12 provides a summary of the remaining technologies.
TABLE 4-12: Ranking of Technically Feasible Emissions Reduction Options of Greenhouse Gases from Fugitive SF6 Emissions
Emission Reduction Option
Performance Level
(% control) Rank (x)
AVO program 30% 1
Good operating and preventative maintenance practices 10% 2
None -- --

Environmental Resources Management 29 0189555\A5469 Final Tenaska GHG PSD Rpt.docx Texas Registered Engineering Firm F-2393
4.5.4 Step 4: Evaluate and Document Remaining Control Technologies TRPP has determined that the control technologies identified in table 4-12 have no adverse impacts that require additional consideration or evaluation.
4.5.5 Step 5: Select BACT TRPP proposes the following design and work practices as BACT for the SF6 circuit breakers:
Implementing an AVO program;
Use of good operations and preventative maintenance practices; and TRPP proposes an annual emission limit of 210 tpy of CO2e (12-month rolling average) for all SF6 containing components at the facility. Compliance with be demonstrated by appropriate documentation of the AVO and preventative maintenance plans.

Environmental Resources Management 30 0189555\A5469 Final Tenaska GHG PSD Rpt.docx Texas Registered Engineering Firm F-2393
5.0 GREENHOUSE GAS EMISSION CALCULATIONS This section summarizes the methodologies and emission factors used to calculate the PTE GHG emissions for each emission source included in this project. As previously mentioned, this project involves the construction of an all new facility to include three new simple cycle gas turbines, one diesel engine powered emergency generator, and one diesel engine powered fire pump. GHG emissions from the new units were calculated for purposes of determining PSD applicability and for determining if the facility would require a Title V operating permit based on its GHG annual emission rate. In addition to the GHG generated from combustion of natural gas, the fugitive emissions resulting from leakage of SF6 used in electrical distribution equipment and fugitive losses of natural gas are also included. Plans call for the installation of three identical turbines; However, three different models of turbines are under consideration, and therefore, this discussion includes three different sets of turbine emission rates. Detailed emissions calculations for the overall project are presented in Appendix B. Project summary emissions for the three different turbine scenarios are shown in Tables B-2 through B-4. Emissions calculations for each individual turbine are shown in Tables B-5 through B-7. Emissions calculations for the other units including MSS emissions are shown in Tables B-8 through B-12.
5.1 POTENTIAL EMISSIONS CALCULATIONS
5.1.1 Combustion Turbines Potential emissions for each of the combustion turbines were calculated based on 2,920 hours of operation. The limit on annual capacity factor is based on the proposed Carbon Pollution Standard for New Power Plants (NSPS Subpart TTTT) for defining the operations of simple cycle turbines used as peaking units. The new turbines will be available to operate at the maximum rated capacities shown in Table 5-1. The emission factors used for calculating potential GHG emissions from the new combustion turbines are summarized in Table 5-2. The global warming potentials from Part 98, table A-2 are used to convert the GHG pollutants into terms of CO2e, as provided in Table 5-3. The GHG pollutants and the total GHG emissions stated in terms of CO2e for the three groups of turbines are shown in the Table 5-4. To determine the CO2 emission factor for the turbine, TRPP developed a hypothetical gas composition based on the probable supply contract with the natural gas provider. The composition represents a fuel with relatively low methane content and high NGL content, but which still meets the tariff limits of 1,150 Btu/SCF higher heating value and (less than) 0.2 gallon C5+ NGLs per thousand standard cubic feet (GPMs). The resulting CO2 intensity of this hypothetical fuel is 119.5 lb CO2/MMBtu (54.2 kg CO2/MMBtu). Determination of this emission factor is provided in Appendix D.

Environmental Resources Management 31 0189555\A5469 Final Tenaska GHG PSD Rpt.docx Texas Registered Engineering Firm F-2393
TABLE 5-1: Turbine Maximum Design Data per Turbine
Turbine Manufacturer and Model Number
Rated Capacity
(MW)2
“New and Clean” Thermal Efficiency (Btu/kW-hr, HHV)2
Marginal1 Thermal Efficiency (Btu/kW-
hr, HHV)2
Maximum Heat Input
(MMBtu/Hr) Siemens SGT6-5000F(5ee) 231.2 9,778 10,561 2,441 GE 7FA.05 227.6 9,672 10,446 2,378 GE 7FA.04 207.0 9,833 10,620 2,198
1 Includes an 8% adjustment above new and clean to account for non-standard conditions, and performance degradation. 2 These performance numbers were taken at an Ambient Temperature of 7F and humidity of 53%.
TABLE 5-2: Natural Gas-fired Turbine GHG Emission Factors
Pollutant
Emission Factor
(kg/MMBtu)
Global Warming Potential (100 Yr) Basis
CO2 54.22 1 Based on representative fuel sample data described above
CH4 0.001 21 40 CFR Part 98, Subpart C, Table C-2& Subpart A, Table A-1
N2O 0.0001 310 40 CFR Part 98, Subpart C, Table C-2& Subpart A, Table A-1
TABLE 5-3: Total GHG (CO2e) Emissions from the Natural Gas Turbines
Greenhouse Gas Emissions from Turbines (tpy)
Pollutant Three (3) Siemens - SGT6-5000F(5ee) Three (3) GE – 7FA.05 Three (3) GE – 7FA.04
CO2 1,277,862 1,244,443 1,150,650 CH4 23.57 22.95 21.22 N2O 2.36 2.30 2.12 GHG (CO2e)
1,279,088 1,245,636 1,151,754
5.1.2 Diesel Fired Emergency Engines
The proposed project includes two diesel emergency engines. The first emergency engine with a rating of 2,937 horsepower will drive a generator to supply electrical power in the event of the loss from the local utility. The second emergency engine with a rating of 575 horsepower will drive the fire water pump. The maximum hourly heat input rate for each engine was estimated based on the maximum hourly fuel consumption rate supplied by the prospective engine manufacturers (Appendix D) and the higher heating value of 0.138 MMBtu per gallon from Table C-1 from Subpart C of 40 CFR Part 98. The GHG emissions were then calculated using the default GHG emission factors from Subpart C of 40 CFR Part 98 shown in Table 5-5 for No. 2 distillate fuel oil.

Environmental Resources Management 32 0189555\A5469 Final Tenaska GHG PSD Rpt.docx Texas Registered Engineering Firm F-2393
TABLE 5-4: Emergency Engine GHG Emission Factors
Pollutant Emission Factor
(kg/MMBtu) Basis CO2 73.96 40 CFR Part 98, Subpart C, Table C-1 CH4 3.0E-03 40 CFR Part 98, Subpart C, Table C-2 N2O 6.0E-04 40 CFR Part 98, Subpart C, Table C-2 PTE for the emergency engines is based on 100 hours per year each as prescribed in Mr. John Seitz’ memo to EPA regional directors4. The total potential GHG emissions from the emergency engines are shown in the Table 5-6.
TABLE 5-5: GHG Emissions from the Emergency Engines
GHG Pollutant Potential Emissions
(tpy) CO2 189.01 CH4 0.008 N2O 0.0015 GHG (CO2e) 189.65
5.1.3 Fugitive SF6 Emissions from Electrical Equipment SF6 is used in high voltage electrical equipment as an insulator and arc quenching medium. Fugitive emissions of SF6 may result due to equipment leakage. Because SF6 is a very potent greenhouse gas its emissions have been included in the facility-wide GHG emission estimation. The fugitive emissions were calculated for each device as the product of the mass of SF6 contained in each piece of equipment, the likelihood of an equipment leak (0.5 percent per year), and the amount of SF6 lost due to leakage (defined as 100% of the device capacity). The total estimated SF6 fugitive loss was found by summing the losses for each device type and number estimated for use at the facility. The likelihood of fugitive emissions from SF6 containing equipment such as circuit breakers was estimated based on the annual leakage percentage standard for new equipment established by the International Electrotechnical Commission (IEC) Standard 62271-1 from October 2007 of 0.5 percent. For purposes of estimating emissions, the entire capacity of a leaking device was assumed to be lost. To convert the mass of SF6 lost into terms of CO2e, the global warming potential from Part 98, Subpart A was used and is provided in Table 5-7. The resulting CO2e emissions from leaking high voltage electrical equipment are shown in Table 5-8.
4 United States Environmental Protection Agency. 1995. Memorandum from Mr. John S. Seitz, Director of the Office Air Quality Planning and Standards. Potential to Emit for MACT Standards – Guidance on Timing Issues. May 16, 1995.

Environmental Resources Management 33 0189555\A5469 Final Tenaska GHG PSD Rpt.docx Texas Registered Engineering Firm F-2393
TABLE 5-6: GHG Emissions and Global Warming Potential of Sulfur Hexafluoride
Pollutant
SF6 Emissions
(tpy)
Global Warming Potential (100 Yr)
GHG (CO2e) Emissions (tpy) Basis
SF6 0.00875 23,900 209.13 40 CFR Part 98, Subpart
A, Table A-1
5.1.4 GHG Emissions from Fugitive Natural Gas Losses due to Leaks and Equipment Maintenance Additional GHG emissions result from fugitive leaks of natural gas from the equipment piping and from losses that occur during maintenance activities. Fugitive natural gas losses were estimated using Synthetic Organic Chemical Manufacturing Industry (SOCMI) Fugitive Equipment Leak Factors from the October 2000 Draft TCEQ Technical Guidance Package, and the type and number of various pieces of equipment and fittings. The losses from the equipment gas piping were estimated based on the volume of gas contained in the piping and the number of times per year the piping will be opened during maintenance. Detailed emission calculations are included in Appendix B. The GHG emissions from fugitive leaks and from maintenance are included in the facility summary shown below as part of Tables 5-7 to 5-9.
5.1.5 Summary of GHG Emissions from Project The total GHG potential emissions from the project are summarized in Tables, 5-9, 5-10, and 5-11 for each of the three different models of turbines under consideration.

Environmental Resources Management 34 0189555\A5469 Final Tenaska GHG PSD Rpt.docx Texas Registered Engineering Firm F-2393
TABLE 5-7: Summary of Potential Annual Project Emissions with Siemens Turbines
Pollutant
Single (one) Siemens Turbine
(tpy)
Total for Three
Siemens Turbines
(tpy)
Emergency Generator
Engine (tpy)
Emergency Fire Pump
Engine (tpy)
Fugitive Losses of SF6 from Electrical Breakers
(tpy)
Turbine Maintenance
(tpy)
Fugitive Natural
Gas Losses (tpy)
Total Project
Emissions (tpy)
CO2 425,954 1,277,862 156.27 32.74 - 0.0063 0.18 1,278,052 CH4 7.86 23.57 0.01 0.0013 - 0.12 3.30 26.99 N2O 0.79 2.36 0.0013 0.00027 - - - 2.36 SF6 - - - - 0.01 - - 0.01 GHG (CO2e)
426,363 1,279,088 156.80 32.85 209.13 2.42 69.46 1,279,559
TABLE 5-8: Summary of Potential Annual Project Emissions with GE-7FA.05 Turbines
Pollutant
Single (one) GE-7FA.05
Turbine (tpy)
Total for Three GE-
7FA.05 Turbines
(tpy)
Emergency Generator
Engine (tpy)
Emergency Fire Pump
Engine (tpy)
Fugitive Losses of SF6 from Electrical Breakers
(tpy)
Turbine Maintenance
(tpy)
Fugitive Natural
Gas Losses (tpy)
Total Project
Emissions (tpy)
CO2 414,814 1,244,443 156.27 32.74 - 0.01 0.18 1,244,632 CH4 7.65 22.95 0.01 0.0013 - 0.12 3.30 26.37 N2O 0.77 2.30 0.0013 0.00027 - - - 2.30 SF6 - - - - 0.01 - - 0.01 GHG (CO2e)
415,212 1,245,636 156.81 32.85 209.13 2.42 69.46 1,246,107
TABLE 5-9: Summary of Potential Annual Project Emissions with GE-7FA.04 Turbines
Pollutant
Single (one) GE-7FA.04
Turbine (tpy)
Total for Three GE-
7FA.04 Turbines
(tpy)
Emergency Generator
Engine (tpy)
Emergency Fire Pump
Engine (tpy)
Fugitive Losses of SF6 from Electrical Breakers
(tpy)
Turbine Maintenance
(tpy)
Fugitive Natural
Gas Losses (tpy)
Total Project
Emissions (tpy)
CO2 383,550 1,150,650 156.27 32.74 - 0.01 0.18 1,150,839 CH4 7.07 21.22 0.01 0.0013 - 0.12 3.30 24.64 N2O 0.71 2.12 0.0013 0.00027 - - - 2.12 SF6 - - - - 0.01 - - 0.01 GHG (CO2e)
383,918 1,151,754 156.80 32.85 209.13 2.42 69.46 1,152,224

Environmental Resources Management 35 0189555\A5469 Final Tenaska GHG PSD Rpt.docx Texas Registered Engineering Firm F-2393
6.0 ADDITIONAL REQUIREMENTS UNDER PSD
An analysis of ambient air quality impacts is not provided with this application as there are no National Ambient Air Quality Standards (NAAQS) or PSD increments established for GHG (per EPA’s PSD and Title V Permitting Guidance for Greenhouse Gases). Since there are no NAAQS or PSD increments for GHGs, the requirements in sections 52.21(k) and 51.166(k) of EPA’s regulations to demonstrate that a source does not cause contribute to a violation of the NAAQS are not applicable to GHGs. Therefore, there is no requirement to conduct dispersion modeling or ambient monitoring for CO2 or GHGs. Additionally, an analysis of Air Quality Related Values (AQRV) is not provided because GHG does not contribute to regional haze or terrestrial/aquatic acid deposition. A pre-construction monitoring analysis for GHG is not being provided with this application in accordance with EPA’s recommendations (per EPA’s PSD and Title V Permitting Guidance for Greenhouse Gases): EPA does not consider it necessary for applicants to gather monitoring data to assess ambient air quality for GHGs under section 52.21(m)(1)(ii), section 51.166(m)(1)(ii), or similar provisions that may be contained in state rules based on EPA’s rules. GHGs do not affect “ambient air quality” in the sense that EPA intended when these parts of EPA’s rules were initially drafted. Considering the nature of GHG emissions and their global impacts, EPA does not believe it is practical or appropriate to expect permitting authorities to collect monitoring data for purpose of assessing ambient air impacts of GHGs
6.1 IMPACT EVALUATION PURSUANT TO FEDERAL ACTION
6.1.1 Federal Endangered Species Act Section 7 of the Federal Endangered Species Act (ESA) requires that any activity funded, authorized, or implemented by a federal agency does not jeopardize the continued existence of a listed species or result in the destruction or adverse modification of designated critical habitat (16 U.S.C. §1536). Under 40 CFR §402, federal agencies are required to prepare a biological assessment to determine the impact of the proposed action on endangered species. TRPP conducted this biological assessment and determined that the project will not adversely impact any federal or state-listed threatened and endangered species or critical habitat for these species. A copy of the biological assessment will be provided to USEPA Region 6 under separate cover.
6.1.2 National Historic Preservation Act Section 106 of the National Historic Preservation Act (NHPA) requires federal agencies to address the effects of their actions on historic properties and afford the Advisory Council for Historic Preservation (ACHP) the opportunity to

Environmental Resources Management 36 0189555\A5469 Final Tenaska GHG PSD Rpt.docx Texas Registered Engineering Firm F-2393
comment on the impact to historic properties and preservation as result of federal action. TRPP conducted site survey in accordance with the survey methods defined in the Department of Interior Standard and Guidelines and the guidelines of the Council of Texas Archaeologists. Based on this survey, no sites of historical or cultural significance were identified that would be affected by this project. A copy of the historical and cultural resource assessment will be provided to USEPA Region 6 under separate cover.

TCEQ Permit Application Forms Appendix A
July 2013
Project No. 0189555
Environmental Resources Management 15810 Park Ten Place, Suite 300
Houston, Texas 77084 (281) 600-1000

TCEQ-10400 (09/07) Page 1 of 2
TCEQ Core Data Form
For detailed instructions regarding completion of this form, please read the Core Data Form Instructions or call 512-239-5175.
SECTION I: General Information
1. Reason for Submission (If other is checked please describe in space provided) New Permit, Registration or Authorization (Core Data Form should be submitted with the program application)
Renewal (Core Data Form should be submitted with the renewal form) Other 2. Attachments Describe Any Attachments: (ex. Title V Application, Waste Transporter Application, etc.) Yes No PSD Permit Application 3. Customer Reference Number (if issued) Follow this link to search
for CN or RN numbers in Central Registry**
4. Regulated Entity Reference Number (if issued)
CN RN 0
SECTION II: Customer Information
5. Effective Date for Customer Information Updates (mm/dd/yyyy) 7/22/2013 6. Customer Role (Proposed or Actual) – as it relates to the Regulated Entity listed on this form. Please check only one of the following:
Owner Operator Owner & Operator Occupational Licensee Responsible Party Voluntary Cleanup Applicant
Other:
7. General Customer Information
New Customer Update to Customer Information Change in Regulated Entity Ownership Change in Legal Name (Verifiable with the Texas Secretary of State) No Change**
**If “No Change” and Section I is complete, skip to Section III – Regulated Entity Information.
8. Type of Customer: Corporation Individual Sole Proprietorship- D.B.A
City Government County Government Federal Government State Government
Other Government General Partnership Limited Partnership Other:
9. Customer Legal Name (If an individual, print last name first: ex: Doe, John) If new Customer, enter previous Customer below End Date:
Tenaska Roans Prairie Partners, LLC
10. Mailing Address:
1044 N. 115th Street, Suite 400
City Omaha State NE ZIP 68154 ZIP + 4 4446
11. Country Mailing Information (if outside USA) 12. E-Mail Address (if applicable) 13. Telephone Number 14. Extension or Code 15. Fax Number (if applicable)
( 402 ) 938-1661 ( 402 ) 691-9530 16. Federal Tax ID (9 digits) 17. TX State Franchise Tax ID (11 digits) 18. DUNS Number(if applicable) 19. TX SOS Filing Number (if applicable)
462009341 TBD 78708590 20. Number of Employees 21. Independently Owned and Operated?
0-20 21-100 101-250 251-500 501 and higher Yes No
SECTION III: Regulated Entity Information
22. General Regulated Entity Information (If ‘New Regulated Entity” is selected below this form should be accompanied by a permit application)
New Regulated Entity Update to Regulated Entity Name Update to Regulated Entity Information No Change** (See below)
**If “NO CHANGE” is checked and Section I is complete, skip to Section IV, Preparer Information.
23. Regulated Entity Name (name of the site where the regulated action is taking place)
Tenaska Roans Prairie Generating Station
TCEQ Use Only


TCEQ – 10252 (Revised 02/12) PI-1 Form This form is for use by facilities subject to air quality permit requirements and may be revised periodically. (APDG 5171v18) PI-1 Form FINAL - Siemens.doc Page 1 of 9
Texas Commission on Environmental Quality Form PI-1 General Application for
Air Preconstruction Permit and Amendment
Important Note: The agency requires that a Core Data Form be submitted on all incoming applications unless a Regulated Entity and Customer Reference Number have been issued and no core data information has changed. For more information regarding the Core Data Form, call (512) 239-5175 or go to www.tceq.texas.gov/permitting/central_registry/guidance.html.
I. Applicant Information
A. Company or Other Legal Name: Tenaska Roans Prairie Partners, LLC
Texas Secretary of State Charter/Registration Number (if applicable):
B. Company Official Contact Name: Mr. Greg Kunkel
Title: Vice President, Environmental Affairs
Mailing Address: 1044 N. 115th Street, Suite 400
City: Omaha State: NE ZIP Code: 68154-4446
Telephone No.: 402-691-9500 Fax No.: 402-691-9530 E-mail Address: [email protected]
C. Technical Contact Name: Mr. Larry Carlson
Title: Director, Air Programs
Company Name: Tenaska, Inc.
Mailing Address: 1044 N. 115th Street, Suite 400
City: Omaha State: NE ZIP Code: 68154-4446
Telephone No.: 402-938-1661 Fax No.: 402-691-9530 E-mail Address: [email protected]
D. Site Name: Tenaska Roans Prairie Generating Station
E. Area Name/Type of Facility: Electric Generating Station Permanent Portable
F. Principal Company Product or Business: Electricity Generation
Principal Standard Industrial Classification Code (SIC): 4911
Principal North American Industry Classification System (NAICS): 221112
G. Projected Start of Construction Date: January 2015
Projected Start of Operation Date: June 2016
H. Facility and Site Location Information (If no street address, provide clear driving directions to the site in writing.):
From College Station, Texas, head northeast on Farm to Market Rd 60/University Dr. toward Jane St. Turn right onto TX-6 Frontage S. Turn left onto Harvey Rd. Slight right onto TX-30 E. Site is approximately 22.4 miles down TX-30 E on the right hand side.
City/Town: Shiro County: Grimes ZIP Code: 77873
Latitude (nearest second): 30° 35' 16" N Longitude (nearest second): 95° 55' 38" W

TCEQ – 10252 (Revised 02/12) PI-1 Form This form is for use by facilities subject to air quality permit requirements and may be revised periodically. (APDG 5171v18) PI-1 Form FINAL - Siemens.doc Page 2 of 9
Texas Commission on Environmental Quality Form PI-1 General Application for
Air Preconstruction Permit and Amendment
I. Applicant Information (continued)
I. Account Identification Number (leave blank if new site or facility):
J. Core Data Form.
Is the Core Data Form (Form 10400) attached? If No, provide customer reference number and regulated entity number (complete K and L).
YES NO
K. Customer Reference Number (CN):
L. Regulated Entity Number (RN):
II. General Information
A. Is confidential information submitted with this application? If Yes, mark each confidential page confidential in large red letters at the bottom of each page.
YES NO
B. Is this application in response to an investigation or enforcement action? If Yes, attach a copy of any correspondence from the agency.
YES NO
C. Number of New Jobs: 0-20
D. Provide the name of the State Senator and State Representative and district numbers for this facility site:
Senator: Charles Schwertner District No.: 5
Representative: Lois W. Kolkhorst District No.: 13
III. Type of Permit Action Requested
A. Mark the appropriate box indicating what type of action is requested.
Initial Amendment Revision (30 TAC 116.116(e)) Change of Location Relocation
B. Permit Number (if existing): TBD
C. Permit Type: Mark the appropriate box indicating what type of permit is requested. (check all that apply, skip for change of location)
Construction Flexible Multiple Plant Nonattainment Prevention of Significant Deterioration
Hazardous Air Pollutant Major Source Plant-Wide Applicability Limit
Other:
D. Is a permit renewal application being submitted in conjunction with this amendment in accordance with 30 TAC 116.315(c).
YES NO

TCEQ – 10252 (Revised 02/12) PI-1 Form This form is for use by facilities subject to air quality permit requirements and may be revised periodically. (APDG 5171v18) PI-1 Form FINAL - Siemens.doc Page 3 of 9
Texas Commission on Environmental Quality Form PI-1 General Application for
Air Preconstruction Permit and Amendment
III. Type of Permit Action Requested (continued)
E. Is this application for a change of location of previously permitted facilities? If Yes, complete III.E.1 - III.E.4.
YES NO
1. Current Location of Facility (If no street address, provide clear driving directions to the site in writing.):
Street Address:
City: County: ZIP Code:
2. Proposed Location of Facility (If no street address, provide clear driving directions to the site in writing.):
Street Address:
City: County: ZIP Code:
3. Will the proposed facility, site, and plot plan meet all current technical requirements of the permit special conditions? If No, attach detailed information.
YES NO
4. Is the site where the facility is moving considered a major source of criteria pollutants or HAPs?
YES NO
F. Consolidation into this Permit: List any standard permits, exemptions or permits by rule to be consolidated into this permit including those for planned maintenance, startup, and shutdown.
List:
G. Are you permitting planned maintenance, startup, and shutdown emissions? If Yes, attach information on any changes to emissions under this application as specified in VII and VIII.
YES NO
H. Federal Operating Permit Requirements (30 TAC Chapter 122 Applicability)
Is this facility located at a site required to obtain a federal operating permit? If Yes, list all associated permit number(s), attach pages as needed).
YES NO To be determined
Associated Permit No (s.): TBD
1. Identify the requirements of 30 TAC Chapter 122 that will be triggered if this application is approved.
FOP Significant Revision FOP Minor Application for an FOP Revision To Be Determined
Operational Flexibility/Off-Permit Notification Streamlined Revision for GOP None

TCEQ – 10252 (Revised 02/12) PI-1 Form This form is for use by facilities subject to air quality permit requirements and may be revised periodically. (APDG 5171v18) PI-1 Form FINAL - Siemens.doc Page 4 of 9
Texas Commission on Environmental Quality Form PI-1 General Application for
Air Preconstruction Permit and Amendment
III. Type of Permit Action Requested (continued)
H. Federal Operating Permit Requirements (30 TAC Chapter 122 Applicability) (continued)
2. Identify the type(s) of FOP(s) issued and/or FOP application(s) submitted/pending for the site. (check all that apply)
GOP Issued GOP application/revision application submitted or under APD review
SOP Issued SOP application/revision application submitted or under APD review
IV. Public Notice Applicability
A. Is this a new permit application or a change of location application? YES NO
B. Is this application for a concrete batch plant? If Yes, complete V.C.1 – V.C.2. YES NO
C. Is this an application for a major modification of a PSD, nonattainment, FCAA 112(g) permit, or exceedance of a PAL permit?
YES NO
D. Is this application for a PSD or major modification of a PSD located within 100 kilometers or less of an affected state or Class I Area?
YES NO
If Yes, list the affected state(s) and/or Class I Area(s).
E. Is this a state permit amendment application? If Yes, complete IV.E.1. – IV.E.3. --- NO
1. Is there any change in character of emissions in this application? YES NO
2. Is there a new air contaminant in this application? YES NO
3. Do the facilities handle, load, unload, dry, manufacture, or process grain, seed, legumes, or vegetables fibers (agricultural facilities)?
YES NO
F. List the total annual emission increases associated with the application (list all that apply and attach additional sheets as needed):
Volatile Organic Compounds (VOC): 40.96 tpy
Sulfur Dioxide (SO2): 13.61 tpy
Carbon Monoxide (CO): 354.10 tpy
Nitrogen Oxides (NOx): 375.32 tpy
Particulate Matter (PM): 44.39 tpy
PM10 microns or less (PM10): 44.39 tpy
PM2.5 microns or less (PM2.5): 44.39 tpy
Sulfuric Acid Mist (H2SO4): 2.34 tpy
Lead (Pb): 0.046 tpy
Hazardous Air Pollutants (HAPs): 4.60 tpy
Other speciated air contaminants not listed above: CO2 – 1,278,052 tpy; CO2e – 1,279,559 tpy

TCEQ – 10252 (Revised 02/12) PI-1 Form This form is for use by facilities subject to air quality permit requirements and may be revised periodically. (APDG 5171v18) PI-1 Form FINAL - Siemens.doc Page 5 of 9
Texas Commission on Environmental Quality Form PI-1 General Application for
Air Preconstruction Permit and Amendment
V. Public Notice Information (complete if applicable)
A. Public Notice Contact Name: Ms. Christie Couvillion
Title: Sr. Environmental Specialist
Mailing Address: 1044 N. 115th Street, Suite 400
City: Omaha State: NE ZIP Code: 68154-4446
Telephone No.: 402-691-9500
B. Name of the Public Place: Navasota Public Library
Physical Address (No P.O. Boxes): 1411 E. Washington Ave.
City: Navasota County: Grimes ZIP Code: 77868
The public place has granted authorization to place the application for public viewing and copying. YES NO
The public place has internet access available for the public. YES NO
C. Concrete Batch Plants, PSD, and Nonattainment Permits
1. County Judge Information (For Concrete Batch Plants and PSD and/or Nonattainment Permits) for this facility site.
The Honorable: Betty Shiflett
Mailing Address: P.O. Box 160
City: Anderson State: Texas ZIP Code: 77830
2. Is the facility located in a municipality or an extraterritorial jurisdiction of a municipality? (For Concrete Batch Plants)
YES NO
Presiding Officers Name(s): N/A
Title:
Mailing Address:
City: State: ZIP Code:
3. Provide the name, mailing address of the chief executive of the city for the location where the facility is or will be located.
Chief Executive: Mayor Gail Sowell
Mailing Address: P.O. Box 592
City: Anderson State: Texas ZIP Code: 77830
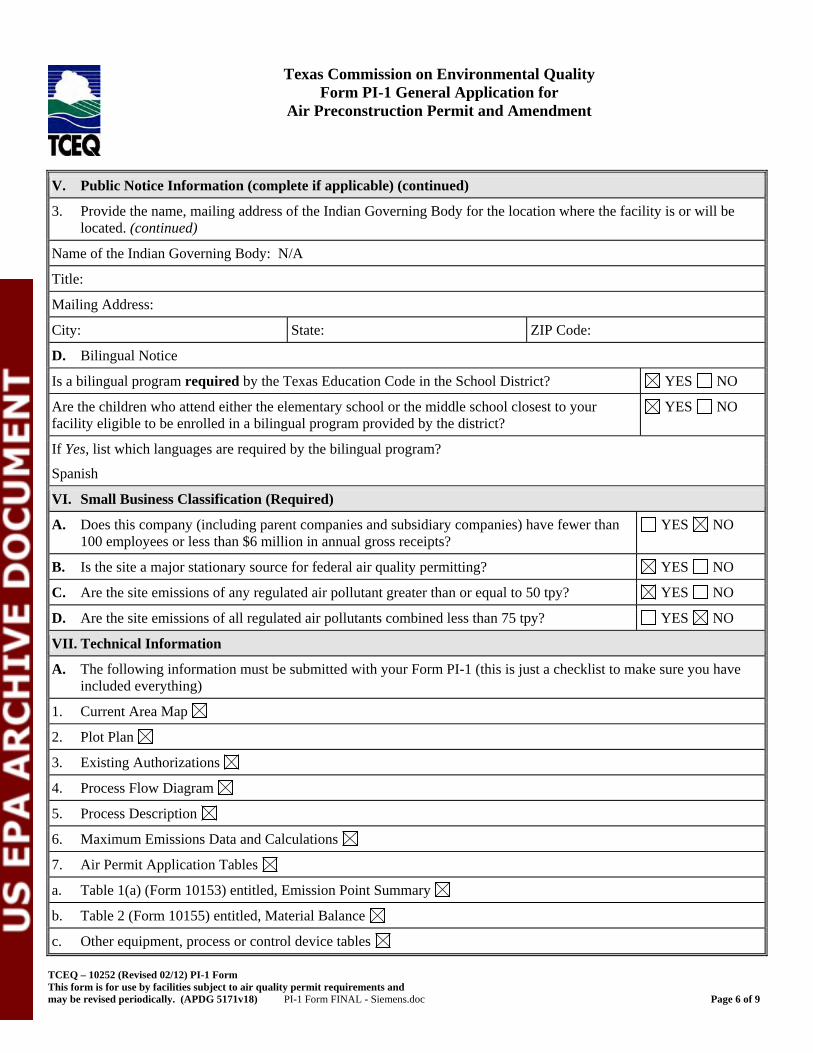
TCEQ – 10252 (Revised 02/12) PI-1 Form This form is for use by facilities subject to air quality permit requirements and may be revised periodically. (APDG 5171v18) PI-1 Form FINAL - Siemens.doc Page 6 of 9
Texas Commission on Environmental Quality Form PI-1 General Application for
Air Preconstruction Permit and Amendment
V. Public Notice Information (complete if applicable) (continued)
3. Provide the name, mailing address of the Indian Governing Body for the location where the facility is or will be located. (continued)
Name of the Indian Governing Body: N/A
Title:
Mailing Address:
City: State: ZIP Code:
D. Bilingual Notice
Is a bilingual program required by the Texas Education Code in the School District? YES NO
Are the children who attend either the elementary school or the middle school closest to your facility eligible to be enrolled in a bilingual program provided by the district?
YES NO
If Yes, list which languages are required by the bilingual program?
Spanish
VI. Small Business Classification (Required)
A. Does this company (including parent companies and subsidiary companies) have fewer than 100 employees or less than $6 million in annual gross receipts?
YES NO
B. Is the site a major stationary source for federal air quality permitting? YES NO
C. Are the site emissions of any regulated air pollutant greater than or equal to 50 tpy? YES NO
D. Are the site emissions of all regulated air pollutants combined less than 75 tpy? YES NO
VII. Technical Information
A. The following information must be submitted with your Form PI-1 (this is just a checklist to make sure you have included everything)
1. Current Area Map
2. Plot Plan
3. Existing Authorizations
4. Process Flow Diagram
5. Process Description
6. Maximum Emissions Data and Calculations
7. Air Permit Application Tables
a. Table 1(a) (Form 10153) entitled, Emission Point Summary
b. Table 2 (Form 10155) entitled, Material Balance
c. Other equipment, process or control device tables

TCEQ – 10252 (Revised 02/12) PI-1 Form This form is for use by facilities subject to air quality permit requirements and may be revised periodically. (APDG 5171v18) PI-1 Form FINAL - Siemens.doc Page 7 of 9
Texas Commission on Environmental Quality Form PI-1 General Application for
Air Preconstruction Permit and Amendment
VII. Technical Information
B. Are any schools located within 3,000 feet of this facility? YES NO
C. Maximum Operating Schedule:
Hours: 24 Day(s): 365 Week(s): 52 Year(s): 2,920 hrs/yr
Seasonal Operation? If Yes, please describe in the space provide below. YES NO
D. Have the planned MSS emissions been previously submitted as part of an emissions inventory? YES NO
Provide a list of each planned MSS facility or related activity and indicate which years the MSS activities have been included in the emissions inventories. Attach pages as needed.
E. Does this application involve any air contaminants for which a disaster review is required? YES NO
F. Does this application include a pollutant of concern on the Air Pollutant Watch List (APWL)? YES NO
VIII. State Regulatory Requirements Applicants must demonstrate compliance with all applicable state regulations to obtain a permit or amendment. The application must contain detailed attachments addressing applicability or non applicability; identify state regulations; show how requirements are met; and include compliance demonstrations.
A. Will the emissions from the proposed facility protect public health and welfare, and comply with all rules and regulations of the TCEQ?
YES NO
B. Will emissions of significant air contaminants from the facility be measured? YES NO
C. Is the Best Available Control Technology (BACT) demonstration attached? YES NO
D. Will the proposed facilities achieve the performance represented in the permit application as demonstrated through recordkeeping, monitoring, stack testing, or other applicable methods?
YES NO
IX. Federal Regulatory Requirements Applicants must demonstrate compliance with all applicable federal regulations to obtain a permit or amendment The application must contain detailed attachments addressing applicability or non applicability; identify federal regulation subparts; show how requirements are met; and include compliance demonstrations.
A. Does Title 40 Code of Federal Regulations Part 60, (40 CFR Part 60) New Source Performance Standard (NSPS) apply to a facility in this application?
YES NO
B. Does 40 CFR Part 61, National Emissions Standard for Hazardous Air Pollutants (NESHAP) apply to a facility in this application?
YES NO
C. Does 40 CFR Part 63, Maximum Achievable Control Technology (MACT) standard apply to a facility in this application?
YES NO
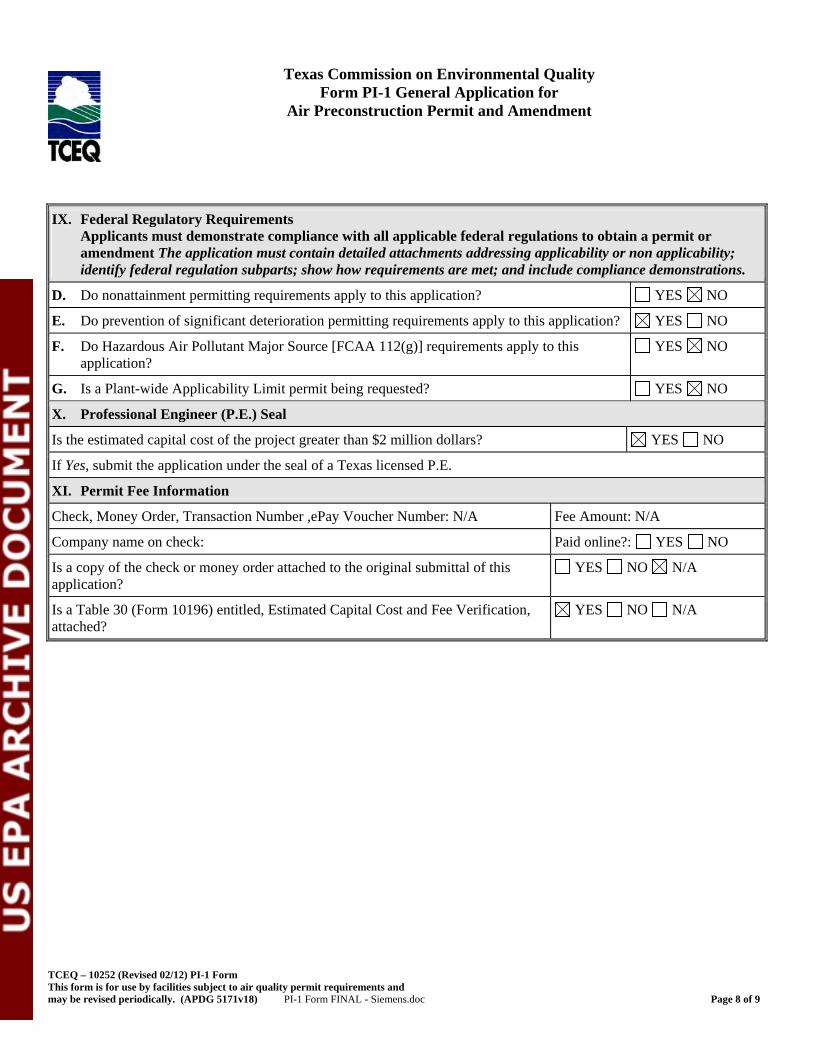
TCEQ – 10252 (Revised 02/12) PI-1 Form This form is for use by facilities subject to air quality permit requirements and may be revised periodically. (APDG 5171v18) PI-1 Form FINAL - Siemens.doc Page 8 of 9
Texas Commission on Environmental Quality Form PI-1 General Application for
Air Preconstruction Permit and Amendment
IX. Federal Regulatory Requirements Applicants must demonstrate compliance with all applicable federal regulations to obtain a permit or amendment The application must contain detailed attachments addressing applicability or non applicability; identify federal regulation subparts; show how requirements are met; and include compliance demonstrations.
D. Do nonattainment permitting requirements apply to this application? YES NO
E. Do prevention of significant deterioration permitting requirements apply to this application? YES NO
F. Do Hazardous Air Pollutant Major Source [FCAA 112(g)] requirements apply to this application?
YES NO
G. Is a Plant-wide Applicability Limit permit being requested? YES NO
X. Professional Engineer (P.E.) Seal
Is the estimated capital cost of the project greater than $2 million dollars? YES NO
If Yes, submit the application under the seal of a Texas licensed P.E.
XI. Permit Fee Information
Check, Money Order, Transaction Number ,ePay Voucher Number: N/A Fee Amount: N/A
Company name on check: Paid online?: YES NO
Is a copy of the check or money order attached to the original submittal of this application?
YES NO N/A
Is a Table 30 (Form 10196) entitled, Estimated Capital Cost and Fee Verification, attached?
YES NO N/A


TCEQ – 10252 (Revised 02/12) PI-1 Form This form is for use by facilities subject to air quality permit requirements and may be revised periodically. (APDG 5171v18) PI-1 Form FINAL - GE 05.doc Page 1 of 9
Texas Commission on Environmental Quality Form PI-1 General Application for
Air Preconstruction Permit and Amendment
Important Note: The agency requires that a Core Data Form be submitted on all incoming applications unless a Regulated Entity and Customer Reference Number have been issued and no core data information has changed. For more information regarding the Core Data Form, call (512) 239-5175 or go to www.tceq.texas.gov/permitting/central_registry/guidance.html.
I. Applicant Information
A. Company or Other Legal Name: Tenaska Roans Prairie Partners, LLC
Texas Secretary of State Charter/Registration Number (if applicable):
B. Company Official Contact Name: Mr. Greg Kunkel
Title: Vice President, Environmental Affairs
Mailing Address: 1044 N. 115th Street, Suite 400
City: Omaha State: NE ZIP Code: 68154-4446
Telephone No.: 402-691-9500 Fax No.: 402-691-9530 E-mail Address: [email protected]
C. Technical Contact Name: Mr. Larry Carlson
Title: Director, Air Programs
Company Name: Tenaska, Inc.
Mailing Address: 1044 N. 115th Street, Suite 400
City: Omaha State: NE ZIP Code: 68154-4446
Telephone No.: 402-938-1661 Fax No.: 402-691-9530 E-mail Address: [email protected]
D. Site Name: Tenaska Roans Prairie Generating Station
E. Area Name/Type of Facility: Electric Generating Station Permanent Portable
F. Principal Company Product or Business: Electricity Generation
Principal Standard Industrial Classification Code (SIC): 4911
Principal North American Industry Classification System (NAICS): 221112
G. Projected Start of Construction Date: January 2015
Projected Start of Operation Date: June 2016
H. Facility and Site Location Information (If no street address, provide clear driving directions to the site in writing.):
From College Station, Texas, head northeast on Farm to Market Rd 60/University Dr. toward Jane St. Turn right onto TX-6 Frontage S. Turn left onto Harvey Rd. Slight right onto TX-30 E. Site is approximately 22.4 miles down TX-30 E on the right hand side.
City/Town: Shiro County: Grimes ZIP Code: 77873
Latitude (nearest second): 30° 35' 16" N Longitude (nearest second): 95° 55' 38" W

TCEQ – 10252 (Revised 02/12) PI-1 Form This form is for use by facilities subject to air quality permit requirements and may be revised periodically. (APDG 5171v18) PI-1 Form FINAL - GE 05.doc Page 2 of 9
Texas Commission on Environmental Quality Form PI-1 General Application for
Air Preconstruction Permit and Amendment
I. Applicant Information (continued)
I. Account Identification Number (leave blank if new site or facility):
J. Core Data Form.
Is the Core Data Form (Form 10400) attached? If No, provide customer reference number and regulated entity number (complete K and L).
YES NO
K. Customer Reference Number (CN):
L. Regulated Entity Number (RN):
II. General Information
A. Is confidential information submitted with this application? If Yes, mark each confidential page confidential in large red letters at the bottom of each page.
YES NO
B. Is this application in response to an investigation or enforcement action? If Yes, attach a copy of any correspondence from the agency.
YES NO
C. Number of New Jobs: 0-20
D. Provide the name of the State Senator and State Representative and district numbers for this facility site:
Senator: Charles Schwertner District No.: 5
Representative: Lois W. Kolkhorst District No.: 13
III. Type of Permit Action Requested
A. Mark the appropriate box indicating what type of action is requested.
Initial Amendment Revision (30 TAC 116.116(e)) Change of Location Relocation
B. Permit Number (if existing): TBD
C. Permit Type: Mark the appropriate box indicating what type of permit is requested. (check all that apply, skip for change of location)
Construction Flexible Multiple Plant Nonattainment Prevention of Significant Deterioration
Hazardous Air Pollutant Major Source Plant-Wide Applicability Limit
Other:
D. Is a permit renewal application being submitted in conjunction with this amendment in accordance with 30 TAC 116.315(c).
YES NO

TCEQ – 10252 (Revised 02/12) PI-1 Form This form is for use by facilities subject to air quality permit requirements and may be revised periodically. (APDG 5171v18) PI-1 Form FINAL - GE 05.doc Page 3 of 9
Texas Commission on Environmental Quality Form PI-1 General Application for
Air Preconstruction Permit and Amendment
III. Type of Permit Action Requested (continued)
E. Is this application for a change of location of previously permitted facilities? If Yes, complete III.E.1 - III.E.4.
YES NO
1. Current Location of Facility (If no street address, provide clear driving directions to the site in writing.):
Street Address:
City: County: ZIP Code:
2. Proposed Location of Facility (If no street address, provide clear driving directions to the site in writing.):
Street Address:
City: County: ZIP Code:
3. Will the proposed facility, site, and plot plan meet all current technical requirements of the permit special conditions? If No, attach detailed information.
YES NO
4. Is the site where the facility is moving considered a major source of criteria pollutants or HAPs?
YES NO
F. Consolidation into this Permit: List any standard permits, exemptions or permits by rule to be consolidated into this permit including those for planned maintenance, startup, and shutdown.
List:
G. Are you permitting planned maintenance, startup, and shutdown emissions? If Yes, attach information on any changes to emissions under this application as specified in VII and VIII.
YES NO
H. Federal Operating Permit Requirements (30 TAC Chapter 122 Applicability)
Is this facility located at a site required to obtain a federal operating permit? If Yes, list all associated permit number(s), attach pages as needed).
YES NO To be determined
Associated Permit No (s.): TBD
1. Identify the requirements of 30 TAC Chapter 122 that will be triggered if this application is approved.
FOP Significant Revision FOP Minor Application for an FOP Revision To Be Determined
Operational Flexibility/Off-Permit Notification Streamlined Revision for GOP None

TCEQ – 10252 (Revised 02/12) PI-1 Form This form is for use by facilities subject to air quality permit requirements and may be revised periodically. (APDG 5171v18) PI-1 Form FINAL - GE 05.doc Page 4 of 9
Texas Commission on Environmental Quality Form PI-1 General Application for
Air Preconstruction Permit and Amendment
III. Type of Permit Action Requested (continued)
H. Federal Operating Permit Requirements (30 TAC Chapter 122 Applicability) (continued)
2. Identify the type(s) of FOP(s) issued and/or FOP application(s) submitted/pending for the site. (check all that apply)
GOP Issued GOP application/revision application submitted or under APD review
SOP Issued SOP application/revision application submitted or under APD review
IV. Public Notice Applicability
A. Is this a new permit application or a change of location application? YES NO
B. Is this application for a concrete batch plant? If Yes, complete V.C.1 – V.C.2. YES NO
C. Is this an application for a major modification of a PSD, nonattainment, FCAA 112(g) permit, or exceedance of a PAL permit?
YES NO
D. Is this application for a PSD or major modification of a PSD located within 100 kilometers or less of an affected state or Class I Area?
YES NO
If Yes, list the affected state(s) and/or Class I Area(s).
E. Is this a state permit amendment application? If Yes, complete IV.E.1. – IV.E.3. --- NO
1. Is there any change in character of emissions in this application? YES NO
2. Is there a new air contaminant in this application? YES NO
3. Do the facilities handle, load, unload, dry, manufacture, or process grain, seed, legumes, or vegetables fibers (agricultural facilities)?
YES NO
F. List the total annual emission increases associated with the application (list all that apply and attach additional sheets as needed):
Volatile Organic Compounds (VOC): 16.63 tpy
Sulfur Dioxide (SO2): 32.65 tpy
Carbon Monoxide (CO): 381.24 tpy
Nitrogen Oxides (NOx): 370.04 tpy
Particulate Matter (PM): 45.29 tpy
PM10 microns or less (PM10): 45.29 tpy
PM2.5 microns or less (PM2.5): 45.29 tpy
Sulfuric Acid Mist (H2SO4): 1.34 tpy
Lead (Pb): 0.045 tpy
Hazardous Air Pollutants (HAPs): 4.48 tpy
Other speciated air contaminants not listed above: CO2 – 1,244,632 tpy; CO2e – 1,246,107 tpy

TCEQ – 10252 (Revised 02/12) PI-1 Form This form is for use by facilities subject to air quality permit requirements and may be revised periodically. (APDG 5171v18) PI-1 Form FINAL - GE 05.doc Page 5 of 9
Texas Commission on Environmental Quality Form PI-1 General Application for
Air Preconstruction Permit and Amendment
V. Public Notice Information (complete if applicable)
A. Public Notice Contact Name: Ms. Christie Couvillion
Title: Sr. Environmental Specialist
Mailing Address: 1044 N. 115th Street, Suite 400
City: Omaha State: NE ZIP Code: 68154-4446
Telephone No.: 402-691-9500
B. Name of the Public Place: Navasota Public Library
Physical Address (No P.O. Boxes): 1411 E. Washington Ave.
City: Navasota County: Grimes ZIP Code: 77868
The public place has granted authorization to place the application for public viewing and copying. YES NO
The public place has internet access available for the public. YES NO
C. Concrete Batch Plants, PSD, and Nonattainment Permits
1. County Judge Information (For Concrete Batch Plants and PSD and/or Nonattainment Permits) for this facility site.
The Honorable: Betty Shiflett
Mailing Address: P.O. Box 160
City: Anderson State: Texas ZIP Code: 77830
2. Is the facility located in a municipality or an extraterritorial jurisdiction of a municipality? (For Concrete Batch Plants)
YES NO
Presiding Officers Name(s): N/A
Title:
Mailing Address:
City: State: ZIP Code:
3. Provide the name, mailing address of the chief executive of the city for the location where the facility is or will be located.
Chief Executive: Mayor Gail Sowell
Mailing Address: P.O. Box 592
City: Anderson State: Texas ZIP Code: 77830

TCEQ – 10252 (Revised 02/12) PI-1 Form This form is for use by facilities subject to air quality permit requirements and may be revised periodically. (APDG 5171v18) PI-1 Form FINAL - GE 05.doc Page 6 of 9
Texas Commission on Environmental Quality Form PI-1 General Application for
Air Preconstruction Permit and Amendment
V. Public Notice Information (complete if applicable) (continued)
3. Provide the name, mailing address of the Indian Governing Body for the location where the facility is or will be located. (continued)
Name of the Indian Governing Body: N/A
Title:
Mailing Address:
City: State: ZIP Code:
D. Bilingual Notice
Is a bilingual program required by the Texas Education Code in the School District? YES NO
Are the children who attend either the elementary school or the middle school closest to your facility eligible to be enrolled in a bilingual program provided by the district?
YES NO
If Yes, list which languages are required by the bilingual program?
Spanish
VI. Small Business Classification (Required)
A. Does this company (including parent companies and subsidiary companies) have fewer than 100 employees or less than $6 million in annual gross receipts?
YES NO
B. Is the site a major stationary source for federal air quality permitting? YES NO
C. Are the site emissions of any regulated air pollutant greater than or equal to 50 tpy? YES NO
D. Are the site emissions of all regulated air pollutants combined less than 75 tpy? YES NO
VII. Technical Information
A. The following information must be submitted with your Form PI-1 (this is just a checklist to make sure you have included everything)
1. Current Area Map
2. Plot Plan
3. Existing Authorizations
4. Process Flow Diagram
5. Process Description
6. Maximum Emissions Data and Calculations
7. Air Permit Application Tables
a. Table 1(a) (Form 10153) entitled, Emission Point Summary
b. Table 2 (Form 10155) entitled, Material Balance
c. Other equipment, process or control device tables

TCEQ – 10252 (Revised 02/12) PI-1 Form This form is for use by facilities subject to air quality permit requirements and may be revised periodically. (APDG 5171v18) PI-1 Form FINAL - GE 05.doc Page 7 of 9
Texas Commission on Environmental Quality Form PI-1 General Application for
Air Preconstruction Permit and Amendment
VII. Technical Information
B. Are any schools located within 3,000 feet of this facility? YES NO
C. Maximum Operating Schedule:
Hours: 24 Day(s): 365 Week(s): 52 Year(s): 2,920 hrs/yr
Seasonal Operation? If Yes, please describe in the space provide below. YES NO
D. Have the planned MSS emissions been previously submitted as part of an emissions inventory? YES NO
Provide a list of each planned MSS facility or related activity and indicate which years the MSS activities have been included in the emissions inventories. Attach pages as needed.
E. Does this application involve any air contaminants for which a disaster review is required? YES NO
F. Does this application include a pollutant of concern on the Air Pollutant Watch List (APWL)? YES NO
VIII. State Regulatory Requirements Applicants must demonstrate compliance with all applicable state regulations to obtain a permit or amendment. The application must contain detailed attachments addressing applicability or non applicability; identify state regulations; show how requirements are met; and include compliance demonstrations.
A. Will the emissions from the proposed facility protect public health and welfare, and comply with all rules and regulations of the TCEQ?
YES NO
B. Will emissions of significant air contaminants from the facility be measured? YES NO
C. Is the Best Available Control Technology (BACT) demonstration attached? YES NO
D. Will the proposed facilities achieve the performance represented in the permit application as demonstrated through recordkeeping, monitoring, stack testing, or other applicable methods?
YES NO
IX. Federal Regulatory Requirements Applicants must demonstrate compliance with all applicable federal regulations to obtain a permit or amendment The application must contain detailed attachments addressing applicability or non applicability; identify federal regulation subparts; show how requirements are met; and include compliance demonstrations.
A. Does Title 40 Code of Federal Regulations Part 60, (40 CFR Part 60) New Source Performance Standard (NSPS) apply to a facility in this application?
YES NO
B. Does 40 CFR Part 61, National Emissions Standard for Hazardous Air Pollutants (NESHAP) apply to a facility in this application?
YES NO
C. Does 40 CFR Part 63, Maximum Achievable Control Technology (MACT) standard apply to a facility in this application?
YES NO

TCEQ – 10252 (Revised 02/12) PI-1 Form This form is for use by facilities subject to air quality permit requirements and may be revised periodically. (APDG 5171v18) PI-1 Form FINAL - GE 05.doc Page 8 of 9
Texas Commission on Environmental Quality Form PI-1 General Application for
Air Preconstruction Permit and Amendment
IX. Federal Regulatory Requirements Applicants must demonstrate compliance with all applicable federal regulations to obtain a permit or amendment The application must contain detailed attachments addressing applicability or non applicability; identify federal regulation subparts; show how requirements are met; and include compliance demonstrations.
D. Do nonattainment permitting requirements apply to this application? YES NO
E. Do prevention of significant deterioration permitting requirements apply to this application? YES NO
F. Do Hazardous Air Pollutant Major Source [FCAA 112(g)] requirements apply to this application?
YES NO
G. Is a Plant-wide Applicability Limit permit being requested? YES NO
X. Professional Engineer (P.E.) Seal
Is the estimated capital cost of the project greater than $2 million dollars? YES NO
If Yes, submit the application under the seal of a Texas licensed P.E.
XI. Permit Fee Information
Check, Money Order, Transaction Number ,ePay Voucher Number: N/A Fee Amount: N/A
Company name on check: Paid online?: YES NO
Is a copy of the check or money order attached to the original submittal of this application?
YES NO N/A
Is a Table 30 (Form 10196) entitled, Estimated Capital Cost and Fee Verification, attached?
YES NO N/A


TCEQ – 10252 (Revised 02/12) PI-1 Form This form is for use by facilities subject to air quality permit requirements and may be revised periodically. (APDG 5171v18) PI-1 Form FINAL - GE 04.doc Page 1 of 9
Texas Commission on Environmental Quality Form PI-1 General Application for
Air Preconstruction Permit and Amendment
Important Note: The agency requires that a Core Data Form be submitted on all incoming applications unless a Regulated Entity and Customer Reference Number have been issued and no core data information has changed. For more information regarding the Core Data Form, call (512) 239-5175 or go to www.tceq.texas.gov/permitting/central_registry/guidance.html.
I. Applicant Information
A. Company or Other Legal Name: Tenaska Roans Prairie Partners, LLC
Texas Secretary of State Charter/Registration Number (if applicable):
B. Company Official Contact Name: Mr. Greg Kunkel
Title: Vice President, Environmental Affairs
Mailing Address: 1044 N. 115th Street, Suite 400
City: Omaha State: NE ZIP Code: 68154-4446
Telephone No.: 402-691-9500 Fax No.: 402-691-9530 E-mail Address: [email protected]
C. Technical Contact Name: Mr. Larry Carlson
Title: Director, Air Programs
Company Name: Tenaska, Inc.
Mailing Address: 1044 N. 115th Street, Suite 400
City: Omaha State: NE ZIP Code: 68154-4446
Telephone No.: 402-938-1661 Fax No.: 402-691-9530 E-mail Address: [email protected]
D. Site Name: Tenaska Roans Prairie Generating Station
E. Area Name/Type of Facility: Electric Generating Station Permanent Portable
F. Principal Company Product or Business: Electricity Generation
Principal Standard Industrial Classification Code (SIC): 4911
Principal North American Industry Classification System (NAICS): 221112
G. Projected Start of Construction Date: January 2015
Projected Start of Operation Date: June 2016
H. Facility and Site Location Information (If no street address, provide clear driving directions to the site in writing.):
From College Station, Texas, head northeast on Farm to Market Rd 60/University Dr. toward Jane St. Turn right onto TX-6 Frontage S. Turn left onto Harvey Rd. Slight right onto TX-30 E. Site is approximately 22.4 miles down TX-30 E on the right hand side.
City/Town: Shiro County: Grimes ZIP Code: 77873
Latitude (nearest second): 30° 35' 16" N Longitude (nearest second): 95° 55' 38" W

TCEQ – 10252 (Revised 02/12) PI-1 Form This form is for use by facilities subject to air quality permit requirements and may be revised periodically. (APDG 5171v18) PI-1 Form FINAL - GE 04.doc Page 2 of 9
Texas Commission on Environmental Quality Form PI-1 General Application for
Air Preconstruction Permit and Amendment
I. Applicant Information (continued)
I. Account Identification Number (leave blank if new site or facility):
J. Core Data Form.
Is the Core Data Form (Form 10400) attached? If No, provide customer reference number and regulated entity number (complete K and L).
YES NO
K. Customer Reference Number (CN):
L. Regulated Entity Number (RN):
II. General Information
A. Is confidential information submitted with this application? If Yes, mark each confidential page confidential in large red letters at the bottom of each page.
YES NO
B. Is this application in response to an investigation or enforcement action? If Yes, attach a copy of any correspondence from the agency.
YES NO
C. Number of New Jobs: 0-20
D. Provide the name of the State Senator and State Representative and district numbers for this facility site:
Senator: Charles Schwertner District No.: 5
Representative: Lois W. Kolkhorst District No.: 13
III. Type of Permit Action Requested
A. Mark the appropriate box indicating what type of action is requested.
Initial Amendment Revision (30 TAC 116.116(e)) Change of Location Relocation
B. Permit Number (if existing): TBD
C. Permit Type: Mark the appropriate box indicating what type of permit is requested. (check all that apply, skip for change of location)
Construction Flexible Multiple Plant Nonattainment Prevention of Significant Deterioration
Hazardous Air Pollutant Major Source Plant-Wide Applicability Limit
Other:
D. Is a permit renewal application being submitted in conjunction with this amendment in accordance with 30 TAC 116.315(c).
YES NO

TCEQ – 10252 (Revised 02/12) PI-1 Form This form is for use by facilities subject to air quality permit requirements and may be revised periodically. (APDG 5171v18) PI-1 Form FINAL - GE 04.doc Page 3 of 9
Texas Commission on Environmental Quality Form PI-1 General Application for
Air Preconstruction Permit and Amendment
III. Type of Permit Action Requested (continued)
E. Is this application for a change of location of previously permitted facilities? If Yes, complete III.E.1 - III.E.4.
YES NO
1. Current Location of Facility (If no street address, provide clear driving directions to the site in writing.):
Street Address:
City: County: ZIP Code:
2. Proposed Location of Facility (If no street address, provide clear driving directions to the site in writing.):
Street Address:
City: County: ZIP Code:
3. Will the proposed facility, site, and plot plan meet all current technical requirements of the permit special conditions? If No, attach detailed information.
YES NO
4. Is the site where the facility is moving considered a major source of criteria pollutants or HAPs?
YES NO
F. Consolidation into this Permit: List any standard permits, exemptions or permits by rule to be consolidated into this permit including those for planned maintenance, startup, and shutdown.
List:
G. Are you permitting planned maintenance, startup, and shutdown emissions? If Yes, attach information on any changes to emissions under this application as specified in VII and VIII.
YES NO
H. Federal Operating Permit Requirements (30 TAC Chapter 122 Applicability)
Is this facility located at a site required to obtain a federal operating permit? If Yes, list all associated permit number(s), attach pages as needed).
YES NO To be determined
Associated Permit No (s.): TBD
1. Identify the requirements of 30 TAC Chapter 122 that will be triggered if this application is approved.
FOP Significant Revision FOP Minor Application for an FOP Revision To Be Determined
Operational Flexibility/Off-Permit Notification Streamlined Revision for GOP None
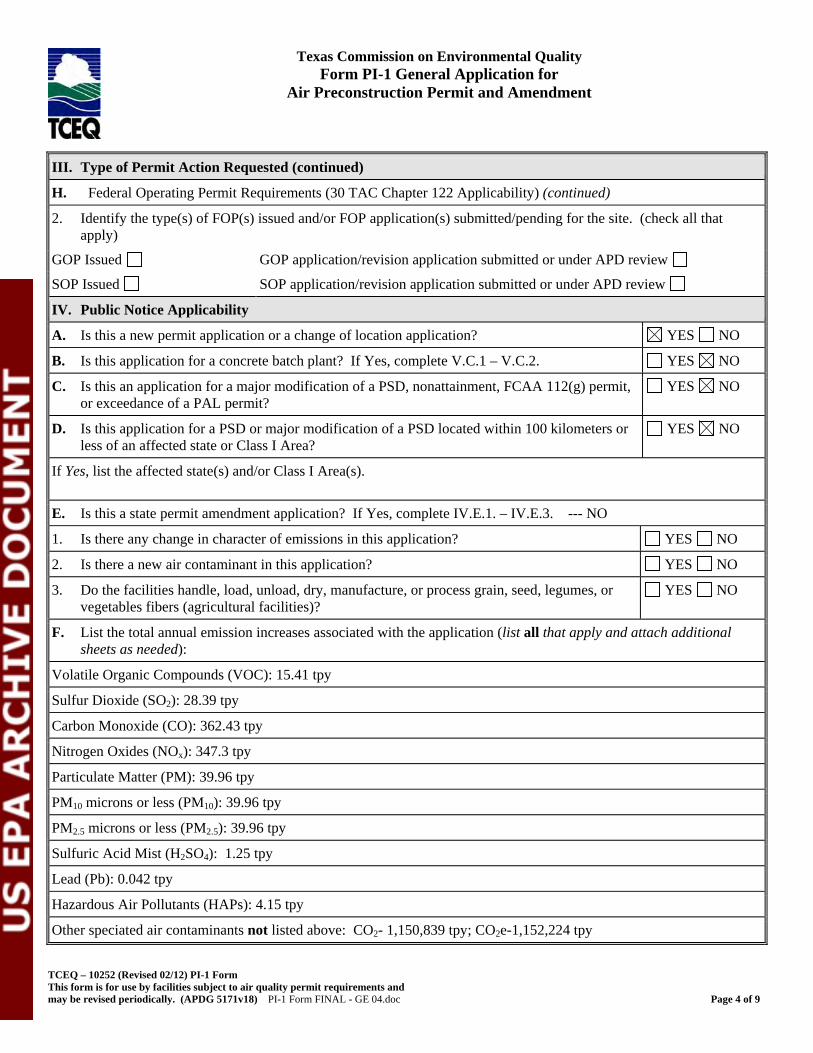
TCEQ – 10252 (Revised 02/12) PI-1 Form This form is for use by facilities subject to air quality permit requirements and may be revised periodically. (APDG 5171v18) PI-1 Form FINAL - GE 04.doc Page 4 of 9
Texas Commission on Environmental Quality Form PI-1 General Application for
Air Preconstruction Permit and Amendment
III. Type of Permit Action Requested (continued)
H. Federal Operating Permit Requirements (30 TAC Chapter 122 Applicability) (continued)
2. Identify the type(s) of FOP(s) issued and/or FOP application(s) submitted/pending for the site. (check all that apply)
GOP Issued GOP application/revision application submitted or under APD review
SOP Issued SOP application/revision application submitted or under APD review
IV. Public Notice Applicability
A. Is this a new permit application or a change of location application? YES NO
B. Is this application for a concrete batch plant? If Yes, complete V.C.1 – V.C.2. YES NO
C. Is this an application for a major modification of a PSD, nonattainment, FCAA 112(g) permit, or exceedance of a PAL permit?
YES NO
D. Is this application for a PSD or major modification of a PSD located within 100 kilometers or less of an affected state or Class I Area?
YES NO
If Yes, list the affected state(s) and/or Class I Area(s).
E. Is this a state permit amendment application? If Yes, complete IV.E.1. – IV.E.3. --- NO
1. Is there any change in character of emissions in this application? YES NO
2. Is there a new air contaminant in this application? YES NO
3. Do the facilities handle, load, unload, dry, manufacture, or process grain, seed, legumes, or vegetables fibers (agricultural facilities)?
YES NO
F. List the total annual emission increases associated with the application (list all that apply and attach additional sheets as needed):
Volatile Organic Compounds (VOC): 15.41 tpy
Sulfur Dioxide (SO2): 28.39 tpy
Carbon Monoxide (CO): 362.43 tpy
Nitrogen Oxides (NOx): 347.3 tpy
Particulate Matter (PM): 39.96 tpy
PM10 microns or less (PM10): 39.96 tpy
PM2.5 microns or less (PM2.5): 39.96 tpy
Sulfuric Acid Mist (H2SO4): 1.25 tpy
Lead (Pb): 0.042 tpy
Hazardous Air Pollutants (HAPs): 4.15 tpy
Other speciated air contaminants not listed above: CO2- 1,150,839 tpy; CO2e-1,152,224 tpy

TCEQ – 10252 (Revised 02/12) PI-1 Form This form is for use by facilities subject to air quality permit requirements and may be revised periodically. (APDG 5171v18) PI-1 Form FINAL - GE 04.doc Page 5 of 9
Texas Commission on Environmental Quality Form PI-1 General Application for
Air Preconstruction Permit and Amendment
V. Public Notice Information (complete if applicable)
A. Public Notice Contact Name: Ms. Christie Couvillion
Title: Sr. Environmental Specialist
Mailing Address: 1044 N. 115th Street, Suite 400
City: Omaha State: NE ZIP Code: 68154-4446
Telephone No.: 402-691-9500
B. Name of the Public Place: Navasota Public Library
Physical Address (No P.O. Boxes): 1411 E. Washington Ave.
City: Navasota County: Grimes ZIP Code: 77868
The public place has granted authorization to place the application for public viewing and copying. YES NO
The public place has internet access available for the public. YES NO
C. Concrete Batch Plants, PSD, and Nonattainment Permits
1. County Judge Information (For Concrete Batch Plants and PSD and/or Nonattainment Permits) for this facility site.
The Honorable: Betty Shiflett
Mailing Address: P.O. Box 160
City: Anderson State: Texas ZIP Code: 77830
2. Is the facility located in a municipality or an extraterritorial jurisdiction of a municipality? (For Concrete Batch Plants)
YES NO
Presiding Officers Name(s): N/A
Title:
Mailing Address:
City: State: ZIP Code:
3. Provide the name, mailing address of the chief executive of the city for the location where the facility is or will be located.
Chief Executive: Mayor Gail Sowell
Mailing Address: P.O. Box 592
City: Anderson State: Texas ZIP Code: 77830

TCEQ – 10252 (Revised 02/12) PI-1 Form This form is for use by facilities subject to air quality permit requirements and may be revised periodically. (APDG 5171v18) PI-1 Form FINAL - GE 04.doc Page 6 of 9
Texas Commission on Environmental Quality Form PI-1 General Application for
Air Preconstruction Permit and Amendment
V. Public Notice Information (complete if applicable) (continued)
3. Provide the name, mailing address of the Indian Governing Body for the location where the facility is or will be located. (continued)
Name of the Indian Governing Body: N/A
Title:
Mailing Address:
City: State: ZIP Code:
D. Bilingual Notice
Is a bilingual program required by the Texas Education Code in the School District? YES NO
Are the children who attend either the elementary school or the middle school closest to your facility eligible to be enrolled in a bilingual program provided by the district?
YES NO
If Yes, list which languages are required by the bilingual program?
Spanish
VI. Small Business Classification (Required)
A. Does this company (including parent companies and subsidiary companies) have fewer than 100 employees or less than $6 million in annual gross receipts?
YES NO
B. Is the site a major stationary source for federal air quality permitting? YES NO
C. Are the site emissions of any regulated air pollutant greater than or equal to 50 tpy? YES NO
D. Are the site emissions of all regulated air pollutants combined less than 75 tpy? YES NO
VII. Technical Information
A. The following information must be submitted with your Form PI-1 (this is just a checklist to make sure you have included everything)
1. Current Area Map
2. Plot Plan
3. Existing Authorizations
4. Process Flow Diagram
5. Process Description
6. Maximum Emissions Data and Calculations
7. Air Permit Application Tables
a. Table 1(a) (Form 10153) entitled, Emission Point Summary
b. Table 2 (Form 10155) entitled, Material Balance
c. Other equipment, process or control device tables

TCEQ – 10252 (Revised 02/12) PI-1 Form This form is for use by facilities subject to air quality permit requirements and may be revised periodically. (APDG 5171v18) PI-1 Form FINAL - GE 04.doc Page 7 of 9
Texas Commission on Environmental Quality Form PI-1 General Application for
Air Preconstruction Permit and Amendment
VII. Technical Information
B. Are any schools located within 3,000 feet of this facility? YES NO
C. Maximum Operating Schedule:
Hours: 24 Day(s): 365 Week(s): 52 Year(s): 2,920 hrs/yr
Seasonal Operation? If Yes, please describe in the space provide below. YES NO
D. Have the planned MSS emissions been previously submitted as part of an emissions inventory? YES NO
Provide a list of each planned MSS facility or related activity and indicate which years the MSS activities have been included in the emissions inventories. Attach pages as needed.
E. Does this application involve any air contaminants for which a disaster review is required? YES NO
F. Does this application include a pollutant of concern on the Air Pollutant Watch List (APWL)? YES NO
VIII. State Regulatory Requirements Applicants must demonstrate compliance with all applicable state regulations to obtain a permit or amendment. The application must contain detailed attachments addressing applicability or non applicability; identify state regulations; show how requirements are met; and include compliance demonstrations.
A. Will the emissions from the proposed facility protect public health and welfare, and comply with all rules and regulations of the TCEQ?
YES NO
B. Will emissions of significant air contaminants from the facility be measured? YES NO
C. Is the Best Available Control Technology (BACT) demonstration attached? YES NO
D. Will the proposed facilities achieve the performance represented in the permit application as demonstrated through recordkeeping, monitoring, stack testing, or other applicable methods?
YES NO
IX. Federal Regulatory Requirements Applicants must demonstrate compliance with all applicable federal regulations to obtain a permit or amendment The application must contain detailed attachments addressing applicability or non applicability; identify federal regulation subparts; show how requirements are met; and include compliance demonstrations.
A. Does Title 40 Code of Federal Regulations Part 60, (40 CFR Part 60) New Source Performance Standard (NSPS) apply to a facility in this application?
YES NO
B. Does 40 CFR Part 61, National Emissions Standard for Hazardous Air Pollutants (NESHAP) apply to a facility in this application?
YES NO
C. Does 40 CFR Part 63, Maximum Achievable Control Technology (MACT) standard apply to a facility in this application?
YES NO

TCEQ – 10252 (Revised 02/12) PI-1 Form This form is for use by facilities subject to air quality permit requirements and may be revised periodically. (APDG 5171v18) PI-1 Form FINAL - GE 04.doc Page 8 of 9
Texas Commission on Environmental Quality Form PI-1 General Application for
Air Preconstruction Permit and Amendment
IX. Federal Regulatory Requirements Applicants must demonstrate compliance with all applicable federal regulations to obtain a permit or amendment The application must contain detailed attachments addressing applicability or non applicability; identify federal regulation subparts; show how requirements are met; and include compliance demonstrations.
D. Do nonattainment permitting requirements apply to this application? YES NO
E. Do prevention of significant deterioration permitting requirements apply to this application? YES NO
F. Do Hazardous Air Pollutant Major Source [FCAA 112(g)] requirements apply to this application?
YES NO
G. Is a Plant-wide Applicability Limit permit being requested? YES NO
X. Professional Engineer (P.E.) Seal
Is the estimated capital cost of the project greater than $2 million dollars? YES NO
If Yes, submit the application under the seal of a Texas licensed P.E.
XI. Permit Fee Information
Check, Money Order, Transaction Number ,ePay Voucher Number: N/A Fee Amount: N/A
Company name on check: Paid online?: YES NO
Is a copy of the check or money order attached to the original submittal of this application?
YES NO N/A
Is a Table 30 (Form 10196) entitled, Estimated Capital Cost and Fee Verification, attached?
YES NO N/A

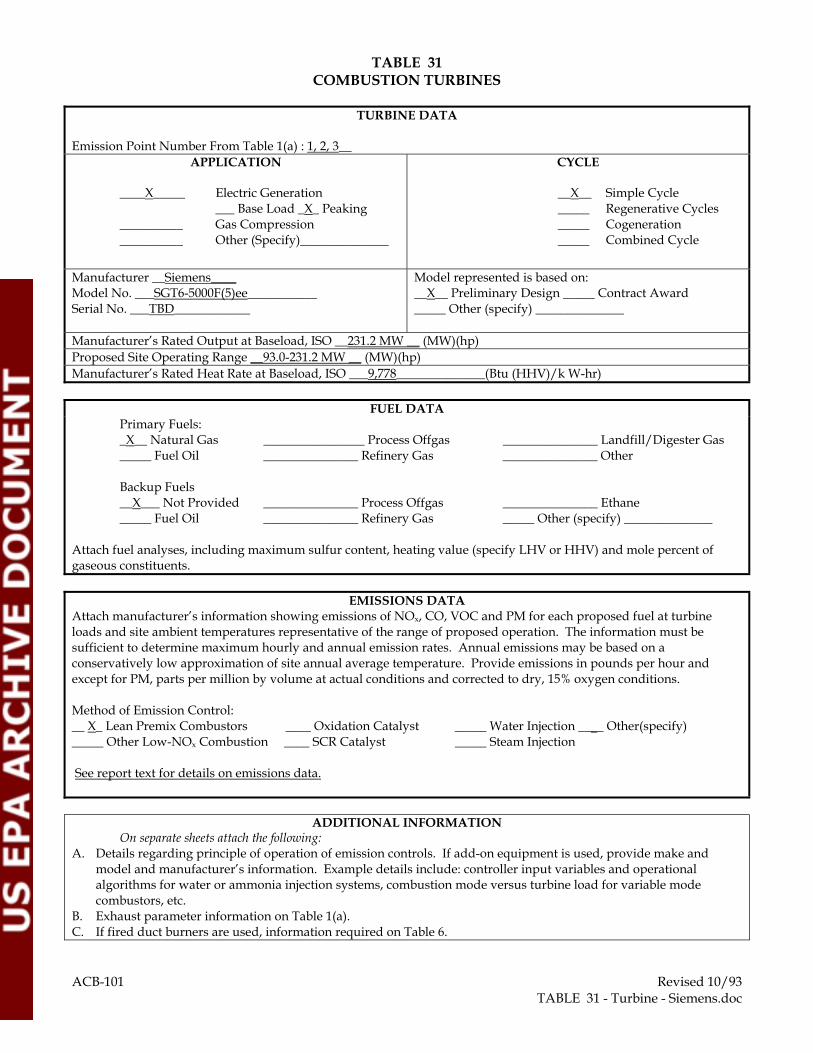
TABLE 31 COMBUSTION TURBINES
TURBINE DATA
Emission Point Number From Table 1(a) : 1, 2, 3__
APPLICATION
____X_____ Electric Generation ___ Base Load _X_ Peaking __________ Gas Compression __________ Other (Specify)______________
CYCLE
__X__ Simple Cycle _____ Regenerative Cycles _____ Cogeneration _____ Combined Cycle
Manufacturer __Siemens____ Model No. ___SGT6-5000F(5)ee___________ Serial No. ___TBD____________
Model represented is based on: __X__ Preliminary Design _____ Contract Award _____ Other (specify) ______________
Manufacturer’s Rated Output at Baseload, ISO __231.2 MW __ (MW)(hp) Proposed Site Operating Range __93.0-231.2 MW __ (MW)(hp) Manufacturer’s Rated Heat Rate at Baseload, ISO ___9,778______________(Btu (HHV)/k W-hr)
FUEL DATA Primary Fuels: _X__ Natural Gas ________________ Process Offgas _______________ Landfill/Digester Gas _____ Fuel Oil _______________ Refinery Gas _______________ Other Backup Fuels __X___ Not Provided _______________ Process Offgas _______________ Ethane _____ Fuel Oil _______________ Refinery Gas _____ Other (specify) ______________ Attach fuel analyses, including maximum sulfur content, heating value (specify LHV or HHV) and mole percent of gaseous constituents.
EMISSIONS DATA Attach manufacturer’s information showing emissions of NOx, CO, VOC and PM for each proposed fuel at turbine loads and site ambient temperatures representative of the range of proposed operation. The information must be sufficient to determine maximum hourly and annual emission rates. Annual emissions may be based on a conservatively low approximation of site annual average temperature. Provide emissions in pounds per hour and except for PM, parts per million by volume at actual conditions and corrected to dry, 15% oxygen conditions. Method of Emission Control: __ X_ Lean Premix Combustors ____ Oxidation Catalyst _____ Water Injection ____ Other(specify) _____ Other Low-NOx Combustion ____ SCR Catalyst _____ Steam Injection See report text for details on emissions data.
ADDITIONAL INFORMATION On separate sheets attach the following: A. Details regarding principle of operation of emission controls. If add-on equipment is used, provide make and
model and manufacturer’s information. Example details include: controller input variables and operational algorithms for water or ammonia injection systems, combustion mode versus turbine load for variable mode combustors, etc.
B. Exhaust parameter information on Table 1(a). C. If fired duct burners are used, information required on Table 6. ACB-101 Revised 10/93 TABLE 31 - Turbine - Siemens.doc

TABLE 31 COMBUSTION TURBINES
TURBINE DATA
Emission Point Numbers From Table 1(a) : 1, 2, 3__
APPLICATION
____X_____ Electric Generation ___ Base Load _X_ Peaking __________ Gas Compression __________ Other (Specify)______________
CYCLE
__X__ Simple Cycle _____ Regenerative Cycles _____ Cogeneration _____ Combined Cycle
Manufacturer __GE_________ Model No. ___7FA-.05___________ Serial No. ___TBD____________
Model represented is based on: __X__ Preliminary Design _____ Contract Award _____ Other (specify) ______________
Manufacturer’s Rated Output at Baseload, ISO __227.6 MW __ (MW)(hp) Proposed Site Operating Range __91.5-227.6 MW __ (MW)(hp) Manufacturer’s Rated Heat Rate at Baseload, ISO ___9,672_____________(Btu (HHV)/k W-hr)
FUEL DATA Primary Fuels: _X__ Natural Gas ________________ Process Offgas _______________ Landfill/Digester Gas _____ Fuel Oil _______________ Refinery Gas _______________ Other Backup Fuels __X___ Not Provided _______________ Process Offgas _______________ Ethane _____ Fuel Oil _______________ Refinery Gas _____ Other (specify) ______________ Attach fuel analyses, including maximum sulfur content, heating value (specify LHV or HHV) and mole percent of gaseous constituents.
EMISSIONS DATA Attach manufacturer’s information showing emissions of NOx, CO, VOC and PM for each proposed fuel at turbine loads and site ambient temperatures representative of the range of proposed operation. The information must be sufficient to determine maximum hourly and annual emission rates. Annual emissions may be based on a conservatively low approximation of site annual average temperature. Provide emissions in pounds per hour and except for PM, parts per million by volume at actual conditions and corrected to dry, 15% oxygen conditions. Method of Emission Control: __ X_ Lean Premix Combustors __ __ Oxidation Catalyst _____ Water Injection ____ Other(specify) _____ Other Low-NOx Combustion __ __ SCR Catalyst _____ Steam Injection
See report text for details on emissions data.
ADDITIONAL INFORMATION On separate sheets attach the following: A. Details regarding principle of operation of emission controls. If add-on equipment is used, provide make and
model and manufacturer’s information. Example details include: controller input variables and operational algorithms for water or ammonia injection systems, combustion mode versus turbine load for variable mode combustors, etc.
B. Exhaust parameter information on Table 1(a). C. If fired duct burners are used, information required on Table 6. ACB-101 Revised 10/93 TABLE 31 - Turbine - GE 7FA.05.doc

TABLE 31 COMBUSTION TURBINES
TURBINE DATA
Emission Point Numbers From Table 1(a) : 1, 2, 3__
APPLICATION
____X_____ Electric Generation ___ Base Load _X_ Peaking __________ Gas Compression __________ Other (Specify)______________
CYCLE
__X__ Simple Cycle _____ Regenerative Cycles _____ Cogeneration _____ Combined Cycle
Manufacturer __GE_________ Model No. ___7FA-.04___________ Serial No. ___TBD____________
Model represented is based on: __X__ Preliminary Design _____ Contract Award _____ Other (specify) ______________
Manufacturer’s Rated Output at Baseload, ISO __207 MW __ (MW)(hp) Proposed Site Operating Range __93.2-207 MW __ (MW)(hp) Manufacturer’s Rated Heat Rate at Baseload, ISO ___9,833_____________(Btu (HHV)/k W-hr)
FUEL DATA Primary Fuels: _X__ Natural Gas ________________ Process Offgas _______________ Landfill/Digester Gas _____ Fuel Oil _______________ Refinery Gas _______________ Other Backup Fuels __X___ Not Provided _______________ Process Offgas _______________ Ethane _____ Fuel Oil _______________ Refinery Gas _____ Other (specify) ______________ Attach fuel analyses, including maximum sulfur content, heating value (specify LHV or HHV) and mole percent of gaseous constituents.
EMISSIONS DATA Attach manufacturer’s information showing emissions of NOx, CO, VOC and PM for each proposed fuel at turbine loads and site ambient temperatures representative of the range of proposed operation. The information must be sufficient to determine maximum hourly and annual emission rates. Annual emissions may be based on a conservatively low approximation of site annual average temperature. Provide emissions in pounds per hour and except for PM, parts per million by volume at actual conditions and corrected to dry, 15% oxygen conditions. Method of Emission Control: __ X_ Lean Premix Combustors __ __ Oxidation Catalyst _____ Water Injection ____ Other(specify) _____ Other Low-NOx Combustion ____ SCR Catalyst _____ Steam Injection See report text for details on emissions data.
ADDITIONAL INFORMATION On separate sheets attach the following: A. Details regarding principle of operation of emission controls. If add-on equipment is used, provide make and
model and manufacturer’s information. Example details include: controller input variables and operational algorithms for water or ammonia injection systems, combustion mode versus turbine load for variable mode combustors, etc.
B. Exhaust parameter information on Table 1(a). C. If fired duct burners are used, information required on Table 6. ACB-101 Revised 10/93 TABLE 31 - Turbine - GE 7FA.04.doc

TABLE 2
MATERIAL BALANCE
This material balance table is used to quantify possible emissions of air contaminants and special emphasis should be placed on potential air contaminants, for example: If feed contains sulfur, show distribution to all products. Please relate each material (or group of materials) listed to its respective location in the process flow diagram by assigning point numbers (taken from the flow diagram) to each materials. LIST EVERY MATERIAL INVOLVED IN EACH OF THE FOLLOWING GROUPS
Point No. from Flow Diagram
Process Rate (lbs/hr or SCFM) standard conditions: 70°F 14.7 PSIA. Check appropriate column at right for each process.
Mea
sure
men
t
Est
imat
ion
Cal
cula
tion
1. Raw Materials - Input N/A
2. Fuels – Input Turbines – Natural Gas Emergency Engine, Fire Pump – Ultra low-sulfur diesel
Turbines = 2,441 MMBtu/hr per turbine Emergency Engine: 19.17 MMBtu/hr Fire Pump: 4.02 MMBtu/hr
X
3. Products & By-Products - Output Electricity
Electricity = 231.2 MW per turbine
4. Solid Wastes - Output N/A
5. Liquid Wastes - Output N/A
6. Airborne Waste (Solid) – Output Three new turbines, one new emergency generator, one new fire pump:
PM PM10 PM2.5
1, 2, 3, EMGEN, FWPUMP
See Table 1(a).
X
7. Airborne Wastes (Gaseous) - Output Three new turbines, one new emergency generator, one new fire pump:
NOx CO VOC SO2 H2SO4
CO2 CO2e
1, 2, 3, EMGEN, FWPUMP
See Table 1(a).
X
10/93 TABLE 2 - Material Balance Siemens.doc

TABLE 2
MATERIAL BALANCE
This material balance table is used to quantify possible emissions of air contaminants and special emphasis should be placed on potential air contaminants, for example: If feed contains sulfur, show distribution to all products. Please relate each material (or group of materials) listed to its respective location in the process flow diagram by assigning point numbers (taken from the flow diagram) to each materials. LIST EVERY MATERIAL INVOLVED IN EACH OF THE FOLLOWING GROUPS
Point No. from Flow Diagram
Process Rate (lbs/hr or SCFM) standard conditions: 70°F 14.7 PSIA. Check appropriate column at right for each process.
Mea
sure
men
t
Est
imat
ion
Cal
cula
tion
1. Raw Materials - Input N/A
2. Fuels – Input Turbines – Natural Gas Emergency Engine, Fire Pump – Ultra low-sulfur diesel
Turbines = 2,378 MMBtu/hr per turbine Emergency Engine: 19.17 MMBtu/hr Fire Pump: 4.02 MMBtu/hr
X
3. Products & By-Products - Output Electricity
Electricity = 227.6 MW per turbine
4. Solid Wastes - Output N/A
5. Liquid Wastes - Output N/A
6. Airborne Waste (Solid) – Output Three new turbines, one new emergency generator, one new fire pump:
PM PM10 PM2.5
1, 2, 3, EMGEN, FWPUMP
See Table 1(a).
X
7. Airborne Wastes (Gaseous) - Output Three new turbines, one new emergency generator, one new fire pump:
NOx CO VOC SO2 H2SO4 CO2 CO2e
1, 2, 3, EMGEN, FWPUMP
See Table 1(a).
X
10/93 TABLE 2 - Material Balance GE 05.doc

TABLE 2
MATERIAL BALANCE
This material balance table is used to quantify possible emissions of air contaminants and special emphasis should be placed on potential air contaminants, for example: If feed contains sulfur, show distribution to all products. Please relate each material (or group of materials) listed to its respective location in the process flow diagram by assigning point numbers (taken from the flow diagram) to each materials. LIST EVERY MATERIAL INVOLVED IN EACH OF THE FOLLOWING GROUPS
Point No. from Flow Diagram
Process Rate (lbs/hr or SCFM) standard conditions: 70°F 14.7 PSIA. Check appropriate column at right for each process.
Mea
sure
men
t
Est
imat
ion
Cal
cula
tion
1. Raw Materials - Input N/A
2. Fuels – Input Turbines – Natural Gas Emergency Engine, Fire Pump – Ultra low-sulfur diesel
Turbines = 2,198 MMBtu/hr per turbine Emergency Engine: 19.17 MMBtu/hr Fire Pump: 4.02 MMBtu/hr
X
3. Products & By-Products - Output Electricity
Electricity = 207 MW per turbine
4. Solid Wastes - Output N/A
5. Liquid Wastes - Output N/A
6. Airborne Waste (Solid) – Output Three new turbines, one new emergency generator, one new fire pump:
PM PM10 PM2.5
1, 2, 3, EMGEN, FWPUMP
See Table 1(a).
X
7. Airborne Wastes (Gaseous) - Output Three new turbines, one new emergency generator, one new fire pump:
NOx CO VOC SO2 H2SO4 CO2 CO2e
1, 2, 3, EMGEN, FWPUMP
See Table 1(a).
X
10/93 TABLE 2 - Material Balance GE 04.doc

Texas Commission on Environmental Quality Table 29 Reciprocating Engines
TCEQ-10195 (Revised 11/11) Table 29 Reciprocating Engines This form is for use by facilities subject to air quality permit requirements and
may be revised periodically. (APDG 6002v3) Table 29 - Fire Pump.doc Page 1 of 1
I. Engine Data
Manufacturer: Model No. Serial No. Manufacture Date:
Cummins or Other CFP Engine Model or Similar TBD New (post 2013)
Rebuilds Date: No. of Cylinders: Compression Ratio: EPN:
N/A 6 TBD FWPUMP
Application: Gas Compression Electric Generation Refrigeration Emergency/Stand by
4 Stroke Cycle 2 Stroke Cycle Carbureted Spark Ignited Dual Fuel Fuel Injected
Diesel Naturally Aspirated Blower /Pump Scavenged Turbo Charged and I.C. Turbo Charged
Intercooled I.C. Water Temperature Lean Burn Rich Burn
Ignition/Injection Timing: Fixed: TBD Variable: TBD
Manufacture Horsepower Rating: 575 hp Proposed Horsepower Rating: 575 hp
Discharge Parameters
Stack Height (Feet) Stack Diameter (Feet) Stack Temperature (oF) Exit Velocity (FPS)
14.0 1.0 884 75.9
II. Fuel Data
Type of Fuel: Field Gas Landfill Gas LP Gas Natural Gas Digester Gas Diesel
Fuel Consumption (BTU/bhp-hr): 4.02 MMBTU/hr
Heat Value: 138,000 BTU/gal (HHV) 124,000 BTU/gal (LHV)
Sulfur Content (grains/100 scf - weight %): 1.35 gr/100 dscf
III. Emission Factors (Before Control)
NOX CO SO2 VOC Formaldehyde PM10
g/hp-hr ppmv g/hp-hr ppmv g/hp-hr ppmv g/hp-hr ppmv g/hp-hr ppmv g/hp-hr ppmv
3.0 3.0 0.005 1.14 3.74E-03 0.15
Source of Emission Factors: Manufacturer Data AP-42 Other (specify): Table 4 to CI ICE NSPS, Mass Balance
IV. Emission Factors (Post Control)
NOX CO SO2 VOC Formaldehyde PM10
g/hp-hr ppmv g/hp-hr ppmv g/hp-hr ppmv g/hp-hr ppmv g/hp-hr ppmv g/hp-hr ppmv
Method of Emission Control: NSCR Catalyst Lean Operation Parameter Adjustment
Stratified Charge JLCC Catalyst Other (Specify): N/A
Note: Must submit a copy of any manufacturer control information that demonstrates control efficiency.
Is Formaldehyde included in the VOCs? N/A Yes No
V. Federal and State Standards (Check all that apply)
NSPS JJJJ MACT ZZZZ NSPS IIII Title 30 Chapter 117 - List County:
VI. Additional Information
1. Submit a copy of the engine manufacturer’s site rating or general rating specification data. 2. Submit a typical fuel gas analysis, including sulfur content and heating value. For gaseous fuels, provide mole percent
of constituents. 3. Submit description of air/fuel ratio control system (manufacturer information is acceptable).

Texas Commission on Environmental Quality Table 29 Reciprocating Engines
TCEQ-10195 (Revised 11/11) Table 29 Reciprocating Engines This form is for use by facilities subject to air quality permit requirements and may be revised periodically. (APDG 6002v3) Table 29 - Emergency Generator.doc Page 1 of 1
I. Engine Data
Manufacturer: Model No. Serial No. Manufacture Date:
Caterpillar or Other 3516C ATAAC or Similar TBD New (post 2013)
Rebuilds Date: No. of Cylinders: Compression Ratio: EPN:
N/A 16 14.7:1 EMGEN
Application: Gas Compression Electric Generation Refrigeration Emergency/Stand by
4 Stroke Cycle 2 Stroke Cycle Carbureted Spark Ignited Dual Fuel Fuel Injected
Diesel Naturally Aspirated Blower /Pump Scavenged Turbo Charged and I.C. Turbo Charged
Intercooled I.C. Water Temperature Lean Burn Rich Burn
Ignition/Injection Timing: Fixed: TBD Variable: TBD
Manufacture Horsepower Rating: 2,937 hp Proposed Horsepower Rating: 2,937 hp
Discharge Parameters
Stack Height (Feet) Stack Diameter (Feet) Stack Temperature (oF) Exit Velocity (FPS)
14.0 1.0 768 323.4
II. Fuel Data
Type of Fuel: Field Gas Landfill Gas LP Gas Natural Gas Digester Gas Diesel
Fuel Consumption (BTU/bhp-hr): 19.17 MMBTU/hr
Heat Value: 138,000 BTU/gal (HHV) 124,000 BTU/gal (LHV)
Sulfur Content (grains/100 scf - weight %): 1.35 gr/100 dscf
III. Emission Factors (Before Control)
NOX CO SO2 VOC Formaldehyde PM10
g/hp-hr ppmv g/hp-hr ppmv g/hp-hr ppmv g/hp-hr ppmv g/hp-hr ppmv g/hp-hr ppmv
4.8 2.6 0.005 0.32 2.34E-04 0.15
Source of Emission Factors: Manufacturer Data AP-42 Other (specify): EPA Tier 2 Emission Limits, Mass Balance
IV. Emission Factors (Post Control)
NOX CO SO2 VOC Formaldehyde PM10
g/hp-hr ppmv g/hp-hr ppmv g/hp-hr ppmv g/hp-hr ppmv g/hp-hr ppmv g/hp-hr ppmv
Method of Emission Control: NSCR Catalyst Lean Operation Parameter Adjustment
Stratified Charge JLCC Catalyst Other (Specify): N/A
Note: Must submit a copy of any manufacturer control information that demonstrates control efficiency.
Is Formaldehyde included in the VOCs? N/A Yes No
V. Federal and State Standards (Check all that apply)
NSPS JJJJ MACT ZZZZ NSPS IIII Title 30 Chapter 117 - List County:
VI. Additional Information
1. Submit a copy of the engine manufacturer’s site rating or general rating specification data. 2. Submit a typical fuel gas analysis, including sulfur content and heating value. For gaseous fuels, provide mole
percent of constituents. 3. Submit description of air/fuel ratio control system (manufacturer information is acceptable).
Emission Rate Calculations Appendix B
July 2013
Project No. 0189555
Environmental Resources Management 15810 Park Ten Place, Suite 300
Houston, Texas 77084 (281) 600-1000

Date: 7/22/2013 Permit No.: TBD Regulated Entity No.: TBD
Area Name: Customer Reference No.: CN600698948
Review of applications and issuance of permits will be expedited by supplying all necessary information requested on this Table.
(A) EPN (B) FIN (C) NAME (A) POUND (B) TPY
1 1 Unit 1 (Siemens SGT6-5000F(5ee) Turbine) NOX 80.96 118.20
NOX (MSS) 97.45 6.33
CO 25.23 36.84
CO (MSS) 643.89 80.85
VOC 3.14 4.58
VOC (MSS) 71.94 9.00
SO2 4.25 4.54
PM 13.73 14.77
PM10 13.73 14.77
PM2.5 13.73 14.77
H2SO4 0.54 0.78
Pb 0.01 0.02
HAP (excluding Pb) 1.04 1.51
Formaldehyde 0.28 0.40
CO2 291,749.39 425,954.12
CH4 5.38 7.86
N2O 0.54 0.79
CO2e 292,029.20 426,362.63
TEXAS COMMISSION ON ENVIRONMENTAL QUALITY
Table 1(a) Emission Point Summary
2. Component or Air Contaminant Name1. Emission Point 3. Air Contaminant Emission Rate
Tenaska Roans Prairie Generating Station
AIR CONTAMINANT DATA
Page 1 of 5 0189555\
A5469 B.2-Calcs.xlsx

Date: 7/22/2013 Permit No.: TBD Regulated Entity No.: TBD
Area Name: Customer Reference No.: CN600698948
Review of applications and issuance of permits will be expedited by supplying all necessary information requested on this Table.
(A) EPN (B) FIN (C) NAME (A) POUND (B) TPY
TEXAS COMMISSION ON ENVIRONMENTAL QUALITY
Table 1(a) Emission Point Summary
2. Component or Air Contaminant Name1. Emission Point 3. Air Contaminant Emission Rate
Tenaska Roans Prairie Generating Station
AIR CONTAMINANT DATA
2 2 Unit 2 (Siemens SGT6-5000F(5ee) Turbine) NOX 80.96 118.20
NOX (MSS) 97.45 6.33
CO 25.23 36.84
CO (MSS) 643.89 80.85
VOC 3.14 4.58
VOC (MSS) 71.94 9.00
SO2 4.25 4.54
PM 13.73 14.77
PM10 13.73 14.77
PM2.5 13.73 14.77
H2SO4 0.54 0.78
Pb 0.01 0.02
HAP (excluding Pb) 1.04 1.51
Formaldehyde 0.28 0.40
CO2 291,749.39 425,954.12
CH4 5.38 7.86
N2O 0.54 0.79
CO2e 292,029.20 426,362.63
Page 2 of 5 0189555\
A5469 B.2-Calcs.xlsx

Date: 7/22/2013 Permit No.: TBD Regulated Entity No.: TBD
Area Name: Customer Reference No.: CN600698948
Review of applications and issuance of permits will be expedited by supplying all necessary information requested on this Table.
(A) EPN (B) FIN (C) NAME (A) POUND (B) TPY
TEXAS COMMISSION ON ENVIRONMENTAL QUALITY
Table 1(a) Emission Point Summary
2. Component or Air Contaminant Name1. Emission Point 3. Air Contaminant Emission Rate
Tenaska Roans Prairie Generating Station
AIR CONTAMINANT DATA
3 3 Unit 3 (Siemens SGT6-5000F(5ee) Turbine) NOX 80.96 118.20
NOX (MSS) 97.45 6.33
CO 25.23 36.84
CO (MSS) 643.89 80.85
VOC 3.14 4.58
VOC (MSS) 71.94 9.00
SO2 4.25 4.54
PM 13.73 14.77
PM10 13.73 14.77
PM2.5 13.73 14.77
H2SO4 0.54 0.78
Pb 0.01 0.02
HAP (excluding Pb) 1.04 1.51
Formaldehyde 0.28 0.40
CO2 291,749.39 425,954.12
CH4 5.38 7.86
N2O 0.54 0.79
CO2e 292,029.20 426,362.63
EMGEN EMGEN Emergency Generator Engine NOX 30.91 1.55
CO 16.91 0.85
VOC 2.07 0.10
SO2 0.03 <0.01
PM 0.97 0.05
PM10 0.97 0.05
PM2.5 0.97 0.05
H2SO4 <0.01 <0.01
HAP (excluding Pb) 0.03 <0.01
Formaldehyde <0.01 <0.01
CO2 3,125.45 156.27
CH4 0.13 0.01
N2O 0.03 <0.01
CO2e 3,135.97 156.80
Page 3 of 5 0189555\
A5469 B.2-Calcs.xlsx

Date: 7/22/2013 Permit No.: TBD Regulated Entity No.: TBD
Area Name: Customer Reference No.: CN600698948
Review of applications and issuance of permits will be expedited by supplying all necessary information requested on this Table.
(A) EPN (B) FIN (C) NAME (A) POUND (B) TPY
TEXAS COMMISSION ON ENVIRONMENTAL QUALITY
Table 1(a) Emission Point Summary
2. Component or Air Contaminant Name1. Emission Point 3. Air Contaminant Emission Rate
Tenaska Roans Prairie Generating Station
AIR CONTAMINANT DATA
FWPUMP FWPUMP Fire Water Pump NOX 3.78 0.19
CO 3.84 0.19
VOC 1.45 0.07
SO2 0.01 <0.01
PM 0.19 0.01
PM10 0.19 0.01
PM2.5 0.19 0.01
H2SO4 <0.01 <0.01
HAP (excluding Pb) 0.02 <0.01
Formaldehyde <0.01 <0.01
CO2 654.79 32.74
CH4 0.03 <0.01
N2O 0.01 <0.01
CO2e 657.00 32.85
CBFUG CBFUG Circuit Breaker Fugitives SF6 <0.01 0.01
CO2e 47.75 209.13
MSSFUG MSSFUG Maintenance Activites NOX <0.01 <0.01
CO <0.01 <0.01
VOC 0.30 <0.01
PM 0.20 0.04
PM10 0.20 0.04
PM2.5 0.20 0.04
HAP (excluding Pb) 0.30 <0.01
CO2 0.92 0.01
CH4 16.70 0.11
CO2e 351.62 2.42
FUG FUG Fugitives VOC 0.01 0.06
HAP (excluding Pb) 0.01 0.06
CO2 0.04 0.18
CH4 0.75 3.30
CO2e 15.86 69.46
EPN = Emission Point NumberFIN = Facility Identification Number
Page 4 of 5 0189555\
A5469 B.2-Calcs.xlsx

Date: 7/22/2013 Permit No.:
Area Name:
Review of applications and issuance of permits will be expedited by supplying all necessary information requested on this Table.
AIR CONTAMINANT DATA
5. Building 6. Height Above
EPN FIN Name Zone East North Height Ground Diameter Velocity Temperature Length Width Axis
(A) (B) (C) (Meters) (Meters) (Ft.) (Ft.) (Ft.) (A) (FPS) (B) (°F) (C) (Ft.) (A) (Ft.) (B) Degrees (C)
1 1 Unit 1 (Siemens SGT6-5000F(5ee) Turbine) 15 219,403 3,387,566 21.0 60.0 20.0 225.2 1,099 -- -- --
2 2 Unit 2 (Siemens SGT6-5000F(5ee) Turbine) 15 219,420 3,387,523 21.0 60.0 20.0 225.2 1,099 -- -- --
3 3 Unit 3 (Siemens SGT6-5000F(5ee) Turbine) 15 219,438 3,387,480 21.0 60.0 20.0 225.2 1,099 -- -- --
EMGEN EMGEN Emergency Generator Engine 15 219,528 3,387,595 21.0 14.0 1.0 323.4 768 -- -- --
FWPUMP FWPUMP Fire Water Pump 15 219,380 3,387,593 10.5 14.0 1.0 75.9 884 -- -- --
CBFUG CBFUG Circuit Breaker Fugitives 15 219,509 3,387,556 -- 3.0 -- -- -- 850 660 77 W
MSSFUG MSSFUG Maintenance Activites 15 219,509 3,387,556 -- 3.0 -- -- -- 850 660 77 W
FUG FUG Fugitives 15 219,509 3,387,556 -- 3.0 -- -- -- 850 660 77 W
EPN = Emission Point Number
1. Emission Point Source
TEXAS COMMISSION ON ENVIRONMENTAL QUALITY
Table 1(a) Emission Point Summary
TBD Regulated Entity No.: TBD
Tenaska Roans Prairie Generating Station Customer Reference No.: CN600698948
Point 7. Stack Exit Data 8. Fugitives
EMISSION POINT DISCHARGE PARAMETERS
4. UTM Coordinates of Emission
Page 5 of 5 0189555\
A5469 B.2-Calcs.xlsx

Date: 7/22/2013 Permit No.: TBD Regulated Entity No.: TBD
Area Name: Customer Reference No.: CN600698948
Review of applications and issuance of permits will be expedited by supplying all necessary information requested on this Table.
(A) EPN (B) FIN (C) NAME (A) POUND (B) TPY
1 1 Unit 1 (GE 7FA.05 Turbine) NOX 78.84 115.10
NOX (MSS) 81.07 7.67
CO 38.93 56.84
CO (MSS) 228.14 69.90
VOC 3.66 5.35
VOC (MSS) 23.93 6.57
SO2 2.95 4.43
PM 10.05 15.07
PM10 10.05 15.07
PM2.5 10.05 15.07
H2SO4 0.30 0.45
Pb 0.01 0.02
HAP (excluding Pb) 1.01 1.47
Formaldehyde 0.27 0.39
CO2 284,119.31 414,814.19
CH4 5.24 7.65
N2O 0.52 0.77
CO2e 284,391.79 415,212.02
TEXAS COMMISSION ON ENVIRONMENTAL QUALITY
Table 1(a) Emission Point Summary
Tenaska Roans Prairie Generating Station
AIR CONTAMINANT DATA
1. Emission Point 2. Component or Air Contaminant Name 3. Air Contaminant Emission Rate
Page 1 of 5 0189555\
A5469 B.2-Calcs.xlsx

Date: 7/22/2013 Permit No.: TBD Regulated Entity No.: TBD
Area Name: Customer Reference No.: CN600698948
Review of applications and issuance of permits will be expedited by supplying all necessary information requested on this Table.
(A) EPN (B) FIN (C) NAME (A) POUND (B) TPY
TEXAS COMMISSION ON ENVIRONMENTAL QUALITY
Table 1(a) Emission Point Summary
Tenaska Roans Prairie Generating Station
AIR CONTAMINANT DATA
1. Emission Point 2. Component or Air Contaminant Name 3. Air Contaminant Emission Rate
2 2 Unit 2 (GE 7FA.05 Turbine) NOX 78.84 115.10
NOX (MSS) 81.07 7.67
CO 38.93 56.84
CO (MSS) 228.14 69.90
VOC 3.66 5.35
VOC (MSS) 23.93 6.57
SO2 2.95 4.43
PM 10.05 15.07
PM10 10.05 15.07
PM2.5 10.05 15.07
H2SO4 0.30 0.45
Pb 0.01 0.02
HAP (excluding Pb) 1.01 1.47
Formaldehyde 0.27 0.39
CO2 284,119.31 414,814.19
CH4 5.24 7.65
N2O 0.52 0.77
CO2e 284,391.79 415,212.02
Page 2 of 5 0189555\
A5469 B.2-Calcs.xlsx

Date: 7/22/2013 Permit No.: TBD Regulated Entity No.: TBD
Area Name: Customer Reference No.: CN600698948
Review of applications and issuance of permits will be expedited by supplying all necessary information requested on this Table.
(A) EPN (B) FIN (C) NAME (A) POUND (B) TPY
TEXAS COMMISSION ON ENVIRONMENTAL QUALITY
Table 1(a) Emission Point Summary
Tenaska Roans Prairie Generating Station
AIR CONTAMINANT DATA
1. Emission Point 2. Component or Air Contaminant Name 3. Air Contaminant Emission Rate
3 3 Unit 3 (GE 7FA.05 Turbine) NOX 78.84 115.10
NOX (MSS) 81.07 7.67
CO 38.93 56.84
CO (MSS) 228.14 69.90
VOC 3.66 5.35
VOC (MSS) 23.93 6.57
SO2 2.95 4.43
PM 10.05 15.07
PM10 10.05 15.07
PM2.5 10.05 15.07
H2SO4 0.30 0.45
Pb 0.01 0.02
HAP (excluding Pb) 1.01 1.47
Formaldehyde 0.27 0.39
CO2 284,119.31 414,814.19
CH4 5.24 7.65
N2O 0.52 0.77
CO2e 284,391.79 415,212.02
EMGEN EMGEN Emergency Generator Engine NOX 30.91 1.55
CO 16.91 0.85
VOC 2.07 0.10
SO2 0.03 <0.01
PM 0.97 0.05
PM10 0.97 0.05
PM2.5 0.97 0.05
H2SO4 <0.01 <0.01
HAP (excluding Pb) 0.03 <0.01
Formaldehyde <0.01 <0.01
CO2 3,125.45 156.27
CH4 0.13 0.01
N2O 0.03 <0.01
CO2e 3,135.97 156.80
Page 3 of 5 0189555\
A5469 B.2-Calcs.xlsx

Date: 7/22/2013 Permit No.: TBD Regulated Entity No.: TBD
Area Name: Customer Reference No.: CN600698948
Review of applications and issuance of permits will be expedited by supplying all necessary information requested on this Table.
(A) EPN (B) FIN (C) NAME (A) POUND (B) TPY
TEXAS COMMISSION ON ENVIRONMENTAL QUALITY
Table 1(a) Emission Point Summary
Tenaska Roans Prairie Generating Station
AIR CONTAMINANT DATA
1. Emission Point 2. Component or Air Contaminant Name 3. Air Contaminant Emission Rate
FWPUMP FWPUMP Fire Water Pump NOX 3.78 0.19
CO 3.84 0.19
VOC 1.45 0.07
SO2 0.01 <0.01
PM 0.19 0.01
PM10 0.19 0.01
PM2.5 0.19 0.01
H2SO4 <0.01 <0.01
HAP (excluding Pb) 0.02 <0.01
Formaldehyde <0.01 <0.01
CO2 654.79 32.74
CH4 0.03 <0.01
N2O 0.01 <0.01
CO2e 657.00 32.85
CBFUG CBFUG Circuit Breaker Fugitives SF6 <0.01 0.01
CO2e 47.75 209.13
MSSFUG MSSFUG Maintenance Activites NOX <0.01 <0.01
CO <0.01 <0.01
VOC 0.30 <0.01
PM 0.20 0.04
PM10 0.20 0.04
PM2.5 0.20 0.04
HAP (excluding Pb) 0.30 <0.01
CO2 0.92 0.01
CH4 16.70 0.11
CO2e 351.62 2.42
FUG FUG Fugitives VOC 0.01 0.06
HAP (excluding Pb) 0.01 0.06
CO2 0.04 0.18
CH4 0.75 3.30
CO2e 15.86 69.46
EPN = Emission Point NumberFIN = Facility Identification Number
Page 4 of 5 0189555\
A5469 B.2-Calcs.xlsx

Date: 7/22/2013 Permit No.:
Area Name:
Review of applications and issuance of permits will be expedited by supplying all necessary information requested on this Table.
AIR CONTAMINANT DATA
5. Building 6. Height Above
EPN FIN Name Zone East North Height Ground Diameter Velocity Temperature Length Width Axis
(A) (B) (C) (Meters) (Meters) (Ft.) (Ft.) (Ft.) (A) (FPS) (B) (°F) (C) (Ft.) (A) (Ft.) (B) Degrees (C)
1 1 Unit 1 (GE 7FA.05 Turbine) 15 219,403 3,387,566 21.0 60.0 20.0 225.2 1,099 -- -- --
2 2 Unit 2 (GE 7FA.05 Turbine) 15 219,420 3,387,523 21.0 60.0 20.0 225.2 1,099 -- -- --
3 3 Unit 3 (GE 7FA.05 Turbine) 15 219,438 3,387,480 21.0 60.0 20.0 225.2 1,099 -- -- --
EMGEN EMGEN Emergency Generator Engine 15 219,528 3,387,595 21.0 14.0 1.0 323.4 768 -- -- --
FWPUMP FWPUMP Fire Water Pump 15 219,380 3,387,593 10.5 14.0 1.0 75.9 884 -- -- --
CBFUG CBFUG Circuit Breaker Fugitives 15 219,509 3,387,556 -- 3.0 -- -- -- 850 660 77 W
MSSFUG MSSFUG Maintenance Activites 15 219,509 3,387,556 -- 3.0 -- -- -- 850 660 77 W
FUG FUG Fugitives 15 219,509 3,387,556 -- 3.0 -- -- -- 850 660 77 W
EPN = Emission Point NumberFIN = Facility Identification Number
EMISSION POINT DISCHARGE PARAMETERS
1. Emission Point 4. UTM Coordinates of Emission Source
Point 7. Stack Exit Data 8. Fugitives
Tenaska Roans Prairie Generating Station Customer Reference No.: CN600698948
TEXAS COMMISSION ON ENVIRONMENTAL QUALITY
Table 1(a) Emission Point Summary
TBD Regulated Entity No.: TBD
Page 5 of 5 0189555\
A5469 B.2-Calcs.xlsx

Date: 7/22/2013 Permit No.: TBD Regulated Entity No.: TBD
Area Name: Customer Reference No.: CN600698948
Review of applications and issuance of permits will be expedited by supplying all necessary information requested on this Table.
(A) EPN (B) FIN (C) NAME (A) POUND (B) TPY
1 1 Unit 1 (GE 7FA.04 Turbine) NOX 72.90 106.43
NOX (MSS) 82.32 8.76
CO 35.01 51.11
CO (MSS) 225.01 69.35
VOC 3.39 4.95
VOC (MSS) 19.71 5.48
SO2 2.73 4.10
PM 8.86 13.29
PM10 8.86 13.29
PM2.5 8.86 13.29
H2SO4 0.28 0.42
Pb 0.01 0.01
HAP (excluding Pb) 0.93 1.36
Formaldehyde 0.25 0.36
CO2 262,705.55 383,550.10
CH4 4.85 7.07
N2O 0.48 0.71
CO2e 262,957.50 383,917.95
TEXAS COMMISSION ON ENVIRONMENTAL QUALITY
Table 1(a) Emission Point Summary
Tenaska Roans Prairie Generating Station
AIR CONTAMINANT DATA
1. Emission Point 2. Component or Air Contaminant Name 3. Air Contaminant Emission Rate
Page 1 of 5 0189555\
A5469 B.2-Calcs.xlsx

Date: 7/22/2013 Permit No.: TBD Regulated Entity No.: TBD
Area Name: Customer Reference No.: CN600698948
Review of applications and issuance of permits will be expedited by supplying all necessary information requested on this Table.
(A) EPN (B) FIN (C) NAME (A) POUND (B) TPY
TEXAS COMMISSION ON ENVIRONMENTAL QUALITY
Table 1(a) Emission Point Summary
Tenaska Roans Prairie Generating Station
AIR CONTAMINANT DATA
1. Emission Point 2. Component or Air Contaminant Name 3. Air Contaminant Emission Rate
2 2 Unit 2 (GE 7FA.04 Turbine) NOX 72.90 106.43
NOX (MSS) 82.32 8.76
CO 35.01 51.11
CO (MSS) 225.01 69.35
VOC 3.39 4.95
VOC (MSS) 19.71 5.48
SO2 2.73 4.10
PM 8.86 13.29
PM10 8.86 13.29
PM2.5 8.86 13.29
H2SO4 0.28 0.42
Pb 0.01 0.01
HAP (excluding Pb) 0.93 1.36
Formaldehyde 0.25 0.36
CO2 262,705.55 383,550.10
CH4 4.85 7.07
N2O 0.48 0.71
CO2e 262,957.50 383,917.95
Page 2 of 5 0189555\
A5469 B.2-Calcs.xlsx

Date: 7/22/2013 Permit No.: TBD Regulated Entity No.: TBD
Area Name: Customer Reference No.: CN600698948
Review of applications and issuance of permits will be expedited by supplying all necessary information requested on this Table.
(A) EPN (B) FIN (C) NAME (A) POUND (B) TPY
TEXAS COMMISSION ON ENVIRONMENTAL QUALITY
Table 1(a) Emission Point Summary
Tenaska Roans Prairie Generating Station
AIR CONTAMINANT DATA
1. Emission Point 2. Component or Air Contaminant Name 3. Air Contaminant Emission Rate
3 3 Unit 3 (GE 7FA.04 Turbine) NOX 72.90 106.43
NOX (MSS) 82.32 8.76
CO 35.01 51.11
CO (MSS) 225.01 69.35
VOC 3.39 4.95
VOC (MSS) 19.71 5.48
SO2 2.73 4.10
PM 8.86 13.29
PM10 8.86 13.29
PM2.5 8.86 13.29
H2SO4 0.28 0.42
Pb 0.01 0.01
HAP (excluding Pb) 0.93 1.36
Formaldehyde 0.25 0.36
CO2 262,705.55 383,550.10
CH4 4.85 7.07
N2O 0.48 0.71
CO2e 262,957.50 383,917.95
EMGEN EMGEN Emergency Generator Engine NOX 30.91 1.55
CO 16.91 0.85
VOC 2.07 0.10
SO2 0.03 <0.01
PM 0.97 0.05
PM10 0.97 0.05
PM2.5 0.97 0.05
H2SO4 <0.01 <0.01
HAP (excluding Pb) 0.03 <0.01
Formaldehyde <0.01 <0.01
CO2 3,125.45 156.27
CH4 0.13 0.01
N2O 0.03 <0.01
CO2e 3,135.97 156.80
Page 3 of 5 0189555\
A5469 B.2-Calcs.xlsx

Date: 7/22/2013 Permit No.: TBD Regulated Entity No.: TBD
Area Name: Customer Reference No.: CN600698948
Review of applications and issuance of permits will be expedited by supplying all necessary information requested on this Table.
(A) EPN (B) FIN (C) NAME (A) POUND (B) TPY
TEXAS COMMISSION ON ENVIRONMENTAL QUALITY
Table 1(a) Emission Point Summary
Tenaska Roans Prairie Generating Station
AIR CONTAMINANT DATA
1. Emission Point 2. Component or Air Contaminant Name 3. Air Contaminant Emission Rate
FWPUMP FWPUMP Fire Water Pump NOX 3.78 0.19
CO 3.84 0.19
VOC 1.45 0.07
SO2 0.01 <0.01
PM 0.19 0.01
PM10 0.19 0.01
PM2.5 0.19 0.01
H2SO4 <0.01 <0.01
HAP (excluding Pb) 0.02 <0.01
Formaldehyde <0.01 <0.01
CO2 654.79 32.74
CH4 0.03 <0.01
N2O 0.01 <0.01
CO2e 657.00 32.85
CBFUG CBFUG Circuit Breaker Fugitives SF6 <0.01 0.01
CO2e 47.75 209.13
MSSFUG MSSFUG Maintenance Activites NOX <0.01 <0.01
CO <0.01 <0.01
VOC 0.30 <0.01
PM 0.20 0.04
PM10 0.20 0.04
PM2.5 0.20 0.04
HAP (excluding Pb) 0.30 <0.01
CO2 0.92 0.01
CH4 16.70 0.11
CO2e 351.62 2.42
FUG FUG Fugitives VOC 0.01 0.06
HAP (excluding Pb) 0.01 0.06
CO2 0.04 0.18
CH4 0.75 3.30
CO2e 15.86 69.46
EPN = Emission Point NumberFIN = Facility Identification Number
Page 4 of 5 0189555\
A5469 B.2-Calcs.xlsx

Date: 7/22/2013 Permit No.:
Area Name:
Review of applications and issuance of permits will be expedited by supplying all necessary information requested on this Table.
AIR CONTAMINANT DATA
5. Building 6. Height Above
EPN FIN Name Zone East North Height Ground Diameter Velocity Temperature Length Width Axis
(A) (B) (C) (Meters) (Meters) (Ft.) (Ft.) (Ft.) (A) (FPS) (B) (°F) (C) (Ft.) (A) (Ft.) (B) Degrees (C)
1 1 Unit 1 (GE 7FA.04 Turbine) 15 219,403 3,387,566 21.0 60.0 20.0 225.2 1,099 -- -- --
2 2 Unit 2 (GE 7FA.04 Turbine) 15 219,420 3,387,523 21.0 60.0 20.0 225.2 1,099 -- -- --
3 3 Unit 3 (GE 7FA.04 Turbine) 15 219,438 3,387,480 21.0 60.0 20.0 225.2 1,099 -- -- --
EMGEN EMGEN Emergency Generator Engine 15 219,528 3,387,595 21.0 14.0 1.0 323.4 768 -- -- --
FWPUMP FWPUMP Fire Water Pump 15 219,380 3,387,593 10.5 14.0 1.0 75.9 884 -- -- --
CBFUG CBFUG Circuit Breaker Fugitives 15 219,509 3,387,556 -- 3.0 -- -- -- 850 660 77 W
MSSFUG MSSFUG Maintenance Activites 15 219,509 3,387,556 -- 3.0 -- -- -- 850 660 77 W
FUG FUG Fugitives 15 219,509 3,387,556 -- 3.0 -- -- -- 850 660 77 W
EPN = Emission Point NumberFIN = Facility Identification Number
EMISSION POINT DISCHARGE PARAMETERS
1. Emission Point 4. UTM Coordinates of Emission Source
Point 7. Stack Exit Data 8. Fugitives
Tenaska Roans Prairie Generating Station Customer Reference No.: CN600698948
TEXAS COMMISSION ON ENVIRONMENTAL QUALITY
Table 1(a) Emission Point Summary
TBD Regulated Entity No.: TBD
Page 5 of 5 0189555\
A5469 B.2-Calcs.xlsx

Tenaska Roans Prairie Generating Station
Capital 1 $890/kW $585,971,629
Annual O&M 1 $0.00124/kWh $9,565,360
Annual Fuel 2 14.7% fuel use at $4/MMBtu $11,888,654
L, Pipeline Length (miles) 10D, Pipeline Diameter (inches) 10
Materials $64,632 + $1.85 x L x (330.5 x D2 + 686.7 x D20 + 26,960) $1,301,857
Labor $341,627 + $1.85 x L x (343.2 x D2 + 2074 x D + 170,013) $4,505,478
Miscellaneous $150,166 + $1.58 x L x (8,417 x D + 7,234) $1,594,349Right of Way $48,037 + $1.2 x L x (577 x D + 29,788) $474,733
CO2 Surge Tank Fixed $1,150,636
Pipeline Control System Fixed $110,632
Fixed O&M ($/year) $8,632 x L $86,320
Number of Injection Wells 1Well Depth (m) 2,134 CO2 Captured (tons) 1,150,246.80
Site Screening and Evaluation Fixed $4,738,488
Injection Wells $240,714 x e0.0008 x Well Depth $1,327,177
Injection Equipment $94,029 x (7,839/(280 x Number of Injection Wells))0.5 $497,523
Liability Bond Fixed $5,000,000
Pore Space Acquisition $0.334/short ton CO2 $384,182
Normal Daily Expenses $11,566/Injection Well $11,566
Consumables $2,995/yr/ton CO2/day $9,438,326
Surface Maintenance $23,478 x (7,839/(280 x Number of Injection Wells))0.5 $124,226
Subsurface Maintenance $7.08/ft‐depth/Injection Well $15,109
Economic Life, years 20Interest Rate (%) 10Capital Costs $607,056,683O&M Costs (Annual) $31,129,562Capital Recovery $71,304,650Total Annualized Cost $102,434,212Total CO2 Controlled (tpy) 1,150,247
CO2 Cost Effectiveness ($/ton) 89
Geologic Storage Costs 3
Capital
Table B‐1TRPP
GHG BACT AnalysisConceptual Cost Estimate for Carbon Capture and Sequestration
O&M
Post‐Combustion CO2 Capture and Compression
Pipeline Cost Breakdown 3
Pipeline Costs
Other Capital
Declining Capital Funds
O&M
Annualized Cost Estimate
1 Adapted from Cost and Performance Baseline For Fossil Energy Plants, Volume 1: Bituminous and Natural Gas to Electricity,
DOE/2010/1397 (Revision 2, November 2010). Plant output converted from simple cycle to equivalent Frame 7EA combined cycle
output to enable use of cost information (www.ge‐energy.com/products and services/products/gas turbines heavy duty/7ea
heavy duty gas turbine.jsp). Capital costs adjusted using the ENR Construction Cost Index to 2012 dollars. O&M costs not
adjusted.
3 Pipeline and Geologic Storage cost estimates based on National Energy Technology Laboratory (US DOE) document, Estimating
Carbon Dioxide Transport and Storage Costs , DOE/NETL‐2010/1447 (March 2010). The distance to the nearest storage formation
was taken from the Gulf Coast Carbon Center. Grimes County is located on the Gulf Coast Oligocene Brine Formation, as a best
case scenario it was assumed a brine formation disposal well would be available within 10 miles of the facility.
2 Fuel costs represent the additional fuel necessary to compensate for parasitic load caused by the addition of CCS. Based on
review of review of the plant heat rates used in Case 13 and 14 presented in Cost and Performance Baseline For Fossil Energy
Plants, Volume 1: Bituminous and Natural Gas to Electricity, DOE/2010/1397 (Revision 2, November 2010), CCS imposes a 14.7%
increase in the plant heat rate; therefore, 14.7% more fuel is necessary to meet plant output. That amount of output need to
come from somewhere, and is assumed to be equivalent to the cost of fuel.
ERMTexas Registered Engineering Firm F-2393 Page 1 of 1
0189555\A5469 B.1Tenaska CO2 CCS Costs.xlsx

Pollutant
Single (one) Siemens SGT6-
5000F(5ee)Turbine
Emissions (tpy)
Total for Three Siemens
Turbines (tpy)
Emergency Generator
(tpy)
Emergency Fire Pump(tpy)
Fugitive SF6 Leakage
(tpy)
Maintenance Emissions
(tpy)
Fugitive Natural Gas Emissions (tpy)
Total Project Emissions
(tpy)
NOX 124.53 373.59 1.55 0.19 - 5.97E-07 - 375.32
CO 117.69 353.07 0.85 0.19 - 3.63E-07 - 354.10
VOC 13.58 40.73 0.10 0.07 - 2.05E-03 0.06 40.96
SO2 4.54 13.61 1.46E-03 3.06E-04 - - - 13.61
PM 14.77 44.30 0.05 0.01 - 0.04 - 44.39PM10 14.77 44.30 0.05 0.01 - 0.04 - 44.39
PM2.5 14.77 44.30 0.05 0.01 - 0.04 - 44.39
H2SO4 0.78 2.34 1.46E-04 3.06E-05 - - - 2.34
Lead 0.02 0.05 - - - - - 0.046CO2 425,954.12 1,277,862.35 156.27 32.74 - 0.01 0.18 1,278,051.55
CH4 7.86 23.57 0.01 1.33E-03 - 0.11 3.30 26.99
N2O 0.79 2.36 1.27E-03 2.66E-04 - - - 2.36
SF6 - - - - 0.01 - - 0.01
GHG (CO2e) 426,362.63 1,279,087.90 156.80 32.85 209.13 2.42 69.46 1,279,558.55Total HAPs
(excluding lead) 1.51 4.54 1.51E-03 7.78E-04 - 2.05E-03 0.06 4.60
Formaldehyde 0.40 1.21 7.56E-05 7.85E-06 - - - 1.21
Table B-2
Tenaska Roans Prairie Generating StationGrimes County, Texas
Project Potential Emissions Increase - Siemens Option
Project: Three (3) Turbines, no base-line case (new facility)
TRPP
ERMTexas Registered Engineering Firm F-2393 Page 1 of 17
0189555\A5469 B.2-Calcs.xlsx

Pollutant
Single (one) GE 7FA.05Tubine
Emissions (tpy)
Total for Three GE 7FA.05
Tubines Emissions (tpy)
Emergency Generator
(tpy)
Emergency Fire Pump (tpy)
Fugitive SF6 Leakage
(tpy)
Maintenance Emissions
(tpy)
Fugitive Natural Gas Emissions (tpy)
Total Project Emissions
(tpy)
NOX 122.77 368.31 1.55 0.19 - 5.97E-07 - 370.04
CO 126.74 380.21 0.85 0.19 - 3.63E-07 - 381.24
VOC 5.47 16.40 0.10 0.07 - 2.05E-03 0.06 16.63
SO2 10.88 32.65 1.46E-03 3.06E-04 - - - 32.65
PM 15.07 45.20 0.05 0.01 - 0.04 - 45.29PM10 15.07 45.20 0.05 0.01 - 0.04 - 45.29
PM2.5 15.07 45.20 0.05 0.01 - 0.04 - 45.29
H2SO4 0.45 1.34 1.46E-04 3.06E-05 - - - 1.34
Lead 0.02 0.05 - - - - - 0.045CO2 414,814.19 1,244,442.56 156.27 32.74 - 0.01 0.18 1,244,631.76
CH4 7.65 22.95 0.01 1.33E-03 - 0.11 3.30 26.37
N2O 0.77 2.30 1.27E-03 2.66E-04 - - - 2.30
SF6 - - - - 0.01 - - 0.01
GHG (CO2e) 415,212.02 1,245,636.06 156.80 32.85 209.13 2.42 69.46 1,246,106.71Total HAPs
(excluding lead) 1.47 4.42 1.51E-03 7.78E-04 - 2.05E-03 0.06 4.48
Formaldehyde 0.39 1.18 7.56E-05 7.85E-06 - - - 1.18
Table B-3
Tenaska Roans Prairie Generating StationGrimes County, Texas
Project Potential Emissions Increase - GE 7FA.05 Option
Project: Three (3) Turbines, no base-line case (new facility)
TRPP
ERMTexas Registered Engineering Firm F-2393 Page 2 of 17
0189555\A5469 B.2-Calcs.xlsx

Pollutant
Single (one) GE 7FA.04Tubine
Emissions (tpy)
Total for Three GE 7FA.04
Tubine Emissions (tpy)
Emergency Generator
(tpy)
Emergency Fire Pump (tpy)
Fugitive SF6 Leakage
(tpy)
Maintenance Emissions
(tpy)
Fugitive Natural Gas Emissions (tpy)
Total Project Emissions
(tpy)
NOX 115.19 345.57 1.55 0.19 - 5.97E-07 - 347.30
CO 120.46 361.39 0.85 0.19 - 3.63E-07 - 362.43
VOC 5.06 15.17 0.10 0.07 - 2.05E-03 0.06 15.41
SO2 9.46 28.39 1.46E-03 3.06E-04 - - - 28.39
PM 13.29 39.86 0.05 0.01 - 0.04 - 39.96PM10 13.29 39.86 0.05 0.01 - 0.04 - 39.96
PM2.5 13.29 39.86 0.05 0.01 - 0.04 - 39.96
H2SO4 0.42 1.25 1.46E-04 3.06E-05 - - - 1.25
Lead 0.014 0.042 - - - - - 0.042CO2 383,550.10 1,150,650.29 156.27 32.74 - 0.01 0.18 1,150,839.49
CH4 7.07 21.22 0.01 1.33E-03 - 0.11 3.30 24.64
N2O 0.71 2.12 1.27E-03 2.66E-04 - - - 2.12
SF6 - - - - 0.00875 - - 0.01
GHG (CO2e) 383,917.95 1,151,753.84 156.80 32.85 209.13 2.42 69.46 1,152,224.49Total HAPs
(excluding lead) 1.36 4.08 1.51E-03 7.78E-04 - 2.05E-03 0.06 4.15
Formaldehyde 0.36 1.09 7.56E-05 7.85E-06 - - - 1.09
Table B-4
Tenaska Roans Prairie Generating StationGrimes County, Texas
Project Potential Emissions Increase - GE 7FA.04 Option
Project: Three (3) Turbines, no base-line case (new facility)
TRPP
ERMTexas Registered Engineering Firm F-2393 Page 3 of 17
0189555\A5469 B.2-Calcs.xlsx

Table B-5TRPP
Tenaska Roans Prairie Generating StationGrimes County, Texas
Siemens SGT6-5000F Emissions Calculations
Potential Emissions - Siemens SGT6-5000F Gas Turbine
Parameter Value UnitsTurbine Max. Heat Input Rating 2,441 MMBtu/hr per turbineTurbine Min. Heat Input Rating 1,250 MMBtu/hr per turbine
Number of Turbines 1Turbine Operating Time 2,920 hrs
Pollutant Emissions Factor
Emissions from turbine(lb/hr)
Emissions from turbine
(tpy) Reference Footnote
NOX 9 ppmvd @ 15% O2 0.0332 lb/MMBtu 80.96 118.20 [1,2]
CO 9 ppmvd @ 15% O2 0.0202 lb/MMBtu 25.23 36.84 [1,2]
VOC 1 ppmvd @ 15% O2 0.0013 lb/MMBtu 3.14 4.58 [1,2]
SO2 0.5 gr/100 dscf 0.0012 lb/MMBtu 3.03 4.43 [3]PM 0.004 lb/MMBtu 9.80 14.31 [4]
PM10 0.004 lb/MMBtu 9.80 14.31 [4]
PM2.5 0.004 lb/MMBtu 9.80 14.31 [4]
H2SO4 0.18 lb H2SO4/lb SO2 0.00022 lb/MMBtu 0.54 0.78 [5]
Lead 0.005 lb/MMscf 4.35E-06 lb/MMBtu 0.0106 0.015 [6]CO2 54.22 kg/MMBtu 119.50 lb/MMBtu 291,749.39 425,954.12 [7]
CH4 0.001 kg/MMBtu 0.002 lb/MMBtu 5.38 7.86 [8]
N2O 0.0001 kg/MMBtu 0.0002 lb/MMBtu 0.54 0.79 [8]CO2e 292,029.20 426,362.63 [8]
[1] NOX, CO, and VOC emission factors in ppmvd taken from BACT determination
[2] NOX, CO, and VOC emission factors converted from ppmvd to lb/MMBtu using EPA Method 19 Equation 19-1 as shown for NOX below
9 scf NOx 1 lbmol 46.01 lb 8,710 scf 20.9 = 0.0332 lb NOx
1,000,000 scf 385.3 scf lbmol MMBtu 20.9 -15 MMBtu
[3] SO2: Estimated using mass balance calculation with all sulfur converted to SO2, Max Heat Input. Natural gas @ 1,020 Btu/scf with sulfur content (gr/100 dcf) = 0.5
Sample calculation
0.50 gr S scf 1,000,000 Btu 1 lb lbmol S 64 lb SO2 = 0.0012 lb SO2
100 dscf 1,150 Btu MMBtu 7,000 gr 32 lb S lbmol SO2 MMBtu
[4] PM emission rate, including condensible PM, furnished by Siemens. All PM is PM2.5 or less, Presumed BACT.
[5]
[6] No factor for Turbines, Lead emission factor from AP-42 Table 1.4-2 (0.0005 lb/MMscf), assumed natural gas heat value of 1,050 Btu/scf for boilers.
[7] Based on projected fuel composition from supplier, see Appendix D.
[8] Based on USEPA's Mandatory Reporting Rule, Table C-2. To convert to CO2e, the following global warming potentials were used - CH4 = 21, N2O = 310.
Ratio of sulfuric acid mist emissions estimated by Siemens as 0.6 lb/hr, to SO2 at 3.4 lb/hr, assuming sulfur content of natural gas as 0.5 gr/100 scf. Emission rate shown was calculated using Siemens ratio of 0.6/3.4 applied to calculated SO2 emission rate using actual sulfur content of natural gas used. See Note 4.
Maximum allowable hours per year for a peaking unit
Manufacturer's SpecificationsManufacturer's Specifications
Source
ERMTexas Registered Engineering Firm F-2393 Page 4 of 17
0189555\A5469 B.2-Calcs.xlsx

Table B-5TRPP
Tenaska Roans Prairie Generating StationGrimes County, Texas
Siemens SGT6-5000F Emissions Calculations
Potential HAP Emissions - Siemens SGT6-5000F(5ee) Gas Turbine
Pollutant
Emissions from Turbine(lb/hr)
Emissions from Turbine
(tpy) Reference FootnoteToluene 1.30E-04 lb/MMBtu 0.32 0.46 [1]
Naphthalene 1.30E-06 lb/MMBtu 3.17E-03 4.63E-03 [1]Formaldehyde 1.13E-04 lb/MMBtu 0.28 0.40 [2]
Benzene 1.20E-05 lb/MMBtu 0.03 0.04 [1]Acetaldehyde 4.00E-05 lb/MMBtu 0.10 0.14 [1]Ethylbenzene 3.20E-05 lb/MMBtu 0.08 0.11 [1]
Propylene Oxide 2.90E-05 lb/MMBtu 0.07 0.10 [1]Xylenes 6.40E-05 lb/MMBtu 0.16 0.23 [1]
1,3-Butadiene 4.30E-07 lb/MMBtu 1.05E-03 1.53E-03 [1]PAH 2.20E-06 lb/MMBtu 0.01 0.01 [1]Total 4.24E-04 lb/MMBtu 1.04 1.51
[1][2] Average of stack test results from Kiamichi and Rolling Hills facilities.
Based on AP-42, Table 3.1-3, Emissions factors for HAP from gas-fired stationary gas turbines.
Emissions Factor
ERMTexas Registered Engineering Firm F-2393 Page 5 of 17
0189555\A5469 B.2-Calcs.xlsx

Table B-6TRPP
Tenaska Roans Prairie Generating StationGrimes County, Texas
GE 7FA.05 Emissions Calculations
Potential Emissions - GE 7FA.05 Gas Turbine
Parameter Value UnitTurbine Max. Heat Input Rating 2,378 MMBtu/hr per turbine
Number of Turbines 1Turbine Operating Time 2,920 hours per year
Pollutant Emissions Factor
Emissions from turbine(lb/hr)
Emissions from turbine
(tpy) Reference Footnote
NOX 9 ppmvd @ 15% O2 0.0332 lb/MMBtu 78.84 115.10 [1,2]
CO 7.3 ppmvd @ 15% O2 0.0164 lb/MMBtu 38.93 56.84 [1,2]
VOC 1.2 ppmvd @ 15% O2 0.0015 lb/MMBtu 3.66 5.35 [1,2]
SO2 0.5 gr/100 dscf 0.0012 lb/MMBtu 2.95 4.31 [3]PM 0.00423 lb/MMBtu 10.05 14.67 [4]
PM10 0.00423 lb/MMBtu 10.05 14.67 [4]
PM2.5 0.00423 lb/MMBtu 10.05 14.67 [4]
H2SO4 0.10 lb H2SO4/lb SO2 0.00013 lb/MMBtu 0.30 0.45 [5]
Lead 0.005 lb/MMscf 4.35E-06 lb/MMBtu 0.0103 0.015 [6]CO2 54.22 kg/MMBtu 119.50 lb/MMBtu 284,119.31 414,814.19 [7]
CH4 0.001 kg/MMBtu 0.002 lb/MMBtu 5.24 7.65 [8]
N2O 0.0001 kg/MMBtu 0.0002 lb/MMBtu 0.52 0.77 [8]CO2e 284,391.79 415,212.02 [8]
[1] NOX, CO, and VOC emission factors in ppmvd taken from BACT determination
[2] NOX, CO, and VOC emission factors converted from ppmvd to lb/MMBtu using EPA Method 19 Equation 19-1 as shown for NOX below
9 scf NOx 1 lbmol 46.01 lb 8,710 scf 20.9 = 0.0332 lb NOx
1,000,000 scf 385.3 scf lbmol MMBtu 20.9 -15 MMBtu
[3] SO2: Esimated using mass balance calculation with all sulfur converted to SO2, Max Heat Input. Natural gas @ 1,150 Btu/scf with sulfur content (gr/100 cf) = 0.5
Sample calculation
0.50 gr S scf 1,000,000 Btu 1 lb lbmol S 64 lb SO2 = 0.0012 lb SO2
100 dscf 1,150 Btu MMBtu 7,000 gr 32 lb S lbmol SO2 MMBtu
[4] All PM is PM2.5 or less and includes condensible PM, Presumed BACT
[5]
[6] No factor for Turbines, Lead emission factor from AP-42 Table 1.4-2 (0.0005 lb/MMscf), assumed natural gas heat value of 1,150 Btu/scf for boilers.
[7] Based on projected fuel composition from supplier, see Appendix D.
[8] Based on USEPA's Mandatory Reporting Rule, Table C-2. To convert to CO2e, the following global warming potentials were used - CH4 = 21, N2O = 310.
SourceManufacturer's Specification
Ratio of sulfuric acid mist emissions estimated by GE as 0.16 lb/hr, with SO2 at 1.55 lb/hr, and assumes sulfur content of natural gas as 8 ppmw. Emission rate shown was calculated using GE ratio of 0.16/1.55 applied to calculated SO2 emission rate using actual sulfur content of natural gas used. See Note 4.
Maximum allowable hours per year for a peaking unit
ERMTexas Registered Engineering Firm F-2393 Page 6 of 17
0189555\A5469 B.2-Calcs.xlsx

Table B-6TRPP
Tenaska Roans Prairie Generating StationGrimes County, Texas
GE 7FA.05 Emissions Calculations
Potential HAP Emissions- GE 7FA.05 Gas Turbine
Pollutant
Emissions from Turbine(lb/hr)
Emissions from Turbine
(tpy) Reference Footnote
Toluene 1.30E-04 lb/MMBtu 0.31 0.45 [1]
Naphthalene 1.30E-06 lb/MMBtu 3.09E-03 4.51E-03 [1]
Formaldehyde 1.13E-04 lb/MMBtu 0.27 0.39 [2]
Benzene 1.20E-05 lb/MMBtu 0.03 0.04 [1]
Acetaldehyde 4.00E-05 lb/MMBtu 0.10 0.14 [1]
Ethylbenzene 3.20E-05 lb/MMBtu 0.08 0.11 [1]
Propylene Oxide 2.90E-05 lb/MMBtu 0.07 0.10 [1]
Xylenes 6.40E-05 lb/MMBtu 0.15 0.22 [1]1,3-Butadiene 4.30E-07 lb/MMBtu 1.02E-03 1.49E-03 [1]
PAH 2.20E-06 lb/MMBtu 5.23E-03 0.01 [1]Total 4.24E-04 lb/MMBtu 1.01 1.47
[1][2] Average of stack test results from Kiamichi and Rolling Hills facilities.
Emissions Factor
Based on AP-42, Table 3.1-3, Emissions factors for HAP from gas-fired stationary gas turbines.
ERMTexas Registered Engineering Firm F-2393 Page 7 of 17
0189555\A5469 B.2-Calcs.xlsx

Table B-7TRPP
Tenaska Raons Prairie Generating StationGrimes County, Texas
GE 7FA.04 Emissions Calculations
Potential Emissions - GE 7FA.04 Gas Turbine
Parameter Value UnitTurbine Max. Heat Input Rating 2,198 MMBtu/hr per turbine
Number of Turbines 1Turbine Operating Time 2,920 hours per year
Pollutant Emissions Factor
Emissions from turbine(lb/hr)
Emissions from turbine
(tpy) Reference Footnote
NOX 9 ppmvd @ 15% O2 0.0332 lb/MMBtu 72.90 106.43 [1,2]
CO 7.1 ppmvd @ 15% O2 0.0159 lb/MMBtu 35.01 51.11 [1,2]
VOC 1.2 ppmvd @ 15% O2 0.0015 lb/MMBtu 3.39 4.95 [1,2]
SO2 0.5 gr/100 dscf 0.0012 lb/MMBtu 2.73 3.99 [3]PM 0.00403 lb/MMBtu 8.86 12.93 [4]
PM10 0.00403 lb/MMBtu 8.86 12.93 [4]
PM2.5 0.00403 lb/MMBtu 8.86 12.93 [4]
H2SO4 0.10 lb H2SO4/lb SO2 0.00013 lb/MMBtu 0.28 0.42 [5]
Lead 0.005 lb/MMscf 4.35E-06 lb/MMBtu 0.0096 0.014 [6]CO2 54.22 kg/MMBtu 119.50 lb/MMBtu 262,705.55 383,550.10 [7]
CH4 0.001 kg/MMBtu 0.002 lb/MMBtu 4.85 7.07 [8]
N2O 0.0001 kg/MMBtu 0.0002 lb/MMBtu 0.48 0.71 [8]CO2e 262,957.50 383,917.95 [8]
[1] NOX, CO, and VOC emission factors in ppmvd taken from BACT determination
[2] NOX, CO, and VOC emission factors converted from ppmvd to lb/MMBtu using EPA Method 19 Equation 19-1 as shown for NOX below
9 scf NOx 1 lbmol 46.01 lb 8,710 scf 20.9 = 0.0332 lb NOx
1,000,000 scf 385.3 scf lbmol MMBtu 20.9 -15 MMBtu
[3] SO2: Esimated using mass balance calculation with all sulfur converted to SO2, Max Heat Input. Natural gas @ 1150 Btu/scf with sulfur content (gr/100 cf) = 0.5
Sample calculation
0.50 gr S scf 1,000,000 Btu 1 lb lbmol S 64 lb SO2 = 0.0014 lb SO2
100 dscf 1,020 Btu MMBtu 7,000 gr 32 lb S lbmol SO2 MMBtu
[4] All PM is PM2.5 or less and includes condensible PM, Presumed BACT
[5]
[6] No factor for Turbines, Lead emission factor from AP-42 Table 1.4-2 (0.0005 lb/MMscf), assumed natural gas heat value of 1,150 Btu/scf for boilers.
[7] Based on projected fuel composition from supplier, see Appendix D.
[8] Based on USEPA's Mandatory Reporting Rule, Table C-2. To convert to CO2e, the following global warming potentials were used - CH4 = 21, N2O = 310.
SourceManufacturer's Specification
Maximum allowable hours per year for a peaking unit
Ratio of sulfuric acid mist emissions estimated by GE as 0.16 lb/hr, with SO2 at 1.55 lb/hr, and assumes sulfur content of natural gas as 8 ppmw. Emission rate shown was calculated using GE ratio of 0.16/1.55 applied to calculated SO2 emission rate using actual sulfur content of natural gas used. See Note 4.
ERMTexas Registered Engineering Firm F-2393 Page 8 of 17
0189555\A5469 B.2-Calcs.xlsx

Table B-7TRPP
Tenaska Raons Prairie Generating StationGrimes County, Texas
GE 7FA.04 Emissions Calculations
Potential HAP Emissions- GE 7FA.04 Gas Turbine
Pollutant
Emissions from Turbine(lb/hr)
Emissions from Turbine
(tpy) Reference Footnote
Toluene 1.30E-04 lb/MMBtu 0.29 0.42 [1]
Naphthalene 1.30E-06 lb/MMBtu 2.86E-03 4.17E-03 [1]
Formaldehyde 1.13E-04 lb/MMBtu 0.25 0.36 [2]
Benzene 1.20E-05 lb/MMBtu 0.03 0.04 [1]
Acetaldehyde 4.00E-05 lb/MMBtu 0.09 0.13 [1]
Ethylbenzene 3.20E-05 lb/MMBtu 0.07 0.10 [1]
Propylene Oxide 2.90E-05 lb/MMBtu 0.06 0.09 [1]
Xylenes 6.40E-05 lb/MMBtu 0.14 0.21 [1]
1,3-Butadiene 4.30E-07 lb/MMBtu 9.45E-04 1.38E-03 [1]
PAH 2.20E-06 lb/MMBtu 4.84E-03 0.01 [1]Total 4.24E-04 lb/MMBtu 0.93 1.36
[1][2] Average of stack test results from Kiamichi and Rolling Hills facilities.
Emissions Factor
Based on AP-42, Table 3.1-3, Emissions factors for HAP from gas-fired stationary gas turbines.
ERMTexas Registered Engineering Firm F-2393 Page 9 of 17
0189555\A5469 B.2-Calcs.xlsx

Table B-8TRPP
Tenaska Roans Prairie Generating StationGrimes County, Texas
Emergency Generator Engine Emissions Calculations
Project: Three (3) Turbines, no base-line case (new facility)
Potential Emissions - Emergency Generator
Parameter Value Units SourceManufacturer = Caterpillar (or similar)
Generator Model = 2000 kWEngine Model = 3516C ATAACSerial Number = TBD
Fuel Type = DieselFuel Density = 7.001 lb/gal Manufacturer's Specification Sheet November 6, 2012
Fuel High Heat Value = 138,000 Btu/gal 40 CFR Part 98 Subpart C, Table C-1Purpose = Emergency Generator
Displacement = 4,210.64 in3 Manufacturer's Gen Set Package Performance Data [DM 8263]Displacement = 69 L Manufacturer's Gen Set Package Performance Data [DM 8263]
Number of Cylinders = 16 Manufacturer's Gen Set Package Performance Data [DM 8263]Engine Rating = 2,937 hp Manufacturer's Gen Set Package Performance Data [DM 8263]
Fuel Consumption = 138.9 gal/hr Manufacturer's Gen Set Package Performance Data [DM 8263]Heat Rate = 19.17 MMBtu/hr Fuel Consumption * Fuel High Heat Value
Annual Hours of Operation = 100 hr/yr Provided by TENASKA
Pollutant Emission Factor
Emissions from Engine(lb/hr)
Emissions from Engine
(tpy)Reference Footnote
NOX+NMHC 6.4 g/kW-hr 0.01 lb/hp-hr 30.91 1.55 [1]
CO 3.5 g/kW-hr 5.76E-03 lb/hp-hr 16.91 0.85 [1]VOC (TOC) 7.05E-04 lb/hp-hr 2.07 0.10 [2]
SO2 15 ppmw S 9.93E-06 lb/hp-hr 0.03 0.00 [3]PM 0.20 g/kW-hr 3.29E-04 lb/hp-hr 0.97 0.05 [1]
PM10 0.20 g/kW-hr 3.29E-04 lb/hp-hr 0.97 0.05 [4]
PM2.5 0.20 g/kW-hr 3.29E-04 lb/hp-hr 0.97 0.05 [4]
H2SO4 0.10 lb H2SO4/lb SO2 9.93E-07 lb/hp-hr 2.92E-03 1.46E-04 [5]
Total HAP 0.0016 lb/MMBtu 1.03E-05 lb/hp-hr 0.03 1.51E-03 [6]CO2 73.96 kg/MMBtu 1.06 lb/hp-hr 3,125.45 156.27 [7]
CH4 3.0E-03 kg/MMBtu 4.32E-05 lb/hp-hr 0.13 0.01 [7]
N2O 6.0E-04 kg/MMBtu 8.63E-06 lb/hp-hr 0.03 1.27E-03 [7]
CO2e 3,135.97 156.80 [7]
ERMTexas Registered Engineering Firm F-2393 Page 10 of 17
0189555\A5469 B.2-Calcs.xlsx

Table B-8TRPP
Tenaska Roans Prairie Generating StationGrimes County, Texas
Emergency Generator Engine Emissions Calculations
Project: Three (3) Turbines, no base-line case (new facility)
[1] Engine will be subject to ICE NSPS (40 CFR Part 60, Subpart IIII) and therefore, subject to Tier 2 emissions limits (40 CFR 89.112) for engines greater than 750 hp.Emission factors are based on Tier 2 limits.
[2] Based on AP-42, Table 3.4-1, Gaseous Emission Factors for Large Stationary Diesel and All Stationary Duel-Fired Engines[3] SO2 emissions were estimated using a mass balance calculation based on the use of ultra-low sulfur content fuel and the fuel consumption rate.
Sample calculation:15 lb S 7.001 lb diesel 138.9 gal diesel 1 lbmol S 64 lb SO2 = 9.93E-06 lb SO2
1,000,000 lb diesel gal diesel hr 2,937 hp 32 lb S lbmol SO2 hp-hr
[4] Assumed that PM was PM2.5.
[5] Estimated as 10% of SO2 emissions
[6] Based on AP-42, Tables 3.4-3 and 3.4-4, Hazardous Air Pollutant Emission Factors for Large Stationary Diesel Engines.
[7] Based on USEPA's Mandatory Reporting Rule, Tables C-1 and C-2. To convert to CO2e, the following global warming potentials were used - CH4 = 21, N2O = 310.
ERMTexas Registered Engineering Firm F-2393 Page 11 of 17
0189555\A5469 B.2-Calcs.xlsx

Table B-9TRPP
Tenaska Roans Prairie Generating StationGrimes County, Texas
Emergency Firewater Pump Engine Emissions Calculations
Project: Three (3) Turbines, no base-line case (new facility)
Potential Emissions - Firewater Pump
Parameter Value Units SourceManufacturer = Cummins (or similar)Pump Model =
Engine Model = CFP15E-F30Serial Number = TBD
Fuel Type = DieselFuel Density = 7.001 lb/gal Manufacturer's Specification Sheet November 6, 2012
Fuel High Heat Value = 138,000 Btu/gal 40 CFR Part 98 Subpart C, Table C-1Purpose = Firewater Pump
Displacement = 915.00 in3 Manufacturer's Specification SheetCFP15E-F10-F70 (@2100 rpm)Displacement = 15 L Manufacturer's Specification SheetCFP15E-F10-F70 (@2100 rpm)
Number of Cylinders = 6 Manufacturer's Specification SheetCFP15E-F10-F70 (@2100 rpm)Engine Rating = 575 hp Manufacturer's Specification SheetCFP15E-F10-F70 (@2100 rpm)
Fuel Consumption = 29.1 gal/hr Manufacturer's EPA & CARB Tier 3 Emission Data Sheet March 24, 2010Heat Rate = 4.02 MMBtu/hr Fuel Consumption * Fuel High Heat Value
Annual Hours of Operation = 100 hr/yr Provided by TENASKA
Pollutant Emission Factor
Emissions from Engine(lb/hr)
Emissions from Engine
(tpy)Reference Footnote
NOX+NMHC 4.0 g/kW-hr 0.01 lb/hp-hr 3.78 0.19 [1]
CO 6.68E-03 lb/hp-hr 3.84 0.19 [2]VOC (TOC) 2.51E-03 lb/hp-hr 1.45 0.07 [2]
SO2 15 ppmw S 1.06E-05 lb/hp-hr 0.01 3.06E-04 [3]PM 0.20 g/kW-hr 3.29E-04 lb/hp-hr 0.19 0.01 [1]
PM10 0.20 g/kW-hr 3.29E-04 lb/hp-hr 0.19 0.01 [4]
PM2.5 0.20 g/kW-hr 3.29E-04 lb/hp-hr 0.19 0.01 [4]
H2SO4 0.10 lb H2SO4/lb SO2 1.06E-06 lb/hp-hr 6.11E-04 3.06E-05 [5]
Total HAP 0.0039 lb/MMBtu 2.71E-05 lb/hp-hr 0.02 7.78E-04 [6]CO2 73.96 kg/MMBtu 1.14 lb/hp-hr 654.79 32.74 [7]
CH4 3.0E-03 kg/MMBtu 4.62E-05 lb/hp-hr 0.03 1.33E-03 [7]
N2O 6.0E-04 kg/MMBtu 9.24E-06 lb/hp-hr 0.01 2.66E-04 [7]
CO2e 657.00 32.85 [7]
ERMTexas Registered Engineering Firm F-2393 Page 12 of 17
0189555\A5469 B.2-Calcs.xlsx

Table B-9TRPP
Tenaska Roans Prairie Generating StationGrimes County, Texas
Emergency Firewater Pump Engine Emissions Calculations
Project: Three (3) Turbines, no base-line case (new facility)
[1] Engine will be subject to ICE NSPS (40 CFR Part 60, Subpart IIII). Emission factors are based on Table 4 to Subpart IIII.[2] Based on AP-42, Table 3.3-1, Emission Factors for Uncontrolled Gasoline and Diesel Industrial Engines[3] SO2 emissions were estimated using a mass balance calculation based on the use of ultra-low sulfur content fuel and the fuel consumption rate.
Sample calculation:15 lb S 7.001 lb diesel 29.1 gal diesel 1 lbmol S 64 lb SO2 = 1.06E-05 lb SO2
1,000,000 lb diesel gal diesel hr 575 hp 32 lb S lbmol SO2 hp-hr
[4] Assumed that PM was PM2.5.
[5] Estimated as 10% of SO2 emissions
[6] Based on AP-42, Table 3.3-2, Hazardous Air Pollutant Emission Factors for Uncontrolled Diesel Engines.
[7] Based on USEPA's Mandatory Reporting Rule, Tables C-1 and C-2. To convert to CO2e, the following global warming potentials were used - CH4 = 21, N2O = 310.
ERMTexas Registered Engineering Firm F-2393 Page 13 of 17
0189555\A5469 B.2-Calcs.xlsx

Table B-10TRPP
Tenaska Roans Prairie Generating StationGrimes County, Texas
Fugitive Emissions Calculations
Project: Three (3) Turbines, no base-line case (new facility)
Potential Emissions - Fugitive Components
Annual Operating Hours 8,760 hr/yrVOC Content of Natural Gas [1] 1.78 wt%HAP Content of Natural Gas [2] 1.78 wt%CO2 Content of Natural Gas [3] 5.49 wt%CH4 Content of Natural Gas [4] 100 wt%
Number of Control Efficiency [7] Total EmissionsComponent and Service Components [5] Emission Factor [6] (%) lb/hr tpy
Valves Gas/Vapor 936 0.0089 lb/hr-component 97 0.25 1.09
Light Liquid 0 0.0035 lb/hr-component 97 0 0Heavy Liquid 0 0.0007 lb/hr-component 97 0 0
Pumps Light Liquid 0 0.0386 lb/hr-component 93 0 0
Heavy Liquid 0 0.0161 lb/hr-component 93 0 0Flanges/Connectors
Gas/Vapor 2,628 0.0029 lb/hr-component 97 0.23 1.00Light Liquid 0 0.0005 lb/hr-component 97 0 0
Heavy Liquid 0 0.00007 lb/hr-component 97 0 0Compressors
Gas/Vapor 6 0.5027 lb/hr-component 95 0.15 0.66Pressure Relief Valves
Gas/Vapor 18 0.2293 lb/hr-component 97 0.12 0.54Open Ended Lines
All Liquids 0 0.004 lb/hr-component 97 0 0Total Emissions 0.75 3.30VOC Emissions [8] 0.01 0.06HAP Emissions [8] 0.01 0.06CO2 Emissions [8] 0.04 0.18CH4 Emissions [8] 0.75 3.30CO2e Emissions [9] 15.86 69.46
[1] From Natural Gas Analysis provided by Tenaska on April 12, 2013.[2] Conservatively assumed that HAP Content = VOC Content.[3] Maximum pipeline specification (2 volume %) converted to weight percent assuming natural gas MW is equal to methane.[4] Conservative assumption.[5] Number of Components provided via email from Mr. Larry Carlson (Tenaska) on April 12, 2013.[6]
[7] Control Efficiency for AVO Program from October 2000 Draft TCEQ Technical Guidance Package for Equipment Leak Fugitives.
[8] Total Emissions * Content of Natural Gas (wt%)[9]
SOCMI without Ethylene (C2) Fugitive Equipment Leak Factors from October 2000 Draft TCEQ Technical Guidance Package for Equipment Leak Fugitives.
Based on USEPA's Mandatory Reporting Rule, Table C-1. To convert to CO2e, the following global warming potentials were used - CH4 = 21, N2O = 310.
ERMTexas Registered Engineering Firm F-2393 Page 14 of 17
0189555\A5469 B.2-Calcs.xlsx

Table B-11TRPP
Tenaska Roans Prairie Generating StationGrimes County, Texas
SF6 Circuit Breaker Emissions
Project: Three (3) Turbines, no base-line case (new facility)
GHG Emissions from SF6 Insulated Electrical Equipment
Description of SF6 containing
equipment
Number of Pieces of
Equipment
Weight of SF6
per piece of Equipment
(lb)
Weight of SF6
per Equipment
Type(lb)
IEC standard for
equipment leakage [1](% per year)
Fugitive SF6
(lb/hr)
Fugitive SF6
(ton/yr)
Global Warming
Potential [2]
Fugitive CO2e
(lb/hr)
Fugitive CO2e
(ton/yr)
Circuit Breakers 7 500 3,500 0.50% 0.00200 0.00875 23,900 47.75 209.13TOTAL 3,500 0.50% 0.00200 0.00875 23,900 47.75 209.13
[1] IEC, International Electrotechnical Commission Standard 62271-1, 2004, assume 100% loss of content upon leakage.[2] Based on USEPA's Mandatory Reporting Rule, Table A-1.
Sulfur hexafluoride (SF6) is used in high voltage electrical equipment as an insulator and/or arc quenching medium. Fugitive emissions of SF6 may result due to equipment leakage. Because SF6 is a very potent greenhouse gas its emissions have been included in the facility-wide GHG emission estimation.
ERMTexas Registered Engineering Firm F-2393 Page 15 of 17
0189555\A5469 B.2-Calcs.xlsx

Table B-12TRPP
Tenaska Roans Prairie Generating StationGrimes County, Texas
MSS Emissions Calculations
Project: Three (3) Turbines, no base-line case (new facility)
Summary of Potential Emissions - Maintenance Operations
On-Line Turbine Washing
(tpy)
Turbine Filter
Changeouts(tpy)
Gaseous Fuel
Venting(tpy)
CEMS Calibration
(tpy)
Total Maintenance Emissions
(tpy)- - - 5.97E-07 5.97E-07
- - - 3.63E-07 3.63E-07- - 2.05E-03 - 2.05E-03- - - - -
0.04 4.04E-05 - - 0.040.04 1.91E-05 - - 0.04
0.04 2.89E-06 - - 0.04
- - - - -
- - - - -- - 0.01 - 0.01
- - 0.11 - 0.11
- - - - -
- - 2.42 - 2.42
- - 2.05E-03 - 2.05E-03- - - - -
SO2
PMPM10
NOX
COVOC
Pollutant
GHG (CO2e)
Total HAPs(excluding lead)Formaldehyde
CO2
CH4
N2O
PM2.5
H2SO4
Lead
ERMTexas Registered Engineering Firm F-2393 Page 16 of 17
0189555\A5469 B.2-Calcs.xlsx

Table B-12TRPP
Tenaska Roans Prairie Generating StationGrimes County, Texas
MSS Emissions Calculations
Potential Emissions - Gaseous Fuel Venting, Small Equipment and Fugitives
Emissions Calculation [1]
Activity
Max Hourly Volume [2] Vi
(ft3)
Annual Volume [2]
Vi
(ft3)
Pressure Pi
(psia)
TemperatureTi
(°F)
Standard Pressure
Pf
(psia)
Standard Temperature
Tf
(°F)
Max Hourly Volume [3]
Vf
(scf)
Volume [3] Vf
(scf)Frequency
(hr/yr)Hourly (lb/hr)
Annual (tpy)
83 1,146 64.7 50 14.7 68 378.2 5,222.0 30 0.29 2.04E-030.7 6.7 64.7 50 14.7 68 3.2 30.5 10 0.0025 1.19E-05
0.30 2.05E-030.30 2.05E-030.92 0.01
16.70 0.11351.62 2.42
[1] Emission input data confirmed by Mr. Larry Carlson (Tenaska) on April 12, 2013[2] Initial volumes of lines and gas condition provided by Mr. Larry Carlson(Tenaska)[3] Final volume is calculated using Ideal Gas Law[4] Additional assumptions:
Natural Gas Mw: 16.87 lb/lb-mole (From Natural Gas Analysis provided by Tenaska on April 12, 2013)VOC Content of Natural Gas 1.78% by Wt. (From Natural Gas Analysis provided by Tenaska on April 12, 2013)HAP Content of Natural Gas 1.78% by Wt. (Conservatively assumed that HAP Content = VOC Content.)CO2 Content of Natural Gas 5.49% by Wt. (Maximum pipeline specification (2 volume %) converted to weight percent assuming natural gas MW is equal to methane)CH4 Content of Natural Gas 100.00% by Wt. (Conservative assumption)
Molar Volume of Gas 385.27 scf/lb-mol (Based on Ideal Gas Law at Standard Pressure and Temperature - 14.7 psia and 68°F)Based on USEPA's Mandatory Reporting Rule, Table C-1. To convert to CO2e, the following global warming potentials were used - CH4 = 21, N2O = 310.
Example Calculation for Fuel Line:378.2 scf lb-mole 16.80 lb NG
hr 385.27 scf lb-mole
Annual Emissions (tpy) = 5,222 scf lb-mole 16.80 lb NG 1 tonyr 385.27 scf lb-mole 2,000 lb
VOC Emissions
LocationFuel Line
Small Equipment
Hourly Emissions (lb/hr) =0.0178 lb VOC
=
Piping Description Initial Conditions Final Conditions
Total HAP Emissions:Total CO2 Emissions:Total CH4 Emissions:
Total CO2e Emissions:
Total VOC Emissions:
0.0178 lb VOC0.0020
lb Nat Gaston/yr
0.29 lb/hrlb Nat Gas
=
ERMTexas Registered Engineering Firm F-2393 Page 17 of 17
0189555\A5469 B.2-Calcs.xlsx

Recently Issued Permits and Pending Applications Appendix C
July 2013
Project No. 0189555
Environmental Resources Management 15810 Park Ten Place, Suite 300
Houston, Texas 77084 (281) 600-1000

Table C-1TRPP
Tenaska Roans Prairie Generating StationGrimes County, TX
Recently Issued Permits and Applications Under Review for Greenhouse Gases from Combustion Turbines
Company NameFacility Name
Location Model tpy CO2e Parameter Units
Pio Pico Energy Center, LLCPio Pico Energy Center
CAYork Plant Holdings, LLCYork Generation Facility
PASabine Pass LNG, LP & Sabine Pass Liquefaction, LL
Sabine Pass LNG TerminalLA
City of PalmdalePalmdale Hybrid Power Project
CAWolverine Power Supply Cooperative Inc.
Sumpter Power PlantMI
Sunbury Generation LPSunbury Generation LP/Sunbury SES
PAGateway Green Energy
Gateway Cogeneration 1, LLC - Smart Water ProjectVA
Moxie Energy LLCMoxie Liberty LLC/Asylum Power Plt
PAApplications Pending
Calhoun Port AuthorityES Joslin Power Station
Point Comfort, TX
Calpine Corporation 180 MWDeer Park Energy Center 725 MMBtu/hr
Dallas, TXCopano Processing, LP
Houston Central Gas PlantSheridan, TX
DCP Midstream, LPHardin County NGL Fractionation Plant
Hardin County, TXDCP Midstream, LP
Jefferson County NGL Fractionation PlantJefferson County, TX
981,191 tpy CO2e980,229 tpy CO2
18.49 tpy CH41.85 tpy N2O
Freeport LNG Development 562,141 tpy CO2Liquiefaction Plant 0.03 tpy CH4
Freeport, TX 1.06 tpy N2OGolden Spread Electric Cooperative, Inc. 532,007 tpy CO2
GSEC Floydada Station 124.97 tpy CH4Dallas, TX 13.3 tpy N2O
Golden Spread Electric Cooperative, Inc. 532,007 tpy CO2Antelope Station 124.97 tpy CH4Abernathy, Texas 13.3 tpy N2O
La Paloma Energy Center, LLC 1,299,423 tpy CO2La Paloma Energy Center 24.10 tpy CH4
Harlingen, TX 2.40 tpy N2O1,450,376 tpy CO2
26.80 tpy CH42.70 tpy N2O
1,640,737 tpy CO230.40 tpy CH43.00 tpy N2O
None proposed
Flow meter and CEMS
18 USEPA R6 N/A 1 GE 7F 5-Series 202 MW Efficient design
2 Siemens SGT6-5000F(4) 232 MW
Efficient designGood combustion practicesGood operating practices
Fuel selection
8,809
N/A 538,754 None proposed17 USEPA R6 N/A
227,840 227,840 tpy CO2e4 USEPA R6 PSDTX1290 4 GE LMS100 100El Paso Electric Company
Montana Power StationEl Paso, TX
1 GE 7F 5-Series 202 MW Efficient design
981,191
N/A 538,754
15 USEPA R6 N/AExelon Generation
Mountain Creek Steam Electric StationDallas, TX
Fuel quality monitoring
tpy CO2e None proposedMMBtu/hrGood combustion practices
Fueled by natural gasEfficient design
N/A 1,480,086 1,480,086 9 USEPA R3 08-00045A 2 N/A 2,890
N/A 295,961 295,961 tpy CO2e None proposed
lb/hr None proposed
8 USEPA R3 52375-002 2 Rolls Royce Trent 60 WLE 593 MMBtu/hr Combined cycle operation
N/A Combined cycle operation N/A N/A 281,727 7 USEPA R3 55-00001E 3 N/A N/A
N/A 954 lb/MWh None proposed
lb/MWh None proposed
6 USEPA R5 81-11 1 GE PG7121 130 MW Combined cycle operation
MW Combined cycle operation N/A N/A 774
tpy CO2e None proposed
1,328 lb/MWh
5 USEPA R9 SE 09-01 2 GE 7FA 154
MMBtu/hrSimple cycle operation
Good combustion practicesFueled by natural gas
N/A 4,872,107 4,872,107 3 USEPA R6 PSD-LA-703(M03) 2 GE LM2500+G4 286
lb/MWh None proposed
271 MW 7,720 1,642,317
Fuel monitoring or CEMS
265 MW 7,649 1,451,772
183 MW
Engergy Efficiency, Practices and Designs
7,528 1,300,674
Fuel monitoring or CEMS
19 USEPA R6 N/A 2
GE F7FA
87 MWEfficient design
Waste heat recoveryEvaporative cooling
N/A 562,69316 USEPA R6 N/A 1 GE Frame 7EA
Siemens SGT6-5000F(4)
Siemens SGT6-5000F(5)
24,610 tpy CO2e None proposed43 MMBtu/hrEfficient design
Waste heat recoveryProcess monitoring
N/A 24,61014 USEPA R6 N/A 2 Solar Saturn T-4700
MMBtu/hrEfficient design
Waste heat recoveryProcess monitoring
N/A13 USEPA R6 N/A 2 Solar Saturn T-4700 43
Efficient designWaste heat recoveryProcess monitoring
N/A 58,672 1.16ton CO2e/MMscf
compressed
tpy CO2e None proposed24,610 24,610
12 USEPA R6 N/A 2 Solar Mars 100 15,000 hp
N/A N/A 7,730 Btu/kWh (HHV) N/A11 USEPA R6 N/A 1 Siemens 501FCombined cycle operation
Efficient designProcess monitoring
monitoringAFR monitoring
Quarterly source test
7,730 Btu/kWh (HHV) N/A208 MW
Combined cycle operationEfficient design
Evaporative coolingSteam turbine bypass
N/A N/A10 USEPA R6 N/A 3 GE 7FA
MMBtu/hrSimple cycle operation
Post combustion controlsFuel selection
N/A2 USEPA R3 67-05009C 2 N/A 634
N/A
MW
Efficient designEvaporative cooling
Good operating practicesFuel selection
9,074
100 MW Simple cycle operation N/A N/A
N/A 1,330
BTU (HHV) per kW-hr (gross)
1 USEPA R9 SD 11-01 3 GE LMS100
Control TechnologyThermal Efficiency
PTE Proposed BACT LimitsMonitoringNo. Permit Authority Permit Number #
Unit DescriptionCapacity
None proposed
ERMTexas Registered Engineering Firm F-2393 Page 1 of 4
0189555\A5469 App C Tenaska RBLC.xlsx

Table C-2TRPP
Tenaska Roans Prairie Generating StationGrimes County, TX
Recently Issued Permits and Applications Under Review for Greenhouse Gases from Fugitive Sources
RBLC ID Facility Name Permit Issuance Date Process Name Pollutant Control Method Description Emission Limit Emission Limit UnitEmission Limit Average Time Condition
NA NA Fugitive Emissions Carbon Dioxide Equivalent (CO2e) AVO Program 94 tons/yr NA
TX-0612THOMAS C. FERGUSON POWER PLANT 11/10/2011
Fugitive Natural Gas emissions_NG-FUG Carbon Dioxide Equivalent (CO2e) None 327.2 tons/yr 365 day rolling average
LA-0257 SABINE PASS LNG TERMINAL 12/6/2011 FUGITIVE EMISSIONS Carbon Dioxide Equivalent (CO2e)CONDUCT A LEAK DETECTION AND REPAIR (LDAR) PROGRAM 89,629 TONS/YR ANNUAL MAXIMUM
ERMTexas Registered Engineering Firm F-2393 Page 2 of 4
0189555\A5469 App C Tenaska RBLC.xlsx

Table C-3TRPP
Tenaska Roans Prairie Generating StationGrimes County, TX
Recently Issued Permits and Applications Under Review for Greenhouse Gases from Emergency Generators
RBLC ID Facility Name Permit Issuance Date Process Name Pollutant Control Method Description Emission Limit Emission Limit Unit Emission Limit Average Time Condition
*IA-0105 IOWA FERTILIZER COMPANY 10/26/2012 EMERGENCY GENERATOR Carbon DioxideGOOD COMBUSTION PRACTICES 1.55 G/KW-H AVERAGE OF 3 STACK TEST RUNS
*IA-0105 IOWA FERTILIZER COMPANY 10/26/2012 FIRE PUMP Carbon DioxideGOOD COMBUSTION PRACTICES 1.55 G/KW-H AVERAGE OF 3 STACK TEST RUNS
*VA-0319GATEWAY COGENERATION 1, LLC - SMART WATER PROJECT 8/27/2012 FIRE WATER PUMP Carbon Dioxide Equivalent (CO2e) FUEL-EFFICIENT DESIGN 30.5 T/YR 12 MO ROLLING AVG
*IA-0105 IOWA FERTILIZER COMPANY 10/26/2012 FIRE PUMP Carbon Dioxide Equivalent (CO2e)GOOD COMBUSTION PRACTICES 91 TONS/YR ROLLING 12 MONTH TOTAL
GA-0147 PYRAMAX CERAMICS, LLC - KING'S M:U FACILITY 1/27/2012500 KW EMERGENCY DIESEL GENERATORS Carbon Dioxide Equivalent (CO2e) 153 T/12-MO ROLLING AVG COMBINED EMISSIONS
*IA-0105 IOWA FERTILIZER COMPANY 10/26/2012 EMERGENCY GENERATOR Carbon Dioxide Equivalent (CO2e)GOOD COMBUSTION PRACTICES 788.5 TONS/YR ROLLING 12 MONTH TOTAL
ERMTexas Registered Engineering Firm F-2393 Page 3 of 4
0189555\A5469 App C Tenaska RBLC.xlsx
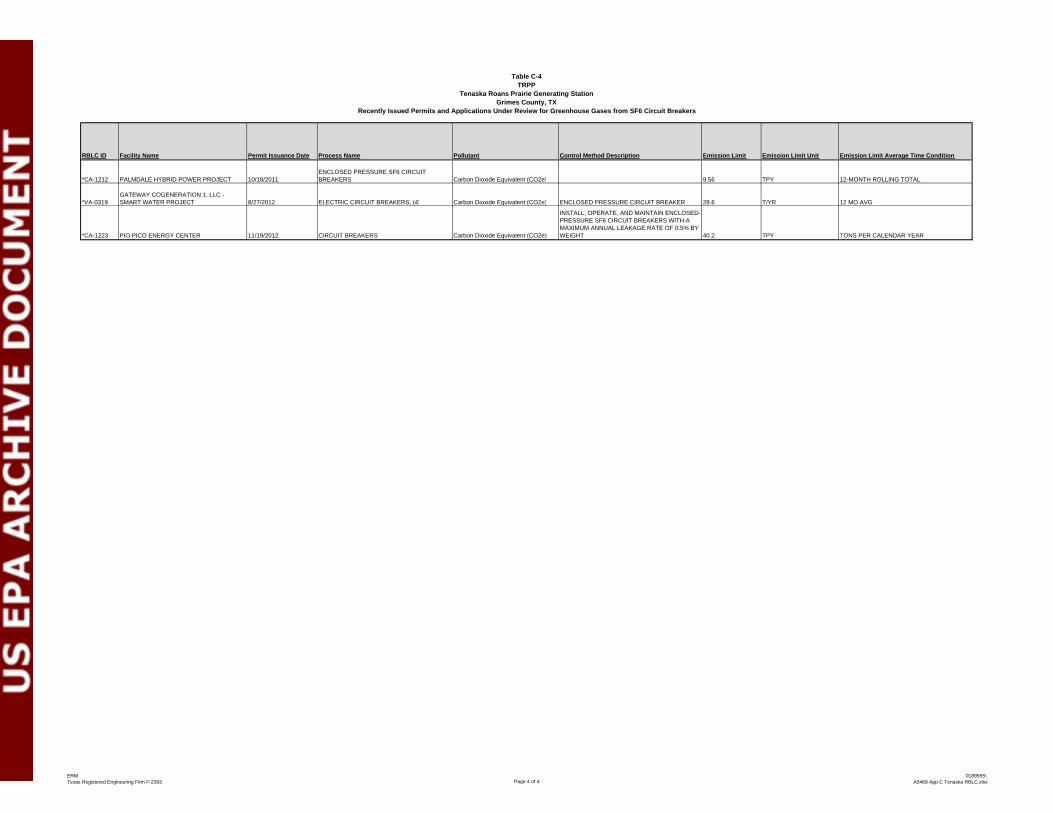
Table C-4TRPP
Tenaska Roans Prairie Generating StationGrimes County, TX
Recently Issued Permits and Applications Under Review for Greenhouse Gases from SF6 Circuit Breakers
RBLC ID Facility Name Permit Issuance Date Process Name Pollutant Control Method Description Emission Limit Emission Limit Unit Emission Limit Average Time Condition
*CA-1212 PALMDALE HYBRID POWER PROJECT 10/18/2011ENCLOSED PRESSURE SF6 CIRCUIT BREAKERS Carbon Dioxide Equivalent (CO2e) 9.56 TPY 12-MONTH ROLLING TOTAL
*VA-0319GATEWAY COGENERATION 1, LLC - SMART WATER PROJECT 8/27/2012 ELECTRIC CIRCUIT BREAKERS, (4) Carbon Dioxide Equivalent (CO2e) ENCLOSED PRESSURE CIRCUIT BREAKER. 28.6 T/YR 12 MO AVG
*CA-1223 PIO PICO ENERGY CENTER 11/19/2012 CIRCUIT BREAKERS Carbon Dioxide Equivalent (CO2e)
INSTALL, OPERATE, AND MAINTAIN ENCLOSED-PRESSURE SF6 CIRCUIT BREAKERS WITH A MAXIMUM ANNUAL LEAKAGE RATE OF 0.5% BY WEIGHT 40.2 TPY TONS PER CALENDAR YEAR
ERMTexas Registered Engineering Firm F-2393 Page 4 of 4
0189555\A5469 App C Tenaska RBLC.xlsx

Supporting Documentation Appendix D
July 2013
Project No. 0189555
Environmental Resources Management 15810 Park Ten Place, Suite 300
Houston, Texas 77084 (281) 600-1000

Siemens
SGT6‐5000F 7FA.05 7FA.04
Full Load New and Clean Output at Summer Design Condition ‐‐ per Turbine
(MW) 231.1 204.5 168.7
Full Load New and Clean Output at Summer Design Condition‐‐ Plant (3 turbines)
(MW) 693.4 613.5 506.1
Full Load New and Clean Heat Rate at Summer Design Condition
(Btu/kWh HHV) 10,053 9,972 10,144
Assumed Percentage at Full Load Operation (%) 85% 85% 85%(MW) 93.0 91.5 93.2
(% of Full Load) 40% 45% 55%Min Load New and Clean Heat Rate at Summer Design Condition
(Btu/kWh HHV) 13,432 13,548 12,526
Assumed Percentage at Min Load Operation (%) 15% 15% 15%Blended Permitting Heat Rate (Btu/kWh HHV) 10,560 10,509 10,502CO2 Fuel Intensity (lb/MMBtu HHV) 119.5 119.5 119.5Blended New and Clean CO2 Emission Rate at Summer Conditions
(lb/MWh) 1,262 1,256 1,255
Degradation Margin (%) 6% 6% 6%Commercial Margin (%) 2% 2% 2%Blended Margined CO2 Emission rate for permitting
(lb/MWh) 1,363 1,356 1,355
Gas TurbinesGE
Min Load Definition
Parameter Units
TRPP Grimes County Peaking Unit
Grimes County, Texas Turbine Efficiency with Conventional Start
ERM Texas Registerd Engineering Firm F-2393
Page 1 of 11 0189555\ A5469 D.1 CO2 Efficiency LImit Calcs.pdf

Total Estimated Simple Cycle Startup and Shutdown Emissions and Fuel UseSGT6-5000F(5)ee ULN on Natural Gas @ 59 °F
~ Time(minutes) NOX CO CO2 SO2 SO3 VOC UHC PM Fuel Use
Total - GT Ignition to 100% GT Load 22.3 38.6 482 50,889 0.26 0.03 53.6 107.2 2.8 19,034 Total - 100% GT Load to Fuel Cut Off 17.3 36.5 364 48,679 0.25 0.03 40.2 80.3 2.4 18,143 Total - GT Ignition to 100% GT Load 12.7 18.4 280 23,954 0.13 0.02 31.4 62.7 1.4 8,995 Total - 100% GT Load to Fuel Cut Off 7.7 16.3 163 21,743 0.11 0.01 17.9 35.9 1.1 8,104
General Notes1.) All data is ESTIMATED, NOT guaranteed and is for ONE unit.
2.) Gas fuel must be in compliance with Siemens fuel specifications.
3.) Emissions are at the exhaust stack outlet and exclude ambient air contributions.
4.) Emissions are based on new and clean conditions.
5.) Gas fuel composition is 98% CH4, 0.6% C2H6, 1.4% N2 and 0.2 gr S/100 scf.
6.) NOX as NO2.
7.) VOC consist of total hydrocarbons excluding methane and ethane. VOC and UHC are expressed in terms of methane (CH 4).
8.) Particulates are per US EPA Method 5/202 (front and back half).
9.) Estimated fuel use data is based on a heating value of ~23,140 Btu/lb m (HHV) and will be different for different heating values.
10.) Please be advised that the information contained in this transmittal has been prepared and is being transmitted per customer request
specifically for information purposes only. Data to be included in any permit application or Environmental Impact Statement are
strictly the customer's responsibility. Siemens is available to review these documents upon request.
Startup Emissions Notes
1.) Estimated startup (SU) data are from gas turbine (GT) ignition through 100% load.
2.) Estimated SU and shutdown (SD) data are based on the assumed times noted above and will be higher for longer times.
3.) Estimated SU and SD data are based on the ambient temperature noted above and will be higher at lower ambient temperatures.
4.) Total SU time includes 5 minutes from turning gear to synchronization.
5.) SD assumes 100% load to FSNL with no cooldown at FSNL.
6.) Continuous Emissions Monitoring System (CEMS) may calculate emissions differently.
7.) Operator actions do not extend startup or shutdown.
8.) It is assumed that there is no restriction from the interconnected utility for loading the GT from synchronization to 100% load within the SU times considered.
30Gas
ModeTotal Pounds per Event
Fuel Ramp Rate (MW/min)
13.4
Siemens Energy, Inc. 2/14/2013 Proprietary Information
TRPP Grimes County Peaking Unit
Grimes County, Texas Siemens SUSD Information
ERM Texas Registerd Engineering Firm F-2393
Page 2 of 11 0189555\ A5469 D.1 CO2 Efficiency LImit Calcs.pdf

Grimes County Based on 20130130_Grimes_Co_CDS_R2 (0.5 gr S per 100 SCF)
Estimated SGT6-5000F(5ee) Gas Turbine Performance February 1, 2013
Gas Turbine in Combined Cycle / Ultra Low NOx Combustor
SGen6-1000A(104/55) Static / 0.85 Power Factor
SITE CONDITIONS: CASE 1 CASE 2 CASE 3 CASE 4 CASE 5 CASE 6 CASE 7 CASE 8 CASE 9 CASE 10 CASE 11 CASE 12 CASE 13 CASE 14 CASE 15 CASE 16 CASE 18 CASE 19 CASE 20 CASE 21 CASE 22 CASE 23 CASE 24 CASE 25 CASE 26 CASE 27 CASE 28 CASE 29 CASE 30 CASE 31 CASE 32
FUEL TYPE Nat. Gas Nat. Gas Nat. Gas Nat. Gas Nat. Gas Nat. Gas Nat. Gas Nat. Gas Nat. Gas Nat. Gas Nat. Gas Nat. Gas Nat. Gas Nat. Gas Nat. Gas Nat. Gas Nat. Gas Nat. Gas Nat. Gas Nat. Gas Nat. Gas Nat. Gas Nat. Gas Nat. Gas Nat. Gas Nat. Gas Nat. Gas Nat. Gas Nat. Gas Nat. Gas Nat. Gas
LOAD LEVEL Max 75% Min Max 75% Min Max 75% Min Max 75% Min Max 75% Min Max 75% Min BASE BASE 75% Min BASE BASE 75% Min BASE BASE 75% Min BASE
NET FUEL HEATING VALUE, Btu/lbm (LHV) 20,358 20,358 20,358 20,358 20,358 20,358 20,358 20,358 20,358 20,358 20,358 20,358 20,358 20,358 20,358 20,358 20,358 20,358 20,358 20,358 20,358 20,358 20,358 20,358 20,358 20,358 20,358 20,358 20,358 20,358 20,358
GROSS FUEL HEATING VALUE, Btu/lbm (HHV) 22,595 22,595 22,595 22,595 22,595 22,595 22,595 22,595 22,595 22,595 22,595 22,595 22,595 22,595 22,595 22,595 22,595 22,595 22,595 22,595 22,595 22,595 22,595 22,595 22,595 22,595 22,595 22,595 22,595 22,595 22,595
AMBIENT DRY BULB TEMPERATURE, °F 7.0 7.0 7.0 29.0 29.0 29.0 40.0 40.0 40.0 56.0 56.0 56.0 69.0 69.0 69.0 69.0 82.0 82.0 82.0 90.0 90.0 90.0 90.0 98.0 98.0 98.0 98.0 109.0 109.0 109.0 109.0
AMBIENT WET BULB TEMPERATURE, °F 5.0 5.0 5.0 24.0 24.0 24.0 37.0 37.0 37.0 51.0 51.0 51.0 63.0 63.0 63.0 63.0 75.0 75.0 75.0 80.0 80.0 80.0 80.0 78.0 78.0 78.0 78.0 76.0 76.0 76.0 76.0
AMBIENT RELATIVE HUMIDITY, % 53 53 53 46 46 46 76 76 76 72 72 72 72 72 72 72 73 73 73 65 65 65 65 42 42 42 42 22 22 22 22
AMBIENT PRESSURE, psia 14.511 14.511 14.511 14.511 14.511 14.511 14.511 14.511 14.511 14.511 14.511 14.511 14.511 14.511 14.511 14.511 14.511 14.511 14.511 14.511 14.511 14.511 14.511 14.511 14.511 14.511 14.511 14.511 14.511 14.511 14.511
COMPRESSOR INLET TEMPERATURE, °F 7.0 7.0 7.0 29.0 29.0 29.0 40.0 40.0 40.0 56.0 56.0 56.0 69.0 69.0 69.0 63.6 82.0 82.0 75.7 90.0 90.0 90.0 81.0 98.0 98.0 98.0 80.0 109.0 109.0 109.0 79.3
EVAPORATIVE COOLER STATUS / EFFECTIVENESS, % OFF OFF OFF OFF OFF OFF OFF OFF OFF OFF OFF OFF OFF OFF OFF 90 OFF OFF 90 OFF OFF OFF 90 OFF OFF OFF 90 OFF OFF OFF 90
INLET PRESSURE LOSS, in. H2O (Total) 3.4 2.6 1.5 3.7 2.7 1.6 3.8 2.7 1.6 4.1 2.8 1.6 4.5 2.9 1.6 4.3 2.8 1.7 4.5 4.2 2.7 1.7 4.4 4.1 2.6 1.7 4.4 3.9 2.6 1.7 4.4
EXHAUST PRESSURE LOSS, in. H2O (Total) 10.9 8.2 4.8 11.2 8.2 4.8 11.3 8.2 4.8 11.7 8.3 4.8 12.4 8.3 4.7 12.0 7.9 4.7 12.2 11.3 7.6 4.7 11.8 10.8 7.4 4.7 11.9 10.2 7.0 4.8 11.9
EXHAUST PRESSURE LOSS, in. H2O (Static) 5.1 3.8 2.3 5.2 3.8 2.3 5.2 3.8 2.2 5.3 3.8 2.2 5.6 3.8 2.2 5.4 3.6 2.2 5.5 5.0 3.5 2.2 5.3 4.8 3.4 2.2 5.3 4.6 3.2 2.2 5.4
GAS TURBINE PERFORMANCE:
GROSS POWER OUTPUT, kW 231,183 173,072 93,000 231,162 173,072 93,000 231,167 173,072 93,000 231,176 173,072 93,000 231,146 173,072 93,000 231,186 164,181 93,000 225,036 211,649 158,389 93,000 220,453 203,538 152,292 93,000 221,311 191,721 143,410 93,000 221,876
GROSS EFFICIENCY, % (LHV) 38.70 35.42 27.97 38.60 35.45 28.09 38.59 35.44 28.13 38.30 35.38 28.18 37.65 35.27 28.19 38.02 34.85 28.17 37.36 36.94 34.40 28.15 37.21 36.64 33.99 28.17 37.25 36.03 33.32 28.18 37.28
GROSS HEAT RATE, Btu/kWh (LHV) 8,810 9,627 12,193 8,834 9,619 12,140 8,836 9,623 12,121 8,902 9,639 12,102 9,058 9,668 12,096 8,968 9,785 12,106 9,126 9,231 9,912 12,115 9,163 9,308 10,033 12,106 9,154 9,464 10,234 12,102 9,147
GROSS HEAT RATE, Btu/kWh (HHV) 9,778 10,685 13,533 9,805 10,676 13,474 9,807 10,680 13,453 9,881 10,698 13,432 10,053 10,730 13,425 9,954 10,861 13,436 10,129 10,245 11,001 13,447 10,170 10,331 11,135 13,437 10,160 10,504 11,359 13,432 10,152
FUEL FLOW, lbm/hr 100,047 81,844 55,702 100,314 81,776 55,458 100,332 81,809 55,371 101,095 81,944 55,285 102,846 82,192 55,258 101,843 78,918 55,303 100,884 95,970 77,117 55,346 99,225 93,059 75,053 55,305 99,511 89,128 72,094 55,284 99,688
HEAT INPUT, MMBtu/hr (LHV) 2,037 1,666 1,134 2,042 1,665 1,129 2,043 1,665 1,127 2,058 1,668 1,125 2,094 1,673 1,125 2,073 1,607 1,126 2,054 1,954 1,570 1,127 2,020 1,894 1,528 1,126 2,026 1,814 1,468 1,125 2,029
HEAT INPUT, MMBtu/hr (HHV) 2,261 1,849 1,259 2,267 1,848 1,253 2,267 1,848 1,251 2,284 1,852 1,249 2,324 1,857 1,249 2,301 1,783 1,250 2,279 2,168 1,742 1,251 2,242 2,103 1,696 1,250 2,248 2,014 1,629 1,249 2,252
EXHAUST TEMPERATURE, °F 1,094 1,094 1,094 1,099 1,109 1,109 1,099 1,116 1,116 1,101 1,131 1,131 1,103 1,144 1,144 1,104 1,158 1,158 1,110 1,119 1,167 1,167 1,114 1,124 1,173 1,173 1,113 1,134 1,181 1,181 1,112
EXHAUST FLOW, lbm/hr 4,180,601 3,603,102 2,752,231 4,244,691 3,604,518 2,739,599 4,272,126 3,603,609 2,734,021 4,360,948 3,592,197 2,714,084 4,502,328 3,583,415 2,695,315 4,404,739 3,469,427 2,676,113 4,436,831 4,252,828 3,398,113 2,665,862 4,360,546 4,164,423 3,340,532 2,671,131 4,379,379 4,038,582 3,257,466 2,681,169 4,394,213
EXHAUST GAS COMPOSITION (% BY VOLUME):
OXYGEN 12.10 12.54 13.43 12.18 12.52 13.41 12.17 12.45 13.33 12.20 12.33 13.21 12.21 12.17 13.05 12.08 12.01 12.82 11.98 12.01 11.96 12.71 11.89 12.19 12.14 12.83 11.94 12.40 12.38 12.98 12.00
CARBON DIOXIDE 4.10 3.90 3.49 4.05 3.90 3.49 4.02 3.89 3.48 3.96 3.90 3.50 3.90 3.92 3.51 3.94 3.90 3.53 3.89 3.86 3.88 3.54 3.89 3.83 3.86 3.53 3.89 3.80 3.81 3.53 3.88
WATER 8.03 7.63 6.83 8.07 7.76 6.97 8.39 8.14 7.34 8.72 8.60 7.81 9.22 9.26 8.48 9.49 10.16 9.44 10.36 10.50 10.54 9.87 10.86 9.88 9.93 9.31 10.60 9.16 9.19 8.65 10.35
NITROGEN 74.87 75.03 75.35 74.80 74.92 75.24 74.53 74.63 74.94 74.23 74.28 74.58 73.79 73.77 74.08 73.61 73.06 73.34 72.89 72.76 72.75 73.01 72.50 73.22 73.20 73.45 72.70 73.76 73.75 73.96 72.89
ARGON 0.90 0.90 0.90 0.89 0.90 0.90 0.89 0.89 0.90 0.89 0.89 0.89 0.88 0.88 0.89 0.88 0.87 0.88 0.87 0.87 0.87 0.87 0.87 0.88 0.88 0.88 0.87 0.88 0.88 0.88 0.87
MOLECULAR WEIGHT 28.46 28.48 28.53 28.45 28.47 28.52 28.41 28.43 28.47 28.37 28.38 28.42 28.31 28.30 28.35 28.28 28.20 28.25 28.18 28.16 28.16 28.20 28.13 28.23 28.23 28.26 28.15 28.30 28.30 28.34 28.18
NET EMISSIONS (Based on USEPA test methods):
NOx, ppmvd @ 15% O2 9 9 9 9 9 9 9 9 9 9 9 9 9 9 9 9 9 9 9 9 9 9 9 9 9 9 9 9 9 9 9
NOx, lbm/hr as NO2 75.7 61.9 42.1 75.8 61.8 41.9 75.9 61.9 41.9 76.4 62.0 41.8 77.7 62.2 41.8 77.0 60.2 41.8 76.9 73.1 58.8 41.9 75.6 70.9 57.2 41.8 75.8 67.9 54.9 41.8 75.9
CO, ppmvd @ 15% O2 4 4 9 4 4 9 4 4 9 4 4 9 4 4 9 4 4 9 4 4 4 9 4 4 4 9 4 4 4 9 4
CO, lbm/hr 20.5 16.7 25.6 20.5 16.7 25.5 20.5 16.7 25.5 20.7 16.8 25.4 21.0 16.8 25.4 20.8 16.3 25.5 20.8 19.8 15.9 25.5 20.5 19.2 15.5 25.5 20.5 18.4 14.9 25.5 20.5
VOC, ppmvd @ 15% O2 1 1 1 1 1 1 1 1 1 1 1 1 1 1 1 1 1 1 1 1 1 1 1 1 1 1 1 1 1 1 1
VOC, lbm/hr as CH4 2.9 2.4 1.6 2.9 2.4 1.6 2.9 2.4 1.6 3.0 2.4 1.6 3.0 2.4 1.6 3.0 2.3 1.6 3.0 2.8 2.3 1.6 2.9 2.7 2.2 1.6 2.9 2.6 2.1 1.6 2.9
UHC, ppmvd @ 15% O2 2 2 2 2 2 2 2 2 2 2 2 2 2 2 2 2 2 2 2 2 2 2 2 2 2 2 2 2 2 2 2
UHC, lbm/hr as CH4 5.9 4.8 3.3 5.9 4.8 3.2 5.9 4.8 3.2 5.9 4.8 3.2 6.0 4.8 3.2 6.0 4.7 3.2 6.0 5.7 4.6 3.2 5.9 5.5 4.4 3.2 5.9 5.3 4.3 3.2 5.9
SO2, lbm/hr 3.4 2.7 1.9 3.4 2.7 1.9 3.4 2.7 1.9 3.4 2.7 1.9 3.4 2.8 1.9 3.4 2.6 1.9 3.4 3.2 2.6 1.9 3.3 3.1 2.5 1.9 3.3 3.0 2.4 1.9 3.3
SO3, lbm/hr 0.4 0.3 0.2 0.4 0.3 0.2 0.4 0.3 0.2 0.4 0.3 0.2 0.4 0.3 0.2 0.4 0.3 0.2 0.4 0.4 0.3 0.2 0.4 0.4 0.3 0.2 0.4 0.4 0.3 0.2 0.4
H2SO4, lbm/hr 0.6 0.5 0.3 0.6 0.5 0.3 0.6 0.5 0.3 0.6 0.5 0.3 0.6 0.5 0.3 0.6 0.4 0.3 0.6 0.5 0.4 0.3 0.5 0.5 0.4 0.3 0.5 0.5 0.4 0.3 0.6
PARTICULATES, lbm/hr 8.7 8.0 8.0 8.9 8.0 8.0 8.9 8.0 8.0 9.1 8.0 8.0 9.3 8.0 8.0 9.1 8.0 8.0 9.1 8.7 8.0 8.0 8.9 8.6 8.0 8.0 9.0 8.4 8.0 8.0 9.0
NOTES:
► Performance is based on new and clean condition. All data is estimated and not guaranteed.
► Gross power output is at the generator terminals, minus excitation losses. It does not include SGT-PAC™ auxiliary load losses.
► Estimated GT Performance values are dependent upon receiving test tolerances equal to measurement uncertainty calculated in accordance with ASME PTC 19.1-2005.
► IGV schedule may be adjusted during commissioning. Part load performance will be adjusted accordingly.
► Maximum coupling power is 235,000 kW. Maximum exhaust temperature is 1,200°F for base load and part load.
► Fuel gas composition, by moles, is: 96.194% CH4, 1.317% C2H6, 0.222% C3H8, 0.062% i-C4H10, 0.051% n-C4H10, 0.028% i-C5H12, 0.013% n-C5H12, 0.013% n-C7H16, 0.006% n-C8H18, 0.326% N2, 1.767% CO2, and 0.5 grains Sulfur per 100 SCF.
► Gas fuel must be in compliance with the SIEMENS Gas Fuel Spec (ZDX555-DC01-MBP-2500-01).
► Average temperature of the gas fuel is 60°F. Sensible Heat of the fuel is not included in the calculated Heat Input values.
► VOC emissions consist of total hydrocarbons excluding methane and ethane and are expressed in terms of methane.
► Particulates are per US EPA Method 5/202 (front and back half).
► Performance is based on fast start option.
► The anti-icing system may be in operation at cold ambient in order to maintain emission compliance. The performance data are provided WITHOUT considering the anti-icing system in operation.
► With any anti-icing system in operation, GT output and efficiency will be lower than what is shown.
► Low Load CO (LLCO) Hardware is in operation for Minimum Load cases.
► Emissions exclude ambient air contributions and are for steady-state conditions.
► Please be advised that the information contained in this transmittal has been prepared and is being transmitted per customer request specifically for information purposes only.
Data included in any permit application or Environmental Impact Statement are strictly the customer's responsibility. Siemens is available to review permit application data upon request.
Siemens Energy, Inc. Page 1 of 1 Proprietary Information
TRPP Grimes County Peaking Unit
Grimes County, Texas Simenes Normal Operation Information
ERM Texas Registerd Engineering Firm F-2393
Page 3 of 11 0189555\ A5469 D.1 CO2 Efficiency LImit Calcs.pdf

UNLESS OTHERWISE SPECIFIED SIGNATURES DATE GENERAL ELECTRIC COMPANY DIMENSIONS ARE IN INCHES TOLERANCES ON:
DRAWN
Daniel R Tegel 09/06/25 g GE ENERGY
2 PL DECIMALS + CHECKED Jason Terry 09/06/25 GREENVILLE, SC
3 PL DECIMALS + ENGRG
Daniel R Tegel 09/06/25 7FA.05 Simple/Combined Cycle – Gas –
GT Conventional Start ANGLES +
ISSUED
Michael E. Wyatt 09/06/29 FRACTIONS +
QA
FIRST MADE FOR: ML- GN0018 ML APPLIED PRACTICES SIZE CAGE CODE DWG NO
A 329A5370 SIM TO: NONE SCALE SHEET 1
DT - 1N
SIZE DWG NO SH REV
A 329A5370 1 I
THIRD ANGLE PROJECTION
REVISIONS REV DESCRIPTION DATE APPROV
ED A Startup Emissions Included
Updated GT Cycle 09/07/17 DRT
JCT B Added Fuel Burn, MW*hrs, Shutdown
Updated Tex to HRSG 09/11/06 DRT
JCT C Updated with Mode6.2 Emissions 10/06/10 DRT
JCT D
E
F G H I
Updated with 7FA05_0910 GTP Performance Updated with 7FA05_0810 GTP Performance Updated with Mode 6.3R,6.3L, and Mode3 accel Emissions Notes Update, Accel UHC Update Emissions Updated per TG5B Accel/Decel emissions update Renamed from Traditional to Conventional Start Updated Emissions from Factory Test (TS7)
11/01/07
08/31/2011
09/23/2011 3/15/2012 4/27/2012
5/2/2013
DRT
DRT
DRT DRT DRT
AJF
© COPYRIGHT 2012 GENERAL ELECTRIC COMPANY PROPRIETARY INFORMATION - THIS DOCUMENT CONTAINS PROPRIETARY INFORMATION OF GENERAL ELECTRIC COMPANY AND MAY NOT BE USED OR DISCLOSED TO OTHERS, EXCEPT WITH THE WRITTEN PERMISSION OF GENERAL ELECTRIC COMPANY.
REV STATUS OF SHEETS SH REV SH REV 1 I 2 I 3 I
ITEM DESCRIPTION DWG. NO. LIST OF COMPLEMENTARY DOCUMENTS
Notes: 1. Approved for External use 2. These estimates are for reference only and are not guaranteed. 3. Reference: EED GTT-7FA.05-1011 4. This start profile does not account for BOP /ST driven delays, such as Steam Temperature Matching or fuel heating 5. Fuel: 100% Methane (LHV = 21515 BTU/lbm) 6. Values contained within reflect 99 percentile of fleet projections 7. Blank 8. If emissions commitments are being made, appropriate margin should be added to reflect plant operational variation and measurement uncertainty 9. These projections reflect emissions at the GT exit 10. VOC defined as Non-methane organic compound, and is assumed as 0.2x of UHC. Conversion from VOC concentration to lbm/event assumes molecular weight of 16. 8.
TRPP Grimes County Peaking Unit
Grimes County, Texas GE Start-up Information
ERM Texas Registerd Engineering Firm F-2393
Page 4 of 11 0189555\ A5469 D.1 CO2 Efficiency LImit Calcs.pdf

GENERAL ELECTRIC COMPANY SIZE CAGE CODE DWG NO
g GE ENERGY GREENVILLE, SC A 329A5370
DRAWN Daniel R Tegel ISSUED Michael E. Wyatt SCALE SHEET 2
© COPYRIGHT 2012 GENERAL ELECTRIC COMPANY PROPRIETARY INFORMATION - THIS DOCUMENT CONTAINS PROPRIETARY INFORMATION OF GENERAL ELECTRIC COMPANY AND MAY NOT BE USED OR DISCLOSED TO OTHERS, EXCEPT WITH THE WRITTEN PERMISSION OF GENERAL ELECTRIC COMPANY.
SIZE DWG NO SH REV
A 329A5370 2 I
-20F Ambient Temp Mol Weight Units TG to FSNL TG to 50% BL TG to 100% BL
NOx 46.01 lbm/event 7.5 27 34 CO 28.01 lbm/event 67 194 198 UHC 16.04 lbm/event 40 74 75 VOC 16.04 lbm/event 8.1 15 15 Fuel Flow -- MMBTU/event 30 123 292 Output -- MW*hrs 0 5.9 23
20F Ambient Temp Mol Weight Units TG to FSNL TG to 50% BL TG to 100% BL
NOx 46.01 lbm/event 8.0 23 29 CO 28.01 lbm/event 66 158 161 UHC 16.04 lbm/event 38 61 63 VOC 16.04 lbm/event 7.6 12 13 Fuel Flow -- MMBTU/event 29 124 293 Output -- MW*hrs 0 6.1 24
59F Ambient Temp Mol Weight Units TG to FSNL TG to 50% BL TG to 100% BL
NOx 46.01 lbm/event 8.4 22 28 CO 28.01 lbm/event 65 140 143 UHC 16.04 lbm/event 35 52 53 VOC 16.04 lbm/event 7.1 10 11 Fuel Flow -- MMBTU/event 27 113 265 Output -- MW*hrs 0 5.5 22
100F Ambient Temp Mol Weight Units TG to FSNL TG to 50% BL TG to 100% BL
NOx 46.01 lbm/event 8.4 20 24 CO 28.01 lbm/event 63 108 110 UHC 16.04 lbm/event 33 45 46 VOC 16.04 lbm/event 6.7 9 9 Fuel Flow -- MMBTU/event 26 98 222 Output -- MW*hrs 0 4.3 17
120F Ambient Temp Mol Weight Units TG to FSNL TG to 50% BL TG to 100% BL
NOx 46.01 lbm/event 8.5 20 24 CO 28.01 lbm/event 63 99 101 UHC 16.04 lbm/event 32 43 44 VOC 16.04 lbm/event 6.5 9 9 Fuel Flow -- MMBTU/event 24 88 196 Output -- MW*hrs 0 3.6 14
TG = Turning GearFSNL = Full Speed No LoadBL = BaseloadMol Weight = Assumed Molecular WeightTG-FSNL does not include duration at FSNL
7FA.05 Simple/Combined Cycle - Gas - GT Conventional Start 12.5%/min accel rate / 17.8MW/min load rate (nominal)
TRPP Grimes County Peaking Unit
Grimes County, Texas GE Start-up Information
ERM Texas Registerd Engineering Firm F-2393
Page 5 of 11 0189555\ A5469 D.1 CO2 Efficiency LImit Calcs.pdf

7FA.04 Emissions Startup Summary
Traditional Startup Estimated Emissions
TG to FSNL TG to 50% TG to 100%
NOx lb/event 4.3 19 24
CO lb/event 49 178 183
UHC lb/event 9.7 55 56
VOC lb/event 4.0 13 13
Fuel MMBtu/event 20 95 246
Output MWh 0.0 5.2 21
*Ambient conditions for above are sea level, 59F/60%RH
Lightoff to FSNL mass (NOx, CO and UHC) from Combustion Quoting Limits dated Nov-12
IPS- Project 1 : - 7FA.04-1112 1 Version Code- 4.2.3c/347/7FA.04-1112
TRPP Grimes County Peaking Unit
Grimes County, Texas GE Start-Up Information
ERM Texas Registerd Engineering Firm F-2393
Page 6 of 11 0189555\ A5469 D.1 CO2 Efficiency LImit Calcs.pdf

UNLESS OTHERWISE SPECIFIED SIGNATURES DATE GENERAL ELECTRIC COMPANY DIMENSIONS ARE IN INCHES TOLERANCES ON:
DRAWN
Daniel R Tegel 09/11/06 g GE ENERGY
2 PL DECIMALS + CHECKED Jason Terry 09/11/06 GREENVILLE, SC
3 PL DECIMALS + ENGRG
Daniel R Tegel 09/11/06 7FA.05 Simple/Combined Cycle – Gas –
GT Conventional Shutdown ANGLES +
ISSUED
Dennis J. Varga 09/11/06 FRACTIONS +
QA
FIRST MADE FOR: ML- GN0018 ML APPLIED PRACTICES SIZE CAGE CODE DWG NO
A 329A5375 SIM TO: NONE SCALE SHEET 1
DT - 1N
SIZE DWG NO SH REV
A 329A5375 1 I
THIRD ANGLE PROJECTION
REVISIONS REV DESCRIPTION DATE APPROVED
-- Original issue 09/11/06 DRT JCT
A Updated with Mode6.2 Emissions 10/06/10 DRT JCT
B
C
D E F
G,H I
Updated with 7FA05-0910 GTP Performance Updated with 7FA05_0811 GTP performance Updated with Mode6.3R, 6.L, and Mode3 accel emissions Notes Update, Accel UHC update Emissions Updated per TG5B Accel/Decel Emissions Update Renamed from Traditional to Conventional Shutdown Not Used Updated Emissions from Factory Test (TS7)
11/01/06
08/31/2011
09/23/2011 03/15/2012 04/27/2012
05/03/2013
DRT
DRT
DRT DRT DRT
AJF
© COPYRIGHT 2012 GENERAL ELECTRIC COMPANY PROPRIETARY INFORMATION - THIS DOCUMENT CONTAINS PROPRIETARY INFORMATION OF GENERAL ELECTRIC COMPANY AND MAY NOT BE USED OR DISCLOSED TO OTHERS, EXCEPT WITH THE WRITTEN PERMISSION OF GENERAL ELECTRIC COMPANY.
REV STATUS OF SHEETS SH REV SH REV 1 I 2 I 3 I
ITEM DESCRIPTION DWG. NO. LIST OF COMPLEMENTARY DOCUMENTS
Notes: 1. Approved for External use 2. These estimates are for reference only and are not guaranteed, 3. Reference: EED GTT-7FA.05-1011 4. This shutdown profile does not account for BOP/ST driven delays such as Steam temperature matching or fuel heating 5. Fuel: 100% Methane (LHV = 21515 BTU/lbm) 6. Values contained within reflect 99 percentile of fleet projections 7. Blank 8. If emissions commitments are being made, appropriate margin should be added to reflect plant operational variation and measurement uncertainty 9. These projections reflect emissions at the GT exit 10. VOC defined as Non-methane organic compound, and is assumed as 0.2x of UHC. Conversion from VOC concentration to lbm/event assumes molecular weight of 16.
TRPP Grimes County Peaking Unit
Grimes County, Texas GE Shutdown Information
ERM Texas Registerd Engineering Firm F-2393
Page 7 of 11 0189555\ A5469 D.1 CO2 Efficiency LImit Calcs.pdf

GENERAL ELECTRIC COMPANY SIZE CAGE CODE DWG NO
g GE ENERGY GREENVILLE, SC A 329A5375
DRAWN Daniel R Tegel ISSUED Dennis J. Varga SCALE SHEET 2
© COPYRIGHT 2012 GENERAL ELECTRIC COMPANY PROPRIETARY INFORMATION - THIS DOCUMENT CONTAINS PROPRIETARY INFORMATION OF GENERAL ELECTRIC COMPANY AND MAY NOT BE USED OR DISCLOSED TO OTHERS, EXCEPT WITH THE WRITTEN PERMISSION OF GENERAL ELECTRIC COMPANY.
SIZE DWG NO SH REV
A 329A5375 2 I
-20F Ambient Temp Mol Weight Units FSNL to TG 50% BL to TG 100% BL to TG
NOx 46.01 lbm/event 4.1 21 28 CO 28.01 lbm/event 81 189 193 UHC 16.04 lbm/event 64 96 97 VOC 16.04 lbm/event 13 19 19 Fuel Flow -- MMBTU/event 12 98 267 Output -- MW*hrs 0 5.9 23
20F Ambient Temp Mol Weight Units FSNL to TG 50% BL to TG 100% BL to TG
NOx 46.01 lbm/event 4.2 17 23 CO 28.01 lbm/event 83 164 167 UHC 16.04 lbm/event 66 89 90 VOC 16.04 lbm/event 13 18 18 Fuel Flow -- MMBTU/event 12 100 269 Output -- MW*hrs 0 6.1 24
59F Ambient Temp Mol Weight Units FSNL to TG 50% BL to TG 100% BL to TG
NOx 46.01 lbm/event 4.2 16 21 CO 28.01 lbm/event 84 148 151 UHC 16.04 lbm/event 68 83 84 VOC 16.04 lbm/event 14 17 17 Fuel Flow -- MMBTU/event 12 91 243 Output -- MW*hrs 0 5.5 22
100F Ambient Temp Mol Weight Units FSNL to TG 50% BL to TG 100% BL to TG
NOx 46.01 lbm/event 4.2 14 18 CO 28.01 lbm/event 84 122 124 UHC 16.04 lbm/event 67 77 78 VOC 16.04 lbm/event 13 15 16 Fuel Flow -- MMBTU/event 12 78 203 Output -- MW*hrs 0 4.3 17
120F Ambient Temp Mol Weight Units FSNL to TG 50% BL to TG 100% BL to TG
NOx 46.01 lbm/event 4.2 14 17 CO 28.01 lbm/event 84 115 117 UHC 16.04 lbm/event 66 76 77 VOC 16.04 lbm/event 13 15 15 Fuel Flow -- MMBTU/event 12 70 177 Output -- MW*hrs 0 3.6 14
TG = Turning GearFSNL = Full Speed No LoadBL = BaseloadMol Weight = Assumed Molecular WeightFSNL-TG does not include duration at FSNL
7FA.05 Simple/Combined Cycle - Gas - GT Conventional Shutdown12.5%/min decel rate / 17.8MW/min unload rate (nominal)
TRPP Grimes County Peaking Unit
Grimes County, Texas GE Shutdown Information
ERM Texas Registerd Engineering Firm F-2393
Page 8 of 11 0189555\ A5469 D.1 CO2 Efficiency LImit Calcs.pdf
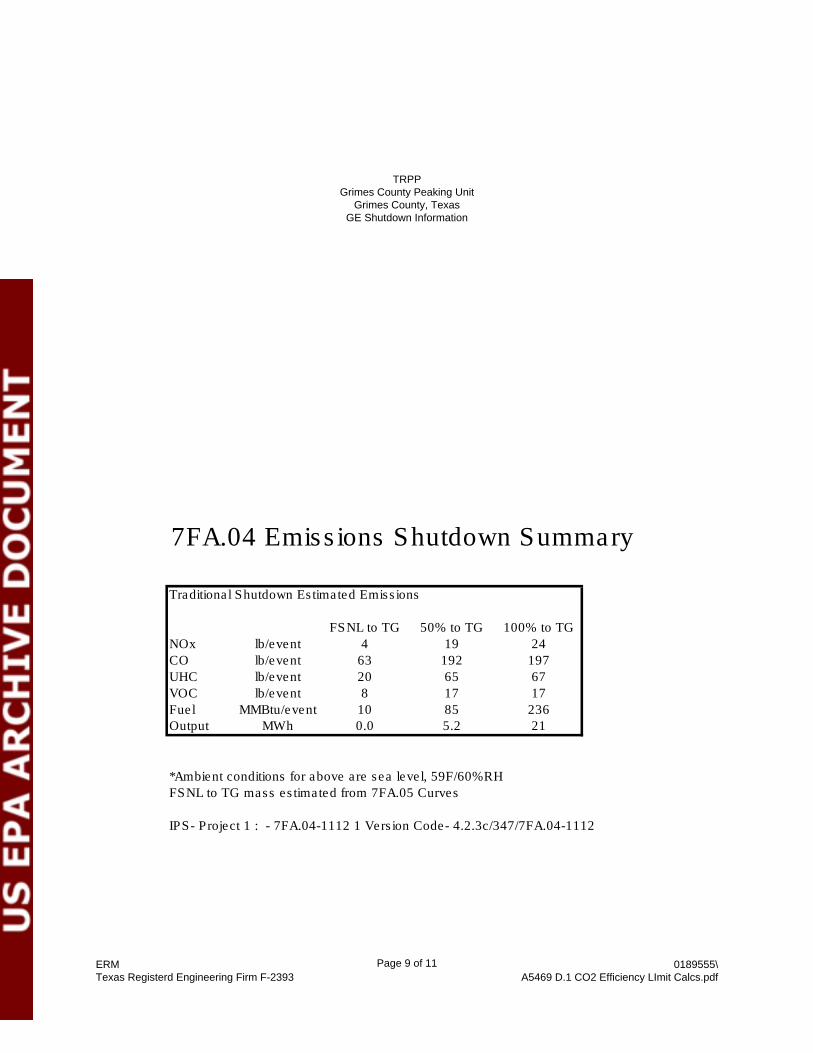
7FA.04 Emissions Shutdown Summary
Traditional Shutdown Estimated Emissions
FSNL to TG 50% to TG 100% to TG
NOx lb/event 4 19 24
CO lb/event 63 192 197
UHC lb/event 20 65 67
VOC lb/event 8 17 17
Fuel MMBtu/event 10 85 236
Output MWh 0.0 5.2 21
*Ambient conditions for above are sea level, 59F/60%RH
FSNL to TG mass estimated from 7FA.05 Curves
IPS- Project 1 : - 7FA.04-1112 1 Version Code- 4.2.3c/347/7FA.04-1112
TRPP Grimes County Peaking Unit
Grimes County, Texas GE Shutdown Information
ERM Texas Registerd Engineering Firm F-2393
Page 9 of 11 0189555\ A5469 D.1 CO2 Efficiency LImit Calcs.pdf

Tenaska - Grimes County ESTIMATED PERFORMANCE - 7FA.05 Load Condition BASE 75.0% 48.4% BASE 75.0% 45.5% BASE 75.0% 45.2% BASE 75.0% 45.8% BASE BASE 75.0% 46.2% BASE BASE 75.0% 46.7% BASE BASE 75.0% 47.3% BASE BASE 75.0% 47.9% BASE BASE 75.0% 49.3%Ambient Temperature °F 7.0 7.0 7.0 29.0 29.0 29.0 40.0 40.0 40.0 56.0 56.0 56.0 69.0 69.0 69.0 69.0 82.0 82.0 82.0 82.0 90.0 90.0 90.0 90.0 98.0 98.0 98.0 98.0 109.0 109.0 109.0 109.0Ambient Relative Humidity % 50.0 50.0 50.0 44.6 44.6 44.6 75.6 75.6 75.6 71.2 71.2 71.2 72.1 72.1 72.1 72.1 72.6 72.6 72.6 72.6 65.1 65.1 65.1 65.1 41.5 41.5 41.5 41.5 22.0 22.0 22.0 22.0Evap. Cooler Status Off Off Off Off Off Off Off Off Off Off Off Off On Off Off Off On Off Off Off On Off Off Off On Off Off Off On Off Off OffEvap. Cooler Effectiveness 85% 85% 85% 85% 85% Fuel Type Cust Gas Cust Gas Cust Gas Cust Gas Cust Gas Cust Gas Cust Gas Cust Gas Cust Gas Cust Gas Cust Gas Cust Gas Cust Gas Cust Gas Cust Gas Cust Gas Cust Gas Cust Gas Cust Gas Cust Gas Cust Gas Cust Gas Cust Gas Cust Gas Cust Gas Cust Gas Cust Gas Cust Gas Cust Gas Cust Gas Cust Gas Cust GasFuel LHV BTU/lb 20,349 20,349 20,349 20,349 20,349 20,349 20,349 20,349 20,349 20,349 20,349 20,349 20,349 20,349 20,349 20,349 20,349 20,349 20,349 20,349 20,349 20,349 20,349 20,349 20,349 20,349 20,349 20,349 20,349 20,349 20,349 20,349Output kW 227,600 170,700 110,200 225,200 168,900 102,500 223,600 167,700 101,100 215,500 161,600 98,700 213,400 212,400 159,300 98,100 208,000 203,600 152,700 95,100 204,200 197,600 148,200 93,500 204,500 191,100 143,300 91,500 204,400 182,200 136,600 89,800Heat Rate (LHV) BTU/kWh 8,710 9,370 11,380 8,760 9,280 11,620 8,785 9,230 11,680 8,810 9,345 11,840 8,865 8,900 9,405 11,800 8,950 8,980 9,550 11,980 8,985 9,035 9,660 12,090 8,980 9,085 9,760 12,200 8,975 9,170 9,890 12,310Heat Cons. (LHV) MMBTU/hr 1,982.4 1,599.5 1,254.1 1,972.8 1,567.4 1,191.1 1,964.3 1,547.9 1,180.8 1,898.6 1,510.2 1,168.6 1,891.8 1,890.4 1,498.2 1,157.6 1,861.6 1,828.3 1,458.3 1,139.3 1,834.7 1,785.3 1,431.6 1,130.4 1,836.4 1,736.1 1,398.6 1,116.3 1,834.5 1,670.8 1,351.0 1,105.4Exhaust Flow x10^3 lb/hr 4,287 3,528 2,778 4,245 3,446 2,640 4,209 3,350 2,642 4,087 3,254 2,657 4,091 4,125 3,211 2,646 4,047 4,001 3,105 2,633 3,992 3,917 3,037 2,632 4,002 3,847 2,973 2,637 4,007 3,753 2,924 2,654Exhaust Temperature °F 1,064 1,090 1,189 1,090 1,105 1,215 1,103 1,124 1,215 1,111 1,147 1,215 1,113 1,112 1,163 1,215 1,118 1,121 1,184 1,215 1,123 1,126 1,198 1,215 1,121 1,130 1,212 1,215 1,120 1,136 1,215 1,215Exhaust MolWt lb/lbmol 28.48 28.49 28.49 28.46 28.47 28.48 28.42 28.42 28.44 28.38 28.38 28.40 28.29 28.31 28.31 28.33 28.19 28.22 28.20 28.24 28.14 28.17 28.16 28.20 28.17 28.24 28.22 28.26 28.20 28.31 28.30 28.34Water / Steam Flow lb/hr EMISSIONS NOx ppmvd 9 9 9 9 9 9 9 9 9 9 9 9 9 9 9 9 9 9 9 9 9 9 9 9 9 9 9 9 9 9 9 9NOx Correction O2 Value % O2 15 15 15 15 15 15 15 15 15 15 15 15 15 15 15 15 15 15 15 15 15 15 15 15 15 15 15 15 15 15 15 15NOx as NO2 lb/hr 72 58 45 71 57 43 71 56 43 69 55 42 68 68 54 42 67 66 53 41 66 65 52 41 66 63 51 40 66 60 49 40CO ppmvd 9 9 9 9 9 9 9 9 9 9 9 9 9 9 9 9 9 9 9 9 9 9 9 9 9 9 9 9 9 9 9 9CO lb/hr 35 29 23 35 28 22 34 27 22 33 26 22 33 33 26 21 32 32 25 21 32 31 24 21 32 31 24 21 32 30 24 22UHC ppmvw 7 7 7 7 7 7 7 7 7 7 7 7 7 7 7 7 7 7 7 7 7 7 7 7 7 7 7 7 7 7 7 7UHC lb/hr 17 14 11 17 14 10 17 13 10 16 13 10 16 16 13 10 16 16 12 10 16 16 12 10 16 15 12 10 16 15 12 10VOC ppmvw 1.4 1.4 1.4 1.4 1.4 1.4 1.4 1.4 1.4 1.4 1.4 1.4 1.4 1.4 1.4 1.4 1.4 1.4 1.4 1.4 1.4 1.4 1.4 1.4 1.4 1.4 1.4 1.4 1.4 1.4 1.4 1.4VOC lb/hr 3.4 2.8 2.2 3.3 2.7 2.1 3.3 2.6 2.1 3.2 2.6 2.1 3.2 3.3 2.5 2.1 3.2 3.2 2.5 2.1 3.2 3.1 2.4 2.1 3.2 3.1 2.4 2.1 3.2 3.0 2.3 2.1SO2 ppmvw <0.5 <0.5 <0.5 <0.5 <0.5 <0.5 <0.5 <0.5 <0.5 <0.5 <0.5 <0.5 <0.5 <0.5 <0.5 <0.5 <0.5 <0.5 <0.5 <0.5 <0.5 <0.5 <0.5 <0.5 <0.5 <0.5 <0.5 <0.5 <0.5 <0.5 <0.5 <0.5SO2 lb/hr 0.05 0.04 0.03 0.05 0.04 0.03 0.05 0.04 0.03 0.05 0.04 0.03 0.05 0.05 0.04 0.03 0.05 0.04 0.04 0.03 0.05 0.04 0.04 0.03 0.05 0.04 0.03 0.03 0.05 0.04 0.03 0.03SO3 ppmvw <0.5 <0.5 <0.5 <0.5 <0.5 <0.5 <0.5 <0.5 <0.5 <0.5 <0.5 <0.5 <0.5 <0.5 <0.5 <0.5 <0.5 <0.5 <0.5 <0.5 <0.5 <0.5 <0.5 <0.5 <0.5 <0.5 <0.5 <0.5 <0.5 <0.5 <0.5 <0.5SO3 lb/hr <0.01 <0.01 <0.01 <0.01 <0.01 <0.01 <0.01 <0.01 <0.01 <0.01 <0.01 <0.01 <0.01 <0.01 <0.01 <0.01 <0.01 <0.01 <0.01 <0.01 <0.01 <0.01 <0.01 <0.01 <0.01 <0.01 <0.01 <0.01 <0.01 <0.01 <0.01 <0.01Sulfur Mist lb/hr <0.01 <0.01 <0.01 <0.01 <0.01 <0.01 <0.01 <0.01 <0.01 <0.01 <0.01 <0.01 <0.01 <0.01 <0.01 <0.01 <0.01 <0.01 <0.01 <0.01 <0.01 <0.01 <0.01 <0.01 <0.01 <0.01 <0.01 <0.01 <0.01 <0.01 <0.01 <0.01Particulate Basis US-Totl US-Totl US-Totl US-Totl US-Totl US-Totl US-Totl US-Totl US-Totl US-Totl US-Totl US-Totl US-Totl US-Totl US-Totl US-Totl US-Totl US-Totl US-Totl US-Totl US-Totl US-Totl US-Totl US-Totl US-Totl US-Totl US-Totl US-Totl US-Totl US-Totl US-Totl US-TotlParticulate Emissions 9.3 9.3 9.3 9.3 9.3 9.3 9.3 9.3 9.3 9.3 9.3 9.3 9.3 9.3 9.3 9.3 9.3 9.3 9.3 9.3 9.3 9.3 9.3 9.3 9.3 9.3 9.3 9.3 9.3 9.3 9.3 9.3Particulate Units lbm/hr lbm/hr lbm/hr lbm/hr lbm/hr lbm/hr lbm/hr lbm/hr lbm/hr lbm/hr lbm/hr lbm/hr lbm/hr lbm/hr lbm/hr lbm/hr lbm/hr lbm/hr lbm/hr lbm/hr lbm/hr lbm/hr lbm/hr lbm/hr lbm/hr lbm/hr lbm/hr lbm/hr lbm/hr lbm/hr lbm/hr lbm/hr Fuel Sulfur ppmw 0.25 0.25 0.25 0.25 0.25 0.25 0.25 0.25 0.25 0.25 0.25 0.25 0.25 0.25 0.25 0.25 0.25 0.25 0.25 0.25 0.25 0.25 0.25 0.25 0.25 0.25 0.25 0.25 0.25 0.25 0.25 0.25 EXHAUST ANALYSIS % VOL. Argon 0.89 0.89 0.89 0.89 0.89 0.89 0.89 0.89 0.89 0.88 0.88 0.89 0.88 0.88 0.88 0.88 0.87 0.87 0.87 0.87 0.86 0.87 0.87 0.87 0.87 0.87 0.87 0.87 0.87 0.88 0.88 0.88Nitrogen 75.01 75.07 75.08 74.89 74.95 74.98 74.58 74.61 74.71 74.26 74.26 74.42 73.66 73.82 73.76 73.95 72.94 73.11 73.03 73.26 72.56 72.80 72.71 72.97 72.78 73.26 73.14 73.43 73.01 73.80 73.69 73.98Oxygen 12.49 12.66 12.69 12.43 12.61 12.68 12.33 12.41 12.68 12.29 12.29 12.73 12.18 12.28 12.14 12.65 12.06 12.15 11.92 12.58 11.97 12.09 11.82 12.56 12.04 12.27 11.93 12.77 12.11 12.49 12.19 13.01Carbon Dioxide 3.93 3.86 3.84 3.95 3.87 3.83 3.96 3.92 3.80 3.93 3.93 3.73 3.91 3.87 3.94 3.70 3.87 3.85 3.96 3.65 3.86 3.83 3.96 3.62 3.86 3.80 3.96 3.58 3.85 3.77 3.91 3.53Water 7.67 7.52 7.49 7.84 7.68 7.62 8.24 8.17 7.93 8.63 8.63 8.24 9.38 9.15 9.28 8.82 10.26 10.02 10.23 9.64 10.74 10.40 10.65 9.99 10.46 9.79 10.10 9.35 10.16 9.07 9.34 8.61 SITE CONDITIONS Elevation Feet 365 365 365 365 365 365 365 365 365 365 365 365 365 365 365 365 365 365 365 365 365 365 365 365 365 365 365 365 365 365 365 365Site Pressure psia 14.5 14.5 14.5 14.5 14.5 14.5 14.5 14.5 14.5 14.5 14.5 14.5 14.5 14.5 14.5 14.5 14.5 14.5 14.5 14.5 14.5 14.5 14.5 14.5 14.5 14.5 14.5 14.5 14.5 14.5 14.5 14.5Relative Humidity % 50.0 50.0 50.0 44.6 44.6 44.6 75.6 75.6 75.6 71.2 71.2 71.2 72.1 72.1 72.1 72.1 72.6 72.6 72.6 72.6 65.1 65.1 65.1 65.1 41.5 41.5 41.5 41.5 22.0 22.0 22.0 22.0 Exhaust Loss under Site Conditions are at ISO Conditions. Emission information based on GE recommended measurement methods. NOx emissions are corrected to 15% O2 without heat rate correction and are not corrected to ISO reference condition per 40CFR 60.335(a)(1)(i). NOx levels shown will be controlled by algorithms within the SPEEDTRONIC control system. Sulfur emissions based on noted "WT%" or "ppmw" noted after Sulfur Content values in the fuel Particulate Note: US-Total PM Emissions (filterable + condensable) utilize compliance measurements per US-EPA
Test Method 5B dated 1990 (filterable) and US-EPA Test Method 202 dated 1991 (condensable) measured at GT exhaust flange.
IPS- Tenaska - Grimes County : - 7FA.05-01A-0312 1 Version Code- 4.2.2b/344/7FA.05-01A-0312 204019625 12/3/2012 4:45:27 PM General Electric Proprietary Information
TRPP Grimes County Peaking Unit
Grimes County, Texas GE 7FA.05 Performance Information
ERM Texas Registerd Engineering Firm F-2393
Page 10 of 11 0189555\ A5469 D.1 CO2 Efficiency LImit Calcs.pdf

Tenaska - Grimes CountyESTIMATED PERFORMANCE - 7FA.04 Load Condition BASE 75.0% 64.9% BASE 75.0% 54.8% BASE 75.0% 51.6% BASE 75.0% 50.3% BASE BASE 75.0% 51.8% BASE BASE 75.0% 55.5% BASE BASE 75.0% 57.5% BASE BASE 75.0% 59.5% BASE BASE 75.0% 63.6%Ambient Temperature °F 7.0 7.0 7.0 29.0 29.0 29.0 40.0 40.0 40.0 56.0 56.0 56.0 69.0 69.0 69.0 69.0 82.0 82.0 82.0 82.0 90.0 90.0 90.0 90.0 98.0 98.0 98.0 98.0 109.0 109.0 109.0 109.0Ambient Relative Humidity % 50.0 50.0 50.0 44.6 44.6 44.6 75.6 75.6 75.6 71.2 71.2 71.2 72.1 72.1 72.1 72.1 72.6 72.6 72.6 72.6 65.1 65.1 65.1 65.1 41.5 41.5 41.5 41.5 22.0 22.0 22.0 22.0Evap. Cooler Status Off Off Off Off Off Off Off Off Off Off Off Off On Off Off Off On Off Off Off On Off Off Off On Off Off Off On Off Off OffEvap. Cooler Effectiveness 85% 85% 85% 85% 85% Fuel Type Cust Gas Cust Gas Cust Gas Cust Gas Cust Gas Cust Gas Cust Gas Cust Gas Cust Gas Cust Gas Cust Gas Cust Gas Cust Gas Cust Gas Cust Gas Cust Gas Cust Gas Cust Gas Cust Gas Cust Gas Cust Gas Cust Gas Cust Gas Cust Gas Cust Gas Cust Gas Cust Gas Cust Gas Cust Gas Cust Gas Cust Gas Cust GasFuel LHV BTU/lb 20,349 20,349 20,349 20,349 20,349 20,349 20,349 20,349 20,349 20,349 20,349 20,349 20,349 20,349 20,349 20,349 20,349 20,349 20,349 20,349 20,349 20,349 20,349 20,349 20,349 20,349 20,349 20,349 20,349 20,349 20,349 20,349Output kW 207,000 155,300 134,300 198,300 148,700 108,700 193,000 144,700 99,600 184,600 138,400 92,800 179,900 176,300 132,200 91,300 172,000 167,900 125,900 93,200 168,400 162,500 121,800 93,400 168,700 156,700 117,500 93,200 168,700 148,400 111,300 94,400Heat Rate (LHV) BTU/kWh 8,855 9,310 9,805 8,855 9,400 10,720 8,875 9,475 11,130 8,930 9,605 11,430 8,990 9,020 9,760 11,470 9,090 9,135 9,970 11,340 9,145 9,215 10,110 11,310 9,135 9,290 10,220 11,280 9,130 9,415 10,410 11,180Heat Cons. (LHV) MMBTU/hr 1,833.0 1,445.8 1,316.8 1,755.9 1,397.8 1,165.3 1,712.9 1,371.0 1,108.5 1,648.5 1,329.3 1,060.7 1,617.3 1,590.2 1,290.3 1,047.2 1,563.5 1,533.8 1,255.2 1,056.9 1,540.0 1,497.4 1,231.4 1,056.4 1,541.1 1,455.7 1,200.9 1,051.3 1,540.2 1,397.2 1,158.6 1,055.4Exhaust Flow x10^3 lb/hr 3,861 3,080 2,810 3,730 2,994 2,515 3,656 2,938 2,449 3,548 2,853 2,373 3,475 3,436 2,767 2,362 3,363 3,317 2,684 2,383 3,310 3,242 2,634 2,389 3,318 3,180 2,610 2,400 3,323 3,090 2,574 2,428Exhaust Temperature °F 1,099 1,119 1,149 1,108 1,138 1,204 1,112 1,149 1,205 1,119 1,166 1,215 1,127 1,130 1,183 1,215 1,138 1,142 1,203 1,215 1,144 1,150 1,215 1,215 1,143 1,156 1,215 1,215 1,142 1,165 1,215 1,215Exhaust MolWt lb/lbmol 28.47 28.47 28.47 28.46 28.46 28.46 28.42 28.42 28.43 28.38 28.37 28.39 28.29 28.31 28.31 28.33 28.19 28.21 28.20 28.23 28.13 28.17 28.16 28.19 28.16 28.23 28.23 28.25 28.19 28.31 28.31 28.32Water / Steam Flow lb/hr EMISSIONS NOx ppmvd 9 9 9 9 9 9 9 9 9 9 9 9 9 9 9 9 9 9 9 9 9 9 9 9 9 9 9 9 9 9 9 9NOx Correction O2 Value % O2 15 15 15 15 15 15 15 15 15 15 15 15 15 15 15 15 15 15 15 15 15 15 15 15 15 15 15 15 15 15 15 15NOx as NO2 lb/hr 66 52 48 64 51 42 62 50 40 60 48 38 59 58 47 38 57 56 45 38 56 54 45 38 56 53 43 38 56 51 42 38CO ppmvd 9 9 9 9 9 9 9 9 9 9 9 9 9 9 9 10 9 9 9 10 9 9 9 10 9 9 9 9 9 9 9 9CO lb/hr 31 25 23 30 24 21 30 24 20 29 23 19 28 28 22 21 27 27 22 21 26 26 21 21 27 26 21 19 27 25 21 20UHC ppmvw 7 7 7 7 7 7 7 7 7 7 7 7 7 7 7 7 7 7 7 7 7 7 7 7 7 7 7 7 7 7 7 7UHC lb/hr 15 12 11 15 12 10 14 12 10 14 11 9 14 14 11 9 13 13 11 9 13 13 10 9 13 13 10 10 13 12 10 10VOC ppmvw 1.4 1.4 1.4 1.4 1.4 1.4 1.4 1.4 1.4 1.4 1.4 1.4 1.4 1.4 1.4 1.4 1.4 1.4 1.4 1.4 1.4 1.4 1.4 1.4 1.4 1.4 1.4 1.4 1.4 1.4 1.4 1.4VOC lb/hr 3.0 2.4 2.2 2.9 2.4 2.0 2.9 2.3 1.9 2.8 2.3 1.9 2.8 2.7 2.2 1.9 2.7 2.6 2.1 1.9 2.6 2.6 2.1 1.9 2.6 2.5 2.1 1.9 2.6 2.4 2.0 1.9SO2 ppmvw <0.5 <0.5 <0.5 <0.5 <0.5 <0.5 <0.5 <0.5 <0.5 <0.5 <0.5 <0.5 <0.5 <0.5 <0.5 <0.5 <0.5 <0.5 <0.5 <0.5 <0.5 <0.5 <0.5 <0.5 <0.5 <0.5 <0.5 <0.5 <0.5 <0.5 <0.5 <0.5SO2 lb/hr 0.05 0.04 0.03 0.04 0.03 0.03 0.04 0.03 0.03 0.04 0.03 0.03 0.04 0.04 0.03 0.03 0.04 0.04 0.03 0.03 0.04 0.04 0.03 0.03 0.04 0.04 0.03 0.03 0.04 0.03 0.03 0.03SO3 ppmvw <0.5 <0.5 <0.5 <0.5 <0.5 <0.5 <0.5 <0.5 <0.5 <0.5 <0.5 <0.5 <0.5 <0.5 <0.5 <0.5 <0.5 <0.5 <0.5 <0.5 <0.5 <0.5 <0.5 <0.5 <0.5 <0.5 <0.5 <0.5 <0.5 <0.5 <0.5 <0.5SO3 lb/hr <0.01 <0.01 <0.01 <0.01 <0.01 <0.01 <0.01 <0.01 <0.01 <0.01 <0.01 <0.01 <0.01 <0.01 <0.01 <0.01 <0.01 <0.01 <0.01 <0.01 <0.01 <0.01 <0.01 <0.01 <0.01 <0.01 <0.01 <0.01 <0.01 <0.01 <0.01 <0.01Sulfur Mist lb/hr <0.01 <0.01 <0.01 <0.01 <0.01 <0.01 <0.01 <0.01 <0.01 <0.01 <0.01 <0.01 <0.01 <0.01 <0.01 <0.01 <0.01 <0.01 <0.01 <0.01 <0.01 <0.01 <0.01 <0.01 <0.01 <0.01 <0.01 <0.01 <0.01 <0.01 <0.01 <0.01Particulate Basis US-Totl US-Totl US-Totl US-Totl US-Totl US-Totl US-Totl US-Totl US-Totl US-Totl US-Totl US-Totl US-Totl US-Totl US-Totl US-Totl US-Totl US-Totl US-Totl US-Totl US-Totl US-Totl US-Totl US-Totl US-Totl US-Totl US-Totl US-Totl US-Totl US-Totl US-Totl US-TotlParticulate Emissions 8.2 8.2 8.2 8.2 8.2 8.2 8.2 8.2 8.2 8.2 8.2 8.2 8.2 8.2 8.2 8.2 8.2 8.2 8.2 8.2 8.2 8.2 8.2 8.2 8.2 8.2 8.2 8.2 8.2 8.2 8.2 8.2Particulate Units lbm/hr lbm/hr lbm/hr lbm/hr lbm/hr lbm/hr lbm/hr lbm/hr lbm/hr lbm/hr lbm/hr lbm/hr lbm/hr lbm/hr lbm/hr lbm/hr lbm/hr lbm/hr lbm/hr lbm/hr lbm/hr lbm/hr lbm/hr lbm/hr lbm/hr lbm/hr lbm/hr lbm/hr lbm/hr lbm/hr lbm/hr lbm/hr Fuel Sulfur ppmw 0.25 0.25 0.25 0.25 0.25 0.25 0.25 0.25 0.25 0.25 0.25 0.25 0.25 0.25 0.25 0.25 0.25 0.25 0.25 0.25 0.25 0.25 0.25 0.25 0.25 0.25 0.25 0.25 0.25 0.25 0.25 0.25 EXHAUST ANALYSIS % VOL. Argon 0.89 0.89 0.89 0.89 0.89 0.89 0.89 0.89 0.89 0.88 0.88 0.89 0.88 0.88 0.88 0.88 0.87 0.87 0.87 0.87 0.86 0.87 0.87 0.87 0.87 0.87 0.87 0.87 0.87 0.88 0.88 0.88Nitrogen 74.93 74.97 74.97 74.85 74.87 74.90 74.57 74.58 74.67 74.26 74.25 74.37 73.64 73.79 73.77 73.91 72.91 73.08 73.04 73.19 72.53 72.76 72.73 72.89 72.75 73.22 73.20 73.34 72.97 73.75 73.77 73.86Oxygen 12.28 12.37 12.38 12.32 12.39 12.45 12.29 12.32 12.58 12.28 12.26 12.60 12.13 12.20 12.14 12.55 11.96 12.05 11.95 12.38 11.87 11.98 11.88 12.33 11.94 12.16 12.11 12.50 12.01 12.37 12.41 12.69Carbon Dioxide 4.03 3.99 3.98 4.00 3.97 3.94 3.97 3.96 3.84 3.94 3.95 3.79 3.93 3.91 3.94 3.75 3.91 3.90 3.94 3.74 3.91 3.88 3.93 3.72 3.90 3.86 3.88 3.70 3.90 3.82 3.80 3.68Water 7.87 7.78 7.77 7.94 7.88 7.82 8.27 8.25 8.02 8.64 8.66 8.36 9.42 9.22 9.27 8.91 10.35 10.11 10.19 9.81 10.83 10.50 10.59 10.19 10.55 9.89 9.94 9.59 10.25 9.17 9.14 8.89 SITE CONDITIONS Elevation Feet 365 365 365 365 365 365 365 365 365 365 365 365 365 365 365 365 365 365 365 365 365 365 365 365 365 365 365 365 365 365 365 365Site Pressure psia 14.5 14.5 14.5 14.5 14.5 14.5 14.5 14.5 14.5 14.5 14.5 14.5 14.5 14.5 14.5 14.5 14.5 14.5 14.5 14.5 14.5 14.5 14.5 14.5 14.5 14.5 14.5 14.5 14.5 14.5 14.5 14.5Relative Humidity % 50.0 50.0 50.0 44.6 44.6 44.6 75.6 75.6 75.6 71.2 71.2 71.2 72.1 72.1 72.1 72.1 72.6 72.6 72.6 72.6 65.1 65.1 65.1 65.1 41.5 41.5 41.5 41.5 22.0 22.0 22.0 22.0 Exhaust Loss under Site Conditions are at ISO Conditions. Emission information based on GE recommended measurement methods. NOx emissions are corrected to 15% O2 without heat rate correction and are not corrected to ISO reference condition per 40CFR 60.335(a)(1)(i). NOx levels shown will be controlled by algorithms within the SPEEDTRONIC control system. Sulfur emissions based on noted "WT%" or "ppmw" noted after Sulfur Content values in the fuel Particulate Note: US-Total PM Emissions (filterable + condensable) utilize compliance measurements per US-EPA
Test Method 5B dated 1990 (filterable) and US-EPA Test Method 202 dated 1991 (condensable) measured at GT exhaust flange.
IPS- Tenaska : Grimes County - 7FA.04-1112 : Grimes County 5 Version Code- 4.2.2b/344/7FA.04-1112 204019625 12/3/2012 4:32:53 7FA04.gtp General Electric Proprietary Information
TRPP Grimes County Peaking Unit
Grimes County, Texas GE 7FA.04 Performance Information
ERM Texas Registerd Engineering Firm F-2393
Page 11 of 11 0189555\ A5469 D.1 CO2 Efficiency LImit Calcs.pdf

TRPPTenaska Roans Prairie Generating Station
Grimes County, TexasHistorical Fuel Data and Statistical Analysis
Gas Day DateHeating Value
CO2 Intensity Total CO2 CO2 Cont O2 Cont N2 Cont Methane Cont
Ethane Cont Propane ContI Butane
ContN Butane
ContI Pentane
ContN Pentane
ContNeo Pentane
ContN Hexane
ContHeptane Cont Octane Cont
Stoichiometry (mol CO2 / Mol
component)1 0 0 1 2 3 4 4 5 5 5 6 7 8
1/1/2012 1,010.7 118.0 4,528.6 75.3412 - - 4,253.3128 90.5256 23.9712 35.9568 9.9792 10.2080 6.7100 2.4420 - 5.9136 14.2208
1/2/2012 1,015.4 117.9 4,545.8 71.0468 - - 4,241.5648 131.1024 22.2024 33.6688 9.5744 9.4600 5.7640 2.6840 - 5.5132 13.2352
1/3/2012 1,009.4 117.9 4,518.3 76.1112 - - 4,263.5252 77.7656 21.0540 33.2640 9.0992 8.9320 5.3900 2.2660 - 6.1292 14.7840
1/4/2012 1,009.3 117.9 4,516.3 75.4820 - - 4,266.0332 74.8264 20.6580 33.0528 9.0288 8.8220 5.3460 2.3540 - 6.0984 14.6432
1/5/2012 1,009.8 117.9 4,520.8 75.6008 - - 4,259.1736 83.1688 22.0044 33.8448 9.3632 9.2400 5.6980 2.5520 - 5.9136 14.2208
1/6/2012 1,009.5 118.0 4,524.4 78.9360 - - 4,252.1160 88.8976 22.7172 34.1616 9.5568 9.1740 5.5220 2.5080 - 6.0984 14.7136
1/7/2012 1,011.6 118.3 4,543.4 78.6016 - - 4,240.0776 104.1920 26.3208 39.4240 11.0176 10.7360 6.2920 2.9700 - 6.9916 16.8256
1/8/2012 1,011.9 118.3 4,545.1 78.1660 - - 4,238.6256 106.2248 26.7432 39.8816 11.1408 10.9780 6.4020 2.9700 - 7.0224 16.8960
1/9/2012 1,011.4 118.3 4,541.2 77.7656 - - 4,238.8808 105.9696 25.7664 38.7552 10.7184 10.4500 6.2040 2.9040 - 6.9916 16.7904
1/10/2012 1,012.2 118.4 4,552.0 80.0272 - - 4,235.0968 108.7152 27.6276 42.0112 11.7920 11.2420 6.7540 3.1240 - 7.5152 18.0576
1/11/2012 1,008.6 117.9 4,513.0 77.4092 - - 4,256.2564 84.1192 21.2256 31.0640 8.8528 8.6020 5.0820 2.2440 - 5.3284 12.8480
1/12/2012 1,011.5 118.4 4,546.2 79.5960 - - 4,242.4184 99.2728 26.3340 41.1312 11.3168 11.1100 6.5340 3.0360 - 7.4844 17.9872
1/13/2012 1,009.4 118.3 4,534.9 84.3612 - - 4,244.3632 91.7488 24.5256 37.7168 10.8592 10.0760 6.2040 2.7280 - 6.5604 15.8048
1/14/2012 1,008.2 118.4 4,532.4 88.6996 - - 4,243.0344 89.3464 23.5752 36.8192 10.9648 9.5700 6.0280 2.4420 - 6.4372 15.4880
1/15/2012 1,010.0 118.6 4,547.2 87.3136 - - 4,237.7280 96.8352 26.1624 41.4656 11.9504 10.8240 6.6660 2.8820 - 7.4536 17.9168
1/16/2012 1,011.9 118.7 4,561.6 84.3832 - - 4,232.0036 106.9904 27.4164 45.8832 12.1792 11.7700 7.1060 3.4980 - 8.9012 21.4368
1/17/2012 1,012.7 118.8 4,567.3 82.9972 - - 4,229.6276 111.3552 28.0896 47.6960 12.5488 12.2100 7.3040 3.7620 - 9.3016 22.4224
1/18/2012 1,009.8 118.4 4,538.9 83.4724 - - 4,243.8440 93.2360 24.0900 39.2304 10.7536 10.1860 6.2040 2.9260 - 7.3304 17.6704
1/19/2012 1,009.9 118.1 4,529.9 78.7204 - - 4,256.0584 83.2304 22.5060 37.0656 9.9264 9.6140 5.7420 2.7720 - 7.1148 17.1424
1/20/2012 1,009.5 117.9 4,519.2 75.6096 - - 4,264.3612 76.3488 21.4236 33.9680 9.2400 9.1520 5.6100 2.5300 - 6.1292 14.7840
1/21/2012 1,010.0 118.0 4,526.0 77.4532 - - 4,249.9116 92.6640 23.5620 34.5488 9.6800 9.5260 5.7420 2.5520 - 5.9752 14.3968
1/22/2012 1,009.8 118.0 4,524.7 77.3784 - - 4,248.4508 94.3008 22.8624 34.1088 9.3808 9.2620 5.6100 2.4200 - 6.1292 14.7840
1/23/2012 1,009.2 117.9 4,519.0 78.1704 - - 4,249.1196 92.8840 22.7436 32.0320 9.3280 9.0420 5.2580 2.3100 - 5.2976 12.7776
1/24/2012 1,008.9 118.1 4,523.3 80.8500 - - 4,249.1856 89.6016 22.4268 33.9680 9.5744 9.0860 5.5220 2.4860 - 6.0368 14.5376
1/25/2012 1,008.1 117.7 4,503.5 74.8660 - - 4,270.7016 69.7136 18.6120 29.0752 7.9904 7.8760 4.7960 2.1340 - 5.2052 12.5312
1/26/2012 1,009.3 118.0 4,523.2 78.9932 - - 4,256.8812 81.8576 22.4268 34.7424 9.6976 9.4160 5.7420 2.5520 - 6.1292 14.7488
1/27/2012 1,009.2 118.1 4,524.2 79.3936 - - 4,257.1672 81.0392 22.2948 35.0944 9.5392 9.3720 5.6540 2.5520 - 6.4680 15.5936
1/28/2012 1,008.5 117.8 4,512.0 77.4312 - - 4,263.9212 75.2576 20.4336 31.3280 8.7120 8.5140 5.0820 2.3100 - 5.5748 13.4112
1/29/2012 1,006.2 117.6 4,490.9 76.9912 - - 4,274.4108 61.8728 16.5264 25.4848 7.0224 6.9300 4.0260 1.7820 - 4.6508 11.2288
1/30/2012 1,008.1 117.5 4,497.3 71.8432 - - 4,275.5372 67.1440 17.4900 27.1920 7.4800 7.2600 4.3120 1.8480 - 5.0512 12.1792
1/31/2012 1,011.4 117.9 4,527.3 72.3712 - - 4,257.3080 90.1120 23.7336 35.1648 9.9264 9.7680 5.8520 2.5300 - 6.0368 14.5376
2/1/2012 1,011.0 117.9 4,526.0 73.6516 - - 4,252.4284 94.4504 23.9976 34.3024 9.8736 9.8340 5.6980 2.4420 - 5.6672 13.6224
2/2/2012 1,011.2 117.9 4,526.7 73.3172 - - 4,247.7644 100.5224 24.8028 33.9504 10.0320 9.8560 5.6980 2.4420 - 5.3592 12.9184
2/3/2012 1,011.4 118.0 4,530.0 73.7968 - - 4,250.0920 97.1960 25.0140 35.3056 10.2256 9.9660 5.7640 2.5740 - 5.8828 14.1504
2/4/2012 1,012.0 117.8 4,527.3 69.9600 - - 4,262.4868 86.9880 23.9184 35.3056 10.1024 9.9000 5.9400 2.6180 - 5.8828 14.1504
2/5/2012 1,011.5 117.9 4,526.8 71.4296 - - 4,262.4736 85.1312 23.4300 35.3936 9.9440 9.7680 5.9400 2.6400 - 6.0676 14.6080
2/6/2012 1,010.8 117.8 4,522.6 72.5340 - - 4,263.2700 82.4472 22.7304 34.2496 9.6624 9.4820 5.6980 2.5080 - 5.8828 14.1504
2/7/2012 1,010.4 117.9 4,521.4 73.5460 - - 4,264.2732 79.6928 22.1760 34.1616 9.4512 9.3280 5.5660 2.4640 - 6.0984 14.6784
2/8/2012 1,009.2 117.7 4,511.1 73.5064 - - 4,269.6852 72.4856 20.1432 31.4160 8.6064 8.4700 5.1700 2.2880 - 5.6672 13.6576
2/9/2012 1,010.1 117.8 4,519.2 73.6868 - - 4,252.2524 93.9312 22.1100 32.3136 9.0992 8.8000 5.3020 2.3320 - 5.6672 13.6576
2/10/2012 1,009.1 117.7 4,509.5 73.3128 - - 4,263.0324 81.1976 20.1168 29.9552 8.2896 8.0080 4.7960 2.0900 - 5.4824 13.2352
2/11/2012 1,011.6 118.2 4,538.7 76.7712 - - 4,252.6044 91.0184 25.8852 38.8432 11.1408 10.7360 6.4900 2.8380 - 6.5604 15.8048
2/12/2012 1,011.1 118.3 4,541.7 80.5596 - - 4,246.7480 93.9136 26.3472 39.6352 11.4400 10.8680 6.7760 2.9260 - 6.6220 15.9104
2/13/2012 1,011.3 118.1 4,534.5 75.7196 - - 4,255.9836 87.6832 24.6840 37.8576 10.5776 10.3840 6.3140 2.7280 - 6.6220 15.9104
2/14/2012 1,011.8 118.0 4,534.2 74.0080 - - 4,248.4816 99.1232 25.2648 36.7136 10.5072 10.2080 6.1380 2.6620 - 6.1908 14.9248
2/15/2012 1,011.9 118.1 4,535.7 74.2412 - - 4,246.4268 101.7104 25.6476 36.8720 10.5600 10.2960 6.0720 2.7060 - 6.2216 14.9952
2/16/2012 1,012.5 118.4 4,550.7 77.1232 - - 4,240.8388 104.9400 26.6508 42.0288 11.2816 11.0440 6.6880 3.1460 - 7.9156 19.0432
2/17/2012 1,011.8 118.2 4,540.1 75.9440 - - 4,247.6588 97.9880 25.2780 38.8432 10.6304 10.2960 6.3360 2.7720 - 7.1456 17.2128
2/18/2012 1,010.7 118.1 4,533.6 77.5368 - - 4,248.7852 94.5472 24.0372 37.0304 10.1376 9.8780 6.1380 2.7500 - 6.6836 16.1216
2/19/2012 1,010.9 118.1 4,532.7 76.5864 - - 4,244.9352 100.4432 24.3804 36.0976 9.9616 9.6800 6.0060 2.6840 - 6.4372 15.5232
2/20/2012 1,011.2 118.1 4,534.7 76.3620 - - 4,245.4500 99.9504 24.7368 36.8368 10.0848 9.9440 6.1600 2.6620 - 6.6220 15.9104
2/21/2012 1,011.4 118.1 4,535.0 75.5964 - - 4,246.5984 99.8008 24.8160 36.8016 10.1376 9.8780 6.1160 2.6400 - 6.6220 15.9456
2/22/2012 1,010.3 117.9 4,522.5 75.1388 - - 4,245.6348 101.4200 23.1792 32.3136 9.1344 8.8660 5.3680 2.2880 - 5.6056 13.5168
2/23/2012 1,011.1 117.9 4,525.7 73.9068 - - 4,241.1600 108.9528 24.4068 32.5776 9.5216 9.3060 5.3460 2.2660 - 5.3592 12.9184
ERMTexas Registered Engineering Firm F-2393 Page 1 of 12
0189555\A5469 D.2 Historical Fuel Analyses.xls

TRPPTenaska Roans Prairie Generating Station
Grimes County, TexasHistorical Fuel Data and Statistical Analysis
Gas Day DateHeating Value
CO2 Intensity Total CO2 CO2 Cont O2 Cont N2 Cont Methane Cont
Ethane Cont Propane ContI Butane
ContN Butane
ContI Pentane
ContN Pentane
ContNeo Pentane
ContN Hexane
ContHeptane Cont Octane Cont
Stoichiometry (mol CO2 / Mol
component)1 0 0 1 2 3 4 4 5 5 5 6 7 8
2/24/2012 1,012.3 118.1 4,539.6 74.5404 - - 4,238.4100 111.1352 26.7696 37.2240 10.5424 10.2740 6.0940 2.7060 - 6.4372 15.4880
2/25/2012 1,012.0 118.0 4,534.1 73.2204 - - 4,241.5912 109.1992 25.6212 35.5344 10.1728 9.9660 5.9400 2.5960 - 5.9444 14.3264
2/26/2012 1,012.1 117.9 4,531.6 71.8564 - - 4,242.7440 109.1640 25.2912 34.6896 9.9264 9.7900 5.6980 2.4860 - 5.8520 14.0800
2/27/2012 1,012.0 117.9 4,531.3 71.8432 - - 4,243.3160 108.4248 25.0404 34.7072 9.8384 9.7240 5.7420 2.4860 - 5.9136 14.2560
2/28/2012 1,014.2 118.2 4,551.9 72.6044 - - 4,234.5380 118.5712 30.7428 40.2688 11.7568 11.7480 6.5560 2.7720 - 6.5604 15.8048
2/29/2012 1,012.9 118.2 4,545.8 75.3148 - - 4,239.6684 109.1024 28.6572 39.1248 11.2640 11.0880 6.4020 2.7280 - 6.5912 15.8400
3/1/2012 1,011.6 118.0 4,533.5 74.6856 - - 4,245.0936 102.6520 25.6080 35.9040 10.2608 10.1420 5.9400 2.5080 - 6.0676 14.6080
3/2/2012 1,013.4 118.3 4,553.3 76.9692 - - 4,231.8100 116.5736 31.3632 40.8496 11.9856 12.1220 6.6880 2.9700 - 6.4372 15.5232
3/3/2012 1,011.9 118.1 4,538.5 76.4324 - - 4,235.5148 112.6752 27.4956 36.4672 10.5776 10.5380 6.0720 2.6840 - 5.8828 14.1856
3/4/2012 1,011.3 118.0 4,529.6 74.5580 - - 4,239.2460 110.3784 25.0272 33.8272 9.6624 9.6580 5.5880 2.4420 - 5.6364 13.5872
3/5/2012 1,011.9 118.0 4,534.7 74.8176 - - 4,237.6312 112.5960 26.3868 35.1120 10.2256 10.0540 5.7860 2.5080 - 5.7596 13.8336
3/6/2012 1,014.3 118.7 4,570.9 81.3912 - - 4,217.9412 127.2480 35.7984 45.9888 13.5520 13.7500 7.5020 3.4540 - 7.1456 17.1776
3/7/2012 1,016.4 118.8 4,585.9 78.9756 - - 4,211.2092 139.1720 39.0192 49.1568 13.5520 14.3660 7.2380 3.7180 - 8.6548 20.8032
3/8/2012 1,017.6 118.8 4,591.3 78.3816 - - 4,202.5236 152.1960 41.9100 49.0688 14.1328 14.9160 7.5900 3.6080 - 7.9156 19.0432
3/9/2012 1,013.2 118.2 4,548.8 75.8384 - - 4,221.7384 129.9672 30.7032 38.2272 11.1408 11.2640 6.1820 2.7940 - 6.1292 14.7840
3/10/2012 1,013.5 118.3 4,551.3 75.5084 - - 4,224.4752 127.0632 30.9012 39.4768 11.3344 12.0560 6.4900 2.9480 - 6.1600 14.8544
3/11/2012 1,011.6 118.1 4,534.1 75.2752 - - 4,231.8936 118.2544 26.3604 34.6016 9.8912 9.9660 5.6100 2.4420 - 5.7904 13.9744
3/12/2012 1,014.7 118.4 4,562.9 76.6744 - - 4,217.1800 135.8368 34.5312 41.7120 12.2144 12.5620 6.5560 2.9920 - 6.6528 16.0160
3/13/2012 1,018.9 119.0 4,605.2 78.9184 - - 4,194.3088 160.5384 45.5664 53.4160 15.6640 16.8080 8.3820 4.1140 - 8.0696 19.3952
3/14/2012 1,018.0 119.0 4,600.8 79.1032 - - 4,197.8332 154.9240 41.8704 53.6800 15.3648 16.1700 8.5580 4.2240 - 8.5316 20.5568
3/15/2012 1,020.1 119.2 4,618.1 79.0064 - - 4,192.0604 162.3336 47.4408 57.9744 16.6848 17.7760 8.8440 4.5100 - 9.2400 22.2112
3/16/2012 1,020.3 119.2 4,617.6 80.0096 - - 4,189.6844 165.6600 49.5792 56.3376 16.8080 17.9740 8.5580 4.0480 - 8.5008 20.4160
3/17/2012 1,021.0 119.2 4,622.4 77.5852 - - 4,193.8248 162.5096 48.8796 59.3120 17.1952 19.0960 9.3720 4.7520 - 8.7472 21.0848
3/18/2012 1,020.6 119.2 4,618.5 77.8096 - - 4,194.6432 160.8200 48.4572 58.1328 17.0368 18.6560 9.1960 4.4000 - 8.6240 20.7328
3/19/2012 1,021.1 119.3 4,623.9 77.8184 - - 4,191.7436 163.4688 50.0544 60.0688 17.7232 19.4700 9.8120 4.7740 - 8.5008 20.4864
3/20/2012 1,018.0 118.8 4,591.2 75.4468 - - 4,209.2292 145.5344 41.1972 50.7056 14.8016 15.4880 8.1400 3.7400 - 7.8848 19.0080
3/21/2012 1,014.1 118.3 4,554.5 74.2500 - - 4,225.4960 127.3008 31.6668 40.4448 11.6512 12.0780 6.5340 2.9480 - 6.4988 15.6640
3/22/2012 1,017.7 118.9 4,593.1 76.5776 - - 4,208.4944 144.4608 40.7748 51.7792 14.7840 15.5980 8.1180 3.8720 - 8.4084 20.2400
3/23/2012 1,018.1 118.9 4,597.2 76.5072 - - 4,207.6584 144.6544 41.5800 53.5920 15.2592 16.5000 8.5360 4.1360 - 8.4392 20.3456
3/24/2012 1,014.3 118.4 4,557.7 74.9892 - - 4,225.8480 126.0776 32.1552 41.5888 11.9680 12.2100 6.7980 2.9920 - 6.7760 16.2976
3/25/2012 1,013.2 118.1 4,544.7 74.1004 - - 4,232.2764 119.3984 29.5152 37.8048 11.0176 11.1540 6.3140 2.7720 - 5.9752 14.3616
3/26/2012 1,013.9 118.2 4,550.5 73.2248 - - 4,231.6648 121.2376 30.1752 39.6352 11.2992 11.5280 6.3800 2.8160 - 6.6220 15.9456
3/27/2012 1,012.1 118.2 4,541.0 76.0672 - - 4,237.3892 110.0088 27.8256 37.5936 10.4896 10.6480 6.0060 2.7280 - 6.5296 15.7344
3/28/2012 1,012.4 117.9 4,533.0 71.7552 - - 4,243.0960 110.0088 25.1328 34.9888 10.0320 9.9220 5.9180 2.6400 - 5.7288 13.7984
3/29/2012 1,012.8 118.0 4,536.6 70.9808 - - 4,248.2132 103.4792 26.0040 36.9952 10.5776 10.4500 6.2040 2.7060 - 6.1600 14.8192
3/30/2012 1,012.6 118.0 4,536.4 71.7992 - - 4,243.9364 108.1872 26.1228 36.3792 10.4896 10.3840 6.1160 2.6180 - 5.9752 14.3616
3/31/2012 1,012.7 117.9 4,534.7 71.0336 - - 4,244.9176 107.8000 26.0964 35.7984 10.4368 10.2520 6.0500 2.5740 - 5.7904 13.9040
4/1/2012 1,012.1 117.9 4,529.7 71.5924 - - 4,243.8880 108.5920 25.4892 33.9504 10.1376 9.9440 5.7420 2.4420 - 5.2360 12.6368
4/2/2012 1,011.5 117.9 4,527.5 73.3656 - - 4,240.4692 110.8008 25.2252 32.8944 9.7856 9.6140 5.5220 2.3320 - 5.1436 12.3904
4/3/2012 1,016.9 118.6 4,580.7 77.1540 - - 4,214.7908 137.9048 40.9068 46.9744 14.3440 15.1800 7.6780 3.3880 - 6.5604 15.7696
4/4/2012 1,019.2 119.2 4,610.8 81.1448 - - 4,197.2084 153.3136 48.1008 56.2496 17.2480 18.7220 9.3720 4.2020 - 7.4228 17.8464
4/5/2012 1,012.4 118.1 4,541.1 74.9892 - - 4,232.5140 117.9992 27.9840 36.8368 10.5952 10.5380 5.9840 2.5960 - 6.1600 14.8544
4/6/2012 1,011.2 118.0 4,528.9 74.2632 - - 4,237.2396 113.1240 24.6312 33.4752 9.5568 9.4160 5.5660 2.3320 - 5.6672 13.6576
4/7/2012 1,011.3 117.9 4,526.4 73.0972 - - 4,239.3164 112.1120 24.2748 32.6656 9.4864 9.2840 5.3900 2.2880 - 5.4208 13.0240
4/8/2012 1,011.6 117.9 4,527.8 72.3580 - - 4,240.5616 112.0416 24.2484 33.0880 9.5216 9.3940 5.5000 2.3320 - 5.5132 13.2704
4/9/2012 1,011.4 117.9 4,527.0 72.6748 - - 4,239.9984 111.6544 24.3408 33.0352 9.5744 9.4380 5.5440 2.3760 - 5.3900 12.9888
4/10/2012 1,011.6 117.9 4,528.6 72.6308 - - 4,240.3900 111.6280 24.4992 33.5104 9.7504 9.5040 5.6320 2.3760 - 5.4824 13.2352
4/11/2012 1,011.2 117.9 4,526.6 73.9992 - - 4,240.2008 110.5896 24.3936 32.6832 9.5920 9.3060 5.5000 2.3100 - 5.2976 12.7424
4/12/2012 1,010.6 118.0 4,526.9 76.1508 - - 4,239.3604 108.5920 24.3012 33.1056 9.6624 9.4380 5.5220 2.3320 - 5.4208 13.0240
4/13/2012 1,010.3 118.0 4,527.1 78.4344 - - 4,234.3884 112.6664 24.9216 32.5424 9.6976 9.7240 5.5000 2.2660 - 4.9896 12.0032
4/14/2012 1,010.0 118.0 4,525.5 78.5620 - - 4,236.8568 108.9704 24.4200 32.4368 9.6272 9.4600 5.4560 2.2440 - 5.1128 12.3200
4/15/2012 1,010.0 118.0 4,524.8 78.5400 - - 4,236.7820 109.2344 24.4200 32.1376 9.6096 9.3720 5.3900 2.2660 - 5.0204 12.0736
4/16/2012 1,009.2 117.8 4,513.5 78.5576 - - 4,237.9920 109.4632 24.4728 26.8048 9.4512 9.1960 0.2640 2.8160 - 4.2504 10.2080
4/17/2012 1,009.2 117.8 4,513.3 78.5576 - - 4,238.0008 109.4808 24.4728 26.7168 9.4512 9.1960 0.1980 2.8160 - 4.2196 10.1728
ERMTexas Registered Engineering Firm F-2393 Page 2 of 12
0189555\A5469 D.2 Historical Fuel Analyses.xls

TRPPTenaska Roans Prairie Generating Station
Grimes County, TexasHistorical Fuel Data and Statistical Analysis
Gas Day DateHeating Value
CO2 Intensity Total CO2 CO2 Cont O2 Cont N2 Cont Methane Cont
Ethane Cont Propane ContI Butane
ContN Butane
ContI Pentane
ContN Pentane
ContNeo Pentane
ContN Hexane
ContHeptane Cont Octane Cont
Stoichiometry (mol CO2 / Mol
component)1 0 0 1 2 3 4 4 5 5 5 6 7 8
4/18/2012 1,009.2 117.8 4,513.3 78.5576 - - 4,238.0008 109.4808 24.4728 26.7168 9.4512 9.1960 0.1980 2.8160 - 4.2196 10.1728
4/19/2012 1,011.7 118.4 4,549.7 77.6864 - - 4,238.2736 107.0168 24.5784 40.6208 8.8528 9.3060 3.7620 2.4420 - 10.9032 26.2592
4/20/2012 1,010.0 118.0 4,524.9 78.1396 - - 4,236.1528 109.3752 24.5124 32.4544 9.6800 9.3940 5.4560 2.2220 - 5.1436 12.3552
4/21/2012 1,010.2 118.0 4,527.1 78.4696 - - 4,236.5884 109.3224 24.4992 32.9472 9.6624 9.3500 5.4340 2.2440 - 5.4516 13.0944
4/22/2012 1,010.9 118.0 4,529.7 76.7976 - - 4,237.0548 110.4048 25.6212 33.7392 9.9440 9.7020 5.7200 2.3760 - 5.3900 12.9536
4/23/2012 1,030.1 120.6 4,717.3 82.7596 - - 4,155.8308 199.1968 73.1148 87.5072 24.6224 28.6000 13.6400 7.1940 - 13.1516 31.6448
4/24/2012 1,017.8 118.9 4,594.5 78.0824 - - 4,206.4132 146.5552 42.2928 51.1808 14.9072 15.2900 8.0520 3.7620 - 8.2236 19.7824
4/25/2012 1,017.7 119.0 4,598.4 78.5620 - - 4,207.5880 142.0760 41.8440 54.1552 15.3824 16.4780 8.4480 4.1800 - 8.7164 21.0144
4/26/2012 1,017.5 118.9 4,592.4 78.2232 - - 4,206.2636 145.5696 41.8176 50.9344 14.7664 15.4880 7.8980 3.9380 - 8.0696 19.3952
4/27/2012 1,015.2 118.5 4,566.7 75.6008 - - 4,218.7112 134.6136 34.5180 43.6832 12.7952 13.1340 6.9960 3.2340 - 6.8684 16.5440
4/28/2012 1,012.9 118.2 4,544.1 75.4820 - - 4,227.3792 125.2592 28.8948 36.8720 10.8240 10.9780 6.1820 2.5960 - 5.7596 13.9040
4/29/2012 1,010.9 118.0 4,527.9 75.8120 - - 4,231.9816 118.3072 24.6576 32.5424 9.4512 9.4600 5.4780 2.1560 - 5.2976 12.7776
4/30/2012 1,010.6 117.9 4,524.6 75.7020 - - 4,232.5536 117.7352 24.0900 31.4512 9.1872 9.2620 5.2360 2.1120 - 5.0512 12.1792
5/1/2012 1,010.9 118.0 4,528.0 75.9924 - - 4,232.6548 117.1456 25.1196 32.6128 9.6272 9.6140 5.5660 2.2000 - 5.1128 12.3200
5/2/2012 1,011.3 118.0 4,532.1 76.1156 - - 4,232.6944 117.2160 25.8060 33.9504 9.9616 10.0100 5.7640 2.3100 - 5.3592 12.9184
5/3/2012 1,011.6 118.1 4,535.1 75.8164 - - 4,234.4236 115.1304 26.2152 35.2176 10.2784 10.1640 5.8300 2.4200 - 5.7596 13.8336
5/4/2012 1,011.5 118.1 4,534.0 75.5568 - - 4,233.7548 115.7992 25.9644 34.9360 10.1200 10.1200 5.7200 2.3320 - 5.7904 13.9392
5/5/2012 1,010.8 118.0 4,529.3 77.0528 - - 4,232.6636 115.9312 25.1196 33.1760 9.6976 9.7900 5.5660 2.2440 - 5.2976 12.7424
5/6/2012 1,011.1 118.0 4,529.3 75.1740 - - 4,233.8472 116.4240 24.9744 33.2464 9.6272 9.6580 5.5220 2.2440 - 5.4516 13.1296
5/7/2012 1,011.8 118.0 4,534.0 75.3456 - - 4,234.3972 118.0872 25.4892 34.0032 9.7504 9.8340 5.6980 2.3540 - 5.6056 13.4816
5/8/2012 1,011.5 117.9 4,529.5 74.0300 - - 4,235.5016 116.5472 24.9480 33.0352 9.4864 9.5480 5.5660 2.2440 - 5.4516 13.0944
5/9/2012 1,012.0 118.0 4,534.3 73.5372 - - 4,235.4356 115.7816 26.1624 35.1648 10.0848 10.2080 5.9400 2.4420 - 5.7596 13.8336
5/10/2012 1,011.7 118.0 4,533.4 74.8088 - - 4,233.3764 117.7352 25.7400 34.4784 9.9440 10.0760 5.8520 2.3760 - 5.5748 13.4112
5/11/2012 1,011.0 118.0 4,530.5 75.7240 - - 4,233.0376 116.7496 24.5124 33.7216 9.3984 9.6360 5.5220 2.3320 - 5.8212 14.0096
5/12/2012 1,011.8 118.0 4,533.3 74.3160 - - 4,233.0596 119.0288 25.4892 34.3024 9.7856 9.9660 5.8300 2.3980 - 5.6056 13.5168
5/13/2012 1,011.5 118.0 4,532.5 74.9628 - - 4,233.1344 118.1840 25.1856 34.0736 9.6272 9.8560 5.6540 2.4200 - 5.6980 13.6928
5/14/2012 1,011.7 118.0 4,532.1 74.5008 - - 4,233.3764 118.6592 25.5420 33.7744 9.7504 9.9220 5.6540 2.3760 - 5.4516 13.0944
5/15/2012 1,012.8 118.1 4,540.4 74.5360 - - 4,230.0016 124.4232 27.2580 35.5696 10.2608 10.5820 5.8960 2.5300 - 5.6980 13.6928
5/16/2012 1,012.7 118.1 4,539.5 74.3600 - - 4,230.9872 123.8600 26.4132 35.2880 10.0144 10.2080 5.9180 2.4860 - 5.8520 14.0800
5/17/2012 1,012.5 118.1 4,538.5 74.4216 - - 4,233.9484 118.7384 26.9412 35.6400 10.3312 10.4720 5.9180 2.4860 - 5.7596 13.8336
5/18/2012 1,012.3 118.0 4,536.6 74.6636 - - 4,230.2436 123.5432 26.2944 34.5664 9.9792 10.1860 5.8300 2.4860 - 5.5132 13.2704
5/19/2012 1,012.1 118.0 4,535.6 74.4480 - - 4,230.7848 122.7336 26.1624 34.3728 9.8208 10.1420 5.7640 2.4640 - 5.5440 13.3760
5/20/2012 1,011.8 118.0 4,532.3 74.6064 - - 4,232.0696 120.5776 25.7136 33.5632 9.7328 9.9220 5.7640 2.4200 - 5.2668 12.6720
5/21/2012 1,011.9 118.1 4,537.4 76.6348 - - 4,227.4452 125.2944 26.1360 34.5136 9.8560 10.0980 5.7860 2.4420 - 5.6364 13.5520
5/22/2012 1,013.2 118.1 4,544.4 74.2764 - - 4,231.9244 120.7624 29.3436 37.3824 10.7712 11.6160 6.3360 2.8600 - 5.6056 13.5168
5/23/2012 1,013.3 118.1 4,543.0 73.4712 - - 4,232.5140 120.7008 29.3832 36.9776 10.9472 11.4840 6.2260 2.7940 - 5.4208 13.0592
5/24/2012 1,012.1 118.0 4,536.1 75.2444 - - 4,233.8296 117.5416 27.2712 34.8832 10.2784 10.6920 5.8080 2.5740 - 5.2668 12.6720
5/25/2012 1,012.3 118.0 4,535.7 74.4128 - - 4,236.6148 115.0512 27.2184 35.0768 10.4192 10.6920 6.1600 2.6400 - 5.1128 12.2848
5/26/2012 1,011.4 118.0 4,530.7 75.3192 - - 4,237.4640 112.4024 25.6080 33.8976 9.9968 10.0980 5.8960 2.4640 - 5.1436 12.3904
5/27/2012 1,011.5 117.9 4,529.6 74.4304 - - 4,235.2156 116.2216 25.7664 33.1408 9.8736 9.9880 5.7420 2.4200 - 4.9280 11.8624
5/28/2012 1,011.0 117.9 4,525.9 75.1388 - - 4,235.6864 114.7080 25.3308 32.0320 9.7328 9.7680 5.5880 2.3980 - 4.5584 10.9824
5/29/2012 1,010.8 117.9 4,524.7 75.2356 - - 4,237.2484 112.4024 24.8688 31.9088 9.5568 9.6800 5.5880 2.3320 - 4.6508 11.2288
5/30/2012 1,012.3 118.0 4,534.6 74.3160 - - 4,232.7120 119.6096 28.2744 34.1792 10.4720 10.9120 6.0500 2.6180 - 4.5276 10.9120
5/31/2012 1,011.7 117.9 4,527.0 72.7276 - - 4,243.4920 107.8176 25.9908 32.9120 9.9440 10.3620 5.7640 2.5300 - 4.5276 10.9120
6/1/2012 1,011.4 117.9 4,525.8 73.6164 - - 4,239.8708 111.1880 25.6740 32.1904 9.7856 9.9000 5.5880 2.3540 - 4.5892 11.0176
6/2/2012 1,016.2 118.6 4,575.2 77.2288 - - 4,213.1012 138.5296 39.7452 45.8304 13.6752 15.6420 7.7880 3.8280 - 5.8212 14.0448
6/3/2012 1,013.3 118.1 4,545.0 75.7328 - - 4,225.3552 126.7904 31.9572 36.5904 11.4400 11.7260 6.3140 2.7500 - 4.8048 11.5456
6/4/2012 1,013.2 118.2 4,545.7 76.1288 - - 4,224.4972 126.5176 31.8912 37.3120 11.4048 12.3200 6.5560 3.0360 - 4.7124 11.3696
6/5/2012 1,013.7 118.2 4,548.9 76.3532 - - 4,223.0012 128.7352 33.7656 37.5408 11.7392 12.3640 6.4680 3.0360 - 4.6816 11.2640
6/6/2012 1,010.4 117.8 4,520.5 75.7944 - - 4,238.2516 110.2816 25.4892 30.4304 9.5744 9.8120 5.4560 2.2660 - 3.8500 9.2576
6/7/2012 1,010.9 117.9 4,524.8 76.1376 - - 4,238.7048 109.5072 26.5320 31.9088 10.1552 10.2740 5.7860 2.4420 - 3.9116 9.4336
6/8/2012 1,010.3 117.8 4,519.8 75.8164 - - 4,237.0064 111.6632 25.2120 30.2192 9.5216 9.7240 5.4340 2.2440 - 3.8192 9.1872
6/9/2012 1,010.3 117.9 4,520.7 76.3004 - - 4,236.1264 112.2088 25.3308 30.3952 9.4336 9.8340 5.3900 2.2440 - 3.9424 9.4688
6/10/2012 1,010.4 117.9 4,521.7 76.9164 - - 4,233.9308 114.3472 26.4660 30.2896 9.7152 9.8780 5.4780 2.3540 - 3.6036 8.6944
ERMTexas Registered Engineering Firm F-2393 Page 3 of 12
0189555\A5469 D.2 Historical Fuel Analyses.xls

TRPPTenaska Roans Prairie Generating Station
Grimes County, TexasHistorical Fuel Data and Statistical Analysis
Gas Day DateHeating Value
CO2 Intensity Total CO2 CO2 Cont O2 Cont N2 Cont Methane Cont
Ethane Cont Propane ContI Butane
ContN Butane
ContI Pentane
ContN Pentane
ContNeo Pentane
ContN Hexane
ContHeptane Cont Octane Cont
Stoichiometry (mol CO2 / Mol
component)1 0 0 1 2 3 4 4 5 5 5 6 7 8
6/11/2012 1,010.7 117.9 4,522.8 76.2432 - - 4,234.4456 114.9896 26.2416 30.5712 9.6624 9.8780 5.5000 2.2880 - 3.8192 9.1872
6/12/2012 1,010.8 117.9 4,524.6 76.9736 - - 4,235.2464 112.9832 26.8752 31.5216 10.1728 10.4500 5.8960 2.5300 - 3.5112 8.4832
6/13/2012 1,010.7 117.9 4,524.9 76.3004 - - 4,241.0104 105.7760 26.3736 32.4720 10.1024 10.4280 5.8300 2.5300 - 4.1272 9.9616
6/14/2012 1,012.0 118.0 4,535.8 76.9340 - - 4,229.2404 119.3984 30.9012 34.2848 10.9472 11.3300 6.0940 2.6400 - 4.0964 9.8912
6/15/2012 1,010.0 117.9 4,522.0 78.4828 - - 4,236.0032 109.4720 25.9908 31.0992 9.8032 10.0540 5.6980 2.3760 - 3.8192 9.2224
6/16/2012 1,016.7 118.7 4,583.6 80.3968 - - 4,207.8124 140.2544 44.7348 48.1536 15.2240 17.2040 8.5360 4.4000 - 4.9588 11.9680
6/17/2012 1,021.5 119.2 4,623.3 82.9972 - - 4,180.7436 175.3224 58.5552 54.6832 17.5472 19.5580 9.0640 4.6200 - 5.9444 14.2912
6/18/2012 1,028.7 120.0 4,687.0 85.2324 - - 4,151.2460 209.1144 79.2528 70.7520 23.0208 25.9600 11.3740 5.9840 - 7.3612 17.7408
6/19/2012 1,023.7 119.6 4,647.0 82.2492 - - 4,179.1772 175.0672 60.9576 64.9440 20.1872 23.2100 10.8460 6.1600 - 7.0840 17.0720
6/20/2012 1,027.0 120.5 4,697.7 95.3348 - - 4,150.4672 191.9896 80.6784 78.6720 24.7280 30.8440 13.5080 7.3040 - 7.1148 17.1072
6/21/2012 1,017.8 119.2 4,607.3 88.4180 - - 4,198.0004 142.4808 52.7604 55.0704 17.6704 20.8120 9.8120 4.6420 - 5.1744 12.4608
6/22/2012 1,018.9 119.4 4,618.9 89.7644 - - 4,191.8668 148.4648 55.8360 58.4320 18.9024 22.1320 10.5600 5.0380 - 5.2668 12.6720
6/23/2012 1,014.0 118.5 4,563.4 82.2492 - - 4,220.2072 125.1184 37.5012 42.3456 12.9184 14.0580 7.1720 3.8060 - 5.2976 12.7424
6/24/2012 1,014.4 118.6 4,565.9 81.6860 - - 4,219.6660 125.8224 38.7948 43.4544 13.6224 15.3340 7.6780 3.8940 - 4.6816 11.2640
6/25/2012 1,016.0 118.7 4,579.4 83.4240 - - 4,208.7584 139.1720 44.1276 45.1440 14.5200 15.4660 7.8320 3.8500 - 5.0204 12.0736
6/26/2012 1,015.0 118.7 4,575.5 85.5052 - - 4,211.5656 131.2784 43.7844 45.3200 14.9952 16.2580 8.2280 3.8280 - 4.3120 10.4192
6/27/2012 1,015.5 118.6 4,572.7 82.2888 - - 4,216.3616 128.9640 43.7184 44.4928 14.5728 16.4340 8.0520 3.6960 - 4.1580 9.9968
6/28/2012 1,009.1 118.0 4,520.1 81.5496 - - 4,245.4984 94.3448 25.5684 31.7504 10.4368 10.3400 5.9180 2.3980 - 3.6036 8.6592
6/29/2012 1,009.5 117.9 4,520.0 79.8512 - - 4,246.9724 93.7816 25.8720 31.9440 10.4192 10.5160 5.9180 2.5520 - 3.5728 8.5888
6/30/2012 1,009.8 118.0 4,523.0 79.8644 - - 4,246.8140 94.9960 25.8588 32.6304 10.3488 10.6480 6.0280 2.5520 - 3.8808 9.3632
7/1/2012 1,009.6 117.9 4,519.8 79.1340 - - 4,251.5440 89.1880 25.3044 32.3488 10.3312 10.6040 6.1160 2.5300 - 3.7268 8.9760
7/2/2012 1,009.9 117.9 4,520.0 78.0780 - - 4,246.1144 97.6272 25.2780 31.5392 10.1024 10.1860 5.8300 2.4200 - 3.7576 9.0816
7/3/2012 1,009.0 117.9 4,515.7 79.5256 - - 4,246.9680 94.4328 24.3276 30.4480 9.6448 9.8780 5.6760 2.3320 - 3.6652 8.8000
7/4/2012 1,008.7 118.0 4,517.5 81.2856 - - 4,250.9984 86.8032 24.5124 31.9088 10.0672 10.2300 5.9400 2.5300 - 3.8808 9.3280
7/5/2012 1,009.0 117.9 4,518.1 80.4672 - - 4,254.8132 83.3008 24.6048 32.2960 10.1024 10.2960 6.0280 2.5520 - 4.0040 9.6096
7/6/2012 1,009.5 117.9 4,520.1 79.5168 - - 4,249.1460 91.8368 25.3308 32.1024 10.2608 10.3180 5.9400 2.4640 - 3.8808 9.2928
7/7/2012 1,009.3 117.9 4,519.5 80.2604 - - 4,247.3332 93.3944 25.4100 31.6624 10.1728 10.3400 5.8300 2.4200 - 3.7268 8.9760
7/8/2012 1,009.0 118.0 4,519.0 81.5804 - - 4,248.1472 90.7192 25.0404 31.8912 10.2960 10.3620 6.0720 2.5520 - 3.6036 8.6944
7/9/2012 1,009.2 117.9 4,519.2 80.9732 - - 4,243.8220 97.1608 25.5156 31.1872 10.1200 10.3180 5.8960 2.3980 - 3.4804 8.3776
7/10/2012 1,011.6 118.2 4,538.2 80.7884 - - 4,234.3444 110.1056 30.9012 35.6752 11.3520 12.3640 6.4240 2.9480 - 3.9116 9.3984
7/11/2012 1,014.9 118.5 4,567.1 80.4936 - - 4,224.7480 122.0736 38.7816 43.7888 13.2704 15.7520 7.6120 4.0480 - 4.8356 11.6512
7/12/2012 1,014.4 118.5 4,562.7 80.2868 - - 4,227.6256 118.5536 37.2372 42.9440 12.9888 15.3780 7.4800 4.0040 - 4.7740 11.4752
7/13/2012 1,013.4 118.3 4,553.6 80.4320 - - 4,229.9180 115.9048 35.2308 40.0048 12.3552 14.2340 7.0620 3.6300 - 4.3428 10.4544
7/14/2012 1,010.3 118.0 4,526.4 79.6708 - - 4,239.7388 103.9192 27.1128 32.8592 10.5072 10.7140 6.0060 2.5300 - 3.9116 9.4336
7/15/2012 1,009.1 117.9 4,515.2 79.4288 - - 4,239.9456 103.7960 24.4068 29.3392 9.5040 9.6580 5.4120 2.2660 - 3.3572 8.0960
7/16/2012 1,009.3 117.9 4,518.5 79.7984 - - 4,240.2580 102.9424 25.3968 30.3248 9.7680 9.8780 5.4780 2.2440 - 3.6344 8.8000
7/17/2012 1,009.5 117.9 4,517.5 79.1208 - - 4,234.2036 111.3640 25.6212 29.1984 9.5744 9.6360 5.3900 2.1780 - 3.2956 7.9552
7/18/2012 1,009.2 117.8 4,513.8 77.9284 - - 4,247.4608 95.4800 24.0768 29.7968 9.5040 9.7460 5.4780 2.2880 - 3.5420 8.5184
7/19/2012 1,009.6 117.9 4,520.0 78.9140 - - 4,247.0560 94.5648 25.6344 32.0320 10.3840 10.4500 5.9400 2.5300 - 3.6652 8.8352
7/20/2012 1,009.3 117.9 4,517.6 79.1428 - - 4,245.4456 96.3512 24.9084 31.0112 9.9792 9.8560 5.6980 2.3100 - 3.7884 9.1520
7/21/2012 1,023.1 119.0 4,621.5 75.0464 - - 4,192.1132 165.8360 63.2544 54.9648 17.4240 22.0660 9.0640 4.7080 - 4.9896 12.0384
7/22/2012 1,014.8 118.3 4,558.1 78.2364 - - 4,223.3928 126.6232 39.7452 39.2656 12.8480 13.6840 6.9520 3.1020 - 4.1888 10.0672
7/23/2012 1,010.8 118.0 4,528.1 78.3552 - - 4,237.0284 108.0904 28.2744 33.1056 10.6480 10.9340 6.0280 2.6840 - 3.7884 9.1520
7/24/2012 1,010.6 118.0 4,528.0 78.4080 - - 4,234.1068 110.4312 28.4724 33.1936 10.5248 11.1540 6.1380 2.6840 - 3.7576 9.0816
7/25/2012 1,011.2 118.1 4,534.6 79.0592 - - 4,234.7888 107.8352 31.0464 35.6048 11.2464 12.4300 6.4460 2.9700 - 3.8808 9.3280
7/26/2012 1,009.5 117.9 4,518.2 79.2000 - - 4,244.3764 97.6008 25.9380 30.9408 10.1024 10.3180 5.7860 2.4200 - 3.3880 8.1664
7/27/2012 1,009.8 118.0 4,522.6 80.1460 - - 4,235.7128 107.5536 27.0336 31.3456 10.1376 10.5380 5.7200 2.4640 - 3.5112 8.4480
7/28/2012 1,008.7 117.9 4,513.8 79.9700 - - 4,236.6500 106.5064 24.0636 28.7936 9.3104 9.3060 5.1920 2.1340 - 3.4804 8.3776
7/29/2012 1,008.9 117.9 4,514.9 79.3540 - - 4,237.2572 106.5680 24.1296 29.1632 9.2752 9.3720 5.3020 2.2000 - 3.6036 8.6592
7/30/2012 1,009.7 117.9 4,518.9 77.8800 - - 4,236.6324 108.4336 25.7532 30.3072 9.5568 9.9660 5.4120 2.3760 - 3.6960 8.8704
7/31/2012 1,009.5 117.9 4,517.3 78.4212 - - 4,233.0904 113.1944 25.3176 29.0576 9.3280 9.4820 5.1260 2.1120 - 3.5728 8.6240
8/1/2012 1,009.8 118.0 4,522.7 80.1768 - - 4,234.8812 109.2696 26.7036 30.9584 9.8560 10.1200 5.6320 2.3540 - 3.7268 8.9760
8/2/2012 1,009.0 117.9 4,517.9 80.6344 - - 4,236.9360 105.6968 24.8952 30.0784 9.4512 9.8560 5.4340 2.3100 - 3.6960 8.8704
8/3/2012 1,008.1 117.8 4,510.5 80.6124 - - 4,249.7004 89.5840 22.9812 29.1456 9.2224 9.3720 5.3020 2.1780 - 3.6344 8.7296
ERMTexas Registered Engineering Firm F-2393 Page 4 of 12
0189555\A5469 D.2 Historical Fuel Analyses.xls

TRPPTenaska Roans Prairie Generating Station
Grimes County, TexasHistorical Fuel Data and Statistical Analysis
Gas Day DateHeating Value
CO2 Intensity Total CO2 CO2 Cont O2 Cont N2 Cont Methane Cont
Ethane Cont Propane ContI Butane
ContN Butane
ContI Pentane
ContN Pentane
ContNeo Pentane
ContN Hexane
ContHeptane Cont Octane Cont
Stoichiometry (mol CO2 / Mol
component)1 0 0 1 2 3 4 4 5 5 5 6 7 8
8/4/2012 1,009.3 117.8 4,515.0 78.4080 - - 4,242.3832 101.6048 24.6444 29.4976 9.6272 9.7240 5.3900 2.2220 - 3.3880 8.1312
8/5/2012 1,012.6 118.1 4,540.7 76.9252 - - 4,228.4924 120.1728 32.5644 35.9040 11.3520 12.6720 6.4460 2.9700 - 3.8808 9.3280
8/6/2012 1,011.8 118.1 4,538.4 78.9448 - - 4,228.0700 118.4920 31.1784 35.2528 10.9648 11.8140 6.1160 2.7720 - 4.3428 10.4896
8/7/2012 1,009.7 118.0 4,524.2 80.5420 - - 4,239.6552 101.4992 27.1920 32.6128 10.2432 11.0000 6.0060 2.5960 - 3.7576 9.0816
8/8/2012 1,010.6 118.1 4,531.0 80.6300 - - 4,238.1020 104.1040 29.2908 34.1264 10.8768 11.2200 6.2040 2.7500 - 4.0040 9.6448
8/9/2012 1,010.2 118.0 4,526.8 80.8852 - - 4,239.3032 102.9600 28.2744 32.7008 10.5600 10.8460 5.9620 2.5080 - 3.7576 9.0816
8/10/2012 1,010.3 118.0 4,527.2 80.1020 - - 4,232.4436 112.1032 27.9840 32.2432 10.2080 10.6260 5.8080 2.5080 - 3.8808 9.3280
8/11/2012 1,008.9 117.9 4,516.9 80.6564 - - 4,237.1692 105.3448 25.1724 29.6032 9.3632 9.6580 5.3240 2.2440 - 3.6344 8.7648
8/12/2012 1,009.6 118.0 4,523.7 80.6784 - - 4,237.1692 104.5088 26.8752 32.2256 10.1552 10.7800 5.9400 2.5520 - 3.7576 9.0112
8/13/2012 1,023.3 119.1 4,625.4 77.3828 - - 4,180.4972 182.1688 61.6044 54.0144 17.4240 19.8880 8.8440 4.7740 - 5.5132 13.2704
8/14/2012 1,020.5 119.0 4,611.6 81.8576 - - 4,187.8320 167.6224 56.2848 51.4624 16.5968 18.5680 8.6460 4.4220 - 5.3900 12.9536
8/15/2012 1,015.1 118.7 4,574.7 86.3852 - - 4,204.1164 142.5512 43.9032 42.6800 14.3616 14.8060 7.4360 3.3000 - 4.4352 10.7008
8/16/2012 1,011.9 118.3 4,544.1 82.8476 - - 4,222.5040 122.4432 33.8844 35.7456 11.6864 11.9680 6.2700 2.7280 - 4.0964 9.8912
8/17/2012 1,009.5 118.0 4,520.8 80.1812 - - 4,231.8232 113.0184 25.6476 30.2896 9.6096 9.8340 5.5220 2.2440 - 3.7268 8.9408
8/18/2012 1,009.5 117.9 4,517.2 78.3684 - - 4,234.0188 112.1736 24.6576 29.4272 9.3280 9.6580 5.5000 2.2880 - 3.4496 8.3424
8/19/2012 1,009.5 117.9 4,517.3 77.7436 - - 4,235.3476 111.2672 23.8392 29.5856 9.0640 9.2840 5.1920 2.1340 - 4.0656 9.8208
8/20/2012 1,009.4 117.9 4,516.9 78.1088 - - 4,235.9812 110.0704 24.0372 29.5152 9.1168 9.4380 5.3240 2.2220 - 3.8192 9.2576
8/21/2012 1,009.4 117.8 4,516.4 78.2276 - - 4,238.1064 107.5008 23.9184 29.5328 9.2048 9.3720 5.3900 2.2220 - 3.7884 9.1520
8/22/2012 1,009.6 117.9 4,518.1 77.6116 - - 4,238.0448 108.4160 24.0900 30.0080 9.1872 9.4820 5.4340 2.2880 - 3.9732 9.5744
8/23/2012 1,010.2 117.9 4,522.0 77.4048 - - 4,234.1948 113.2472 25.3308 30.8880 9.5040 9.9880 5.5880 2.3980 - 3.9424 9.5040
8/24/2012 1,011.0 118.0 4,530.4 78.6676 - - 4,228.4000 120.3664 27.4824 32.4544 10.0320 10.4280 5.7420 2.5080 - 4.2196 10.1376
8/25/2012 1,011.2 118.1 4,534.4 79.9084 - - 4,225.2320 122.9712 28.9080 33.3520 10.4192 10.9120 5.9180 2.5960 - 4.1580 10.0320
8/26/2012 1,011.8 118.2 4,539.7 80.2164 - - 4,220.9992 127.2744 31.2312 34.5840 11.0352 11.3960 6.1820 2.7500 - 4.0964 9.8912
8/27/2012 1,011.2 118.1 4,533.8 79.0944 - - 4,228.2724 118.4744 29.3568 33.7568 10.3840 10.9560 5.8300 2.7280 - 4.3736 10.5248
8/28/2012 1,012.4 118.3 4,546.8 81.6156 - - 4,218.5132 128.4096 34.1616 36.4320 11.7568 12.0120 6.5120 2.9040 - 4.2504 10.2080
8/29/2012 1,012.2 118.3 4,547.0 81.8400 - - 4,223.0364 122.5664 33.0792 37.3296 11.8624 12.1440 6.5560 3.0360 - 4.5584 10.9472
8/30/2012 1,010.1 118.1 4,529.2 81.2768 - - 4,238.3000 102.8104 27.7068 34.1264 10.7184 10.8680 6.3140 2.7280 - 4.2196 10.1376
8/31/2012 1,009.1 118.0 4,519.9 80.8544 - - 4,247.7512 91.0448 25.1196 32.3840 10.0496 10.4500 6.0060 2.5960 - 4.0040 9.6096
9/1/2012 1,008.8 117.8 4,512.6 78.5796 - - 4,239.9808 103.8136 23.5356 28.8112 9.1168 9.3940 5.2140 2.2000 - 3.5112 8.4832
9/2/2012 1,009.1 117.9 4,515.1 78.5048 - - 4,235.6996 109.8768 23.5356 28.9520 8.8880 9.1740 5.1700 2.1780 - 3.8500 9.2928
9/3/2012 1,009.0 117.9 4,516.2 78.9052 - - 4,235.1804 110.0352 23.4960 29.2864 8.9056 9.0860 5.1260 2.0900 - 4.1272 9.9616
9/4/2012 1,009.2 117.9 4,515.6 78.0340 - - 4,235.6556 110.2024 23.7600 29.1632 8.9936 9.1960 5.2800 2.2000 - 3.8500 9.2576
9/5/2012 1,009.1 117.8 4,513.4 77.6248 - - 4,240.6320 104.5528 23.5884 28.7936 9.0112 9.1960 5.1260 2.1340 - 3.7268 8.9760
9/6/2012 1,012.3 118.3 4,544.8 79.6048 - - 4,226.5608 118.6768 32.5908 37.8928 11.9328 12.9800 6.6880 3.2120 - 4.3120 10.3840
9/7/2012 1,010.6 118.0 4,525.9 78.4520 - - 4,234.2520 112.8424 27.2052 31.5568 9.9616 10.4500 5.4560 2.3980 - 3.9116 9.4336
9/8/2012 1,010.3 117.9 4,523.1 77.7568 - - 4,231.6560 115.4296 26.6508 30.8880 9.6448 10.0760 5.5440 2.4640 - 3.8192 9.1872
9/9/2012 1,011.1 118.1 4,533.0 78.0736 - - 4,226.5256 121.0440 28.2612 33.7920 10.1728 10.6480 5.7420 2.5960 - 4.7432 11.4400
9/10/2012 1,010.3 118.0 4,527.5 78.9272 - - 4,230.5032 114.9808 26.9808 32.5776 9.8384 10.3620 5.7420 2.5080 - 4.4352 10.6304
9/11/2012 1,009.8 118.0 4,523.5 79.0240 - - 4,235.7788 108.1784 25.7400 31.9616 9.5744 10.2300 5.5440 2.4420 - 4.4044 10.5952
9/12/2012 1,011.1 118.1 4,532.2 78.5664 - - 4,230.3492 116.3888 28.3932 33.7568 10.2960 11.0660 5.9400 2.6840 - 4.3428 10.4544
9/13/2012 1,009.2 117.8 4,513.0 76.7888 - - 4,237.3188 109.2080 23.3772 28.5648 8.8704 9.2180 5.2580 2.2440 - 3.5728 8.5536
9/14/2012 1,009.6 117.9 4,517.7 77.5852 - - 4,235.9064 111.1176 24.0372 29.6384 9.0816 9.3940 5.3460 2.2660 - 3.9116 9.4336
9/15/2012 1,009.8 117.9 4,520.5 78.0208 - - 4,234.0144 112.7104 24.8292 30.3600 9.0992 9.7020 5.3680 2.2880 - 4.1580 9.9968
9/16/2012 1,009.2 117.8 4,513.8 77.4312 - - 4,238.2076 108.0112 23.4036 28.7056 8.8352 9.1960 5.2580 2.2440 - 3.6652 8.8352
9/17/2012 1,009.4 117.8 4,516.0 77.7304 - - 4,237.3804 108.6888 23.8788 29.3216 9.0288 9.3720 5.2360 2.2000 - 3.8500 9.2928
9/18/2012 1,010.7 118.0 4,528.1 77.8360 - - 4,231.8100 115.1832 27.1128 32.5952 9.8560 10.5380 5.5880 2.4640 - 4.4352 10.6656
9/19/2012 1,010.7 118.0 4,526.3 76.2960 - - 4,236.8348 109.9472 26.6640 32.7712 9.8208 10.5820 5.6760 2.5080 - 4.4660 10.7712
9/20/2012 1,010.3 118.0 4,524.7 76.5292 - - 4,241.5912 103.1008 25.5156 33.3168 9.9264 10.5160 5.9180 2.5520 - 4.6200 11.1232
9/21/2012 1,011.8 118.1 4,538.3 77.5016 - - 4,231.4976 114.9368 30.0432 36.1328 10.9472 11.9020 6.1380 2.7280 - 4.8356 11.6160
9/22/2012 1,010.3 117.9 4,523.9 76.6744 - - 4,235.3432 110.8888 25.9776 32.0496 9.6624 10.0980 5.5660 2.3320 - 4.4968 10.8416
9/23/2012 1,009.8 117.9 4,522.0 77.8668 - - 4,232.6020 112.9304 25.2912 31.2576 9.3104 9.7900 5.3900 2.2660 - 4.4968 10.8416
9/24/2012 1,009.9 117.9 4,521.0 76.7448 - - 4,232.9056 114.4000 24.6840 30.7296 9.1520 9.5480 5.2360 2.1560 - 4.5276 10.8768
9/25/2012 1,010.2 117.9 4,520.4 76.6524 - - 4,231.5592 117.3040 25.3836 29.9376 9.3808 9.6800 5.4120 2.2000 - 3.7884 9.1168
9/26/2012 1,010.9 117.9 4,526.6 76.9868 - - 4,228.5540 120.9560 27.1524 31.4336 9.8384 10.3400 5.5220 2.3320 - 3.9732 9.5392
ERMTexas Registered Engineering Firm F-2393 Page 5 of 12
0189555\A5469 D.2 Historical Fuel Analyses.xls

TRPPTenaska Roans Prairie Generating Station
Grimes County, TexasHistorical Fuel Data and Statistical Analysis
Gas Day DateHeating Value
CO2 Intensity Total CO2 CO2 Cont O2 Cont N2 Cont Methane Cont
Ethane Cont Propane ContI Butane
ContN Butane
ContI Pentane
ContN Pentane
ContNeo Pentane
ContN Hexane
ContHeptane Cont Octane Cont
Stoichiometry (mol CO2 / Mol
component)1 0 0 1 2 3 4 4 5 5 5 6 7 8
9/27/2012 1,011.3 117.9 4,528.7 75.6404 - - 4,228.9544 121.7480 27.6012 32.0672 9.9264 10.3180 5.5660 2.3760 - 4.2504 10.2080
9/28/2012 1,010.2 117.9 4,521.6 77.5896 - - 4,231.1148 117.1632 26.0172 30.0432 9.4688 9.9220 5.3240 2.1560 - 3.7576 9.0112
9/29/2012 1,009.4 117.8 4,516.4 78.1792 - - 4,233.6888 113.0008 24.2352 28.8640 8.9232 9.2620 5.1040 2.0680 - 3.8192 9.2224
9/30/2012 1,009.4 117.9 4,517.5 77.7920 - - 4,233.8076 112.9656 23.7468 29.5856 8.9936 9.2840 5.2140 2.1340 - 4.0964 9.8912
10/1/2012 1,009.6 117.9 4,517.9 77.3080 - - 4,234.9120 112.0856 24.1032 29.6384 8.9408 9.3500 5.0820 2.0900 - 4.2196 10.1376
10/2/2012 1,009.5 117.8 4,516.4 76.6964 - - 4,235.9020 111.4168 23.6940 29.3216 8.8352 9.2180 5.0160 2.0900 - 4.1888 10.0672
10/3/2012 1,013.9 118.3 4,552.2 78.6632 - - 4,214.7996 140.0432 34.7556 35.8512 10.4368 12.2320 5.7420 2.8600 - 4.9280 11.8624
10/4/2012 1,010.3 117.9 4,523.9 78.1264 - - 4,230.9300 117.7792 25.4760 30.5008 9.1168 9.5480 5.1920 2.1560 - 4.4352 10.6656
10/5/2012 1,009.2 117.9 4,518.1 79.3188 - - 4,232.3512 113.4672 23.9712 29.4976 8.9936 9.2620 5.1260 2.0900 - 4.1272 9.9264
10/6/2012 1,009.6 117.9 4,518.5 77.4752 - - 4,233.2488 114.0568 23.9184 29.7616 8.9232 9.2840 5.2140 2.1340 - 4.2504 10.2080
10/7/2012 1,010.0 117.9 4,520.7 75.6404 - - 4,234.6348 113.6960 23.6808 30.9232 9.0112 9.2840 5.2580 2.1780 - 4.8048 11.5808
10/8/2012 1,010.0 117.9 4,520.5 75.2400 - - 4,234.9692 112.5696 23.7600 31.2928 9.0464 9.4380 5.3020 2.2220 - 4.8972 11.7568
10/9/2012 1,009.7 118.0 4,522.4 78.4652 - - 4,231.5108 115.4296 23.9580 30.8880 9.0464 9.2840 5.1920 2.0900 - 4.8356 11.6512
10/10/2012 1,010.0 117.9 4,520.9 77.1848 - - 4,231.2820 118.8528 23.5356 29.7440 8.8000 9.0860 5.0160 2.1120 - 4.4968 10.8064
10/11/2012 1,010.1 117.8 4,519.0 75.7592 - - 4,232.1400 118.4040 23.8656 29.3216 8.8880 9.0200 4.9940 2.0460 - 4.2812 10.2784
10/12/2012 1,010.0 117.9 4,521.5 77.7524 - - 4,230.9520 118.1928 24.5784 29.9024 9.2224 9.3060 5.1480 2.0460 - 4.2196 10.1376
10/13/2012 1,010.5 117.9 4,524.5 77.3344 - - 4,228.7916 122.0736 24.8820 30.4480 9.2048 9.4600 5.1920 2.1120 - 4.4044 10.6304
10/14/2012 1,010.4 117.9 4,523.4 76.7184 - - 4,231.5812 118.7032 24.4728 30.6064 9.1520 9.4600 5.1700 2.1340 - 4.5276 10.9120
10/15/2012 1,010.4 118.0 4,525.9 77.2156 - - 4,233.0948 115.1480 24.7104 32.1024 9.3808 9.6800 5.4560 2.3320 - 4.9280 11.8624
10/16/2012 1,011.2 118.0 4,528.5 75.9220 - - 4,230.6396 121.1584 25.2780 32.0320 9.3280 9.8780 5.4120 2.2880 - 4.8664 11.7216
10/17/2012 1,010.1 117.9 4,522.3 77.0528 - - 4,232.6548 116.4240 24.1296 30.5360 8.9232 9.3500 5.1700 2.1120 - 4.6816 11.2640
10/18/2012 1,011.1 117.9 4,526.5 75.1828 - - 4,235.6292 114.7168 25.7664 31.9616 9.4512 9.8780 5.4340 2.2880 - 4.7432 11.4400
10/19/2012 1,011.4 117.9 4,529.2 74.6416 - - 4,237.0240 113.9336 25.3440 33.1408 9.7328 9.9660 5.6320 2.2660 - 5.1436 12.3552
10/20/2012 1,011.6 118.0 4,532.1 75.2180 - - 4,233.6580 117.8848 25.8192 33.7216 9.9088 10.1860 5.7420 2.3540 - 5.1744 12.4608
10/21/2012 1,011.1 118.0 4,528.0 76.8240 - - 4,231.0312 121.2376 24.9876 31.5040 9.5040 9.5700 5.5000 2.2440 - 4.5892 11.0528
10/22/2012 1,012.7 118.2 4,543.9 77.6600 - - 4,221.8836 131.1728 29.5812 35.6400 10.7360 11.0880 6.0280 2.6180 - 5.1436 12.3552
10/23/2012 1,014.0 118.4 4,557.0 77.8008 - - 4,217.1800 135.8280 33.2508 39.4768 11.6512 12.1880 6.4460 3.0360 - 5.9136 14.2208
10/24/2012 1,011.3 117.9 4,527.5 75.0552 - - 4,234.3752 118.1840 24.7764 31.8736 9.4512 9.6140 5.3680 2.2440 - 4.8664 11.7216
10/25/2012 1,012.1 117.9 4,531.2 74.0212 - - 4,234.7976 119.2840 26.9280 32.5072 9.8560 10.2960 5.5000 2.3540 - 4.5892 11.0176
10/26/2012 1,014.2 118.2 4,553.2 75.5832 - - 4,225.4476 128.2688 33.3168 38.5792 11.1232 12.9360 6.0280 3.1020 - 5.5132 13.3056
10/27/2012 1,010.4 118.0 4,526.0 76.6876 - - 4,238.9072 107.8176 24.4596 32.9472 9.5392 9.6140 5.5000 2.2660 - 5.3592 12.8832
10/28/2012 1,010.3 118.0 4,527.3 77.7216 - - 4,238.7444 106.5504 24.7896 33.5632 9.8032 10.0100 5.5440 2.2000 - 5.3900 12.9536
10/29/2012 1,010.5 118.0 4,526.0 76.3840 - - 4,236.3904 111.2936 24.8292 32.6304 9.6096 9.7680 5.4780 2.2000 - 5.1128 12.2848
10/30/2012 1,019.4 118.9 4,600.4 78.6852 - - 4,193.3408 162.2896 52.5360 48.7344 14.8720 17.0720 7.5680 3.5420 - 6.3756 15.3472
10/31/2012 1,015.3 118.7 4,575.1 83.0280 - - 4,205.7092 144.0824 40.7088 43.3488 13.6224 13.4860 6.8860 2.8600 - 6.2832 15.1008
11/1/2012 1,013.3 118.5 4,559.0 79.1032 - - 4,223.8592 123.6048 31.0596 42.2928 11.4400 11.8360 6.5120 3.3220 - 7.6076 18.3392
11/2/2012 1,018.0 119.0 4,600.4 80.7752 - - 4,201.9076 149.3888 43.9428 52.6416 15.1888 16.3240 8.2500 4.1140 - 8.1620 19.6768
11/3/2012 1,020.8 119.4 4,628.4 81.6728 - - 4,183.3572 170.1392 51.4140 59.9104 16.7904 18.6560 9.2620 5.1260 - 9.3940 22.6336
11/4/2012 1,021.0 119.5 4,630.5 81.7564 - - 4,182.1824 171.8728 51.3216 60.3856 16.6848 18.4580 9.2400 5.0600 - 9.8560 23.7248
11/5/2012 1,021.0 119.5 4,631.2 81.8268 - - 4,182.3276 171.2920 51.2028 60.8256 16.7552 18.5460 9.3280 5.0160 - 10.0100 24.0768
11/6/2012 1,020.8 119.4 4,628.6 81.7520 - - 4,182.7280 171.5208 51.0576 59.6992 16.6848 18.2820 9.2180 4.9280 - 9.6096 23.1616
11/7/2012 1,021.0 119.5 4,631.2 81.7960 - - 4,182.4508 171.7056 51.0576 60.5616 16.5616 18.2160 9.2840 4.9500 - 10.1640 24.4640
11/8/2012 1,021.0 119.5 4,630.9 81.6860 - - 4,182.3584 172.0752 51.0576 60.4208 16.6320 18.3040 9.1080 4.9720 - 10.0716 24.2528
11/9/2012 1,021.2 119.5 4,633.1 81.6376 - - 4,182.5872 171.5824 51.3216 61.2656 16.7376 18.5460 9.3060 4.9060 - 10.3180 24.8512
11/10/2012 1,009.2 118.1 4,525.4 82.0292 - - 4,224.1144 119.9704 24.8952 31.4160 9.1520 9.4380 5.1700 2.0900 - 5.0204 12.0736
11/11/2012 1,010.2 118.1 4,529.5 78.9272 - - 4,228.6816 117.4184 25.3176 33.3872 9.6624 9.9000 5.4340 2.2440 - 5.4516 13.0944
11/12/2012 1,010.2 118.1 4,529.4 79.4112 - - 4,228.6464 117.4272 25.2516 33.1408 9.4688 9.7460 5.5000 2.2660 - 5.4516 13.0944
11/13/2012 1,010.0 118.1 4,530.3 80.0052 - - 4,232.7208 111.1176 25.3572 34.1264 9.7680 9.9880 5.5880 2.3100 - 5.6672 13.6224
11/14/2012 1,027.9 119.7 4,672.2 79.9568 - - 4,157.1948 211.9656 70.6596 65.0496 19.6416 21.8020 9.5480 4.9280 - 9.2400 22.2112
11/15/2012 1,014.8 118.5 4,567.3 79.7236 - - 4,216.5376 133.4432 37.1844 42.6096 12.6896 13.2440 6.7760 3.0140 - 6.4680 15.5936
11/16/2012 1,012.8 118.4 4,551.6 80.1988 - - 4,223.9384 124.4496 31.4028 38.6672 11.1760 11.4620 6.3360 2.7720 - 6.2216 14.9600
11/17/2012 1,011.0 118.2 4,537.8 80.2780 - - 4,231.2820 113.8808 27.3636 35.8688 10.4192 10.5600 5.8740 2.4640 - 5.8212 14.0096
11/18/2012 1,011.0 118.2 4,537.4 80.2340 - - 4,231.3612 113.8720 27.4164 35.7280 10.4368 10.6260 5.8740 2.4640 - 5.6980 13.7280
11/19/2012 1,010.3 118.2 4,533.7 80.2648 - - 4,236.8040 106.1280 25.6344 35.6576 9.9264 10.6040 5.9180 2.4420 - 5.9444 14.3264
ERMTexas Registered Engineering Firm F-2393 Page 6 of 12
0189555\A5469 D.2 Historical Fuel Analyses.xls

TRPPTenaska Roans Prairie Generating Station
Grimes County, TexasHistorical Fuel Data and Statistical Analysis
Gas Day DateHeating Value
CO2 Intensity Total CO2 CO2 Cont O2 Cont N2 Cont Methane Cont
Ethane Cont Propane ContI Butane
ContN Butane
ContI Pentane
ContN Pentane
ContNeo Pentane
ContN Hexane
ContHeptane Cont Octane Cont
Stoichiometry (mol CO2 / Mol
component)1 0 0 1 2 3 4 4 5 5 5 6 7 8
11/20/2012 1,009.1 118.2 4,528.5 83.5428 - - 4,230.4064 110.5544 24.8556 33.3168 9.5040 9.7900 5.4120 2.3320 - 5.5132 13.2704
11/21/2012 1,009.2 118.1 4,526.5 82.0644 - - 4,228.9368 113.9072 24.3408 32.4368 9.1344 9.4380 5.3020 2.1340 - 5.5132 13.3056
11/22/2012 1,008.5 118.0 4,519.8 81.0216 - - 4,231.5724 110.2112 22.8888 31.1696 8.8176 9.1300 5.1480 2.1340 - 5.2052 12.4960
11/23/2012 1,008.5 118.0 4,518.2 80.9688 - - 4,233.2708 108.3984 23.1924 30.5184 8.8000 9.0420 5.0160 2.0240 - 4.9896 12.0032
11/24/2012 1,008.7 118.0 4,519.4 80.3660 - - 4,232.5932 110.1848 23.1528 30.7824 8.8352 9.1080 5.0820 2.0240 - 5.0512 12.1792
11/25/2012 1,008.5 117.9 4,516.1 79.9172 - - 4,233.3368 110.0000 22.5456 29.5680 8.5008 8.7120 4.7960 1.8920 - 4.9280 11.8624
11/26/2012 1,008.4 117.9 4,515.7 80.5992 - - 4,233.6800 109.3576 22.7568 29.3040 8.5888 8.8660 4.8620 1.9140 - 4.6200 11.1232
11/27/2012 1,009.6 118.0 4,522.6 78.2804 - - 4,231.9288 113.8808 24.0108 31.4864 9.1168 9.3940 5.2800 2.1340 - 5.0204 12.1088
11/28/2012 1,009.6 118.0 4,522.6 78.2804 - - 4,231.9288 113.8808 24.0108 31.4864 9.1168 9.3940 5.2800 2.1340 - 5.0204 12.1088
Max 120.6 Avg 118.2 STD DEV 0.45317431AVG + 1 118.63 AVG + 2 119.08 AVG + 3 119.54 Rounded 120.00
ERMTexas Registered Engineering Firm F-2393 Page 7 of 12
0189555\A5469 D.2 Historical Fuel Analyses.xls

TRPPTenaska Roans Prairie Generating Station
Grimes County, TexasHistorical Fuel Data and Statistical Analysis
Heating Value
Gravity Wobbe Co2 Cont O2 Cont N2 Cont Methane Cont Ethane Cont Propane Cont C4+ Content I Butane Cont N Butane Cont
I Pentane Cont
N Pentane Cont
Neo Pentane Cont
N Hexane Cont
C6 Plus Cont Heptane Cont Octane Cont PressBase
(Btu/SCF, HHV)
(dimensionless)
(Btu/SCF, HHV)
(mol%) (mol%) (mol%) (mol%) (mol%) (mol%) (mol%) (mol%) (mol%) (mol%) (mol%) (mol%) (mol%) (mol%) (mol%) (mol%) (psia)
Min 1,006.2 0.5790 1,317.8 1.5900 - 0.1461 94.3288 0.7031 0.1252 0.1137 0.0399 0.0315 0.0009 0.0081 - 0.0107 0.0226 0.0080 0.0039 14.7
Average 1,012.0 0.5854 1,322.8 1.7669 - 0.3261 96.1763 1.3164 0.2222 0.2084 0.0620 0.0514 0.0279 0.0126 - 0.0176 0.0370 0.0131 0.0064 14.7
Max 1,030.1 0.6010 1,330.4 2.1667 - 0.4397 97.1713 2.4087 0.6112 0.5085 0.1405 0.1402 0.0620 0.0332 - 0.0427 0.0899 0.0318 0.0155 14.7
1/1/2012 1,010.7 0.5823 1,324.5 1.7123 - 0.2262 96.6662 1.0287 0.1816 0.2043 0.0567 0.0464 0.0305 0.0111 - 0.0192 0.0404 0.0143 0.0069 14.7301/2/2012 1,015.4 0.5832 1,329.6 1.6147 - 0.1538 96.3992 1.4898 0.1682 0.1913 0.0544 0.0430 0.0262 0.0122 - 0.0179 0.0376 0.0133 0.0065 14.7301/3/2012 1,009.4 0.5813 1,323.9 1.7298 - 0.1584 96.8983 0.8837 0.1595 0.1890 0.0517 0.0406 0.0245 0.0103 - 0.0199 0.0420 0.0148 0.0072 14.7301/4/2012 1,009.3 0.5809 1,324.2 1.7155 - 0.1534 96.9553 0.8503 0.1565 0.1878 0.0513 0.0401 0.0243 0.0107 - 0.0198 0.0416 0.0147 0.0071 14.7301/5/2012 1,009.8 0.5818 1,323.9 1.7182 - 0.1965 96.7994 0.9451 0.1667 0.1923 0.0532 0.0420 0.0259 0.0116 - 0.0192 0.0404 0.0143 0.0069 14.7301/6/2012 1,009.5 0.5830 1,322.1 1.7940 - 0.2092 96.6390 1.0102 0.1721 0.1941 0.0543 0.0417 0.0251 0.0114 - 0.0198 0.0418 0.0148 0.0072 14.7301/7/2012 1,011.6 0.5847 1,322.9 1.7864 - 0.2621 96.3654 1.1840 0.1994 0.2240 0.0626 0.0488 0.0286 0.0135 - 0.0227 0.0478 0.0169 0.0082 14.7301/8/2012 1,011.9 0.5849 1,323.1 1.7765 - 0.2760 96.3324 1.2071 0.2026 0.2266 0.0633 0.0499 0.0291 0.0135 - 0.0228 0.0480 0.0170 0.0083 14.7301/9/2012 1,011.4 0.5847 1,322.7 1.7674 - 0.2962 96.3382 1.2042 0.1952 0.2202 0.0609 0.0475 0.0282 0.0132 - 0.0227 0.0477 0.0169 0.0082 14.7301/10/2012 1,012.2 0.5857 1,322.6 1.8188 - 0.2684 96.2522 1.2354 0.2093 0.2387 0.0670 0.0511 0.0307 0.0142 - 0.0244 0.0513 0.0181 0.0088 14.7301/11/2012 1,008.6 0.5820 1,322.1 1.7593 - 0.2307 96.7331 0.9559 0.1608 0.1765 0.0503 0.0391 0.0231 0.0102 - 0.0173 0.0365 0.0129 0.0063 14.7301/12/2012 1,011.5 0.5847 1,322.8 1.8090 - 0.2340 96.4186 1.1281 0.1995 0.2337 0.0643 0.0505 0.0297 0.0138 - 0.0243 0.0511 0.0181 0.0088 14.7301/13/2012 1,009.4 0.5848 1,320.0 1.9173 - 0.1972 96.4628 1.0426 0.1858 0.2143 0.0617 0.0458 0.0282 0.0124 - 0.0213 0.0449 0.0159 0.0077 14.7301/14/2012 1,008.2 0.5853 1,317.8 2.0159 - 0.1679 96.4326 1.0153 0.1786 0.2092 0.0623 0.0435 0.0274 0.0111 - 0.0209 0.0440 0.0155 0.0076 14.7301/15/2012 1,010.0 0.5862 1,319.2 1.9844 - 0.1919 96.3120 1.1004 0.1982 0.2356 0.0679 0.0492 0.0303 0.0131 - 0.0242 0.0509 0.0180 0.0088 14.7301/16/2012 1,011.9 0.5868 1,321.0 1.9178 - 0.2431 96.1819 1.2158 0.2077 0.2607 0.0692 0.0535 0.0323 0.0159 - 0.0289 0.0609 0.0215 0.0105 14.7301/17/2012 1,012.7 0.5871 1,321.7 1.8863 - 0.2648 96.1279 1.2654 0.2128 0.2710 0.0713 0.0555 0.0332 0.0171 - 0.0302 0.0637 0.0225 0.0110 14.7301/18/2012 1,009.8 0.5848 1,320.5 1.8971 - 0.2093 96.4510 1.0595 0.1825 0.2229 0.0611 0.0463 0.0282 0.0133 - 0.0238 0.0502 0.0177 0.0086 14.7301/19/2012 1,009.9 0.5828 1,322.9 1.7891 - 0.1770 96.7286 0.9458 0.1705 0.2106 0.0564 0.0437 0.0261 0.0126 - 0.0231 0.0487 0.0172 0.0084 14.7301/20/2012 1,009.5 0.5812 1,324.2 1.7184 - 0.1602 96.9173 0.8676 0.1623 0.1930 0.0525 0.0416 0.0255 0.0115 - 0.0199 0.0420 0.0148 0.0072 14.7301/21/2012 1,010.0 0.5831 1,322.7 1.7603 - 0.2416 96.5889 1.0530 0.1785 0.1963 0.0550 0.0433 0.0261 0.0116 - 0.0194 0.0409 0.0145 0.0070 14.7301/22/2012 1,009.8 0.5832 1,322.3 1.7586 - 0.2659 96.5557 1.0716 0.1732 0.1938 0.0533 0.0421 0.0255 0.0110 - 0.0199 0.0420 0.0148 0.0072 14.7301/23/2012 1,009.2 0.5830 1,321.7 1.7766 - 0.2589 96.5709 1.0555 0.1723 0.1820 0.0530 0.0411 0.0239 0.0105 - 0.0172 0.0363 0.0128 0.0062 14.7301/24/2012 1,008.9 0.5835 1,320.8 1.8375 - 0.2275 96.5724 1.0182 0.1699 0.1930 0.0544 0.0413 0.0251 0.0113 - 0.0196 0.0413 0.0146 0.0071 14.7301/25/2012 1,008.1 0.5800 1,323.7 1.7015 - 0.1547 97.0614 0.7922 0.1410 0.1652 0.0454 0.0358 0.0218 0.0097 - 0.0169 0.0356 0.0126 0.0061 14.7301/26/2012 1,009.3 0.5825 1,322.4 1.7953 - 0.1787 96.7473 0.9302 0.1699 0.1974 0.0551 0.0428 0.0261 0.0116 - 0.0199 0.0419 0.0148 0.0072 14.7301/27/2012 1,009.2 0.5826 1,322.2 1.8044 - 0.1724 96.7538 0.9209 0.1689 0.1994 0.0542 0.0426 0.0257 0.0116 - 0.0210 0.0443 0.0157 0.0076 14.7301/28/2012 1,008.5 0.5813 1,322.7 1.7598 - 0.1622 96.9073 0.8552 0.1548 0.1780 0.0495 0.0387 0.0231 0.0105 - 0.0181 0.0381 0.0135 0.0066 14.7301/29/2012 1,006.2 0.5795 1,321.8 1.7498 - 0.1461 97.1457 0.7031 0.1252 0.1448 0.0399 0.0315 0.0183 0.0081 - 0.0151 0.0319 0.0113 0.0055 14.7301/30/2012 1,008.1 0.5790 1,324.8 1.6328 - 0.1615 97.1713 0.7630 0.1325 0.1545 0.0425 0.0330 0.0196 0.0084 - 0.0164 0.0346 0.0122 0.0059 14.7301/31/2012 1,011.4 0.5818 1,326.0 1.6448 - 0.2131 96.7570 1.0240 0.1798 0.1998 0.0564 0.0444 0.0266 0.0115 - 0.0196 0.0413 0.0146 0.0071 14.7302/1/2012 1,011.0 0.5824 1,324.8 1.6739 - 0.2472 96.6461 1.0733 0.1818 0.1949 0.0561 0.0447 0.0259 0.0111 - 0.0184 0.0387 0.0137 0.0066 14.7302/2/2012 1,011.2 0.5828 1,324.6 1.6663 - 0.2867 96.5401 1.1423 0.1879 0.1929 0.0570 0.0448 0.0259 0.0111 - 0.0174 0.0367 0.0130 0.0063 14.7302/3/2012 1,011.4 0.5828 1,324.8 1.6772 - 0.2531 96.5930 1.1045 0.1895 0.2006 0.0581 0.0453 0.0262 0.0117 - 0.0191 0.0402 0.0142 0.0069 14.7302/4/2012 1,012.0 0.5810 1,327.7 1.5900 - 0.1828 96.8747 0.9885 0.1812 0.2006 0.0574 0.0450 0.0270 0.0119 - 0.0191 0.0402 0.0142 0.0069 14.7302/5/2012 1,011.5 0.5811 1,326.9 1.6234 - 0.1749 96.8744 0.9674 0.1775 0.2011 0.0565 0.0444 0.0270 0.0120 - 0.0197 0.0415 0.0147 0.0071 14.7302/6/2012 1,010.8 0.5811 1,326.0 1.6485 - 0.1734 96.8925 0.9369 0.1722 0.1946 0.0549 0.0431 0.0259 0.0114 - 0.0191 0.0402 0.0142 0.0069 14.7302/7/2012 1,010.4 0.5811 1,325.5 1.6715 - 0.1643 96.9153 0.9056 0.1680 0.1941 0.0537 0.0424 0.0253 0.0112 - 0.0198 0.0417 0.0147 0.0072 14.7302/8/2012 1,009.2 0.5802 1,324.9 1.6706 - 0.1537 97.0383 0.8237 0.1526 0.1785 0.0489 0.0385 0.0235 0.0104 - 0.0184 0.0388 0.0137 0.0067 14.7302/9/2012 1,010.1 0.5822 1,323.8 1.6747 - 0.2821 96.6421 1.0674 0.1675 0.1836 0.0517 0.0400 0.0241 0.0106 - 0.0184 0.0388 0.0137 0.0067 14.7302/10/2012 1,009.1 0.5808 1,324.1 1.6662 - 0.2185 96.8871 0.9227 0.1524 0.1702 0.0471 0.0364 0.0218 0.0095 - 0.0178 0.0376 0.0133 0.0065 14.7302/11/2012 1,011.6 0.5831 1,324.8 1.7448 - 0.1741 96.6501 1.0343 0.1961 0.2207 0.0633 0.0488 0.0295 0.0129 - 0.0213 0.0449 0.0159 0.0077 14.7302/12/2012 1,011.1 0.5843 1,322.7 1.8309 - 0.1803 96.5170 1.0672 0.1996 0.2252 0.0650 0.0494 0.0308 0.0133 - 0.0215 0.0452 0.0160 0.0078 14.7302/13/2012 1,011.3 0.5826 1,324.9 1.7209 - 0.1738 96.7269 0.9964 0.1870 0.2151 0.0601 0.0472 0.0287 0.0124 - 0.0215 0.0452 0.0160 0.0078 14.7302/14/2012 1,011.8 0.5831 1,325.0 1.6820 - 0.2540 96.5564 1.1264 0.1914 0.2086 0.0597 0.0464 0.0279 0.0121 - 0.0201 0.0424 0.0150 0.0073 14.7302/15/2012 1,011.9 0.5833 1,324.9 1.6873 - 0.2622 96.5097 1.1558 0.1943 0.2095 0.0600 0.0468 0.0276 0.0123 - 0.0202 0.0426 0.0151 0.0073 14.7302/16/2012 1,012.5 0.5847 1,324.1 1.7528 - 0.2556 96.3827 1.1925 0.2019 0.2388 0.0641 0.0502 0.0304 0.0143 - 0.0257 0.0541 0.0191 0.0093 14.7302/17/2012 1,011.8 0.5836 1,324.5 1.7260 - 0.2325 96.5377 1.1135 0.1915 0.2207 0.0604 0.0468 0.0288 0.0126 - 0.0232 0.0489 0.0173 0.0084 14.7302/18/2012 1,010.7 0.5834 1,323.2 1.7622 - 0.2282 96.5633 1.0744 0.1821 0.2104 0.0576 0.0449 0.0279 0.0125 - 0.0217 0.0458 0.0162 0.0079 14.7302/19/2012 1,010.9 0.5837 1,323.2 1.7406 - 0.2723 96.4758 1.1414 0.1847 0.2051 0.0566 0.0440 0.0273 0.0122 - 0.0209 0.0441 0.0156 0.0076 14.7302/20/2012 1,011.2 0.5837 1,323.6 1.7355 - 0.2649 96.4875 1.1358 0.1874 0.2093 0.0573 0.0452 0.0280 0.0121 - 0.0215 0.0452 0.0160 0.0078 14.7302/21/2012 1,011.4 0.5835 1,324.0 1.7181 - 0.2574 96.5136 1.1341 0.1880 0.2091 0.0576 0.0449 0.0278 0.0120 - 0.0215 0.0453 0.0160 0.0078 14.7302/22/2012 1,010.3 0.5831 1,323.1 1.7077 - 0.3061 96.4917 1.1525 0.1756 0.1836 0.0519 0.0403 0.0244 0.0104 - 0.0182 0.0384 0.0136 0.0066 14.7302/23/2012 1,011.1 0.5835 1,323.7 1.6797 - 0.3385 96.3900 1.2381 0.1849 0.1851 0.0541 0.0423 0.0243 0.0103 - 0.0174 0.0367 0.0130 0.0063 14.7302/24/2012 1,012.3 0.5843 1,324.3 1.6941 - 0.3209 96.3275 1.2629 0.2028 0.2115 0.0599 0.0467 0.0277 0.0123 - 0.0209 0.0440 0.0155 0.0076 14.7302/25/2012 1,012.0 0.5836 1,324.7 1.6641 - 0.3173 96.3998 1.2409 0.1941 0.2019 0.0578 0.0453 0.0270 0.0118 - 0.0193 0.0407 0.0144 0.0070 14.7302/26/2012 1,012.1 0.5833 1,325.2 1.6331 - 0.3297 96.4260 1.2405 0.1916 0.1971 0.0564 0.0445 0.0259 0.0113 - 0.0190 0.0400 0.0141 0.0069 14.7302/27/2012 1,012.0 0.5832 1,325.2 1.6328 - 0.3275 96.4390 1.2321 0.1897 0.1972 0.0559 0.0442 0.0261 0.0113 - 0.0192 0.0405 0.0143 0.0070 14.7302/28/2012 1,014.2 0.5848 1,326.2 1.6501 - 0.3213 96.2395 1.3474 0.2329 0.2288 0.0668 0.0534 0.0298 0.0126 - 0.0213 0.0449 0.0159 0.0077 14.7302/29/2012 1,012.9 0.5845 1,324.9 1.7117 - 0.2732 96.3561 1.2398 0.2171 0.2223 0.0640 0.0504 0.0291 0.0124 - 0.0214 0.0450 0.0159 0.0077 14.7303/1/2012 1,011.6 0.5835 1,324.3 1.6974 - 0.2773 96.4794 1.1665 0.1940 0.2040 0.0583 0.0461 0.0270 0.0114 - 0.0197 0.0415 0.0147 0.0071 14.7303/2/2012 1,013.4 0.5857 1,324.2 1.7493 - 0.2983 96.1775 1.3247 0.2376 0.2321 0.0681 0.0551 0.0304 0.0135 - 0.0209 0.0441 0.0156 0.0076 14.7303/3/2012 1,011.9 0.5848 1,323.2 1.7371 - 0.3233 96.2617 1.2804 0.2083 0.2072 0.0601 0.0479 0.0276 0.0122 - 0.0191 0.0403 0.0142 0.0069 14.730
Gas Day Date
ERMTexas Registered Engineering Firm F-2393 Page 8 of 12
0189555\A5469 D.2 Historical Fuel Analyses.xls

Heating Value
Gravity Wobbe Co2 Cont O2 Cont N2 Cont Methane Cont Ethane Cont Propane Cont C4+ Content I Butane Cont N Butane Cont
I Pentane Cont
N Pentane Cont
Neo Pentane Cont
N Hexane Cont
C6 Plus Cont Heptane Cont Octane Cont PressBase
(Btu/SCF, HHV)
(dimensionless)
(Btu/SCF, HHV)
(mol%) (mol%) (mol%) (mol%) (mol%) (mol%) (mol%) (mol%) (mol%) (mol%) (mol%) (mol%) (mol%) (mol%) (mol%) (mol%) (psia)
Min 1,006.2 0.5790 1,317.8 1.5900 - 0.1461 94.3288 0.7031 0.1252 0.1137 0.0399 0.0315 0.0009 0.0081 - 0.0107 0.0226 0.0080 0.0039 14.7
Average 1,012.0 0.5854 1,322.8 1.7669 - 0.3261 96.1763 1.3164 0.2222 0.2084 0.0620 0.0514 0.0279 0.0126 - 0.0176 0.0370 0.0131 0.0064 14.7
Max 1,030.1 0.6010 1,330.4 2.1667 - 0.4397 97.1713 2.4087 0.6112 0.5085 0.1405 0.1402 0.0620 0.0332 - 0.0427 0.0899 0.0318 0.0155 14.7
Gas Day Date
3/4/2012 1,011.3 0.5839 1,323.5 1.6945 - 0.3402 96.3465 1.2543 0.1896 0.1922 0.0549 0.0439 0.0254 0.0111 - 0.0183 0.0386 0.0136 0.0066 14.7303/5/2012 1,011.9 0.5842 1,323.9 1.7004 - 0.3284 96.3098 1.2795 0.1999 0.1995 0.0581 0.0457 0.0263 0.0114 - 0.0187 0.0393 0.0139 0.0068 14.7303/6/2012 1,014.3 0.5882 1,322.5 1.8498 - 0.3309 95.8623 1.4460 0.2712 0.2613 0.0770 0.0625 0.0341 0.0157 - 0.0232 0.0488 0.0172 0.0084 14.7303/7/2012 1,016.4 0.5891 1,324.3 1.7949 - 0.3656 95.7093 1.5815 0.2956 0.2793 0.0770 0.0653 0.0329 0.0169 - 0.0281 0.0591 0.0209 0.0102 14.7303/8/2012 1,017.6 0.5900 1,324.8 1.7814 - 0.4050 95.5119 1.7295 0.3175 0.2788 0.0803 0.0678 0.0345 0.0164 - 0.0257 0.0541 0.0191 0.0093 14.7303/9/2012 1,013.2 0.5864 1,323.1 1.7236 - 0.4199 95.9486 1.4769 0.2326 0.2172 0.0633 0.0512 0.0281 0.0127 - 0.0199 0.0420 0.0148 0.0072 14.7303/10/2012 1,013.5 0.5862 1,323.7 1.7161 - 0.3898 96.0108 1.4439 0.2341 0.2243 0.0644 0.0548 0.0295 0.0134 - 0.0200 0.0422 0.0149 0.0073 14.7303/11/2012 1,011.6 0.5848 1,322.8 1.7108 - 0.3876 96.1794 1.3438 0.1997 0.1966 0.0562 0.0453 0.0255 0.0111 - 0.0188 0.0397 0.0140 0.0068 14.7303/12/2012 1,014.7 0.5874 1,323.9 1.7426 - 0.3906 95.8450 1.5436 0.2616 0.2370 0.0694 0.0571 0.0298 0.0136 - 0.0216 0.0455 0.0161 0.0078 14.7303/13/2012 1,018.9 0.5913 1,325.0 1.7936 - 0.4327 95.3252 1.8243 0.3452 0.3035 0.0890 0.0764 0.0381 0.0187 - 0.0262 0.0551 0.0195 0.0095 14.7303/14/2012 1,018.0 0.5909 1,324.3 1.7978 - 0.4397 95.4053 1.7605 0.3172 0.3050 0.0873 0.0735 0.0389 0.0192 - 0.0277 0.0584 0.0206 0.0100 14.7303/15/2012 1,020.1 0.5920 1,325.8 1.7956 - 0.4247 95.2741 1.8447 0.3594 0.3294 0.0948 0.0808 0.0402 0.0205 - 0.0300 0.0631 0.0223 0.0108 14.7303/16/2012 1,020.3 0.5923 1,325.7 1.8184 - 0.4089 95.2201 1.8825 0.3756 0.3201 0.0955 0.0817 0.0389 0.0184 - 0.0276 0.0580 0.0205 0.0100 14.7303/17/2012 1,021.0 0.5918 1,327.2 1.7633 - 0.3949 95.3142 1.8467 0.3703 0.3370 0.0977 0.0868 0.0426 0.0216 - 0.0284 0.0599 0.0212 0.0103 14.7303/18/2012 1,020.6 0.5916 1,326.9 1.7684 - 0.4000 95.3328 1.8275 0.3671 0.3303 0.0968 0.0848 0.0418 0.0200 - 0.0280 0.0589 0.0208 0.0101 14.7303/19/2012 1,021.1 0.5921 1,327.0 1.7686 - 0.4121 95.2669 1.8576 0.3792 0.3413 0.1007 0.0885 0.0446 0.0217 - 0.0276 0.0582 0.0206 0.0100 14.7303/20/2012 1,018.0 0.5890 1,326.4 1.7147 - 0.3911 95.6643 1.6538 0.3121 0.2881 0.0841 0.0704 0.0370 0.0170 - 0.0256 0.0540 0.0191 0.0093 14.7303/21/2012 1,014.1 0.5860 1,324.7 1.6875 - 0.3821 96.0340 1.4466 0.2399 0.2298 0.0662 0.0549 0.0297 0.0134 - 0.0211 0.0445 0.0157 0.0077 14.7303/22/2012 1,017.7 0.5893 1,325.7 1.7404 - 0.3928 95.6476 1.6416 0.3089 0.2942 0.0840 0.0709 0.0369 0.0176 - 0.0273 0.0575 0.0203 0.0099 14.7303/23/2012 1,018.1 0.5895 1,326.0 1.7388 - 0.3949 95.6286 1.6438 0.3150 0.3045 0.0867 0.0750 0.0388 0.0188 - 0.0274 0.0578 0.0204 0.0099 14.7303/24/2012 1,014.3 0.5862 1,324.8 1.7043 - 0.3616 96.0420 1.4327 0.2436 0.2363 0.0680 0.0555 0.0309 0.0136 - 0.0220 0.0463 0.0164 0.0080 14.7303/25/2012 1,013.2 0.5850 1,324.7 1.6841 - 0.3507 96.1881 1.3568 0.2236 0.2148 0.0626 0.0507 0.0287 0.0126 - 0.0194 0.0408 0.0144 0.0070 14.7303/26/2012 1,013.9 0.5852 1,325.4 1.6642 - 0.3503 96.1742 1.3777 0.2286 0.2252 0.0642 0.0524 0.0290 0.0128 - 0.0215 0.0453 0.0160 0.0078 14.7303/27/2012 1,012.1 0.5846 1,323.7 1.7288 - 0.3124 96.3043 1.2501 0.2108 0.2136 0.0596 0.0484 0.0273 0.0124 - 0.0212 0.0447 0.0158 0.0077 14.7303/28/2012 1,012.4 0.5832 1,325.7 1.6308 - 0.3133 96.4340 1.2501 0.1904 0.1988 0.0570 0.0451 0.0269 0.0120 - 0.0186 0.0392 0.0139 0.0067 14.7303/29/2012 1,012.8 0.5828 1,326.7 1.6132 - 0.2721 96.5503 1.1759 0.1970 0.2102 0.0601 0.0475 0.0282 0.0123 - 0.0200 0.0421 0.0149 0.0072 14.7303/30/2012 1,012.6 0.5833 1,325.8 1.6318 - 0.2993 96.4531 1.2294 0.1979 0.2067 0.0596 0.0472 0.0278 0.0119 - 0.0194 0.0408 0.0144 0.0070 14.7303/31/2012 1,012.7 0.5831 1,326.2 1.6144 - 0.3019 96.4754 1.2250 0.1977 0.2034 0.0593 0.0466 0.0275 0.0117 - 0.0188 0.0395 0.0140 0.0068 14.7304/1/2012 1,012.1 0.5831 1,325.4 1.6271 - 0.3169 96.4520 1.2340 0.1931 0.1929 0.0576 0.0452 0.0261 0.0111 - 0.0170 0.0359 0.0127 0.0062 14.7304/2/2012 1,011.5 0.5835 1,324.2 1.6674 - 0.3369 96.3743 1.2591 0.1911 0.1869 0.0556 0.0437 0.0251 0.0106 - 0.0167 0.0352 0.0124 0.0061 14.7304/3/2012 1,016.9 0.5883 1,325.8 1.7535 - 0.3315 95.7907 1.5671 0.3099 0.2669 0.0815 0.0690 0.0349 0.0154 - 0.0213 0.0448 0.0158 0.0077 14.7304/4/2012 1,019.2 0.5916 1,325.1 1.8442 - 0.3607 95.3911 1.7422 0.3644 0.3196 0.0980 0.0851 0.0426 0.0191 - 0.0241 0.0507 0.0179 0.0087 14.7304/5/2012 1,012.4 0.5850 1,323.7 1.7043 - 0.3588 96.1935 1.3409 0.2120 0.2093 0.0602 0.0479 0.0272 0.0118 - 0.0200 0.0422 0.0149 0.0073 14.7304/6/2012 1,011.2 0.5840 1,323.2 1.6878 - 0.3665 96.3009 1.2855 0.1866 0.1902 0.0543 0.0428 0.0253 0.0106 - 0.0184 0.0388 0.0137 0.0067 14.7304/7/2012 1,011.3 0.5836 1,323.8 1.6613 - 0.3636 96.3481 1.2740 0.1839 0.1856 0.0539 0.0422 0.0245 0.0104 - 0.0176 0.0370 0.0131 0.0064 14.7304/8/2012 1,011.6 0.5834 1,324.4 1.6445 - 0.3510 96.3764 1.2732 0.1837 0.1880 0.0541 0.0427 0.0250 0.0106 - 0.0179 0.0377 0.0133 0.0065 14.7304/9/2012 1,011.4 0.5835 1,324.0 1.6517 - 0.3603 96.3636 1.2688 0.1844 0.1877 0.0544 0.0429 0.0252 0.0108 - 0.0175 0.0369 0.0130 0.0063 14.7304/10/2012 1,011.6 0.5835 1,324.3 1.6507 - 0.3491 96.3725 1.2685 0.1856 0.1904 0.0554 0.0432 0.0256 0.0108 - 0.0178 0.0376 0.0133 0.0065 14.7304/11/2012 1,011.2 0.5836 1,323.7 1.6818 - 0.3389 96.3682 1.2567 0.1848 0.1857 0.0545 0.0423 0.0250 0.0105 - 0.0172 0.0362 0.0128 0.0062 14.7304/12/2012 1,010.6 0.5839 1,322.5 1.7307 - 0.3307 96.3491 1.2340 0.1841 0.1881 0.0549 0.0429 0.0251 0.0106 - 0.0176 0.0370 0.0131 0.0064 14.7304/13/2012 1,010.3 0.5847 1,321.2 1.7826 - 0.3424 96.2361 1.2803 0.1888 0.1849 0.0551 0.0442 0.0250 0.0103 - 0.0162 0.0341 0.0121 0.0059 14.7304/14/2012 1,010.0 0.5844 1,321.2 1.7855 - 0.3304 96.2922 1.2383 0.1850 0.1843 0.0547 0.0430 0.0248 0.0102 - 0.0166 0.0350 0.0124 0.0060 14.7304/15/2012 1,010.0 0.5844 1,321.2 1.7850 - 0.3308 96.2905 1.2413 0.1850 0.1826 0.0546 0.0426 0.0245 0.0103 - 0.0163 0.0343 0.0121 0.0059 14.7304/16/2012 1,009.2 0.5839 1,320.7 1.7854 - 0.3269 96.3180 1.2439 0.1854 0.1523 0.0537 0.0418 0.0012 0.0128 - 0.0138 0.0290 0.0102 0.0050 14.7304/17/2012 1,009.2 0.5839 1,320.7 1.7854 - 0.3269 96.3182 1.2441 0.1854 0.1518 0.0537 0.0418 0.0009 0.0128 - 0.0137 0.0289 0.0102 0.0050 14.7304/18/2012 1,009.2 0.5839 1,320.7 1.7854 - 0.3269 96.3182 1.2441 0.1854 0.1518 0.0537 0.0418 0.0009 0.0128 - 0.0137 0.0289 0.0102 0.0050 14.7304/19/2012 1,011.7 0.5850 1,322.7 1.7656 - 0.3110 96.3244 1.2161 0.1862 0.2308 0.0503 0.0423 0.0171 0.0111 - 0.0354 0.0746 0.0263 0.0128 14.7304/20/2012 1,010.0 0.5845 1,321.1 1.7759 - 0.3506 96.2762 1.2429 0.1857 0.1844 0.0550 0.0427 0.0248 0.0101 - 0.0167 0.0351 0.0124 0.0060 14.7304/21/2012 1,010.2 0.5845 1,321.3 1.7834 - 0.3319 96.2861 1.2423 0.1856 0.1872 0.0549 0.0425 0.0247 0.0102 - 0.0177 0.0372 0.0131 0.0064 14.7304/22/2012 1,010.9 0.5844 1,322.4 1.7454 - 0.3340 96.2967 1.2546 0.1941 0.1917 0.0565 0.0441 0.0260 0.0108 - 0.0175 0.0368 0.0130 0.0063 14.7304/23/2012 1,030.1 0.5995 1,330.4 1.8809 - 0.3932 94.4507 2.2636 0.5539 0.4972 0.1399 0.1300 0.0620 0.0327 - 0.0427 0.0899 0.0318 0.0155 14.7304/24/2012 1,017.8 0.5897 1,325.4 1.7746 - 0.3734 95.6003 1.6654 0.3204 0.2908 0.0847 0.0695 0.0366 0.0171 - 0.0267 0.0562 0.0199 0.0097 14.7304/25/2012 1,017.7 0.5898 1,325.2 1.7855 - 0.3747 95.6270 1.6145 0.3170 0.3077 0.0874 0.0749 0.0384 0.0190 - 0.0283 0.0597 0.0211 0.0103 14.7304/26/2012 1,017.5 0.5897 1,325.0 1.7778 - 0.3891 95.5969 1.6542 0.3168 0.2894 0.0839 0.0704 0.0359 0.0179 - 0.0262 0.0551 0.0195 0.0095 14.7304/27/2012 1,015.2 0.5872 1,324.8 1.7182 - 0.3833 95.8798 1.5297 0.2615 0.2482 0.0727 0.0597 0.0318 0.0147 - 0.0223 0.0470 0.0166 0.0081 14.7304/28/2012 1,012.9 0.5856 1,323.6 1.7155 - 0.3733 96.0768 1.4234 0.2189 0.2095 0.0615 0.0499 0.0281 0.0118 - 0.0187 0.0395 0.0140 0.0068 14.7304/29/2012 1,010.9 0.5847 1,322.0 1.7230 - 0.3956 96.1814 1.3444 0.1868 0.1849 0.0537 0.0430 0.0249 0.0098 - 0.0172 0.0363 0.0128 0.0062 14.7304/30/2012 1,010.6 0.5845 1,321.9 1.7205 - 0.4013 96.1944 1.3379 0.1825 0.1787 0.0522 0.0421 0.0238 0.0096 - 0.0164 0.0346 0.0122 0.0059 14.7305/1/2012 1,010.9 0.5846 1,322.1 1.7271 - 0.3848 96.1967 1.3312 0.1903 0.1853 0.0547 0.0437 0.0253 0.0100 - 0.0166 0.0350 0.0124 0.0060 14.7305/2/2012 1,011.3 0.5848 1,322.4 1.7299 - 0.3682 96.1976 1.3320 0.1955 0.1929 0.0566 0.0455 0.0262 0.0105 - 0.0174 0.0367 0.0130 0.0063 14.7305/3/2012 1,011.6 0.5847 1,322.9 1.7231 - 0.3504 96.2369 1.3083 0.1986 0.2001 0.0584 0.0462 0.0265 0.0110 - 0.0187 0.0393 0.0139 0.0068 14.7305/4/2012 1,011.5 0.5847 1,322.8 1.7172 - 0.3675 96.2217 1.3159 0.1967 0.1985 0.0575 0.0460 0.0260 0.0106 - 0.0188 0.0396 0.0140 0.0068 14.7305/5/2012 1,010.8 0.5848 1,321.8 1.7512 - 0.3718 96.1969 1.3174 0.1903 0.1885 0.0551 0.0445 0.0253 0.0102 - 0.0172 0.0362 0.0128 0.0062 14.7305/6/2012 1,011.1 0.5845 1,322.5 1.7085 - 0.3830 96.2238 1.3230 0.1892 0.1889 0.0547 0.0439 0.0251 0.0102 - 0.0177 0.0373 0.0132 0.0064 14.7305/7/2012 1,011.8 0.5845 1,323.4 1.7124 - 0.3400 96.2363 1.3419 0.1931 0.1932 0.0554 0.0447 0.0259 0.0107 - 0.0182 0.0383 0.0135 0.0066 14.7305/8/2012 1,011.5 0.5841 1,323.5 1.6825 - 0.3716 96.2614 1.3244 0.1890 0.1877 0.0539 0.0434 0.0253 0.0102 - 0.0177 0.0372 0.0131 0.0064 14.7305/9/2012 1,012.0 0.5843 1,323.9 1.6713 - 0.3725 96.2599 1.3157 0.1982 0.1998 0.0573 0.0464 0.0270 0.0111 - 0.0187 0.0393 0.0139 0.0068 14.7305/10/2012 1,011.7 0.5846 1,323.2 1.7002 - 0.3748 96.2131 1.3379 0.1950 0.1959 0.0565 0.0458 0.0266 0.0108 - 0.0181 0.0381 0.0135 0.0066 14.730
ERMTexas Registered Engineering Firm F-2393 Page 9 of 12
0189555\A5469 D.2 Historical Fuel Analyses.xls

Heating Value
Gravity Wobbe Co2 Cont O2 Cont N2 Cont Methane Cont Ethane Cont Propane Cont C4+ Content I Butane Cont N Butane Cont
I Pentane Cont
N Pentane Cont
Neo Pentane Cont
N Hexane Cont
C6 Plus Cont Heptane Cont Octane Cont PressBase
(Btu/SCF, HHV)
(dimensionless)
(Btu/SCF, HHV)
(mol%) (mol%) (mol%) (mol%) (mol%) (mol%) (mol%) (mol%) (mol%) (mol%) (mol%) (mol%) (mol%) (mol%) (mol%) (mol%) (psia)
Min 1,006.2 0.5790 1,317.8 1.5900 - 0.1461 94.3288 0.7031 0.1252 0.1137 0.0399 0.0315 0.0009 0.0081 - 0.0107 0.0226 0.0080 0.0039 14.7
Average 1,012.0 0.5854 1,322.8 1.7669 - 0.3261 96.1763 1.3164 0.2222 0.2084 0.0620 0.0514 0.0279 0.0126 - 0.0176 0.0370 0.0131 0.0064 14.7
Max 1,030.1 0.6010 1,330.4 2.1667 - 0.4397 97.1713 2.4087 0.6112 0.5085 0.1405 0.1402 0.0620 0.0332 - 0.0427 0.0899 0.0318 0.0155 14.7
Gas Day Date
5/11/2012 1,011.0 0.5846 1,322.3 1.7210 - 0.3873 96.2054 1.3267 0.1857 0.1916 0.0534 0.0438 0.0251 0.0106 - 0.0189 0.0398 0.0141 0.0068 14.7305/12/2012 1,011.8 0.5845 1,323.4 1.6890 - 0.3814 96.2059 1.3526 0.1931 0.1949 0.0556 0.0453 0.0265 0.0109 - 0.0182 0.0384 0.0136 0.0066 14.7305/13/2012 1,011.5 0.5846 1,322.9 1.7037 - 0.3785 96.2076 1.3430 0.1908 0.1936 0.0547 0.0448 0.0257 0.0110 - 0.0185 0.0389 0.0138 0.0067 14.7305/14/2012 1,011.7 0.5845 1,323.3 1.6932 - 0.3763 96.2131 1.3484 0.1935 0.1919 0.0554 0.0451 0.0257 0.0108 - 0.0177 0.0372 0.0131 0.0064 14.7305/15/2012 1,012.8 0.5851 1,324.1 1.6940 - 0.3642 96.1364 1.4139 0.2065 0.2021 0.0583 0.0481 0.0268 0.0115 - 0.0185 0.0389 0.0137 0.0067 14.7305/16/2012 1,012.7 0.5849 1,324.2 1.6900 - 0.3608 96.1588 1.4075 0.2001 0.2005 0.0569 0.0464 0.0269 0.0113 - 0.0190 0.0400 0.0141 0.0069 14.7305/17/2012 1,012.5 0.5846 1,324.2 1.6914 - 0.3441 96.2261 1.3493 0.2041 0.2025 0.0587 0.0476 0.0269 0.0113 - 0.0187 0.0393 0.0139 0.0068 14.7305/18/2012 1,012.3 0.5849 1,323.6 1.6969 - 0.3784 96.1419 1.4039 0.1992 0.1964 0.0567 0.0463 0.0265 0.0113 - 0.0179 0.0377 0.0133 0.0065 14.7305/19/2012 1,012.1 0.5848 1,323.5 1.6920 - 0.3825 96.1542 1.3947 0.1982 0.1953 0.0558 0.0461 0.0262 0.0112 - 0.0180 0.0380 0.0134 0.0065 14.7305/20/2012 1,011.8 0.5847 1,323.2 1.6956 - 0.3811 96.1834 1.3702 0.1948 0.1907 0.0553 0.0451 0.0262 0.0110 - 0.0171 0.0360 0.0127 0.0062 14.7305/21/2012 1,011.9 0.5855 1,322.4 1.7417 - 0.3790 96.0783 1.4238 0.1980 0.1961 0.0560 0.0459 0.0263 0.0111 - 0.0183 0.0385 0.0136 0.0066 14.7305/22/2012 1,013.2 0.5850 1,324.7 1.6881 - 0.3416 96.1801 1.3723 0.2223 0.2124 0.0612 0.0528 0.0288 0.0130 - 0.0182 0.0384 0.0136 0.0066 14.7305/23/2012 1,013.3 0.5848 1,325.1 1.6698 - 0.3486 96.1935 1.3716 0.2226 0.2101 0.0622 0.0522 0.0283 0.0127 - 0.0176 0.0371 0.0131 0.0064 14.7305/24/2012 1,012.1 0.5847 1,323.6 1.7101 - 0.3417 96.2234 1.3357 0.2066 0.1982 0.0584 0.0486 0.0264 0.0117 - 0.0171 0.0360 0.0127 0.0062 14.7305/25/2012 1,012.3 0.5843 1,324.3 1.6912 - 0.3246 96.2867 1.3074 0.2062 0.1993 0.0592 0.0486 0.0280 0.0120 - 0.0166 0.0349 0.0123 0.0060 14.7305/26/2012 1,011.4 0.5842 1,323.3 1.7118 - 0.3336 96.3060 1.2773 0.1940 0.1926 0.0568 0.0459 0.0268 0.0112 - 0.0167 0.0352 0.0124 0.0061 14.7305/27/2012 1,011.5 0.5842 1,323.4 1.6916 - 0.3640 96.2549 1.3207 0.1952 0.1883 0.0561 0.0454 0.0261 0.0110 - 0.0160 0.0337 0.0119 0.0058 14.7305/28/2012 1,011.0 0.5842 1,322.7 1.7077 - 0.3629 96.2656 1.3035 0.1919 0.1820 0.0553 0.0444 0.0254 0.0109 - 0.0148 0.0312 0.0110 0.0054 14.7305/29/2012 1,010.8 0.5840 1,322.7 1.7099 - 0.3558 96.3011 1.2773 0.1884 0.1813 0.0543 0.0440 0.0254 0.0106 - 0.0151 0.0319 0.0113 0.0055 14.7305/30/2012 1,012.3 0.5846 1,324.0 1.6890 - 0.3586 96.1980 1.3592 0.2142 0.1942 0.0595 0.0496 0.0275 0.0119 - 0.0147 0.0310 0.0110 0.0053 14.7305/31/2012 1,011.7 0.5832 1,324.8 1.6529 - 0.3083 96.4430 1.2252 0.1969 0.1870 0.0565 0.0471 0.0262 0.0115 - 0.0147 0.0310 0.0110 0.0053 14.7306/1/2012 1,011.4 0.5836 1,323.9 1.6731 - 0.3389 96.3607 1.2635 0.1945 0.1829 0.0556 0.0450 0.0254 0.0107 - 0.0149 0.0313 0.0111 0.0054 14.7306/2/2012 1,016.2 0.5883 1,324.9 1.7552 - 0.3739 95.7523 1.5742 0.3011 0.2604 0.0777 0.0711 0.0354 0.0174 - 0.0189 0.0399 0.0141 0.0069 14.7306/3/2012 1,013.3 0.5859 1,323.8 1.7212 - 0.3714 96.0308 1.4408 0.2421 0.2079 0.0650 0.0533 0.0287 0.0125 - 0.0156 0.0328 0.0116 0.0056 14.7306/4/2012 1,013.2 0.5861 1,323.5 1.7302 - 0.3811 96.0113 1.4377 0.2416 0.2120 0.0648 0.0560 0.0298 0.0138 - 0.0153 0.0323 0.0114 0.0056 14.7306/5/2012 1,013.7 0.5864 1,323.8 1.7353 - 0.3689 95.9773 1.4629 0.2558 0.2133 0.0667 0.0562 0.0294 0.0138 - 0.0152 0.0320 0.0113 0.0055 14.7306/6/2012 1,010.4 0.5838 1,322.4 1.7226 - 0.3455 96.3239 1.2532 0.1931 0.1729 0.0544 0.0446 0.0248 0.0103 - 0.0125 0.0263 0.0093 0.0045 14.7306/7/2012 1,010.9 0.5840 1,322.8 1.7304 - 0.3200 96.3342 1.2444 0.2010 0.1813 0.0577 0.0467 0.0263 0.0111 - 0.0127 0.0268 0.0095 0.0046 14.7306/8/2012 1,010.3 0.5839 1,322.2 1.7231 - 0.3608 96.2956 1.2689 0.1910 0.1717 0.0541 0.0442 0.0247 0.0102 - 0.0124 0.0261 0.0092 0.0045 14.7306/9/2012 1,010.3 0.5841 1,321.9 1.7341 - 0.3623 96.2756 1.2751 0.1919 0.1727 0.0536 0.0447 0.0245 0.0102 - 0.0128 0.0269 0.0095 0.0046 14.7306/10/2012 1,010.4 0.5844 1,321.7 1.7481 - 0.3647 96.2257 1.2994 0.2005 0.1721 0.0552 0.0449 0.0249 0.0107 - 0.0117 0.0247 0.0087 0.0042 14.7306/11/2012 1,010.7 0.5843 1,322.2 1.7328 - 0.3616 96.2374 1.3067 0.1988 0.1737 0.0549 0.0449 0.0250 0.0104 - 0.0124 0.0261 0.0092 0.0045 14.7306/12/2012 1,010.8 0.5844 1,322.2 1.7494 - 0.3385 96.2556 1.2839 0.2036 0.1791 0.0578 0.0475 0.0268 0.0115 - 0.0114 0.0241 0.0085 0.0041 14.7306/13/2012 1,010.7 0.5838 1,322.8 1.7341 - 0.3050 96.3866 1.2020 0.1998 0.1845 0.0574 0.0474 0.0265 0.0115 - 0.0134 0.0283 0.0100 0.0049 14.7306/14/2012 1,012.0 0.5854 1,322.7 1.7485 - 0.3587 96.1191 1.3568 0.2341 0.1948 0.0622 0.0515 0.0277 0.0120 - 0.0133 0.0281 0.0099 0.0048 14.7306/15/2012 1,010.0 0.5844 1,321.2 1.7837 - 0.3369 96.2728 1.2440 0.1969 0.1767 0.0557 0.0457 0.0259 0.0108 - 0.0124 0.0262 0.0093 0.0045 14.7306/16/2012 1,016.7 0.5896 1,324.1 1.8272 - 0.3484 95.6321 1.5938 0.3389 0.2736 0.0865 0.0782 0.0388 0.0200 - 0.0161 0.0340 0.0120 0.0058 14.7306/17/2012 1,021.5 0.5938 1,325.6 1.8863 - 0.3671 95.0169 1.9923 0.4436 0.3107 0.0997 0.0889 0.0412 0.0210 - 0.0193 0.0406 0.0143 0.0070 14.7306/18/2012 1,028.7 0.5992 1,328.9 1.9371 - 0.3586 94.3465 2.3763 0.6004 0.4020 0.1308 0.1180 0.0517 0.0272 - 0.0239 0.0504 0.0178 0.0087 14.7306/19/2012 1,023.7 0.5947 1,327.5 1.8693 - 0.3491 94.9813 1.9894 0.4618 0.3690 0.1147 0.1055 0.0493 0.0280 - 0.0230 0.0485 0.0171 0.0083 14.7306/20/2012 1,027.0 0.6010 1,324.7 2.1667 - 0.2846 94.3288 2.1817 0.6112 0.4470 0.1405 0.1402 0.0614 0.0332 - 0.0231 0.0486 0.0172 0.0084 14.7306/21/2012 1,017.8 0.5923 1,322.5 2.0095 - 0.2643 95.4091 1.6191 0.3997 0.3129 0.1004 0.0946 0.0446 0.0211 - 0.0168 0.0354 0.0125 0.0061 14.7306/22/2012 1,018.9 0.5935 1,322.6 2.0401 - 0.2629 95.2697 1.6871 0.4230 0.3320 0.1074 0.1006 0.0480 0.0229 - 0.0171 0.0360 0.0127 0.0062 14.7306/23/2012 1,014.0 0.5879 1,322.5 1.8693 - 0.2856 95.9138 1.4218 0.2841 0.2406 0.0734 0.0639 0.0326 0.0173 - 0.0172 0.0362 0.0128 0.0062 14.7306/24/2012 1,014.4 0.5879 1,323.0 1.8565 - 0.2849 95.9015 1.4298 0.2939 0.2469 0.0774 0.0697 0.0349 0.0177 - 0.0152 0.0320 0.0113 0.0055 14.7306/25/2012 1,016.0 0.5896 1,323.2 1.8960 - 0.2924 95.6536 1.5815 0.3343 0.2565 0.0825 0.0703 0.0356 0.0175 - 0.0163 0.0343 0.0121 0.0059 14.7306/26/2012 1,015.0 0.5895 1,322.0 1.9433 - 0.2702 95.7174 1.4918 0.3317 0.2575 0.0852 0.0739 0.0374 0.0174 - 0.0140 0.0296 0.0105 0.0051 14.7306/27/2012 1,015.5 0.5886 1,323.6 1.8702 - 0.2655 95.8264 1.4655 0.3312 0.2528 0.0828 0.0747 0.0366 0.0168 - 0.0135 0.0284 0.0100 0.0049 14.7306/28/2012 1,009.1 0.5838 1,320.7 1.8534 - 0.2222 96.4886 1.0721 0.1937 0.1804 0.0593 0.0470 0.0269 0.0109 - 0.0117 0.0246 0.0087 0.0042 14.7306/29/2012 1,009.5 0.5835 1,321.6 1.8148 - 0.2300 96.5221 1.0657 0.1960 0.1815 0.0592 0.0478 0.0269 0.0116 - 0.0116 0.0244 0.0086 0.0042 14.7306/30/2012 1,009.8 0.5836 1,321.8 1.8151 - 0.2168 96.5185 1.0795 0.1959 0.1854 0.0588 0.0484 0.0274 0.0116 - 0.0126 0.0266 0.0094 0.0046 14.7307/1/2012 1,009.6 0.5829 1,322.4 1.7985 - 0.1972 96.6260 1.0135 0.1917 0.1838 0.0587 0.0482 0.0278 0.0115 - 0.0121 0.0255 0.0090 0.0044 14.7307/2/2012 1,009.9 0.5833 1,322.3 1.7745 - 0.2537 96.5026 1.1094 0.1915 0.1792 0.0574 0.0463 0.0265 0.0110 - 0.0122 0.0258 0.0091 0.0044 14.7307/3/2012 1,009.0 0.5833 1,321.1 1.8074 - 0.2506 96.5220 1.0731 0.1843 0.1730 0.0548 0.0449 0.0258 0.0106 - 0.0119 0.0250 0.0088 0.0043 14.7307/4/2012 1,008.7 0.5832 1,320.8 1.8474 - 0.1968 96.6136 0.9864 0.1857 0.1813 0.0572 0.0465 0.0270 0.0115 - 0.0126 0.0265 0.0094 0.0046 14.7307/5/2012 1,009.0 0.5827 1,321.8 1.8288 - 0.1661 96.7003 0.9466 0.1864 0.1835 0.0574 0.0468 0.0274 0.0116 - 0.0130 0.0273 0.0096 0.0047 14.7307/6/2012 1,009.5 0.5832 1,321.9 1.8072 - 0.2146 96.5715 1.0436 0.1919 0.1824 0.0583 0.0469 0.0270 0.0112 - 0.0126 0.0264 0.0093 0.0046 14.7307/7/2012 1,009.3 0.5835 1,321.3 1.8241 - 0.2226 96.5303 1.0613 0.1925 0.1799 0.0578 0.0470 0.0265 0.0110 - 0.0121 0.0255 0.0090 0.0044 14.7307/8/2012 1,009.0 0.5835 1,320.9 1.8541 - 0.2054 96.5488 1.0309 0.1897 0.1812 0.0585 0.0471 0.0276 0.0116 - 0.0117 0.0247 0.0087 0.0042 14.7307/9/2012 1,009.2 0.5839 1,320.7 1.8403 - 0.2445 96.4505 1.1041 0.1933 0.1772 0.0575 0.0469 0.0268 0.0109 - 0.0113 0.0238 0.0084 0.0041 14.7307/10/2012 1,011.6 0.5854 1,322.2 1.8361 - 0.2520 96.2351 1.2512 0.2341 0.2027 0.0645 0.0562 0.0292 0.0134 - 0.0127 0.0267 0.0094 0.0046 14.7307/11/2012 1,014.9 0.5873 1,324.3 1.8294 - 0.2377 96.0170 1.3872 0.2938 0.2488 0.0754 0.0716 0.0346 0.0184 - 0.0157 0.0331 0.0117 0.0057 14.7307/12/2012 1,014.4 0.5869 1,324.1 1.8247 - 0.2334 96.0824 1.3472 0.2821 0.2440 0.0738 0.0699 0.0340 0.0182 - 0.0155 0.0326 0.0115 0.0056 14.7307/13/2012 1,013.4 0.5863 1,323.5 1.8280 - 0.2386 96.1345 1.3171 0.2669 0.2273 0.0702 0.0647 0.0321 0.0165 - 0.0141 0.0297 0.0105 0.0051 14.7307/14/2012 1,010.3 0.5844 1,321.6 1.8107 - 0.2699 96.3577 1.1809 0.2054 0.1867 0.0597 0.0487 0.0273 0.0115 - 0.0127 0.0268 0.0095 0.0046 14.7307/15/2012 1,009.1 0.5839 1,320.6 1.8052 - 0.3109 96.3624 1.1795 0.1849 0.1667 0.0540 0.0439 0.0246 0.0103 - 0.0109 0.0230 0.0081 0.0040 14.7307/16/2012 1,009.3 0.5841 1,320.6 1.8136 - 0.2929 96.3695 1.1698 0.1924 0.1723 0.0555 0.0449 0.0249 0.0102 - 0.0118 0.0250 0.0088 0.0043 14.7307/17/2012 1,009.5 0.5845 1,320.4 1.7982 - 0.3537 96.2319 1.2655 0.1941 0.1659 0.0544 0.0438 0.0245 0.0099 - 0.0107 0.0226 0.0080 0.0039 14.730
ERMTexas Registered Engineering Firm F-2393 Page 10 of 12
0189555\A5469 D.2 Historical Fuel Analyses.xls

Heating Value
Gravity Wobbe Co2 Cont O2 Cont N2 Cont Methane Cont Ethane Cont Propane Cont C4+ Content I Butane Cont N Butane Cont
I Pentane Cont
N Pentane Cont
Neo Pentane Cont
N Hexane Cont
C6 Plus Cont Heptane Cont Octane Cont PressBase
(Btu/SCF, HHV)
(dimensionless)
(Btu/SCF, HHV)
(mol%) (mol%) (mol%) (mol%) (mol%) (mol%) (mol%) (mol%) (mol%) (mol%) (mol%) (mol%) (mol%) (mol%) (mol%) (mol%) (psia)
Min 1,006.2 0.5790 1,317.8 1.5900 - 0.1461 94.3288 0.7031 0.1252 0.1137 0.0399 0.0315 0.0009 0.0081 - 0.0107 0.0226 0.0080 0.0039 14.7
Average 1,012.0 0.5854 1,322.8 1.7669 - 0.3261 96.1763 1.3164 0.2222 0.2084 0.0620 0.0514 0.0279 0.0126 - 0.0176 0.0370 0.0131 0.0064 14.7
Max 1,030.1 0.6010 1,330.4 2.1667 - 0.4397 97.1713 2.4087 0.6112 0.5085 0.1405 0.1402 0.0620 0.0332 - 0.0427 0.0899 0.0318 0.0155 14.7
Gas Day Date
7/18/2012 1,009.2 0.5830 1,321.7 1.7711 - 0.2691 96.5332 1.0850 0.1824 0.1693 0.0540 0.0443 0.0249 0.0104 - 0.0115 0.0242 0.0086 0.0042 14.7307/19/2012 1,009.6 0.5834 1,321.8 1.7935 - 0.2423 96.5240 1.0746 0.1942 0.1820 0.0590 0.0475 0.0270 0.0115 - 0.0119 0.0251 0.0089 0.0043 14.7307/20/2012 1,009.3 0.5835 1,321.3 1.7987 - 0.2652 96.4874 1.0949 0.1887 0.1762 0.0567 0.0448 0.0259 0.0105 - 0.0123 0.0260 0.0092 0.0045 14.7307/21/2012 1,023.1 0.5918 1,329.9 1.7056 - 0.3574 95.2753 1.8845 0.4792 0.3123 0.0990 0.1003 0.0412 0.0214 - 0.0162 0.0342 0.0121 0.0059 14.7307/22/2012 1,014.8 0.5869 1,324.6 1.7781 - 0.2848 95.9862 1.4389 0.3011 0.2231 0.0730 0.0622 0.0316 0.0141 - 0.0136 0.0286 0.0101 0.0049 14.7307/23/2012 1,010.8 0.5845 1,322.1 1.7808 - 0.3033 96.2961 1.2283 0.2142 0.1881 0.0605 0.0497 0.0274 0.0122 - 0.0123 0.0260 0.0092 0.0045 14.7307/24/2012 1,010.6 0.5849 1,321.4 1.7820 - 0.3398 96.2297 1.2549 0.2157 0.1886 0.0598 0.0507 0.0279 0.0122 - 0.0122 0.0258 0.0091 0.0044 14.7307/25/2012 1,011.2 0.5851 1,322.0 1.7968 - 0.3063 96.2452 1.2254 0.2352 0.2023 0.0639 0.0565 0.0293 0.0135 - 0.0126 0.0265 0.0094 0.0046 14.7307/26/2012 1,009.5 0.5836 1,321.4 1.8000 - 0.2652 96.4631 1.1091 0.1965 0.1758 0.0574 0.0469 0.0263 0.0110 - 0.0110 0.0232 0.0082 0.0040 14.7307/27/2012 1,009.8 0.5847 1,320.6 1.8215 - 0.3174 96.2662 1.2222 0.2048 0.1781 0.0576 0.0479 0.0260 0.0112 - 0.0114 0.0240 0.0085 0.0041 14.7307/28/2012 1,008.7 0.5843 1,319.6 1.8175 - 0.3486 96.2875 1.2103 0.1823 0.1636 0.0529 0.0423 0.0236 0.0097 - 0.0113 0.0238 0.0084 0.0041 14.7307/29/2012 1,008.9 0.5842 1,320.0 1.8035 - 0.3463 96.3013 1.2110 0.1828 0.1657 0.0527 0.0426 0.0241 0.0100 - 0.0117 0.0246 0.0087 0.0042 14.7307/30/2012 1,009.7 0.5842 1,321.0 1.7700 - 0.3542 96.2871 1.2322 0.1951 0.1722 0.0543 0.0453 0.0246 0.0108 - 0.0120 0.0252 0.0089 0.0043 14.7307/31/2012 1,009.5 0.5846 1,320.3 1.7823 - 0.3782 96.2066 1.2863 0.1918 0.1651 0.0530 0.0431 0.0233 0.0096 - 0.0116 0.0245 0.0087 0.0042 14.7308/1/2012 1,009.8 0.5848 1,320.5 1.8222 - 0.3213 96.2473 1.2417 0.2023 0.1759 0.0560 0.0460 0.0256 0.0107 - 0.0121 0.0255 0.0090 0.0044 14.7308/2/2012 1,009.0 0.5845 1,319.8 1.8326 - 0.3235 96.2940 1.2011 0.1886 0.1709 0.0537 0.0448 0.0247 0.0105 - 0.0120 0.0252 0.0089 0.0043 14.7308/3/2012 1,008.1 0.5830 1,320.3 1.8321 - 0.2365 96.5841 1.0180 0.1741 0.1656 0.0524 0.0426 0.0241 0.0099 - 0.0118 0.0248 0.0088 0.0043 14.7308/4/2012 1,009.3 0.5836 1,321.2 1.7820 - 0.3010 96.4178 1.1546 0.1867 0.1676 0.0547 0.0442 0.0245 0.0101 - 0.0110 0.0231 0.0082 0.0040 14.7308/5/2012 1,012.6 0.5856 1,323.2 1.7483 - 0.3444 96.1021 1.3656 0.2467 0.2040 0.0645 0.0576 0.0293 0.0135 - 0.0126 0.0265 0.0094 0.0046 14.7308/6/2012 1,011.8 0.5858 1,322.0 1.7942 - 0.3431 96.0925 1.3465 0.2362 0.2003 0.0623 0.0537 0.0278 0.0126 - 0.0141 0.0298 0.0105 0.0051 14.7308/7/2012 1,009.7 0.5845 1,320.7 1.8305 - 0.2797 96.3558 1.1534 0.2060 0.1853 0.0582 0.0500 0.0273 0.0118 - 0.0122 0.0258 0.0091 0.0044 14.7308/8/2012 1,010.6 0.5848 1,321.5 1.8325 - 0.2598 96.3205 1.1830 0.2219 0.1939 0.0618 0.0510 0.0282 0.0125 - 0.0130 0.0274 0.0097 0.0047 14.7308/9/2012 1,010.2 0.5846 1,321.2 1.8383 - 0.2545 96.3478 1.1700 0.2142 0.1858 0.0600 0.0493 0.0271 0.0114 - 0.0122 0.0258 0.0091 0.0044 14.7308/10/2012 1,010.3 0.5852 1,320.7 1.8205 - 0.3298 96.1919 1.2739 0.2120 0.1832 0.0580 0.0483 0.0264 0.0114 - 0.0126 0.0265 0.0094 0.0045 14.7308/11/2012 1,008.9 0.5844 1,319.8 1.8331 - 0.3222 96.2993 1.1971 0.1907 0.1682 0.0532 0.0439 0.0242 0.0102 - 0.0118 0.0249 0.0088 0.0043 14.7308/12/2012 1,009.6 0.5847 1,320.3 1.8336 - 0.3036 96.2993 1.1876 0.2036 0.1831 0.0577 0.0490 0.0270 0.0116 - 0.0122 0.0256 0.0090 0.0044 14.7308/13/2012 1,023.3 0.5933 1,328.5 1.7587 - 0.4020 95.0113 2.0701 0.4667 0.3069 0.0990 0.0904 0.0402 0.0217 - 0.0179 0.0377 0.0133 0.0065 14.7308/14/2012 1,020.5 0.5926 1,325.7 1.8604 - 0.3533 95.1780 1.9048 0.4264 0.2924 0.0943 0.0844 0.0393 0.0201 - 0.0175 0.0368 0.0130 0.0063 14.7308/15/2012 1,015.1 0.5903 1,321.2 1.9633 - 0.3062 95.5481 1.6199 0.3326 0.2425 0.0816 0.0673 0.0338 0.0150 - 0.0144 0.0304 0.0107 0.0052 14.7308/16/2012 1,011.9 0.5870 1,320.7 1.8829 - 0.3116 95.9660 1.3914 0.2567 0.2031 0.0664 0.0544 0.0285 0.0124 - 0.0133 0.0281 0.0099 0.0048 14.7308/17/2012 1,009.5 0.5850 1,319.9 1.8223 - 0.3599 96.1778 1.2843 0.1943 0.1721 0.0546 0.0447 0.0251 0.0102 - 0.0121 0.0254 0.0090 0.0044 14.7308/18/2012 1,009.5 0.5845 1,320.4 1.7811 - 0.3723 96.2277 1.2747 0.1868 0.1672 0.0530 0.0439 0.0250 0.0104 - 0.0112 0.0237 0.0084 0.0041 14.7308/19/2012 1,009.5 0.5842 1,320.8 1.7669 - 0.3740 96.2579 1.2644 0.1806 0.1681 0.0515 0.0422 0.0236 0.0097 - 0.0132 0.0279 0.0099 0.0048 14.7308/20/2012 1,009.4 0.5842 1,320.6 1.7752 - 0.3632 96.2723 1.2508 0.1821 0.1677 0.0518 0.0429 0.0242 0.0101 - 0.0124 0.0263 0.0093 0.0045 14.7308/21/2012 1,009.4 0.5840 1,320.9 1.7779 - 0.3420 96.3206 1.2216 0.1812 0.1678 0.0523 0.0426 0.0245 0.0101 - 0.0123 0.0260 0.0092 0.0045 14.7308/22/2012 1,009.6 0.5840 1,321.1 1.7639 - 0.3437 96.3192 1.2320 0.1825 0.1705 0.0522 0.0431 0.0247 0.0104 - 0.0129 0.0272 0.0096 0.0047 14.7308/23/2012 1,010.2 0.5845 1,321.3 1.7592 - 0.3663 96.2317 1.2869 0.1919 0.1755 0.0540 0.0454 0.0254 0.0109 - 0.0128 0.0270 0.0095 0.0046 14.7308/24/2012 1,011.0 0.5854 1,321.4 1.7879 - 0.3640 96.1000 1.3678 0.2082 0.1844 0.0570 0.0474 0.0261 0.0114 - 0.0137 0.0288 0.0102 0.0050 14.7308/25/2012 1,011.2 0.5860 1,321.0 1.8161 - 0.3621 96.0280 1.3974 0.2190 0.1895 0.0592 0.0496 0.0269 0.0118 - 0.0135 0.0285 0.0101 0.0049 14.7308/26/2012 1,011.8 0.5867 1,321.0 1.8231 - 0.3776 95.9318 1.4463 0.2366 0.1965 0.0627 0.0518 0.0281 0.0125 - 0.0133 0.0281 0.0099 0.0048 14.7308/27/2012 1,011.2 0.5857 1,321.3 1.7976 - 0.3576 96.0971 1.3463 0.2224 0.1918 0.0590 0.0498 0.0265 0.0124 - 0.0142 0.0299 0.0106 0.0051 14.7308/28/2012 1,012.4 0.5874 1,320.9 1.8549 - 0.3570 95.8753 1.4592 0.2588 0.2070 0.0668 0.0546 0.0296 0.0132 - 0.0138 0.0290 0.0102 0.0050 14.7308/29/2012 1,012.2 0.5870 1,321.1 1.8600 - 0.3196 95.9781 1.3928 0.2506 0.2121 0.0674 0.0552 0.0298 0.0138 - 0.0148 0.0311 0.0110 0.0054 14.7308/30/2012 1,010.1 0.5848 1,320.9 1.8472 - 0.2679 96.3250 1.1683 0.2099 0.1939 0.0609 0.0494 0.0287 0.0124 - 0.0137 0.0288 0.0102 0.0050 14.7308/31/2012 1,009.1 0.5835 1,321.0 1.8376 - 0.2254 96.5398 1.0346 0.1903 0.1840 0.0571 0.0475 0.0273 0.0118 - 0.0130 0.0273 0.0096 0.0047 14.7309/1/2012 1,008.8 0.5838 1,320.3 1.7859 - 0.3394 96.3632 1.1797 0.1783 0.1637 0.0518 0.0427 0.0237 0.0100 - 0.0114 0.0241 0.0085 0.0041 14.7309/2/2012 1,009.1 0.5842 1,320.2 1.7842 - 0.3699 96.2659 1.2486 0.1783 0.1645 0.0505 0.0417 0.0235 0.0099 - 0.0125 0.0264 0.0093 0.0045 14.7309/3/2012 1,009.0 0.5844 1,319.9 1.7933 - 0.3701 96.2541 1.2504 0.1780 0.1664 0.0506 0.0413 0.0233 0.0095 - 0.0134 0.0283 0.0100 0.0049 14.7309/4/2012 1,009.2 0.5842 1,320.4 1.7735 - 0.3750 96.2649 1.2523 0.1800 0.1657 0.0511 0.0418 0.0240 0.0100 - 0.0125 0.0263 0.0093 0.0045 14.7309/5/2012 1,009.1 0.5836 1,320.9 1.7642 - 0.3383 96.3780 1.1881 0.1787 0.1636 0.0512 0.0418 0.0233 0.0097 - 0.0121 0.0255 0.0090 0.0044 14.7309/6/2012 1,012.3 0.5863 1,322.1 1.8092 - 0.3343 96.0582 1.3486 0.2469 0.2153 0.0678 0.0590 0.0304 0.0146 - 0.0140 0.0295 0.0104 0.0051 14.7309/7/2012 1,010.6 0.5847 1,321.6 1.7830 - 0.3277 96.2330 1.2823 0.2061 0.1793 0.0566 0.0475 0.0248 0.0109 - 0.0127 0.0268 0.0095 0.0046 14.7309/8/2012 1,010.3 0.5848 1,321.1 1.7672 - 0.3807 96.1740 1.3117 0.2019 0.1755 0.0548 0.0458 0.0252 0.0112 - 0.0124 0.0261 0.0092 0.0045 14.7309/9/2012 1,011.1 0.5857 1,321.2 1.7744 - 0.4008 96.0574 1.3755 0.2141 0.1920 0.0578 0.0484 0.0261 0.0118 - 0.0154 0.0325 0.0115 0.0056 14.7309/10/2012 1,010.3 0.5852 1,320.7 1.7938 - 0.3753 96.1478 1.3066 0.2044 0.1851 0.0559 0.0471 0.0261 0.0114 - 0.0144 0.0302 0.0107 0.0052 14.7309/11/2012 1,009.8 0.5846 1,320.7 1.7960 - 0.3436 96.2677 1.2293 0.1950 0.1816 0.0544 0.0465 0.0252 0.0111 - 0.0143 0.0301 0.0106 0.0052 14.7309/12/2012 1,011.1 0.5853 1,321.6 1.7856 - 0.3535 96.1443 1.3226 0.2151 0.1918 0.0585 0.0503 0.0270 0.0122 - 0.0141 0.0297 0.0105 0.0051 14.7309/13/2012 1,009.2 0.5838 1,320.8 1.7452 - 0.3821 96.3027 1.2410 0.1771 0.1623 0.0504 0.0419 0.0239 0.0102 - 0.0116 0.0243 0.0086 0.0042 14.7309/14/2012 1,009.6 0.5842 1,320.9 1.7633 - 0.3644 96.2706 1.2627 0.1821 0.1684 0.0516 0.0427 0.0243 0.0103 - 0.0127 0.0268 0.0095 0.0046 14.7309/15/2012 1,009.8 0.5845 1,320.8 1.7732 - 0.3702 96.2276 1.2808 0.1881 0.1725 0.0517 0.0441 0.0244 0.0104 - 0.0135 0.0284 0.0100 0.0049 14.7309/16/2012 1,009.2 0.5838 1,320.8 1.7598 - 0.3603 96.3229 1.2274 0.1773 0.1631 0.0502 0.0418 0.0239 0.0102 - 0.0119 0.0251 0.0089 0.0043 14.7309/17/2012 1,009.4 0.5840 1,320.9 1.7666 - 0.3579 96.3041 1.2351 0.1809 0.1666 0.0513 0.0426 0.0238 0.0100 - 0.0125 0.0264 0.0093 0.0045 14.7309/18/2012 1,010.7 0.5850 1,321.4 1.7690 - 0.3670 96.1775 1.3089 0.2054 0.1852 0.0560 0.0479 0.0254 0.0112 - 0.0144 0.0303 0.0107 0.0052 14.7309/19/2012 1,010.7 0.5843 1,322.2 1.7340 - 0.3500 96.2917 1.2494 0.2020 0.1862 0.0558 0.0481 0.0258 0.0114 - 0.0145 0.0306 0.0108 0.0053 14.7309/20/2012 1,010.3 0.5838 1,322.3 1.7393 - 0.3203 96.3998 1.1716 0.1933 0.1893 0.0564 0.0478 0.0269 0.0116 - 0.0150 0.0316 0.0112 0.0054 14.7309/21/2012 1,011.8 0.5853 1,322.5 1.7614 - 0.3436 96.1704 1.3061 0.2276 0.2053 0.0622 0.0541 0.0279 0.0124 - 0.0157 0.0330 0.0117 0.0057 14.7309/22/2012 1,010.3 0.5844 1,321.6 1.7426 - 0.3741 96.2578 1.2601 0.1968 0.1821 0.0549 0.0459 0.0253 0.0106 - 0.0146 0.0308 0.0109 0.0053 14.7309/23/2012 1,009.8 0.5847 1,320.6 1.7697 - 0.3957 96.1955 1.2833 0.1916 0.1776 0.0529 0.0445 0.0245 0.0103 - 0.0146 0.0308 0.0109 0.0053 14.730
ERMTexas Registered Engineering Firm F-2393 Page 11 of 12
0189555\A5469 D.2 Historical Fuel Analyses.xls

Heating Value
Gravity Wobbe Co2 Cont O2 Cont N2 Cont Methane Cont Ethane Cont Propane Cont C4+ Content I Butane Cont N Butane Cont
I Pentane Cont
N Pentane Cont
Neo Pentane Cont
N Hexane Cont
C6 Plus Cont Heptane Cont Octane Cont PressBase
(Btu/SCF, HHV)
(dimensionless)
(Btu/SCF, HHV)
(mol%) (mol%) (mol%) (mol%) (mol%) (mol%) (mol%) (mol%) (mol%) (mol%) (mol%) (mol%) (mol%) (mol%) (mol%) (mol%) (psia)
Min 1,006.2 0.5790 1,317.8 1.5900 - 0.1461 94.3288 0.7031 0.1252 0.1137 0.0399 0.0315 0.0009 0.0081 - 0.0107 0.0226 0.0080 0.0039 14.7
Average 1,012.0 0.5854 1,322.8 1.7669 - 0.3261 96.1763 1.3164 0.2222 0.2084 0.0620 0.0514 0.0279 0.0126 - 0.0176 0.0370 0.0131 0.0064 14.7
Max 1,030.1 0.6010 1,330.4 2.1667 - 0.4397 97.1713 2.4087 0.6112 0.5085 0.1405 0.1402 0.0620 0.0332 - 0.0427 0.0899 0.0318 0.0155 14.7
Gas Day Date
9/24/2012 1,009.9 0.5845 1,320.9 1.7442 - 0.4054 96.2024 1.3000 0.1870 0.1746 0.0520 0.0434 0.0238 0.0098 - 0.0147 0.0309 0.0109 0.0053 14.7309/25/2012 1,010.2 0.5846 1,321.2 1.7421 - 0.4020 96.1718 1.3330 0.1923 0.1701 0.0533 0.0440 0.0246 0.0100 - 0.0123 0.0259 0.0091 0.0045 14.7309/26/2012 1,010.9 0.5851 1,321.6 1.7497 - 0.3996 96.1035 1.3745 0.2057 0.1786 0.0559 0.0470 0.0251 0.0106 - 0.0129 0.0271 0.0096 0.0047 14.7309/27/2012 1,011.3 0.5850 1,322.2 1.7191 - 0.4060 96.1126 1.3835 0.2091 0.1822 0.0564 0.0469 0.0253 0.0108 - 0.0138 0.0290 0.0102 0.0050 14.7309/28/2012 1,010.2 0.5848 1,321.0 1.7634 - 0.3868 96.1617 1.3314 0.1971 0.1707 0.0538 0.0451 0.0242 0.0098 - 0.0122 0.0256 0.0091 0.0044 14.7309/29/2012 1,009.4 0.5844 1,320.4 1.7768 - 0.3828 96.2202 1.2841 0.1836 0.1640 0.0507 0.0421 0.0232 0.0094 - 0.0124 0.0262 0.0093 0.0045 14.7309/30/2012 1,009.4 0.5844 1,320.4 1.7680 - 0.3895 96.2229 1.2837 0.1799 0.1681 0.0511 0.0422 0.0237 0.0097 - 0.0133 0.0281 0.0099 0.0048 14.73010/1/2012 1,009.6 0.5842 1,320.9 1.7570 - 0.3831 96.2480 1.2737 0.1826 0.1684 0.0508 0.0425 0.0231 0.0095 - 0.0137 0.0288 0.0102 0.0049 14.73010/2/2012 1,009.5 0.5840 1,321.0 1.7431 - 0.3868 96.2705 1.2661 0.1795 0.1666 0.0502 0.0419 0.0228 0.0095 - 0.0136 0.0286 0.0101 0.0049 14.73010/3/2012 1,013.9 0.5874 1,322.9 1.7878 - 0.3778 95.7909 1.5914 0.2633 0.2037 0.0593 0.0556 0.0261 0.0130 - 0.0160 0.0337 0.0119 0.0058 14.73010/4/2012 1,010.3 0.5849 1,321.0 1.7756 - 0.3754 96.1575 1.3384 0.1930 0.1733 0.0518 0.0434 0.0236 0.0098 - 0.0144 0.0303 0.0107 0.0052 14.73010/5/2012 1,009.2 0.5847 1,319.8 1.8027 - 0.3813 96.1898 1.2894 0.1816 0.1676 0.0511 0.0421 0.0233 0.0095 - 0.0134 0.0282 0.0100 0.0048 14.73010/6/2012 1,009.6 0.5844 1,320.7 1.7608 - 0.3955 96.2102 1.2961 0.1812 0.1691 0.0507 0.0422 0.0237 0.0097 - 0.0138 0.0290 0.0102 0.0050 14.73010/7/2012 1,010.0 0.5842 1,321.4 1.7191 - 0.4068 96.2417 1.2920 0.1794 0.1757 0.0512 0.0422 0.0239 0.0099 - 0.0156 0.0329 0.0116 0.0057 14.73010/8/2012 1,010.0 0.5841 1,321.5 1.7100 - 0.4184 96.2493 1.2792 0.1800 0.1778 0.0514 0.0429 0.0241 0.0101 - 0.0159 0.0334 0.0118 0.0057 14.73010/9/2012 1,009.7 0.5848 1,320.3 1.7833 - 0.3919 96.1707 1.3117 0.1815 0.1755 0.0514 0.0422 0.0236 0.0095 - 0.0157 0.0331 0.0117 0.0057 14.73010/10/2012 1,010.0 0.5846 1,321.0 1.7542 - 0.3960 96.1655 1.3506 0.1783 0.1690 0.0500 0.0413 0.0228 0.0096 - 0.0146 0.0307 0.0108 0.0053 14.73010/11/2012 1,010.1 0.5843 1,321.4 1.7218 - 0.4131 96.1850 1.3455 0.1808 0.1666 0.0505 0.0410 0.0227 0.0093 - 0.0139 0.0292 0.0103 0.0050 14.73010/12/2012 1,010.0 0.5848 1,320.7 1.7671 - 0.3884 96.1580 1.3431 0.1862 0.1699 0.0524 0.0423 0.0234 0.0093 - 0.0137 0.0288 0.0102 0.0050 14.73010/13/2012 1,010.5 0.5850 1,321.2 1.7576 - 0.3981 96.1089 1.3872 0.1885 0.1730 0.0523 0.0430 0.0236 0.0096 - 0.0143 0.0302 0.0107 0.0052 14.73010/14/2012 1,010.4 0.5846 1,321.5 1.7436 - 0.3893 96.1723 1.3489 0.1854 0.1739 0.0520 0.0430 0.0235 0.0097 - 0.0147 0.0310 0.0110 0.0053 14.73010/15/2012 1,010.4 0.5847 1,321.4 1.7549 - 0.3754 96.2067 1.3085 0.1872 0.1824 0.0533 0.0440 0.0248 0.0106 - 0.0160 0.0337 0.0119 0.0058 14.73010/16/2012 1,011.2 0.5848 1,322.3 1.7255 - 0.3880 96.1509 1.3768 0.1915 0.1820 0.0530 0.0449 0.0246 0.0104 - 0.0158 0.0333 0.0118 0.0057 14.73010/17/2012 1,010.1 0.5845 1,321.2 1.7512 - 0.3869 96.1967 1.3230 0.1828 0.1735 0.0507 0.0425 0.0235 0.0096 - 0.0152 0.0320 0.0113 0.0055 14.73010/18/2012 1,011.1 0.5842 1,322.9 1.7087 - 0.3609 96.2643 1.3036 0.1952 0.1816 0.0537 0.0449 0.0247 0.0104 - 0.0154 0.0325 0.0115 0.0056 14.73010/19/2012 1,011.4 0.5841 1,323.4 1.6964 - 0.3481 96.2960 1.2947 0.1920 0.1883 0.0553 0.0453 0.0256 0.0103 - 0.0167 0.0351 0.0124 0.0060 14.73010/20/2012 1,011.6 0.5845 1,323.2 1.7095 - 0.3597 96.2195 1.3396 0.1956 0.1916 0.0563 0.0463 0.0261 0.0107 - 0.0168 0.0354 0.0125 0.0061 14.73010/21/2012 1,011.1 0.5848 1,322.2 1.7460 - 0.3619 96.1598 1.3777 0.1893 0.1790 0.0540 0.0435 0.0250 0.0102 - 0.0149 0.0314 0.0111 0.0054 14.73010/22/2012 1,012.7 0.5864 1,322.5 1.7650 - 0.3813 95.9519 1.4906 0.2241 0.2025 0.0610 0.0504 0.0274 0.0119 - 0.0167 0.0351 0.0124 0.0060 14.73010/23/2012 1,014.0 0.5873 1,323.1 1.7682 - 0.3849 95.8450 1.5435 0.2519 0.2243 0.0662 0.0554 0.0293 0.0138 - 0.0192 0.0404 0.0143 0.0069 14.73010/24/2012 1,011.3 0.5843 1,323.0 1.7058 - 0.3611 96.2358 1.3430 0.1877 0.1811 0.0537 0.0437 0.0244 0.0102 - 0.0158 0.0333 0.0118 0.0057 14.73010/25/2012 1,012.1 0.5842 1,324.2 1.6823 - 0.3418 96.2454 1.3555 0.2040 0.1847 0.0560 0.0468 0.0250 0.0107 - 0.0149 0.0313 0.0111 0.0054 14.73010/26/2012 1,014.2 0.5861 1,324.8 1.7178 - 0.3367 96.0329 1.4576 0.2524 0.2192 0.0632 0.0588 0.0274 0.0141 - 0.0179 0.0378 0.0134 0.0065 14.73010/27/2012 1,010.4 0.5840 1,322.2 1.7429 - 0.3369 96.3388 1.2252 0.1853 0.1872 0.0542 0.0437 0.0250 0.0103 - 0.0174 0.0366 0.0129 0.0063 14.73010/28/2012 1,010.3 0.5842 1,321.8 1.7664 - 0.3254 96.3351 1.2108 0.1878 0.1907 0.0557 0.0455 0.0252 0.0100 - 0.0175 0.0368 0.0130 0.0063 14.73010/29/2012 1,010.5 0.5843 1,322.0 1.7360 - 0.3596 96.2816 1.2647 0.1881 0.1854 0.0546 0.0444 0.0249 0.0100 - 0.0166 0.0349 0.0123 0.0060 14.73010/30/2012 1,019.4 0.5913 1,325.7 1.7883 - 0.4085 95.3032 1.8442 0.3980 0.2769 0.0845 0.0776 0.0344 0.0161 - 0.0207 0.0436 0.0154 0.0075 14.73010/31/2012 1,015.3 0.5897 1,322.1 1.8870 - 0.3554 95.5843 1.6373 0.3084 0.2463 0.0774 0.0613 0.0313 0.0130 - 0.0204 0.0429 0.0152 0.0074 14.73011/1/2012 1,013.3 0.5869 1,322.7 1.7978 - 0.3483 95.9968 1.4046 0.2353 0.2403 0.0650 0.0538 0.0296 0.0151 - 0.0247 0.0521 0.0184 0.0090 14.73011/2/2012 1,018.0 0.5907 1,324.5 1.8358 - 0.3614 95.4979 1.6976 0.3329 0.2991 0.0863 0.0742 0.0375 0.0187 - 0.0265 0.0559 0.0198 0.0096 14.73011/3/2012 1,020.8 0.5936 1,324.9 1.8562 - 0.4325 95.0763 1.9334 0.3895 0.3404 0.0954 0.0848 0.0421 0.0233 - 0.0305 0.0643 0.0227 0.0111 14.73011/4/2012 1,021.0 0.5937 1,325.1 1.8581 - 0.4372 95.0496 1.9531 0.3888 0.3431 0.0948 0.0839 0.0420 0.0230 - 0.0320 0.0674 0.0238 0.0116 14.73011/5/2012 1,021.0 0.5938 1,325.0 1.8597 - 0.4377 95.0529 1.9465 0.3879 0.3456 0.0952 0.0843 0.0424 0.0228 - 0.0325 0.0684 0.0242 0.0118 14.73011/6/2012 1,020.8 0.5936 1,324.9 1.8580 - 0.4342 95.0620 1.9491 0.3868 0.3392 0.0948 0.0831 0.0419 0.0224 - 0.0312 0.0658 0.0233 0.0113 14.73011/7/2012 1,021.0 0.5937 1,325.1 1.8590 - 0.4341 95.0557 1.9512 0.3868 0.3441 0.0941 0.0828 0.0422 0.0225 - 0.0330 0.0695 0.0246 0.0119 14.73011/8/2012 1,021.0 0.5937 1,325.1 1.8565 - 0.4350 95.0536 1.9554 0.3868 0.3433 0.0945 0.0832 0.0414 0.0226 - 0.0327 0.0689 0.0243 0.0118 14.73011/9/2012 1,021.2 0.5938 1,325.2 1.8554 - 0.4305 95.0588 1.9498 0.3888 0.3481 0.0951 0.0843 0.0423 0.0223 - 0.0335 0.0706 0.0249 0.0121 14.73011/10/2012 1,009.2 0.5861 1,318.2 1.8643 - 0.4181 96.0026 1.3633 0.1886 0.1785 0.0520 0.0429 0.0235 0.0095 - 0.0163 0.0343 0.0121 0.0059 14.73011/11/2012 1,010.2 0.5854 1,320.3 1.7938 - 0.4005 96.1064 1.3343 0.1918 0.1897 0.0549 0.0450 0.0247 0.0102 - 0.0177 0.0372 0.0131 0.0064 14.73011/12/2012 1,010.2 0.5855 1,320.2 1.8048 - 0.3920 96.1056 1.3344 0.1913 0.1883 0.0538 0.0443 0.0250 0.0103 - 0.0177 0.0372 0.0131 0.0064 14.73011/13/2012 1,010.0 0.5852 1,320.3 1.8183 - 0.3519 96.1982 1.2627 0.1921 0.1939 0.0555 0.0454 0.0254 0.0105 - 0.0184 0.0387 0.0137 0.0067 14.73011/14/2012 1,027.9 0.5973 1,330.0 1.8172 - 0.4154 94.4817 2.4087 0.5353 0.3696 0.1116 0.0991 0.0434 0.0224 - 0.0300 0.0631 0.0223 0.0108 14.73011/15/2012 1,014.8 0.5880 1,323.4 1.8119 - 0.3369 95.8304 1.5164 0.2817 0.2421 0.0721 0.0602 0.0308 0.0137 - 0.0210 0.0443 0.0157 0.0076 14.73011/16/2012 1,012.8 0.5868 1,322.1 1.8227 - 0.3258 95.9986 1.4142 0.2379 0.2197 0.0635 0.0521 0.0288 0.0126 - 0.0202 0.0425 0.0150 0.0073 14.73011/17/2012 1,011.0 0.5856 1,321.1 1.8245 - 0.3223 96.1655 1.2941 0.2073 0.2038 0.0592 0.0480 0.0267 0.0112 - 0.0189 0.0398 0.0141 0.0068 14.73011/18/2012 1,011.0 0.5856 1,321.1 1.8235 - 0.3218 96.1673 1.2940 0.2077 0.2030 0.0593 0.0483 0.0267 0.0112 - 0.0185 0.0390 0.0138 0.0067 14.73011/19/2012 1,010.3 0.5849 1,321.0 1.8242 - 0.3003 96.2910 1.2060 0.1942 0.2026 0.0564 0.0482 0.0269 0.0111 - 0.0193 0.0407 0.0144 0.0070 14.73011/20/2012 1,009.1 0.5858 1,318.4 1.8987 - 0.3386 96.1456 1.2563 0.1883 0.1893 0.0540 0.0445 0.0246 0.0106 - 0.0179 0.0377 0.0133 0.0065 14.73011/21/2012 1,009.2 0.5857 1,318.7 1.8651 - 0.3764 96.1122 1.2944 0.1844 0.1843 0.0519 0.0429 0.0241 0.0097 - 0.0179 0.0378 0.0134 0.0065 14.73011/22/2012 1,008.5 0.5851 1,318.4 1.8414 - 0.3993 96.1721 1.2524 0.1734 0.1771 0.0501 0.0415 0.0234 0.0097 - 0.0169 0.0355 0.0125 0.0061 14.73011/23/2012 1,008.5 0.5849 1,318.7 1.8402 - 0.3832 96.2107 1.2318 0.1757 0.1734 0.0500 0.0411 0.0228 0.0092 - 0.0162 0.0341 0.0121 0.0059 14.73011/24/2012 1,008.7 0.5849 1,318.9 1.8265 - 0.3912 96.1953 1.2521 0.1754 0.1749 0.0502 0.0414 0.0231 0.0092 - 0.0164 0.0346 0.0122 0.0059 14.73011/25/2012 1,008.5 0.5847 1,318.9 1.8163 - 0.3977 96.2122 1.2500 0.1708 0.1680 0.0483 0.0396 0.0218 0.0086 - 0.0160 0.0337 0.0119 0.0058 14.73011/26/2012 1,008.4 0.5847 1,318.8 1.8318 - 0.3806 96.2200 1.2427 0.1724 0.1665 0.0488 0.0403 0.0221 0.0087 - 0.0150 0.0316 0.0112 0.0054 14.73011/27/2012 1,009.6 0.5848 1,320.2 1.7791 - 0.4011 96.1802 1.2941 0.1819 0.1789 0.0518 0.0427 0.0240 0.0097 - 0.0163 0.0344 0.0122 0.0059 14.73011/28/2012 1,009.6 0.5848 1,320.2 1.7791 - 0.4011 96.1802 1.2941 0.1819 0.1789 0.0518 0.0427 0.0240 0.0097 - 0.0163 0.0344 0.0122 0.0059 14.730
ERMTexas Registered Engineering Firm F-2393 Page 12 of 12
0189555\A5469 D.2 Historical Fuel Analyses.xls

Engine Specification Sheet CFP Engine ModelCummins Fire Power CFP15E-F SeriesDe Pere, WI 54115 Curve Number: FR - 10549 & 10663http://www.cumminsfirepower.com Revision Date: June 2011
Equipment Standard OptionalAir Cleaner Direct Mounted, oil impregnated
serviceable element (K&N)Housed Unit, Flame Resistant Element (FLG AH19266)
Alternator 24V-DC, 70 Amps; With Belt Guard
N/A
Cooling Loop Optional For Fresh Water or Salt Water Applications
Exhaust Protection Metal Guards on Manifolds and Turbo
N/A
Exhaust Flex Connection
SS Flex, NPT SS Flex, 150# Flange
Flywheel Power Take-Off
Flywheel Drive Shaft System Stub Shaft
Fuel Connections Fire Resistant Flexible Supply and Return Lines
N/A
Fuel Injection Direct Injection N/A
Fuel Filter Primary Filter with Priming Pump N/A
Engine Heater 120 / 240 VAC, 3000 Watt N/A
Governor, Speed Constant Speed N/A
Heat Exchanger Tube & Shell Type, 60 PSI with NPTF Connections
N/A
Instrument Panel English and Metric, Tachometer, Hourmeter, Water Temperature, Oil P & T (2)
N/A
CFP15E-F20
Specifications
Engine Series………………………………………….
Ratings are: HP (kW)
(336)450411 (306)
..4 Cycle; In-Line, 6 Cylinder
(485)
477CFP15E-F40CFP15E-F50 610
(429)(356)
Water Pump
Starters
Exhaust Emissions…CFP15E-F50, F60, F70………………….EPA/CARB Tier 2
Run Solenoid
..Cummins QSX15 Series….EPA/CARB Tier 3
Engine Type…………………………………………
(334)575 (429) 575525
(429)524 (391)
CFP15E-F30
Oil Pressure & Two (2) Voltmeters
Junction Box Integral with Instrument Panel; For DC Wiring Interconnection to Engine Controller
N/A
Lube Oil Cooler Engine Water Cooled, Plate Type
N/A
Lube Oil Filter Full Flow with By-Pass Valve N/A
On Instrument Panel N/A
Lube Oil Pump Gear Driven N/A
Manual Start On Instrument Panel N/A
Overspeed Controls
Electronic with Reset & Test on Instrument Panel
N/A
Raw Water Solenoid Operation
Automatic from Engine Controller & from Emergency Local Control
N/A
Run-Stop Control(1980)Weight - lb (kg) Est ……………………………………………..…
…..Turbocharged and Charge Air CooledAspiration………………………………
4400Counter clockwise from flywheel endRotation………………………………
(305)
N/A
(15.0)Displacement - in3 (liter)…………………………….………………
Poly-Vee Belt Drive with Guard N/A
Adjustable Speed Control
24V-DC915
N/A
Throttle Control
CFP15E-F10
475 (354)610
488 (364) 380 (283)(391)
2100 2250
Exhaust Emissions…CFP15E-F10, F20, F30, F40…………
(455)
24V-DC N/A
686 (512)Model 1470 1760 1900
CFP15E-F60 650CFP15E-F70
Operating Speed (RPM) Listed Ratings
(455)
382 (285) 460 (343) 488 (364)
575542 (404)494 (368)
(455)610
409448
Spec Sheet CFP15E-F10-F70 Drawing No. 11129, Rev. D Page 1 of 2

CFP15E-F40
CFP15E-F50
Engines are rated at standard SAE conditions of 29.61 in. (7521 mm) Hg barometer and 77oF (25oC) inlet air temperature (approximates 300ft. (91.4 m) above sea level) by the testing laboratory (see SAE Standard J1349).
CFP15E-F20
CFP15E-F10
Certified Power
A deduction of 3 percent from engine horsepower rating at standard SAE conditions shall be made for diesel engines for each 1000 ft. (305 m) altitude above 300 ft. (91.4 m).
A deduction of 1 percent from engine horsepower rating as corrected to standard SAE conditions shall be made for diesel engines for
every 10oF above 77oF (24oC) ambient temperature.
This Cummins Fire Power fire pump driver is built to comply with NFPA-20, and is UL listed and FM approved.
CFP15E-F30
CFP15E-F60
CFP15E-F70
For additional information, click the hyperlinks below.
Engine Ratings Baselines
Spec Sheet CFP15E-F10-F70 Drawing No. 11129, Rev. D Page 2 of 2

NMHC NOx NMHC+NOx CO PM NMHC NOx NMHC+NOx CO PMoF oC CFM L/sec
1470 450 23.5 89.0 969 521 2740 12931760 542 26.5 100.3 905 485 3164 14931900 575 27.9 105.6 906 486 3328 15712100 575 29.1 110.2 884 473 3577 16882250 448 23.1 87.4 778 414 3756 1773
NMHC NOx NMHC+NOx CO PM NMHC NOx NMHC+NOx CO PMoF oC CFM L/sec
1470 450 23.5 89.0 969 521 2740 12931760 542 26.5 100.3 905 485 3164 14931900 575 27.9 105.6 906 486 3328 15712100 575 29.1 110.2 884 473 3577 16882250 448 23.1 87.4 778 414 3756 1773
2.651 0.671 0.078 3.555 0.900 0.105
Air Inlet Temperature: 25oC (77oF)
CFP15E-F30 Fire Pump Driver
Humidity: 10.7 g/kg (75 grains H2O/lb) of dry air; required for NOx correction
Reference: ASTM D975 No. 2-D
Reference Conditions:
Fuel Inlet Temperature: 40oC (104oF)Barometric Pressure: 100 kPa (29.53 in Hg)
EPA/CARB Nonroad emissions recorded per 40CFR89 (ref. ISO8178-1) and weighted at load points prescribed in Subpart E, Appendix A, for Constant SpeeEngines (ref. ISO8178-4, D2).
Grams per BHP - HRGal/Hr
Diesel Fuel Specifications:Cetane Number: 40-48
Exhaust
Test Methods:
0.14 3.7300.104 2.781
Reference EPA Standard Engine Family: ACEXL015AAH
QSX15 Base Model Manufactured by Cummins Inc.
No special options needed to meet current regulation emissions for all 50 states
L/hr
Temperature
EPA & CARB Tier 3 Emission DataFire Pump NSPS Compliant
RPM Gal/HrGrams per kW - HRGrams per BHP - HR
Fuel ConsumptionGas Flow
D2 Cycle Exhaust Emissions
D2 Cycle Exhaust EmissionsGrams per kW - HR
Exhaust
0.116 3.4392.5650.086
Fuel Consumption
Aspiration: Turbocharged, Charge Air Cooled
BHP L/hr
Tests conducted using alternate test methods, instrumentation, fuel or reference conditions can yield different results.
Temperature Gas Flow
2.886 0.671 0.089 3.870 0.900
Reference CARB Executive Order: U-R-002-0532
0.120
Type: 4 Cycle; In-Line; 6 Cylinder
Restrictions: Intake Restriction set to a maximum allowable limit for clean filter; Exhaust Back Pressure set to maximum allowable limit.
The emissions values above are based on CARB approved calculations for converting EPA (500 ppm) fuel to CARB (15 ppm) fuel.
- Using fuel rating 10663
15 PPM Diesel Fuel
300-4000 PPM Diesel Fuel
RPM BHP
Revision Date: 24MAR2010
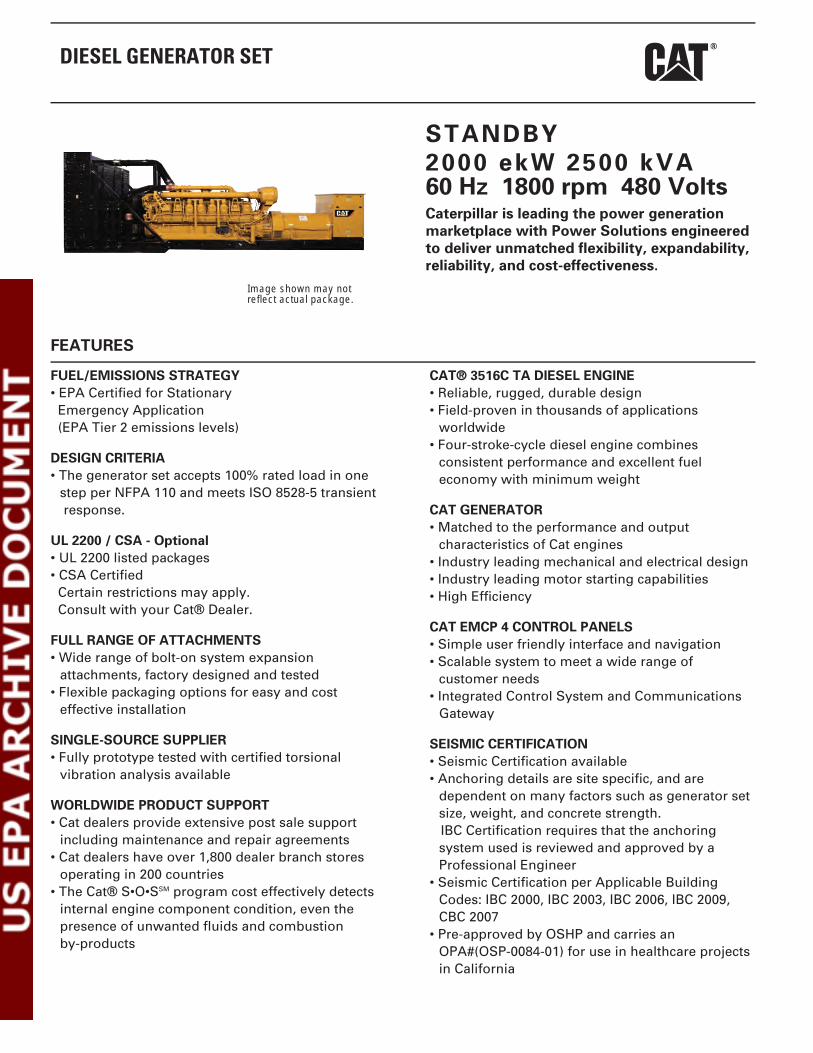
DIESEL GENERATOR SET
STANDBY2000 ekW 2500 kVA60 Hz 1800 rpm 480 VoltsCaterpillar is leading the power generationmarketplace with Power Solutions engineeredto deliver unmatched flexibility, expandability,reliability, and cost-effectiveness.
Image shown may notreflect actual package.
FEATURES
FUEL/EMISSIONS STRATEGY• EPA Certified for Stationary
Emergency Application(EPA Tier 2 emissions levels)
DESIGN CRITERIA• The generator set accepts 100% rated load in one
step per NFPA 110 and meets ISO 8528-5 transientresponse.
UL 2200 / CSA - Optional• UL 2200 listed packages• CSA Certified
Certain restrictions may apply.Consult with your Cat® Dealer.
FULL RANGE OF ATTACHMENTS• Wide range of bolt-on system expansion
attachments, factory designed and tested• Flexible packaging options for easy and cost
effective installation
SINGLE-SOURCE SUPPLIER• Fully prototype tested with certified torsional
vibration analysis available
WORLDWIDE PRODUCT SUPPORT• Cat dealers provide extensive post sale support
including maintenance and repair agreements• Cat dealers have over 1,800 dealer branch stores
operating in 200 countries• The Cat® S•O•SSM program cost effectively detects
internal engine component condition, even thepresence of unwanted fluids and combustionby-products
CAT® 3516C TA DIESEL ENGINE• Reliable, rugged, durable design• Field-proven in thousands of applications
worldwide• Four-stroke-cycle diesel engine combines
consistent performance and excellent fueleconomy with minimum weight
CAT GENERATOR• Matched to the performance and output
characteristics of Cat engines• Industry leading mechanical and electrical design• Industry leading motor starting capabilities• High Efficiency
CAT EMCP 4 CONTROL PANELS• Simple user friendly interface and navigation• Scalable system to meet a wide range of
customer needs• Integrated Control System and Communications
Gateway
SEISMIC CERTIFICATION• Seismic Certification available• Anchoring details are site specific, and are
dependent on many factors such as generator setsize, weight, and concrete strength.IBC Certification requires that the anchoringsystem used is reviewed and approved by aProfessional Engineer
• Seismic Certification per Applicable BuildingCodes: IBC 2000, IBC 2003, IBC 2006, IBC 2009,CBC 2007
• Pre-approved by OSHP and carries anOPA#(OSP-0084-01) for use in healthcare projectsin California

STANDBY 2000 ekW 2500 kVA60 Hz 1800 rpm 480 Volts
FACTORY INSTALLED STANDARD & OPTIONAL EQUIPMENT
System Standard OptionalAir Inlet • Single element canister type air cleaner
• Service indicator[ ] Dual element & heavy duty air cleaners[ ] Air inlet adapters & shut-off
Cooling • Radiator with guard• Coolant drain line with valve• Fan and belt guards• Cat® Extended Life Coolant*
[ ] Radiator duct flange[ ] Jacket water heater
Exhaust • Dry exhaust manifold• Flanged faced outlets
[ ] Mufflers and Silencers[ ] Stainless steel exhaust flex fittings[ ] Elbows, flanges, expanders & Y adapters
Fuel • Secondary fuel filters• Fuel priming pump• Flexible fuel lines• Fuel cooler*
[ ] Water separator[ ] Duplex fuel filter
Generator • Class H insulation• Cat digital voltage regulator (CDVR) with kVAR/PF
control, 3-phase sensing• Winding temperature detectors• Anti-condensation heaters• Reactive Droop
[ ] Oversize & premium generators[ ] Bearing temperature detectors
Power Termination • Bus bar (NEMA or IEC mechanical lug holes)- rightside standard
• Top and bottom cable entry
[ ] Circuit breakers, UL listed, 3 pole with shunttrip,100% rated, manual or electrically operated
[ ] Circuit breakers, IEC compliant, 3 or 4 pole withshunt trip, manual or electrically operated
[ ] Bottom cable entry[ ] Power terminations can be located on the right, left
and/or rear as an option.Governor • ADEM™ 3 [ ] Load share module
Control Panels • EMCP 4.2 Genset controller• User Interface panel (UIP) - rear mount• AC & DC customer wiring area (right side)• Emergency stop pushbutton
[ ] Local & remote annunciator modules[ ] Digital I/O Module[ ] Generator temperature monitoring & protection
Lube • Lubricating oil and filter• Oil drain line with valves• Fumes disposal• Gear type lube oil pump
[ ] Oil level regulator[ ] Deep sump oil pan[ ] Electric & air prelube pumps[ ] Manual prelube with sump pump[ ] Duplex oil filter
Mounting • Rails - engine / generator / radiator mounting• Rubber anti-vibration mounts (shipped loose)
[ ] Isolator removal[ ] Spring-type vibration isolator[ ] IBC Isolators
Starting/Charging • 24 volt starting motor(s)• Batteries with rack and cables• Battery disconnect switch
[ ] Battery chargers (10 or 20 amp)[ ] 45 amp charging alternator[ ] Oversize batteries[ ] Ether starting aid[ ] Heavy duty starting motors[ ] Barring device (manual)[ ] Air starting motor with control & silencer
General • Right-hand service• Paint - Caterpillar Yellow except rails and radiators
are gloss black• SAE standard rotation• Flywheel and flywheel housing - SAE No. 00
[ ] CSA certification[ ] CE Certificate of Conformance[ ] Seismic Certification per Applicable Building Codes:
IBC 2000, IBC 2003, IBC 2006, IBC 2009, CBC 2007* Not included with packages without radiators
Note Standard and optional equipment may vary for UL2200 Listed Packages. UL 2200 Listed packages mayhave oversized generators with a differenttemperature rise and motor starting characteristics.
February 13 2012 16:53 PM2

STANDBY 2000 ekW 2500 kVA60 Hz 1800 rpm 480 Volts
SPECIFICATIONS
CAT GENERATOR
Cat GeneratorFrame size......................................................................... 825Excitation................................................ Permanent MagnetPitch.............................................................................. 0.6667Number of poles...................................................................4Number of bearings...................................... Single bearingNumber of Leads.............................................................. 006Insulation....................... UL 1446 Recognized Class H withtropicalization and antiabrasionInsulation....................................................................Class F- Consult your Caterpillar dealer for available voltagesIP Rating........................................................................... IP23Alignment.............................................................. Pilot ShaftOverspeed capability........................................................150Wave form Deviation (Line to Line)........................... 003.00Voltage regulator.............. 3 Phase sensing with selectiblevolts/HzVoltage regulation............Less than +/- 1/2% (steady state)Less than +/- 1/2% (w/3% speed change)
CAT DIESEL ENGINE
3516C ATAAC, V-16, 4-Stroke Water-cooled DieselBore........................................................ 170.00 mm (6.69 in)Stroke..................................................... 190.00 mm (7.48 in)Displacement.........................................69.00 L (4210.64 in3)Compression Ratio....................................................... 14.7:1Aspiration........................................................................... TAFuel System.................................... Electronic unit injectionGovernor Type........................................................... ADEM3
CAT EMCP 4 SERIES CONTROLS
EMCP 4 controls including:- Run / Auto / Stop Control- Speed and Voltage Adjust- Engine Cycle Crank- 24-volt DC operation- Environmental sealed front face- Text alarm/event descriptions
Digital indication for:- RPM- DC volts- Operating hours- Oil pressure (psi, kPa or bar)- Coolant temperature- Volts (L-L & L-N), frequency (Hz)- Amps (per phase & average)- ekW, kVA, kVAR, kW-hr, %kW, PF
Warning/shutdown with common LED indication of:- Low oil pressure- High coolant temperature- Overspeed- Emergency stop- Failure to start (overcrank)- Low coolant temperature- Low coolant level
Programmable protective relaying functions:- Generator phase sequence- Over/Under voltage (27/59)- Over/Under Frequency (81 o/u)- Reverse Power (kW) (32)- Reverse reactive power (kVAr) (32RV)- Overcurrent (50/51)
Communications:- Six digital inputs (4.2 only)- Four relay outputs (Form A)- Two relay outputs (Form C)- Two digital outputs- Customer data link (Modbus RTU)- Accessory module data link- Serial annunciator module data link- Emergency stop pushbutton
Compatible with the following:- Digital I/O module- Local Annunciator- Remote CAN annunciator- Remote serial annunciator
February 13 2012 16:53 PM3

STANDBY 2000 ekW 2500 kVA60 Hz 1800 rpm 480 Volts
TECHNICAL DATA
Open Generator Set - - 1800 rpm/60 Hz/480 Volts DM8263EPA Certified for Stationary Emergency Application(EPA Tier 2 emissions levels)
Generator Set Package PerformanceGenset Power rating @ 0.8 pfGenset Power rating with fan
2500 kVA2000 ekW
Fuel Consumption100% load with fan75% load with fan50% load with fan
522.5 L/hr 138.0 Gal/hr406.8 L/hr 107.5 Gal/hr293.6 L/hr 77.6 Gal/hr
Cooling System1
Air flow restriction (system)Air flow (max @ rated speed for radiator arrangement)Engine Coolant capacity with radiator/exp. tankEngine coolant capacityRadiator coolant capacity
0.12 kPa 0.48 in. water2480 m³/min 87580 cfm475.0 L 125.5 gal233.0 L 61.6 gal242.0 L 63.9 gal
Inlet AirCombustion air inlet flow rate 185.5 m³/min 6550.9 cfm
Exhaust SystemExhaust stack gas temperatureExhaust gas flow rateExhaust flange size (internal diameter)Exhaust system backpressure (maximum allowable)
400.1 º C 752.2 º F433.1 m³/min 15294.8 cfm203.2 mm 8.0 in6.7 kPa 26.9 in. water
Heat RejectionHeat rejection to coolant (total)Heat rejection to exhaust (total)Heat rejection to aftercoolerHeat rejection to atmosphere from engineHeat rejection to atmosphere from generator
759 kW 43164 Btu/min1788 kW 101683 Btu/min672 kW 38217 Btu/min133 kW 7564 Btu/min107.5 kW 6113.5 Btu/min
Alternator2
Motor starting capability @ 30% voltage dipFrameTemperature Rise
4647 skVA825130 º C 234 º F
Lube SystemSump refill with filter 401.3 L 106.0 gal
Emissions (Nominal)3
NOx g/hp-hrCO g/hp-hrHC g/hp-hrPM g/hp-hr
5.45 g/hp-hr.3 g/hp-hr.11 g/hp-hr.025 g/hp-hr
1 For ambient and altitude capabilities consult your Cat dealer. Air flow restriction (system) is added to existing restriction from factory.2 Generator temperature rise is based on a 40 degree C ambient per NEMA MG1-32. UL 2200 Listed packages may have oversizedgenerators with a different temperature rise and motor starting characteristics.3 Emissions data measurement procedures are consistent with those described in EPA CFR 40 Part 89, Subpart D & E and ISO8178-1 formeasuring HC, CO, PM, NOx. Data shown is based on steady state operating conditions of 77ºF, 28.42 in HG and number 2 diesel fuelwith 35º API and LHV of 18,390 btu/lb. The nominal emissions data shown is subject to instrumentation, measurement, facility and engineto engine variations. Emissions data is based on 100% load and thus cannot be used to compare to EPA regulations which use valuesbased on a weighted cycle.
February 13 2012 16:53 PM4

STANDBY 2000 ekW 2500 kVA60 Hz 1800 rpm 480 Volts
RATING DEFINITIONS AND CONDITIONS
Meets or Exceeds International Specifications: AS1359,CSA, IEC60034-1, ISO3046, ISO8528, NEMA MG 1-22,NEMA MG 1-33, UL508A, 72/23/EEC, 98/37/EC,2004/108/ECStandby - Output available with varying load for theduration of the interruption of the normal source power.Average power output is 70% of the standby powerrating. Typical operation is 200 hours per year, withmaximum expected usage of 500 hours per year.Standby power in accordance with ISO8528. Fuel stoppower in accordance with ISO3046. Standby ambientsshown indicate ambient temperature at 100% load whichresults in a coolant top tank temperature just below theshutdown temperature.
Ratings are based on SAE J1349 standard conditions.These ratings also apply at ISO3046 standard conditions.Fuel rates are based on fuel oil of 35º API [16º C (60º F)]gravity having an LHV of 42 780 kJ/kg (18,390 Btu/lb)when used at 29º C (85º F) and weighing 838.9 g/liter(7.001 lbs/U.S. gal.). Additional ratings may be availablefor specific customer requirements, contact your Catrepresentative for details. For information regarding LowSulfur fuel and Biodiesel capability, please consult yourCat dealer.
February 13 2012 16:53 PM5

STANDBY 2000 ekW 2500 kVA60 Hz 1800 rpm 480 Volts
DIMENSIONS
Package DimensionsLength 6424.6 mm 252.94 inWidth 2378.1 mm 93.63 inHeight 2966.3 mm 116.78 in
NOTE: For reference only - do not use forinstallation design. Please contactyour local dealer for exact weightand dimensions. (GeneralDimension Drawing #2846051).
www.Cat-ElectricPower.com
2012 CaterpillarAll rights reserved.
Materials and specifications are subject to change without notice.The International System of Units (SI) is used in this publication.
CAT, CATERPILLAR, their respective logos, "Caterpillar Yellow," the"Power Edge" trade dress, as well as corporate and product identity used
herein, are trademarks of Caterpillar and may not be used withoutpermission.
19498534
Performance No.: DM8263
Feature Code: 516DE5R
Gen. Arr. Number: 2628106
Source: U.S. Sourced
February 13 2012
6

Confidential Supporting Documentation
Appendix E
July 2013 Project No. 0189555
Environmental Resources Management 15810 Park Ten Place, Suite 300
Houston, Texas 77084 (281) 600-1000

Appendix E is confidential and can be found in the Confidential version of this report.