Detection Probability Models for Bluetooth Re ...
13
Young, Sharifi, Sadrsadat, Urena Serulle and Sadabadi 1 Detection Probability Models for Bluetooth Re-identification Technology Stanley Ernest Young Center for Advanced Transportation Technology (CATT), University of Maryland 2200 Technology Ventures Building, 5000 College Avenue, College Park, MD 20742 Phone: (301) 403-4593 Fax: (301) 403-4591 Email: [email protected] Elham Sharifi Department of Civil and Environmental Engineering, University of Maryland 1173 Glenn L. Martin Hall, College Park, MD 20742, USA Phone: (301) 405-6550 Fax: (301) 405-2585 E-mail: [email protected] Hadi Sadrsadat Department of Civil and Environmental Engineering, University of Maryland 1173 Glenn L. Martin Hall, College Park, MD 20742, USA Phone: (301) 405-6550 Fax: (301) 405-2585 E-mail: [email protected] Nayel Urena Serulle Department of Civil and Environmental Engineering, University of Maryland Jeong H. Kim Engineering Building, College Park, MD 20742 Phone: (650)-387-9117 Email: [email protected] Kaveh F. Sadabadi Center for Advanced Transportation Technology (CATT), University of Maryland 2200 Technology Ventures Building, 5000 College Avenue, College Park, MD 20742 Phone: (301) 403-1605 Fax: (301) 403-4591 Email: [email protected] Submission Date: 07/31/2012 Text Word Count: 3902 Figures: 2 Tables: 8 Total Word Count: 6402
Transcript of Detection Probability Models for Bluetooth Re ...
Young, Sharifi, Sadrsadat, Urena Serulle and Sadabadi 1
Detection Probability Models for Bluetooth Re-identification Technology
Stanley Ernest Young
Center for Advanced Transportation Technology (CATT), University of Maryland
2200 Technology Ventures Building, 5000 College Avenue, College Park, MD 20742
Phone: (301) 403-4593
Fax: (301) 403-4591
Email: [email protected]
Elham Sharifi
Department of Civil and Environmental Engineering, University of Maryland
1173 Glenn L. Martin Hall, College Park, MD 20742, USA
Phone: (301) 405-6550
Fax: (301) 405-2585
E-mail: [email protected]
Hadi Sadrsadat
Department of Civil and Environmental Engineering, University of Maryland
1173 Glenn L. Martin Hall, College Park, MD 20742, USA
Phone: (301) 405-6550
Fax: (301) 405-2585
E-mail: [email protected]
Nayel Urena Serulle
Department of Civil and Environmental Engineering, University of Maryland
Jeong H. Kim Engineering Building, College Park, MD 20742
Phone: (650)-387-9117
Email: [email protected]
Kaveh F. Sadabadi
Center for Advanced Transportation Technology (CATT), University of Maryland
2200 Technology Ventures Building, 5000 College Avenue, College Park, MD 20742
Phone: (301) 403-1605
Fax: (301) 403-4591
Email: [email protected]
Submission Date: 07/31/2012
Text Word Count: 3902
Figures: 2
Tables: 8
Total Word Count: 6402

Young, Sharifi, Sadrsadat, Urena Serulle and Sadabadi 2
ABSTRACT Traffic monitoring technology based on identifying a portion of the traffic at an upstream and
downstream sensor provides direct samples of travel time as well as a proportional measure of
through traffic volume. Referred to as re-identification technology, this method has become more
accessible with the introduction of BluetoothTM
based technology since 2008. BluetoothTM
traffic
monitoring (BTM) utilizes anonymous electronic identifiers in wireless communications
providing roughly a 5% sample of through traffic, and is cost effective enough for consideration
on many roadway types. For these reasons BTM is being considered for deployment on
freeways, arterials, and local streets to provide traffic data to support real-time operations,
traveler information, planning, and signal management. Successful applications require
consideration and understanding of the detection properties of BluetoothTM
technology. The
objective of this paper is to provide a model for understanding the expected detection rate and
probability of detection to properly plan a deployment.
Young, Sharifi, Sadrsadat, Urena Serulle and Sadabadi 3
INTRODUCTION
The Bluetooth concept is attractive because of its low capital costs and the high resolution data
that can be obtain from it. However, there is little guidance on the appropriate use of this new
technology (1). Several hardware and software considerations need to be taken into account to
obtain the highest probability of detection. Empirical research in Texas yielded guidance on this
matter. They found that the device needs to be cost-effective, compact, meet the environmental
demands (i.e., withstand extreme temperatures), and be able to transfer the information through
common ports (e.g., USB and Ethernet). Furthermore, they recommend the coupling of a Class 1
adapter and 1db antenna for most traffic applications for acceptable detection rates. Bakula, et al.
learned that the discovery process is probabilistic in nature (2). Given this, they defined the
match probability as the probability that a single vehicle containing a discoverable Bluetooth
radio will be detected by two different scanning radios. The authors specified that the effective
range of the radios and vehicle speed have significant influence in the probability of target
detection. When the effective range of detection approaches 200 meters, 100 meters on each side
of the scanning radio, the impact of vehicle speed is not significant. On the other hand, when
effective range is less than 20 meters the probability for a match could decrease to values lower
than 10%. The device’s antenna is one of the main factors that affect the effective range of
detection, among other factors such as transmission power, channel conditions, and channel
obstructions. Malinovskiy, et al. tested two types of antennae, omni-directional and directional,
to determine the effects of antenna selection on travel time data collection (3). Omni-directional
sensors were found to have a larger detection zone than the directional sensors, which yields a
bigger sample size. However, they subject to more noise and bigger spatial errors, as a vehicle
may be detected anywhere within the zone. Furthermore, research has shown that using an array
of antennas (two to four), instead of a single one, in Bluetooth monitoring stations yields and
average increase in detection between 30% and 50% (4). The reader is reffered to Porter, Kim
and Magaña (5) for more details on Bluetooth data collection devices, its components, and
deployment recommendations.
Successful application of Bluetooth requires consideration and understanding of the
detection properties of its technology. The objective of this paper is to provide a framework for
understanding the expected detection rate and probability of detection to properly plan a
deployment. Also, this paper contributes to the literature by presenting results of empirical
research regarding the effects of antenna, sensor class selection, and base scanning period on
detection rate.
BLUETOOTHTM
DETECTION PROPERTIES A new data collection method based on Bluetooth
TM (BT) technology for travel time
measurement was introduced in 2008. In this new method, BT devices located within vehicles in
the traffic stream are observed by an upstream and downstream BT sensor in order to sample the
travel time of the traffic stream between the two sensors. BluetoothTM
traffic monitoring (BTM)
was originally developed and applied to high-speed freeway applications, specifically for travel
time assessment. On freeways, sensors are placed one mile or more apart, and the BT sensor
power and antenna range are maximized to increase the likelihood of detection. Although on
occasions freeways present some challenging topology for deployment, due to constrictions or
impinging right-of-ways, such situations are rare. Since 2008, BTM has progressed from
sparsely-spaced sensors for high speed freeways applications to characterize the central tendency
of travel time, to more-densely spaced sensors on lower speed arterial facilities to characterize
Young, Sharifi, Sadrsadat, Urena Serulle and Sadabadi 4
both the central tendency and the distribution of travel time to assess the quality of progression
along the corridor. The fundamental detection properties of BTM are reviewed in this section,
developing a detection model that provides guidance for designing BTM deployments along any
type of facility.
Detection Mechanics
Bluetooth standards provide a means for electronic devices to communicate wirelessly using the
license free 2.4 GHz spectrum (6). Standards are maintained by the BT Special Interest Group
(SIG) Full details of the wireless electronic communications standards are beyond the scope of
this document, however, BluletoothTM
properties that impact its use as a traffic monitoring
technology are reviewed to construct a detection model for guiding deployments.
Bluetooth is primarily a cable replacement technology. As such, the communication
range of off-the-shelf BT equipment reflects distances ranging from 1 to 100 meters. A
commercial BT device is one of three power classes with nominal ranges of 100, 30, and 1 meter
for class I, II, and III respectively. The maximum detection range of a roadside BT sensor to a
BT detectable device in a vehicle is determined by the respective power class of the sensor and
the detectable device, and their respective antenna properties. This maximum range and resulting
probability of detection is reduced by other factors such as terrain, antenna placement and
orientation, noise in the 2.4 GHz spectrum, occlusion by other vehicles, and clock
synchronization between devices.
In order for two BT devices to exchange information, they must be paired. Pairing
requires either that the devices be pre-programmed to recognize each other, or they must initiate
a handshaking protocol that allows two unknown devices to exchange identification and
synchronize clocks, the basic information needed to initiate digital communications. In this
handshaking protocol, called the device discovery mode, BT devices provide electronic
identifiers known as a Media Access Control identifier (or MAC IDs). It is the MAC IDs that
allow BT devices to be used for re-identification of vehicles and thus derive traffic information
similar to license plate matching or toll tag data.
During the pairing process, one device, referred to as the master, sends out a standard
inquiry message. The other BT device, referred to as the slave, receives the inquiry message and
responds with a standard message containing its ID and clock synchronization data, as well as
other secondary attributes. As BT is a spread-spectrum, frequency-hopping protocol, the inquiry
message and subsequent response is not issued on a single distinct frequency (or channel), but
rather it is broadcast on various channels and at various times in a sequence and time pattern
prescribed by the BT protocol. The pattern of inquiry is designed to maximize the likelihood that
two un-synchronized devices will pair within a reasonable timeframe, typically cited as 10
seconds.
The minimum time cycle to issue an inquiry and listen for a response on all channels is
1.28 seconds – referred to as a scan cycle. Multiple scan cycles increase the likelihood of pairing
by extending the prescribed sequence of channel hopping. Multiple scan cycles are not simply
repeating the channel hopping sequence of the initial scan, but rather extending the channel
hopping pattern into new patterns to increase pairing likelihood. If two devices are within
communication range, the derived probability of pairing as a function of the number linked scan
periods is summarized in Table 1 based on implementation of version 1.1 of the inquiry scan
specification (7). The length of time to achieve 99% probability of discovered, can be further
reduced with implementation of version 1.2 of the specification and interlacing. However,
Young, Sharifi, Sadrsadat, Urena Serulle and Sadabadi 5
measured results differ from derived due to variation in the implementation of the BT inquiry
standard.
TABLE 1 Probability of Discovery as a Function of Scan Cycles
Scan Cycles Scan Time Percent Discovered
1 1.28s 36.71%
2 2.56s 48.96%
3 3.84s 86.71%
4 5.12s 98.95%
5 6.40s 99.98%
Based on Table 1, in order to achieve 95% or higher probably of detection, a minimum of
4 scan cycles, equivalent to 5.12 seconds between initiation of a new scan period, is necessary.
These probabilities are based on two devices within physical communication range, and assume
no obstruction to the communication signal during the scan time.
Detection Range
The fundamental detection range of a BT sensor is determined by its rated power (indexed by its
Class) and its antenna. The nominal communications range of BT transceivers based on its class
is nominally 100m, 30m, and 1m for Class 1, 2 and 3 respectively. These ranges are based on
identically configured devices using isotropic antennas, an antenna that emits power equally in
all directions.
Antenna can be utilized to distribute the radiated power in various patterns. Because BT
subsystems are typically found on consumer and mobile devices in which the orientation of the
device is variable, most BT radios in consumer equipment are equipped with antennas that
mimic isotropic patterns (0 dB gain). The orientation of a BT sensor can be controlled when it is
deployed, and thus non-isotropic antennas can be used to concentrate the radiated power and
extend the sensor range. Dipole antennas are frequently employed to transform the spherical
distribution into a toroidial pattern (donut shaped) to extend transceiver range laterally when the
dipole antenna is mounted perpendicular to the ground. A typical horizontal and vertical field
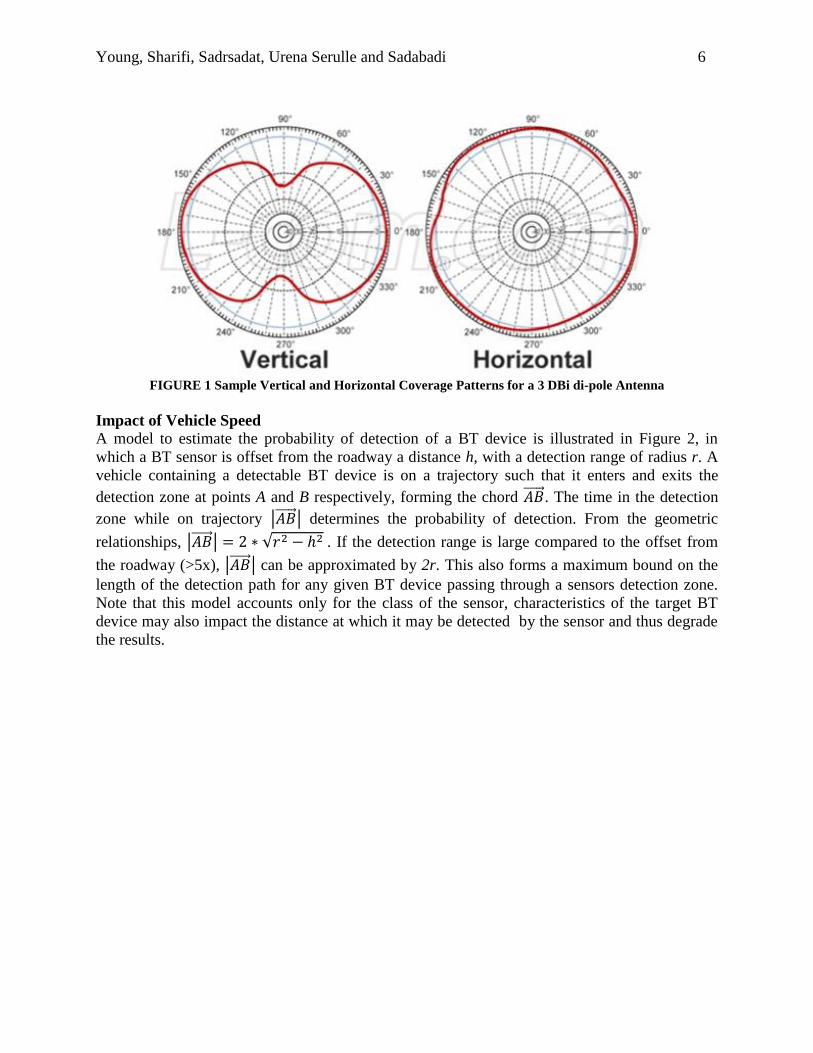
pattern for a dipole antenna is shown in Figure 1. Dipole antennas with gain of 3dBi or greater
are common for Bluetooth applications, extending the nominal range in the plane of the toroid by
a factor of two or more. The higher the gain of the antenna, the more sensitive the receiver is to
deviations from vertical in the orientation of the antenna, limiting the practicality of higher gain
antennas. Antenna with gain greater than 10 dB may be sensitive to vibration, wind and other
effects that could impact its orientation. Other antenna configurations and patterns are possible,
but are beyond the scope of this document
Young, Sharifi, Sadrsadat, Urena Serulle and Sadabadi 6
FIGURE 1 Sample Vertical and Horizontal Coverage Patterns for a 3 DBi di-pole Antenna
Impact of Vehicle Speed
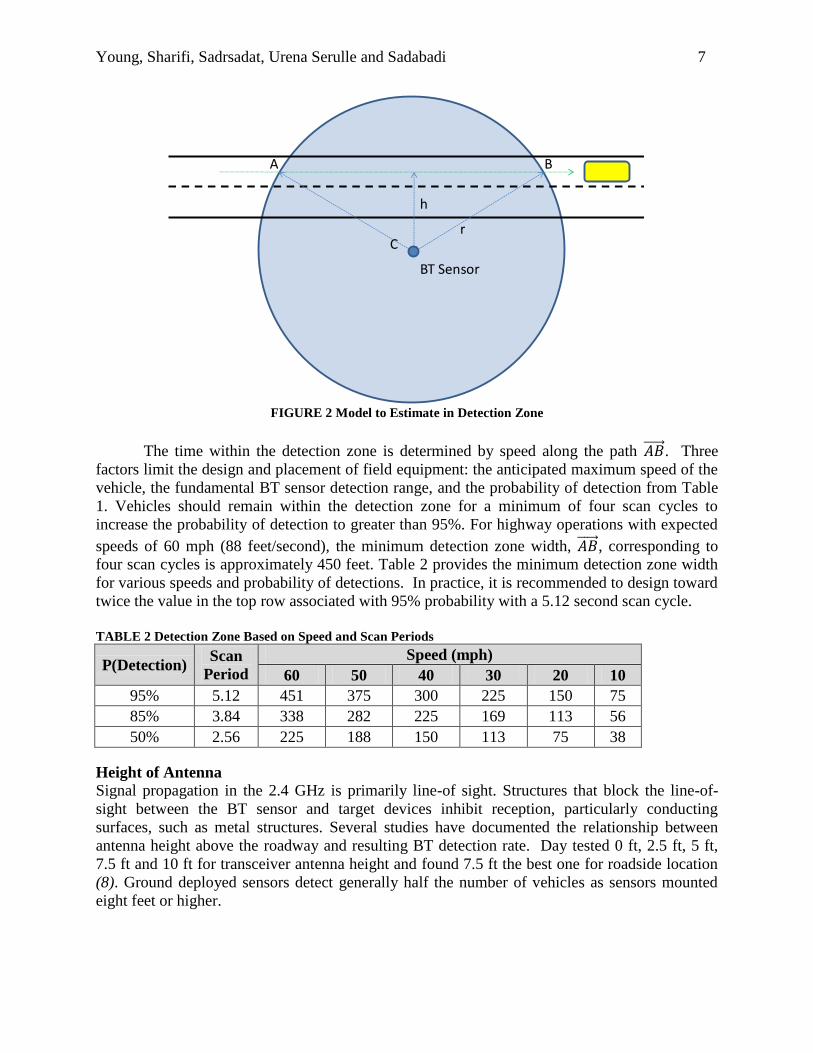
A model to estimate the probability of detection of a BT device is illustrated in Figure 2, in
which a BT sensor is offset from the roadway a distance h, with a detection range of radius r. A
vehicle containing a detectable BT device is on a trajectory such that it enters and exits the
detection zone at points A and B respectively, forming the chord ⃗⃗⃗⃗ ⃗. The time in the detection
zone while on trajectory | ⃗⃗⃗⃗ ⃗| determines the probability of detection. From the geometric
relationships, | ⃗⃗⃗⃗ ⃗| √ . If the detection range is large compared to the offset from
the roadway (>5x), | ⃗⃗⃗⃗ ⃗| can be approximated by 2r. This also forms a maximum bound on the
length of the detection path for any given BT device passing through a sensors detection zone.
Note that this model accounts only for the class of the sensor, characteristics of the target BT
device may also impact the distance at which it may be detected by the sensor and thus degrade
the results.
Young, Sharifi, Sadrsadat, Urena Serulle and Sadabadi 7
FIGURE 2 Model to Estimate in Detection Zone
The time within the detection zone is determined by speed along the path ⃗⃗⃗⃗ ⃗. Three
factors limit the design and placement of field equipment: the anticipated maximum speed of the
vehicle, the fundamental BT sensor detection range, and the probability of detection from Table
1. Vehicles should remain within the detection zone for a minimum of four scan cycles to
increase the probability of detection to greater than 95%. For highway operations with expected
speeds of 60 mph (88 feet/second), the minimum detection zone width, ⃗⃗⃗⃗ ⃗, corresponding to
four scan cycles is approximately 450 feet. Table 2 provides the minimum detection zone width
for various speeds and probability of detections. In practice, it is recommended to design toward
twice the value in the top row associated with 95% probability with a 5.12 second scan cycle.
TABLE 2 Detection Zone Based on Speed and Scan Periods
P(Detection) Scan
Period
Speed (mph)
60 50 40 30 20 10
95% 5.12 451 375 300 225 150 75
85% 3.84 338 282 225 169 113 56
50% 2.56 225 188 150 113 75 38
Height of Antenna
Signal propagation in the 2.4 GHz is primarily line-of sight. Structures that block the line-of-
sight between the BT sensor and target devices inhibit reception, particularly conducting
surfaces, such as metal structures. Several studies have documented the relationship between
antenna height above the roadway and resulting BT detection rate. Day tested 0 ft, 2.5 ft, 5 ft,
7.5 ft and 10 ft for transceiver antenna height and found 7.5 ft the best one for roadside location
(8). Ground deployed sensors detect generally half the number of vehicles as sensors mounted
eight feet or higher.
BT Sensor
A B
C
h
r

Young, Sharifi, Sadrsadat, Urena Serulle and Sadabadi 8
Variability in Detectable Devices
The model in Figure 2 assumes that each detectable device is identical, and that any externalities
act on all BT devices equally. In practice, each device receives signals with differing level of
sensitivity, and emit signals at differing power, and (probably having the most impact) are
located at various positions in the vehicle resulting in varying propagation characteristics as to
when and how long the BT sensor is in range. The combined effect results in a probabilistic
distribution about the fundamental detection range. The detection range for any particular device
may not be symmetric about the sensor. For instance, if the device is on the dash of a truck, it
may easily detectable on the approach to the sensor, and much less detectable on the regress
from the sensor.
Fundamental Detection Rate
The BluetoothTM
fundamental detection rate is defined as the maximum possible sample that can
be obtained from BTM equipment. If every vehicle that contains a detectable device were
captured at both the upstream and downstream sensor, then the ratio of matched-pairs to roadway
volume would equal, or closely approximate the fundamental detection rate.
Various tests on freeway segments suggest that the sampling rate obtained by using
BluetoothTM
sensors is between 2% and 8% of the traffic volume and its average is about 5% (9).
This range of sampling rate reflects many differences in deployment, (ground mount vs
elevated), and varying placement of BT with respect to opportunities for merging and diverging,
diminishing the percentage of through traffic volume.
The BT fundamental detection rate is dependent only on natural occurrence of detectable
BT devices in the vehicle population. The fundamental detection rate can be estimated
experimentally by deploying BT sensors alongside a traffic volume counter on a segment or
roadway with no access points. The BT sensors should be elevated, and of sufficient class and
antenna gain to insure vehicles are within the detection zone for > 10.24 seconds. This
corresponds to a Class 1 transceiver with a 3 dB gain antenna mounted at a nominal 10 feet
above the roadway surface for freeways.
It is critical that no roadway access points are within the test corridor. The placement of
the traffic counter (between or on either side of the BT sensors) is not critical. The ratio of BT
matched-pairs divided by the volume will approximate the BT fundamental detection rate in this
configuration.
FIELD DATA
Data collected at various deployments in Maryland were analyzed to determine the extent to
which data agree with the models for probability of detection given in BluetoothTM Detection
Properties section.
Probability of Detection based on Scan Period
Data from BT sensors deployed on I-95 between Washington D.C. and Baltimore, Maryland
were used to analyze the impact of scan period on the probability of detection. Three sensors are
deployed in the median. The first sensor, A, is deployed in the median just north of the
interchange with MD-100. The second sensor, B, is deployed in the median approximately three
miles to the south of sensor A, north of the interchange with MD32. However, due to elevation
change between the northbound and southbound lanes of I-95, sensor B is elevated about 10 feet
Young, Sharifi, Sadrsadat, Urena Serulle and Sadabadi 9
above northbound lanes, but approximately at road level height for southbound lanes. The third
sensor, C, is deployed three miles south of sensor B, between the interchanges with MD216 and
MD198. The scan period for sensors A and C were set to four during the analysis. The scan
period for sensor B was alternated from four, to three, to two scan periods over the course of
three weeks of data collection. Table 3 presents the percentage of the traversals from sensor A to
sensor C that was captured at sensor B for the various scan period settings.
TABLE 3 Probability of Detection versus Scan Period
I-95 Traffic Direction Scan Cycles
4 3 2
Northbound 92.0% 89.5% 15.3%
Southbound 64.7% 58.9% 29.2%
Northbound results for four scan periods are consistent with results from adjacent sensors
(discussed in next section). As the scan period was reduced to 3 and then 2, the detection
percentage decreased, though not consistently with the proportions predicted in Table 1.
Southbound results for a scan period of four were in line with expectations of a ground deployed
BT sensors, capturing only 64.7% of the traversals from C to A. The impact of changing the scan
period for southbound traffic was consistent as predictions based on Table 1.
Probability of Detection with Adjacent Sensors
Data collected on I-270 as part of a region wide deployment BTM technology was analyzed to
determine the probability of detection of a BT device. BT sensors are deployed along I-270 in
Montgomery County, Maryland as described in Table 4. All sensors were deployed at
approximately 10 feet above the roadway, were Class 1 with a 3dBi dipole antenna.
TABLE 4 Location Descriptions
Sensor Route Direction Location
A I-270 NB On Shoulder Pole of Overhead Sign Sructure
Between Montrose Rd and Tuckerman Lane
B I-270 NB On Shoulder RTMS Pole
Just before the Rt 28/Gude Dr. Overpass
C I-270 SB On Shoulder Pole of New Overhead Sign Structure
Just South of Diamond Ave (117) on Ramp
D I-270 SB On Shoulder Pole of Variable Message Sign Structure
Approx. 0.75 Mile South of Middlebrook Rd
E I-270 Median On Median Pole of Overhead Sign Structure
Approx. 1.5 Miles North of Father Hurley Blvd/Ridge Rd 27
Sensors A and E bound the study area were used to isolate a set of through trips, or
traversals. Traversal between A and D are also known to pass by sensors B, C, and D. For each
confirmed traversal between AE, data from B, C and D were tested to determine if the particular
BT device was detected. Table 5 provides the results in the form of possible permutations of
detections at locations B, C and D. Note all data in Table 5 is conditioned upon detection at
sensors A and E.
Young, Sharifi, Sadrsadat, Urena Serulle and Sadabadi 10
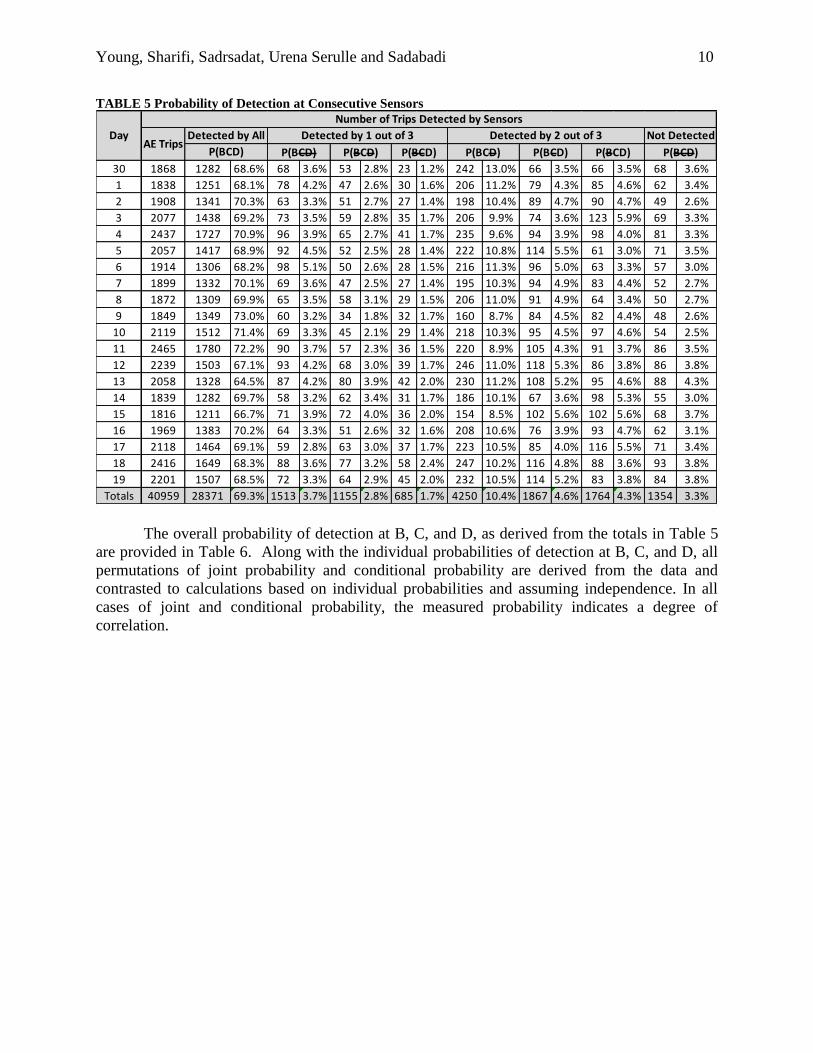
TABLE 5 Probability of Detection at Consecutive Sensors
The overall probability of detection at B, C, and D, as derived from the totals in Table 5
are provided in Table 6. Along with the individual probabilities of detection at B, C, and D, all
permutations of joint probability and conditional probability are derived from the data and
contrasted to calculations based on individual probabilities and assuming independence. In all
cases of joint and conditional probability, the measured probability indicates a degree of
correlation.
30 1868 1282 68.6% 68 3.6% 53 2.8% 23 1.2% 242 13.0% 66 3.5% 66 3.5% 68 3.6%
1 1838 1251 68.1% 78 4.2% 47 2.6% 30 1.6% 206 11.2% 79 4.3% 85 4.6% 62 3.4%
2 1908 1341 70.3% 63 3.3% 51 2.7% 27 1.4% 198 10.4% 89 4.7% 90 4.7% 49 2.6%
3 2077 1438 69.2% 73 3.5% 59 2.8% 35 1.7% 206 9.9% 74 3.6% 123 5.9% 69 3.3%
4 2437 1727 70.9% 96 3.9% 65 2.7% 41 1.7% 235 9.6% 94 3.9% 98 4.0% 81 3.3%
5 2057 1417 68.9% 92 4.5% 52 2.5% 28 1.4% 222 10.8% 114 5.5% 61 3.0% 71 3.5%
6 1914 1306 68.2% 98 5.1% 50 2.6% 28 1.5% 216 11.3% 96 5.0% 63 3.3% 57 3.0%
7 1899 1332 70.1% 69 3.6% 47 2.5% 27 1.4% 195 10.3% 94 4.9% 83 4.4% 52 2.7%
8 1872 1309 69.9% 65 3.5% 58 3.1% 29 1.5% 206 11.0% 91 4.9% 64 3.4% 50 2.7%
9 1849 1349 73.0% 60 3.2% 34 1.8% 32 1.7% 160 8.7% 84 4.5% 82 4.4% 48 2.6%
10 2119 1512 71.4% 69 3.3% 45 2.1% 29 1.4% 218 10.3% 95 4.5% 97 4.6% 54 2.5%
11 2465 1780 72.2% 90 3.7% 57 2.3% 36 1.5% 220 8.9% 105 4.3% 91 3.7% 86 3.5%
12 2239 1503 67.1% 93 4.2% 68 3.0% 39 1.7% 246 11.0% 118 5.3% 86 3.8% 86 3.8%
13 2058 1328 64.5% 87 4.2% 80 3.9% 42 2.0% 230 11.2% 108 5.2% 95 4.6% 88 4.3%
14 1839 1282 69.7% 58 3.2% 62 3.4% 31 1.7% 186 10.1% 67 3.6% 98 5.3% 55 3.0%
15 1816 1211 66.7% 71 3.9% 72 4.0% 36 2.0% 154 8.5% 102 5.6% 102 5.6% 68 3.7%
16 1969 1383 70.2% 64 3.3% 51 2.6% 32 1.6% 208 10.6% 76 3.9% 93 4.7% 62 3.1%
17 2118 1464 69.1% 59 2.8% 63 3.0% 37 1.7% 223 10.5% 85 4.0% 116 5.5% 71 3.4%
18 2416 1649 68.3% 88 3.6% 77 3.2% 58 2.4% 247 10.2% 116 4.8% 88 3.6% 93 3.8%
19 2201 1507 68.5% 72 3.3% 64 2.9% 45 2.0% 232 10.5% 114 5.2% 83 3.8% 84 3.8%
Totals 40959 28371 69.3% 1513 3.7% 1155 2.8% 685 1.7% 4250 10.4% 1867 4.6% 1764 4.3% 1354 3.3%
Day
Number of Trips Detected by Sensors
AE TripsDetected by All Detected by 1 out of 3 Detected by 2 out of 3 Not Detected
P(BCD) P(BCD) P(BCD) P(BCD) P(BCD) P(BCD) P(BCD) P(BCD)

Young, Sharifi, Sadrsadat, Urena Serulle and Sadabadi 11
TABLE 6 Individual, Joint and Conditional Probability of Detection at Consecutive Sensors
Probability Measured Derived
(Assuming Independence)
P(B) 87.9%
P(C ) 86.8%
P(D) 79.1%
P(BC) 79.6% 76.3%
P(CD) 73.6% 68.6%
P(BD) 73.8% 69.5%
P(BCD) 69.3% 60.3%
P(BCD)' 3.3% 0.3%
P(B/C) 91.8% 87.9%
P(B/D) 93.4% 87.9%
P(C/B) 90.6% 86.8%
P(C/D) 93.0% 86.8%
P(D/B) 84.0% 79.1%
P(D/C) 84.8% 79.1%
Impact of Sensor Class and Antenna
The sensitivity to sensor Class and antenna configuration was tested in the same corridor.
Sensors were deployed at two locations as described in Table 7.
TABLE 7 Location Descriptions
Sensor Route Direction Location
Reference Sensor I-270 NB On Shoulder Pole of Overhead Sign Structure
Just before Wootton Pkwy Overpass
Control Sensor &
Test Sensor I-270 NB On Shoulder RTMS Pole
Just before the RT 28 / Gude Dr. Overpass
Over a period of successive weeks, a different configuration of BT test sensor was
deployed. In each configuration, the control sensor was mounted directly above the test sensor
on the same pole. The control and reference sensor were a Class one radio with the 3 dBi dipole
antenna, each mounted about 10 feet above the roadway on the east side of the road. The number
of matched pair between the control and reference sensor were compared to the number of
matched pairs between the test sensor and the reference sensor. During week one the test sensor
was configured with a Class one BT radio and an isotropic antenna. Week two the test sensor
was configured with a Class 2 radio, and a 3dBi dipole antenna. Week three the test sensor was
configured with a Class 2 radio and an isotropic antenna. The comparison of the number of
northbound and southbound traversals registered is shown in Table 8.
The value in the total column indicates the overall performance. In northbound direction
the Class I with an isotropic antenna and a Class II with a 3dBi antenna performed similarly,
capturing 53.3% and 55.1% of the traversals respectively. The Class2 Isotropic antenna captured
35.1% of the traversals.

Young, Sharifi, Sadrsadat, Urena Serulle and Sadabadi 12
In southbound direction the Class I with an isotropic antenna captured 43.1% while Class
II with a 3dBi antenna captured 50.9%, and the Class2 Isotropic antenna captured only 19.4% of
the traversals. The Class 2 with isotropic will have an effective range of approximately 50 feet,
accounting for the 35% diminished detection in the northbound direction. This is amplified in the
southbound lanes where mounting on the east shoulder will further diminish the coverage range
in the southbound lanes.
The captured traversals were also analyzed by the total number of traversals in a 5
minutes period in Table 8. The Class 2 with the 3dB antenna performed relatively constant in
both directions, while the Class 1 with an isotropic antenna appears to vary with the density of
available Bluetooth devices. Note that the power rating of the sensor applies to its transmission
capability only while any antenna gain amplifies both the transmission as well as the received
signal from the BT device. The pattern indicates that the 3dB antenna is more critical to
consistent detection than the broadcast power of the transceiver. However, such patterns may
also be dependent on the manufacture and resulting characteristics of the radio.
TABLE 8 Percent of Traversals vs. Control Sensor
Number of Detections
in 5 minutes Class 1 - Isotropic Class 2 - 3dBi Dipole Class 2 - Isotropic
Northbound
0-10 82.2% 62.6% 43.1%
10-20 79.8% 54.5% 34.0%
20-30 59.8% 54.1% 35.4%
30-40 40.7% 55.4% 35.1%
40-50 37.6% 54.9% 33.0%
50-60 30.6% 53.3% 32.4%
60-70 33.9% 57.1% -
Total 53.3% 55.1% 35.1%
Southbound
0-10 67.2% 54.2% 22.0%
10-20 37.3% 49.6% 18.7%
20-30 32.6% 49.7% 19.3%
30-40 57.1% 53.0% 19.6%
40-50 78.4% 57.7% 19.4%
50-60 - - 5.9%
60-70 - 31.1% -
Total 43.1% 50.9% 19.4%
SUMMARY AND CONCLUSION Successful application of Bluetooth
TM traffic monitoring technology requires consideration and
understanding of the detection properties of BluetoothTM
technology. Detection properties vary
with the Class of radio, scan period, antenna gain, and antenna height. Due to the relationship
between time in the detection zone and probability of detection, deployment should be planned
so that vehicles spend 10 seconds or more within the detection range of the BT sensor with a
scan period of 5.12 seconds or greater. On freeways, this equates to a Class 1 radio with a 3dB
Young, Sharifi, Sadrsadat, Urena Serulle and Sadabadi 13
antenna. On slower speed facilities, lower powered radios and/or lower gain antenna may be
used without significantly diminishing the probability of detection. The probability of detection
when sensors are mounted at appropriate height (about 10 feet) and properly sized approaches
90% as demonstrated in the analysis of consecutive sensors.
REFERENCES
1. Puckett, D., and M. Vickich. Bluetooth-Based Travel Time/Speed Measuring Systems
Development. College Station: Texas Transportatiion Institute, 2010.
2. Bakula, C., W. Schneider, and J. Roth. Probabilistic Model Based on the Effective Range
and Vehicle Speed to Determine Bluetooth MAC Address Matches from Roadside
Traffic Monitoring. Transportation Engineering, Vol. 138, Issue 1, 2012, pp. 43-49.
3. Malinovskiy, Y., Y. Wu, Y. Wang, and U. Lee. Field Experiments on Bluetooth-Based
Travel Time Data Collection. In Transportation Research Board 89th Annual Meeting.
CD-ROM. Transportation Research Board of the National Academics, Washington, DC.,
2010.
4. Box, S., T. Vo, W. Suh, R. Guensler, A. Guin, and M. Hunter. Assessment of
Multiantenna Array Performance for Detecting Bluetooth-Enabled Devices in Traffic
Stream. In Transportation Research Board 91st Annual Meeting. CD-ROM.
Transportation Research Board of the National Academics, Washington, DC., 2012.
5. Porter, J., D. Kim, and M. Magaña. Wireless Data Collection System for Real-Time
Arterial Travel Time Estimates. Portland: Oregon Transportation Research and Education
Consortium, 2011.
6. IEEE Standard 802.15.1 – Part 15.1 Wireless medium access control and physical layer
specifications for wireless personal area networks, 2005.
7. Peterson, B.S., R.O. Baldwin, and J.P. Kharoufeh. Bluetooth Inquiry Time
Characterization and Selection. IEEE Transactions on Mobile Computing, Vol. 5, Issue 9,
2006, pp. 1173-1187
8. Day, B., T. Brennan, A. Hainen, E. Rivera-Hernandez, H. Li, S. Remias, and D. Bullock.
Best Practices for Characterizing Signalized Arterial Performance, In Draft, 2012.
9. Sharifi, E., M. Hamedi, A. Haghani, and H. Sadrsadat, Analysis of Vehicle Detection
Rate for Bluetooth Traffic Sensors: A Case Study in Maryland and Delaware. CD-ROM.
In 18th World Congress on Intelligent Transportation Systems. Orlando, Florida, 2011.


![Investigation of the Probability of Detection of our SHM ... · PDF fileInvestigation of the Probability of Detection of ... MIL-HDBK-1823 [2]. ... Ultrasonic testing internal target](https://static.fdocuments.in/doc/165x107/5a7a104a7f8b9adf778c682a/investigation-of-the-probability-of-detection-of-our-shm-of-the-probability.jpg)