Detection of Vapour Emissions from Star Anise Seeds and ...
9
Detection of Vapour Emissions from Star Anise Seeds and Mint Leaves using the CO 2 Laser Photoacoustic Technique Hasan Al-Masri 1 Derek Lainé 1 Mohanned Al-Jourani 1 Mohammad Abu-Taha *2 Khaled Salem 3 1 School of Physical Sciences and Geography, Keele University, Keele, Staffordshire, ST5 5BG, UK. 2 School of Physical Sciences and Geography, College of Science & Technology, Al-Quds University, P.O. Box 20002, East Jerusalem. 3 Life Sciences Department, College of Science & Technology, Al-Quds University, P.O. Box 20002, East Jerusalem. * Corresponding Author Received: 23 April 2007 e-mail: [email protected] Accepted: 10 June 2007 Abstract The aim of this work was to establish the feasibility of the detection of the vapours of the star anise and mint essential oils emitted from the uncrushed seeds of star anise (Illicium verum H.) and from the leaves of Japanese mint (Mentha arvensis L.) respectively using a heat pipe type of photoacoustic cell in conjunction with a line tunable waveguide CO 2 laser. Infrared photo- acoustic stick spectra were obtained with excellent reproducibility and a high signal-to-noise ratio for the vapour emissions in one atmosphere of nitrogen gas over a temperature range from 20°C up to 180°C in the case of anise seeds and from 20°C to 100°C for mint leaves. Significant differences found between the photoacoustic spectra from the vapour emission of seeds and leaves when compared with commercial samples of the related essential oils are discussed. Key words: Essential Oils, Laser Photacoustics, Mint, Anise, Seeds, Leaves. INTRODUCTION Essential oils constitute the most odorous substances produced by many flowering plants. These are a mixture of volatile components [1], which include monoterpenes, sesquiterpenes, hydrocarbons and associated oxygenated derivatives, and aliphatic aldedydes, alcohols and esters. The non-volatile components include hydrocarbons, fatty acids, sterols, carotenoids, waxes, coumarins, psoralens and flavenoids [2]. The volatility of the first group of compounds makes them steam distillable from their natural sources such as leaves and seeds. The biosynthesic pathway of these compounds arises inside the plant tissues such as the mesophyll of leaves. The final products are then stored in different locations in the epidermal hairs on the leaf surface. The glandular trichomes and glandular hairs on the leaf surface act as storage extensions originating from the leaf epidermis [3]. These are identified as the preferred place of accumulation for essential oils, since these final product compounds are in some known cases to be cytotoxic to the internal tissues [4]. The major functions of essential oils as a secondary metabolite include their very important role in the interaction of plants with insects [5] and the fact that the chemical compounds of an essential oil form part of the defense mechanism in plants [6]. Essential oils find a wide range of commercial applications in the production of perfumes, cosmetics, soaps, and food and beverage flavourings. Some of the essential oil components possess anti-microbial activity and are used in the pharmaceutical industries [6 -7]. Essential oils are also used as pesticides and insecticides. For example, the essential oil vapour of anise Pimpinella anisum L. is reported to have a very effective ovicidal activity against particular types of stored product insects [8] and antifungal bioactivity as shown in recent studies [9]. Moreover, transformed shoot cultures of anise have been established as biotechnological models [10]. In addition to their medicinal use, essential oils are used effectively in aromatherapy [11]. Such wide ranges of uses of essential oils give them a substantial economic value. Seeds and leaves are the primary source of essential oils. The widely used [12-16] and extremely sensitive photoacoustic (PA) laser spectroscopy technique opens up the possibility that ‘fingerprint’ spectra of the vapours emitted from seeds and leaves can be obtained even without crushing or steam distillation, so detection of volatiles can be easily carried out from natural plant parts. In the study reported in this paper the work was divided into two parts. First, the Fourier Transform infrared (FTIR) and PA spectra of commercial samples of the essential oils studied (in the liquid and vapour phase respectively) for the purpose of comparison with the results of the second part of the work which involved the PA detection of the vapour emitted from natural sources viz. anise star (Illicium verum H.) and of mint (Mentha arvensis L.). It is well known that every herb produces a distinctive essential oil mixture that frequently contains a high percentage of a single chemical compound. In the case of anise, anethole is the major component [17-18], whereas menthol is the major constituent of mint oil [18-19]. This principal compound gives the leading characteristic odour for each mother plant. The essential oil producing herbs are grown in the wild or cultivated in gardens, with a wide variation in environmental conditions which include temperature, humidity, rainfall, photoperiod as well as geographical factors such as location and soil type [20]. Although the qualitative composition of any plant oil will be International Journal of Natural and Engineering Sciences 1 (3): 105-113, 2007
Transcript of Detection of Vapour Emissions from Star Anise Seeds and ...

Detection of Vapour Emissions from Star Anise Seeds and Mint Leaves using the CO2 Laser Photoacoustic Technique
Hasan Al-Masri1 Derek Lainé1 Mohanned Al-Jourani1 Mohammad Abu-Taha*2 Khaled Salem3
1 School of Physical Sciences and Geography, Keele University, Keele, Staffordshire, ST5 5BG, UK.2 School of Physical Sciences and Geography, College of Science & Technology, Al-Quds University, P.O. Box 20002, East
Jerusalem.3 Life Sciences Department, College of Science & Technology, Al-Quds University, P.O. Box 20002, East Jerusalem.
* Corresponding Author Received: 23 April 2007 e-mail: [email protected] Accepted: 10 June 2007
Abstract
The aim of this work was to establish the feasibility of the detection of the vapours of the star anise and mint essential oils emitted from the uncrushed seeds of star anise (Illicium verum H.) and from the leaves of Japanese mint (Mentha arvensis L.) respectively using a heat pipe type of photoacoustic cell in conjunction with a line tunable waveguide CO2 laser. Infrared photo-acoustic stick spectra were obtained with excellent reproducibility and a high signal-to-noise ratio for the vapour emissions in one atmosphere of nitrogen gas over a temperature range from 20°C up to 180°C in the case of anise seeds and from 20°C to 100°C for mint leaves. Significant differences found between the photoacoustic spectra from the vapour emission of seeds and leaves when compared with commercial samples of the related essential oils are discussed.
Key words: Essential Oils, Laser Photacoustics, Mint, Anise, Seeds, Leaves.
INTRODUCTION
Essential oils constitute the most odorous substances produced by many flowering plants. These are a mixture of volatile components [1], which include monoterpenes, sesquiterpenes, hydrocarbons and associated oxygenated derivatives, and aliphatic aldedydes, alcohols and esters. The non-volatile components include hydrocarbons, fatty acids, sterols, carotenoids, waxes, coumarins, psoralens and flavenoids [2]. The volatility of the first group of compounds makes them steam distillable from their natural sources such as leaves and seeds. The biosynthesic pathway of these compounds arises inside the plant tissues such as the mesophyll of leaves. The final products are then stored in different locations in the epidermal hairs on the leaf surface. The glandular trichomes and glandular hairs on the leaf surface act as storage extensions originating from the leaf epidermis [3]. These are identified as the preferred place of accumulation for essential oils, since these final product compounds are in some known cases to be cytotoxic to the internal tissues [4]. The major functions of essential oils as a secondary metabolite include their very important role in the interaction of plants with insects [5] and the fact that the chemical compounds of an essential oil form part of the defense mechanism in plants [6].
Essential oils find a wide range of commercial applications in the production of perfumes, cosmetics, soaps, and food and beverage flavourings. Some of the essential oil components possess anti-microbial activity and are used in the pharmaceutical industries [6 -7]. Essential oils are also used as pesticides and insecticides. For example, the essential oil vapour of anise Pimpinella anisum L. is reported to have a very effective ovicidal activity against particular types of stored
product insects [8] and antifungal bioactivity as shown in recent studies [9]. Moreover, transformed shoot cultures of anise have been established as biotechnological models [10]. In addition to their medicinal use, essential oils are used effectively in aromatherapy [11]. Such wide ranges of uses of essential oils give them a substantial economic value. Seeds and leaves are the primary source of essential oils.
The widely used [12-16] and extremely sensitive photoacoustic (PA) laser spectroscopy technique opens up the possibility that ‘fingerprint’ spectra of the vapours emitted from seeds and leaves can be obtained even without crushing or steam distillation, so detection of volatiles can be easily carried out from natural plant parts.
In the study reported in this paper the work was divided into two parts. First, the Fourier Transform infrared (FTIR) and PA spectra of commercial samples of the essential oils studied (in the liquid and vapour phase respectively) for the purpose of comparison with the results of the second part of the work which involved the PA detection of the vapour emitted from natural sources viz. anise star (Illicium verum H.) and of mint (Mentha arvensis L.).
It is well known that every herb produces a distinctive essential oil mixture that frequently contains a high percentage of a single chemical compound. In the case of anise, anethole is the major component [17-18], whereas menthol is the major constituent of mint oil [18-19]. This principal compound gives the leading characteristic odour for each mother plant. The essential oil producing herbs are grown in the wild or cultivated in gardens, with a wide variation in environmental conditions which include temperature, humidity, rainfall, photoperiod as well as geographical factors such as location and soil type [20]. Although the qualitative composition of any plant oil will be
International Journal of Natural and Engineering Sciences 1 (3): 105-113, 2007

M. Abu-Taha et al / IJNES, 1 (3): 105-113, 2007106
similar at various places within the same country, there will often be a difference in the quantitative production of specific oil types on account of the local variations of environmental conditions. Hence it is desirable to advise local growers or collectors of the wild plants of the optimum time for harvesting since the plant passes through various stages of development with a best time for the production of its essential oil with the most desirable characteristics for a specified use. For example, it has been shown that the menthol content of mint increases significantly at the early period of leaf growth [21]. Extraction of essential oils are best obtained by steam distillation. More advanced techniques have been developed in particular for anise oil [22].
MATERIALS and METHODS
Experimental Set-upThe experimental system was comprised of two parts - the
CO2 laser and the PA cell.
Laser SystemA waveguide line-tunable CO2 laser constructed in-house
was used in this study. It was capable of operating over a spectral range of 9-11 µm in four bands. The desired CO2 laser line was obtained by angle adjustment of the intra-cavity diffraction grating using a micrometer. A combined pressure of 80 mbar of the gases He: N2: CO2 in the ratios of 77.5: 13.5: 9.0 respectively gave a peak output power of four watts. The germanium mirror used was coated on the laser discharge tube side to enhance the reflectivity to 80% over the four branches of the four CO2 laser bands and the output side was coated to be anti-reflective. The quartz plasma tube terminated at one end in an O-ring mounted vacuum seal made to the output coupler optic. At the other end near the diffraction grating, the optical waveguide tube was terminated by a zinc selenide window set at the Brewster angle for low optical transmission loss. The germanium mirror had a radius of curvature of 6 m, a thickness of 3 mm, and a diameter of 25 mm.
The Photoacoustic Heat PipeThis type of PA cell was first introduced in 1989 [23] and
is particularly useful for samples with a low vapour pressure. A modified version of this cell was used [24] and employed a cylindrical Pyrex resonator tube of 10 mm outside diameter and 8mm inside diameter, with a total length of 295 mm. The tube was open to buffer volumes of much larger size, of a length chosen to minimize the acoustic background signal originating from the absorption of the laser power by the cell windows. These two buffer volumes were made of brass. The laser beam passed only once through the cell, and was mechanically chopped just before it entered. The cell itself was heated using a double layer of glass-insulated resistance wire wrapped around the central section of the Pyrex tube of length 10 mm. The heat pipe temperature was measured using a thermocouple. Cold water was circulated through two vapour-condensing regions located approximately 40 mm from the centre of the heated part of the pipe. A loosely twisted bundle of ten strands of nickel wire was used to circulate the liquefied oil which condensed at both of the cooled ends of the heat pipe back into hot centre of the working region by
the capillary action of the metal wick. PA signal detection was achieved using a miniature microphone (Knowles type BT-1754) having a sensitivity of 10 mV/pa. The microphone was mounted in a 1.5mm diameter hole drilled 5mm from one end of the Pyrex tube. This positioning was important to protect it from the hot region of the heat pipe. The signal was then progressed through a lock-in amplifier (Stanford Research System, Type SR519) followed by a chart recorder. The phase reference signal for the lock-in amplifier was derived from the variable frequency rotating optical chopper unit (Bentham Model 218F). The gold-coated chopper blade reflected the laser beam alternately into a laser power meter (Ophir, Model 30A-HP) and the PA cell. This scheme was used in preference to a ZnSe laser beam divider so that the full laser power was available alternately for PA cell operation and laser power monitoring. The output of the power meter was fed into the chart recorder alongside the recorded PA signal. Subsequently, the PA signal amplitude was divided by the laser power for each laser line to produce ‘normalized’ line amplitude across the CO2 laser spectrum, independent of the laser power. Each laser line was identified by means of a spectrum analyzer (Optical Engineering, Model 16A). Because of the lack of sensitivity of the spectrum analyzer at low levels of CO2 laser power, a moveable gold-coated mirror mounted at 45° to the laser beam was used to reflect out the full power of each of the CO2 laser lines employed. A schematic diagram of the full system is shown in Figure 1.
ESSENTIAL OIL MATERIALS
AniseAnise oil is a volatile obtained from the dried ripe fruit (i.e.
seeds) of P. anisum L. (Fam. Umbelliferae) or Illicium verum Hook fil. (Fam. Magnoliaceae), where the latter oil is known as Chinese star anise. The plant is an annual herb, indigenous to Asia minor, Egypt and Greece and cultivated in South America, Germany, Spain, Italy, South Russia and Bulgaria. Star anise comes from Southern China, Vietnam, Japan, the Philippines and Jamaica. The importance of anise is in the manufacture of liqueurs and food flavouring. It can be used in medicine as a stimulant, carminative or expectorant as well as an insecticide. The chemical composition of anise oil P. anisum L. [18] is dominated by anethole (C10H12O) which comprises 80-90% of the total oil. This may be compared with trans-anethole of star anise L. verum H. forming 94% [25]. Other minor components include anisaldehyde, methyl chavicol, linalool, a-pinene and others. Anethole has a boiling point of 234.5°C and molecular weight 148.2. The sample of anise seeds of I. verum H. used in this work originated in the West Bank.
MintThe essential oil of mint is derived from Mentha arvensis
L. or Mentha pipereta L. both of which belong to the Labiatae family. M. arvensis L. is indigenous to Japan, and has been introduced to southern California and Brazil. M piperita L. is indigenous to Europe and has been naturalized in northern USA and Canada [18]. Leaves of the plant are the major source of mint essential oil, which is usually extracted by steam distillation. Mint oil constitutes one of the most important and usable flavours in the food manufacturing industry. It has

M. Abu-Taha et al / IJNES, 1 (3): 105-113, 2007 107
various uses including flavouring of toothpaste, oral hygiene products, chewing gum, confectionery, and for pharmaceutical products as a carminative, stimulant, counter-irritant, and nasal decongestant [18, 26]. An important effect is the perceived cooling (or heating) effect of the menthol in the oil when applied to the skin. The chemical composition of mint oil (M. arvensis L.) [27] is principally that of menthol (C10H20O) forming 70-80% of the total oil. It has other chemical components such as neomenthol, pulegone, methyl acetate, piperitone, menthone and others. Menthol has a molecular weight of 156.3 and boiling point of 216° C.
RESULTS AND DISCUSSION
AniseSince the major chemical component, anethole, of both P.
anisum L (anise) and I. verum L. (star anise) oils may reach 80-94% for a given sample, a FTIR spectrum was taken of a commercial liquid sample of anethole to act as a reference spectrum for the PA results obtained for the vapour emitted from anise seeds. This spectrum was found to be characterized by two very strong absorption peaks at 1037 cm-1 and 965 cm-1, with a significant subsidiary peak at 944 cm-1. The FTIR spectrum of star anise oil liquid was then recorded and found to be a very close fit to that of anethole. This was expected in view of the high concentration of anethole in the oil. However the FTIR spectrum of star anise vapour differed from that of the liquid in that it was somewhat broader - which tended to smooth out any closely spaced spectral features. Moreover, spectral shifts were also observed. For example the principal spectral peak of the vapour spectrum shifted by 10 cm-1 relative to that of the liquid to a shorter wavelength viz. 1047 cm-1. The second peak of 965 cm-1 and its subsidiary at 944 cm-1 partially merged to produce a somewhat distorted line shape with a shift of its peak to a longer wavelength of 962 cm-1.
Because the CO2 laser lines fell into four branches with spectral gaps between them, the PA results for star anise showed only segments of the FTIR anethole spectrum. Illustrative normalized PA spectra of star anise are shown in Figure 2 for three values of PA heat pipe cell temperature.
For example, the principal component of anethole falls in the centre of the 9P branch of the CO2 laser, with a spectral peak at 1047 cm-1 corresponding to the CO2 laser line 9P20. The second strong peak which falls at 965 cm-1 could not be reproduced by the PA results for star anise oil vapour since the C16O2 laser used did not tune to this value. Instead, it was the two flanks of the spectral line that were reproduced in the 10R and 10P CO2 laser branches, each with a falling PA signal amplitude with increasing J-value, i.e. each outwards from the non-observed line centre.
The prominent and characteristic PA spectral dip which occurred at 942 cm-1 at the wavelength of the 10P22 CO2 laser line, persisted for the full range of heat pipe PA cell temperatures used (20°C - 180°C), and corresponded to an ill-resolved spectral dip shown for anethole vapour between the second principal peak at 965 cm-1 and its subsidiary peak which accompanies it at 939 cm-1, on the long wavelength side.
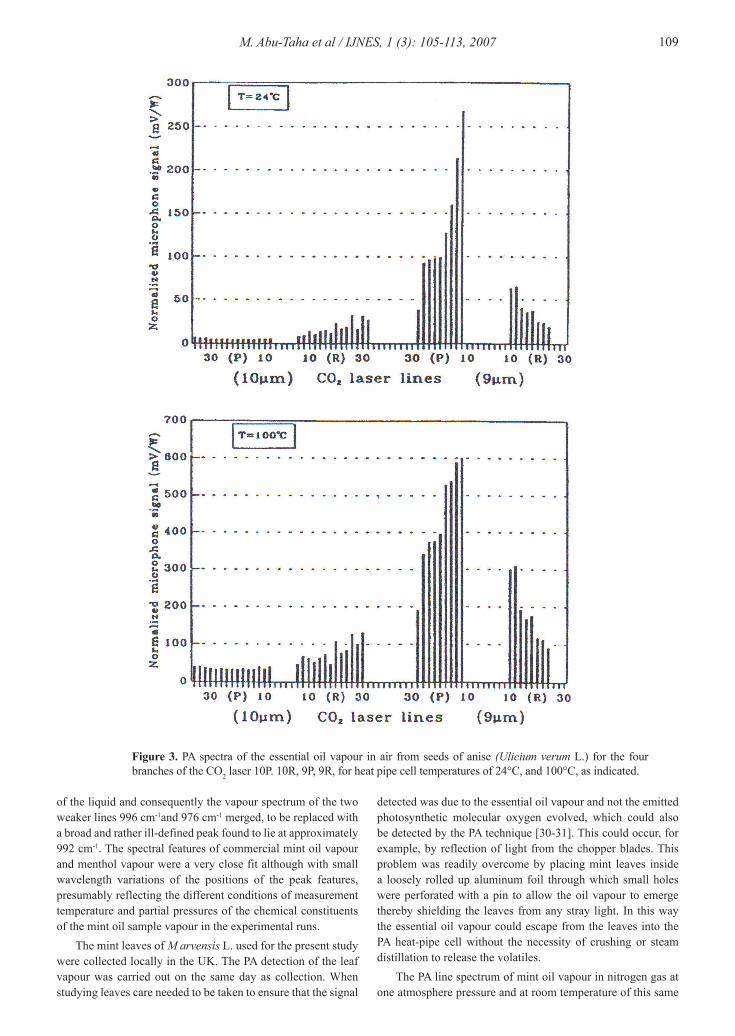
The PA spectrum of the vapour emitted from the uncrushed seeds of star anise was then studied, with the heat pipe cell operated at temperatures of 24°C, 50°C, 84°C and 100°C. A sample of the results for the first and last of these temperatures is shown in the PA line spectrum of Figure 3. Here the PA spectrum corresponding to the 9P branch of the CO2 laser spectrum was obtained with amplitude rising with decreasing wavelength, flanked on its shorter wavelength side by the 9R branch, with reduced relative amplitude with respect to the maximum value attained for the 9P branch. Moreover, the 10P spectrum was now only 6.6% of the maximum value recorded for the 9P line, in contrast to 33% at roughly the same temperature for
Figure 1. Schematic diagram showing the complete experimental set-up of the system used for essential oil vapour detection by the CO2 laser photoacoustic method.

M. Abu-Taha et al / IJNES, 1 (3): 105-113, 2007108
the vapour of commercial star anise oil. However, although the fingerprint structure of the 10P and 10R branches of the CO2 laser PA line spectrum of the vapour from star anise seeds was highly reproducible throughout the range of cell temperatures used, the characteristic spectral shape of neither anethole nor of the vapour of the commercial sample of star essential anise oil was reproduced. It appears therefore that vapour emissions of other chemical compounds completely masked the anethole component of the PA spectrum which was expected to be present but not found. One feature to note however was the small rise in amplitude of the PA spectrum at the 10R20 (976 cm-1) line of the CO2 laser, with respect to neighboring lines particularly in the same temperature range 80°C - 100°C which gave a hint of the presence of water vapour [28-29]. The precise spectral position of the maximum value of anise seed vapour in the 9P branch of the CO2 laser could not be determined since the laser did not tune that far. The normalized spectrum suggests that the maximum lay close to the CO2 laser line 9P12 (1054 cm-1) whereas in contrast the result from the sample of star anise oil vapour result showed a definite peak of absorption at the 9P20 (1047 cm-1) line of CO2. As already stated above, the magnitude and shape of the 10P and 10R spectral bands for PA detection of star anise vapour from uncrushed seeds showed little relation to those of the essential oil vapour of anise star, presumably
because the anethole component is mostly trapped within the seed and any fraction emitted is masked by other volatiles - a result supported by the large signal magnitude obtained from the seeds relative to that of the vapour of commercial Illicium oil. What these other components are, other than the stated hint of water, has not been established. It is therefore inferred that the full anethole component of star anise oil in seeds is only released upon crushing.
Mint The FT-IR infrared spectrum of commercial liquid Japanese
mint oil M. arvensis L. at room temperature was taken over the spectral region 900-1100 cm-1 to serve as a spectral reference for the PA results reported in this paper. Peaks of strong absorption within the spectral region of interest were obtained at 1046 cm-1 and 1025 cm-1 with significant but weaker peaks at 996 cm”1, 976 cm-1 and 918 cm-1. All peaks were measured with a resolution of 1 cm-1. The strongest of these peaks, at 1046 cm-1 just came within the spectral branch 9P of the CO2 laser used, which extended from 1051 cm-1 to 1038 cm-1. The FTIR spectrum of the vapour of mint oil in air at 150°C possessed the same two principal peaks, but a small spectral shift to a longer wavelength (< 1 cm-1) relative to that of the liquid. The vapour spectrum of mint oil, as for anise, was broader than that
Figure 2. PA spectra of the vapour in air of essential oil anise (Ulicium verum L.) for the four of the CO2 laser branches 10P, 10R, 9P, 9R, for heat pipe cell temperatures of 20°C, 120°C, and 180°C, as indicated.
M. Abu-Taha et al / IJNES, 1 (3): 105-113, 2007 109
of the liquid and consequently the vapour spectrum of the two weaker lines 996 cm-1and 976 cm-1 merged, to be replaced with a broad and rather ill-defined peak found to lie at approximately 992 cm-1. The spectral features of commercial mint oil vapour and menthol vapour were a very close fit although with small wavelength variations of the positions of the peak features, presumably reflecting the different conditions of measurement temperature and partial pressures of the chemical constituents of the mint oil sample vapour in the experimental runs.
The mint leaves of M arvensis L. used for the present study were collected locally in the UK. The PA detection of the leaf vapour was carried out on the same day as collection. When studying leaves care needed to be taken to ensure that the signal
detected was due to the essential oil vapour and not the emitted photosynthetic molecular oxygen evolved, which could also be detected by the PA technique [30-31]. This could occur, for example, by reflection of light from the chopper blades. This problem was readily overcome by placing mint leaves inside a loosely rolled up aluminum foil through which small holes were perforated with a pin to allow the oil vapour to emerge thereby shielding the leaves from any stray light. In this way the essential oil vapour could escape from the leaves into the PA heat-pipe cell without the necessity of crushing or steam distillation to release the volatiles.
The PA line spectrum of mint oil vapour in nitrogen gas at one atmosphere pressure and at room temperature of this same
Figure 3. PA spectra of the essential oil vapour in air from seeds of anise (Ulicium verum L.) for the four branches of the CO2 laser 10P. 10R, 9P, 9R, for heat pipe cell temperatures of 24°C, and 100°C, as indicated.

M. Abu-Taha et al / IJNES, 1 (3): 105-113, 2007110
sample was taken over the four spectral branches of the CO2 laser. The result is presented in the line spectrum shown in Figure 4. The PA signal amplitude in each of the 9R and 10P branches showed a distinctive broad mid-branch absorption minimum with centers at 9R18 and 10P18 corresponding to 1077 cm-1
and 946 cm-1 respectively. The strongest PA signal amplitude of mint oil vapour in the 9P branch of the CO2 laser was found to be associated with the line at 9P18 at 1048 cm-1. The PA signals for the 10R branch of the CO2 laser showed a small overall rise in amplitude for decreasing values of wavelength over the twelve CO2 line wavelengths scanned through by the laser. A fair, if not perfect fit was obtained for the features of the spectral profile obtained here using the PA method relative to the FTIR spectra of mint oil and menthol vapours. The small differential spectral shifts of the absorption peaks found were attributed to changes in the diluent’s buffer gas used (e.g. air relative to nitrogen), differences of the cell temperature, and additional chemical components in the case of mint oil, besides menthol. These more detailed aspects have not been studied.
The PA line spectrum taken over the spectral range of the four branches of the CO2 laser for the vapour emission of freshly picked leaves of mint (M. arvensis L.) in nitrogen gas at one atmosphere pressure, extended over a range of temperature from 20°C to 100°C. The results are presented as a set in Figure 5. A comparison of the 20°C results shown in Figures 4 and 5 for the PA spectrum of mint oil vapour and the vapour emission from mint leaves respectively, show a superficial similarity. However there are a number of significant differences. First the signal ratios between the sets of line spectra corresponding to the 10P, 10R and 9R branches of the CO2 laser are shown in Figure 5 (T = 20°C result) are significantly different to those of Figure 4. Moreover the wavelength of the peak signal shown in Figure 4 corresponding to the CO2 laser line 9P20 is not matched in Figure 5, although there is a hint of a partially resolved matching peak on the left hand shoulder of the rising
signal amplitude with deceasing wavelength. A PA signal peak comes within the 9P branch tuning range of the CO2 laser for a PA cell temperature ~60°C and seen more clearly in the 74°C result and again at 100°C, as shown in Figure 5.
The origin of this peak is not well understood since it does not correspond to the strong absorption peak of menthol at 1047 cm-1, i.e. at the wavelength of the line 9P20 shown for mint oil vapour at 20°C in Figure 4. At 74°C a PA signal corresponding to 10R20 is particularly prominent. This line is attributed to water vapour emitted from the mint leaves. This same line is also in evidence at other sample temperatures. It seems reasonable to assume therefore that the menthol spectrum is overlaid with the spectra of other chemical components, especially water. The relative variations of vapour pressure of these components with temperature, as well as spectral shifts for each component as a function of temperature makes the unpacking of the PA spectrum of mint leaf vapour into its chemical components very difficult. What is clear experimentally is that the results of Figure 5 are highly reproducible and as such represent a useful set of fingerprint spectra of the essential oil vapours plus others emitted by the living mint plant leaves, even if the details are not yet well understood. Finally, it is surmised that the absence here of the strong ethylene line 10P14 emitted by many living biological samples [30] could be accounted for by the relatively high concentration of volatiles in the present case of mint leaves.
CONCLUSIONS
Strong and distinctive CO2 laser PA spectra have been obtained for the vapours emitted from uncrushed anise seeds and fresh mint leaves. A comparison has also been made between these PA results obtained over the full operating range of the 12C16O2 laser for commercial samples of anise and mint essential oils and an attempt made to correlate these with their
Figure 4. PA spectrum of mint essential oil (Mentha arvensis L.), at room temperature with CO2 waveguide laser wavelength operating ranges shown for 10P, 10R, 9P, and 9R branches. Buffer gas: nitrogen at one atmosphere pressure.

M. Abu-Taha et al / IJNES, 1 (3): 105-113, 2007 111
corresponding FT-IR absorption spectra. The expectation that the PA spectrum of the vapour emitted from the plant parts would show the distinctive spectra of the principal component of the associated essential oils was fulfilled only partially by fresh mint and not at all by anise seeds. Not surprisingly however, was evidence for the presence of water found in both uncrushed anise seeds and mint leaves. In the case of anise, it is concluded that the outer casing of the seed emits its own characteristic vapour whilst essentially containing the expected essential oil component anethole within it.
In the preparation of the oil, the relative percentages of the chemical components may be expected to differ on account of changes in oil composition due to the age of the harvested material [32], production area in relation to local environment [33], or different distillation conditions [34] on account of the differential volatility of the chemical components of the essential oil mixture. All of these factors, when compounded, can lead to substantial variations in the overall shape of the spectra according to the method of production of the sample. The significance of the work reported here is that the laser PA method is sufficiently sensitive to detect the vapour emitted from plant parts to yield PA fingerprint spectra without crushing or steam distillation to release some, if not all, of the volatile
chemical components. However, the hope that the method could lead to a quick method of determining the maximum yield of the principal component of the associated essential oil unambiguously in a living plant has not been realized. What the results do show is the necessity of crushing, or the like, of the essential oil bearing plant parts for subsequent extraction processes.
On the experimental side, the PA heat pipe cell buffer regions are made of brass which is not ideal on account of adsorption of water vapour. Therefore, it is likely that further improvements can be obtained using nickel wire buffer chambers instead, to reduce cell contamination. The stainless steel wick was found to be critical to the successful attainment of continuous operation.
In conclusion, the sensitivity of the laser PA method allows a phytochemical study of essential oil materials that have an absorption spectrum in the spectral range of a CO2 laser with the proviso that they possess a relatively large percentage of a single chemical component. With refinements, the PA technique should be generally applicable to studies of agricultural aspects of essential oils and other natural products (i.e. secondary metabolites) produced by plants cultivated or grown in the wild from different environmental and geographical areas.
Figure 5. PA line spectra of the vapour emitted from mint leaves taken over the four spectral branches of the CO2 laser with nitrogen as the buffer gas at one atmosphere pressure. Results are shown left to right, top to bottom, for PA cell temperatures of 20° C, 50° C, 74° C and 100° C respectively.

M. Abu-Taha et al / IJNES, 1 (3): 105-113, 2007112
ACKNOWLEDGEMENT
The financial support for travel from the British Council, East Jerusalem to (DL, MA-T) and that from Royal Society of London to (MA-T, KH) are gratefully acknowledged.
REFERENCES
[1] Misharina TA, Polshkov AN. 2005. Anti oxidant properties of essential oils: Autoxidation of essentials oils from laurel and fennel and of their mixtures with essential oil from coriander. Applied Biochemistry and Microbiology. 41: 610-618.
[2] Luque de Castro MD, Jimenez-Carmona MM, Fernandez-Perez V. 1999. Towards more rational techniques for the isolation of valuable essential oils from plants. Trends in Analytical Chemistry 18: 708-716.
[3] Ascensão L, Mota L, Castro MDeM. 1999. Glandular trichomes on the leaves and flowers of Plectranthus ornatus’. morphology, distribution and histochemistry. Ann Botany 84: 437-447.
[4] Brown JT, Hegarthy PK, Charlwood BV. 1987. The toxicity of monoterpenenes to plant cell cultures . Plant Sci 48: 195-201.
[5] Salgueiro LR, Vila R, Tomas X, Canigueral S, Paiva J, ProenQa da Cunha A, Adzet T. 2000. Chemotaxonomic study on Thymus villosus from Portugal. Bioch Systematics Ecology 28: 471-482.
[6] Houghton PJ, Mensah AY. 1999. Biologically active compounds from Budlija species. In: Phytochemicals in Human Health Protection, Nutrition and Plant Defense, 33: Romeo JT. (ed), Kluwer Academic / Plenum Publishers, New York; 343-368.
[7] Smith-Palmer A, Stewart J, Fyfe L. 1998, Antimicrobial properties of plant essential oils and essences against five important food - borne pathogens. Lett Appl Microbiology 26:118- 122.
[8] Tunc I, Berger BM, Erler F, and Dagli F. 2000. Ovicidal activity of essential oils from five plants against two stored-product insects. J of Stored Products Research 36:161-168.
[9] Kosalec I, Pepeljnjak S, and Kustrak D. 2005. Antifungal activity of fluid extract and essential oil from anise fruits (Pimpinella anisum L., Apiaceae). Acta Pharm 55: 377-385.
[10] Salem KMSA, Charlwood BV. 1995. Accumulation of essential oils by Agrobacterium tumefaciens - transformed shoot cultures of Pimpinella anisum. Plant Cell Tissue Organ Culture 40: 209-215.
[11] Olleveant N, Humphris G, and Roe B. 1999. How big is a drop? A volumetric assay of essential oils. J Clinical Nursing 8: 299-304.
[12] Esenaliev RO, Karabutov AA, Oraevsky AA. 1999. Sensitivity of laser opto-acoustic imaging in detection of
small deeply imbedded tumors. IEEE J Selected Topics Quant Elect 5: 981-988.
[13] Foster NS, Amonette JE, Autrey T, Ho JT. 2001. Detection of trace levels of water in oil by photoacoustic spectroscopy. Sensors and Actuators B 77: 620-624.
[14] Andreev VG, Karabutov AA, Oraevsky AA. 2003. Detection of ultrawide-band ultrasound pulses in optoacoustic tomography, IEEE Trans Ultr Ferro Freq Control. 50: 1383 -1390.
[15] Viscovini RC, Cruz FC, Scalabrin A, Pereira D. 2004. Infrared optoacoustic spectroscopy of CHD2 OH around 10R and 10P CO2 laser lines. Int. J. Infrared and Mill. Waves. 25: 257-275.
[16] Liao C-K, Li P-C. 2005. Reconstruction of optical energy deposition for backward optoacoustic imaging. Opt Quant Elect. 37: 1339-1351.
[17] Santos PM, Figueiredo AC, Oliveira MM, Barroso JG, Pedro LG, Deans S, Younus AKM, Schefifer JC. 1998. Essential oils from hairy root cultures and from fruits and roots of Pimpinella anisum. Phtochemistry 48: 455-460.
[18] Tyler VE, Brady LR, and Robbers JE. 1981, In Volatile Oils, Essential Oils: Pharmaconosy. 8 th Edn. Lea and Febiger: Philadelphia. 103 -143.
[19] Ansari MA, Vasudevan P, Tandon M, Razdan RK. 2000. Larvicidal and mosquito repellent action of peppermint (Mentha pipereta) oil. Bioresource Technology 71: 267-271.
[20] Arslan N, Gurbuz B, Sarihan E, Bayrak A, Gumuscu A. 2004. Variation in essential oil content and composition in Turkish anise (Pimpinella anisum L.) population. Turk J Agric For 28:173-177.
[21] Duriyaprapan S, Britten EJ. 1982. The effect of age and location of leaf on quantity and quality of Japanese mint oil production. J Exp Botany 33: 810-814.
[22] Rdrigues V, Rosa P, Marques M, Petenate A, and Meireles, M. 2003. Supercritical extraction of essential oil from aniseed (Pimpinella anisum L.) using CO2: solubility, kinematics and composition data. J Food Chem 51:1518-1523.
[23] Jalink H, Bicanic D. 1989. Concept, design, and use of the photoacoustic heat pipe cell. Appl Phys Lett 55: 1507-1509.
[24] El-Kahlout A, Al-Jourani MMAW, Abu-Taha MI, and Lainé DC, 1998. Laser photoacoustic detection of the essential oil vapours of thyme, mint and anise. SPIE 3405: 578-583.
[25] Della Porta G, Taddeo R, DTJrso E, Reverchon E. 1998. Isolation of clove bud and star anise essential oil by supercritical COi extraction. Lebensm-Wiss -Technol 31: 454- 460.

M. Abu-Taha et al / IJNES, 1 (3): 105-113, 2007 113
[26] Eccles R. 1994. Menthol and related cooling compounds. J Pharm Pharmacol 46: 618- 630.
[27] Strivastava NK, Luthra R, and Naqvi A. 1990, Relationship of photosynthetic carbon assimiliation to essential oil accumulation in developing leaves of Japanese mint. Photosynthetica 24: 406-411.
[28] Shumate MS, Menzies RT, Margolis JS, Rosengren L-G. 1976. Water vapour absorption of carbon dioxide laser radiation. Appl Opt 15: 2480-2488.
[29] Loper GL, O’Neill MA, Gelbwachs JA. 1983. Water-vapour continuum CO2 laser absorption spectra between 27 °C and -10 °C. Appl Optics 22: 3701 -3710.
[30] Bicanic D, Harren F, Reuss J, Woltering E, Vosenek L, Snel J, Voesenek LACJ, Zuidberg B, Jalink H, Bijnen F, Blom CWPM, Sauren H, Kooijman M, van Hove L, Tonk W. 1989. Trace detection in agriculture and biology. In: Photoacoustic, Photothermal and Photochemical Processes in Gases. Hess P. (ed). Springer-Verlag, Berlin. 46: 213-245.
[31] Braslavsky SE. 1986. Photoacoustic and photothermal methods applied to the study of radiationless deactivation processes in biological systems and in substances of biological interest. Photochem Photobiol 43: 667-675.
[32] Southwell IA, Stiff IA. 1989, Ontogenetical changes in monoterpenoids of Melaleuca alternifolia leaf. Photochemistry 28: 1047- 050.
[33] Clark RJ, and Menary RC. 1980. Environmental effects on peppermint (MenthapiperitaL.). I. Effect of daylength, photon flux density, night temperature and day temperature on the yield and composition of peppermint oil. Aust J Plant Physiol 7: 685-692.
[34] Koedam A. 1982. The influence of some distillation conditions on essential oil composition. In: Aromatic Plants: Basic and Applied Aspects, (Margaris N, Koedam A, Vokou D. (eds): Martinus Nijhoff Publishers: The Hague / Boston / London. 229 - 236.