Detection of quantum-dot labelled proteins using soft glass microstructured optical fibers
8
Detection of quantum-dot labeled proteins using soft glass microstructured optical fibers Yinlan Ruan 1 , Erik P. Schartner 1 , Heike Ebendorff-Heidepriem 1 , Peter Hoffmann 2 , Tanya M. Monro 1 1 Centre of Expertise in Photonics, School of Chemistry & Physics 2 Adelaide Proteomics Centre, School of Molecular & Biomedical Science University of Adelaide, Adelaide 5005 Australia [email protected] Abstract: The detection of quantum-dot labeled proteins is demonstrated within lead silicate soft glass microstructured optical fibers using near infrared light. The protein concentration is measured using a new fluorescence capture approach. Light guided within the fiber is used both to excite and collect fluorescent photons, and the detection limit achieved without optimization of the fiber geometry is 1 nM, using just 3% of the guided mode of the fiber. Issues that currently restrict the detection of lower protein concentrations are discussed. ©2007 Optical Society of America OCIS codes: (060.2370) Fiber optics sensors; (170.6280) Spectroscopy fluorescence and luminescence; (300.1030) Absorption; (300.2140) Emission. References and links 1. T. M. Monro, W. Belardi, K. Furusawa, J. C. Baggett, N. G. R. Broderick, D. J. Richardson, “Sensing with microstructured optical fibers,” Meas. Sci. Technol. 12, 854-858 (2001). 2. W. Urbanczyk, "Photonic crystal fibers: new opportunities for sensing", presented at the Third European Workshop on Optical Fiber Sensors, Italy, 4-6 July, 2007. 3. D. Passaro, M. Foroni, F. Poli, A. Cucinotta, S. Selleri, J. Lægsgaard, and A. Bjarklev, "Hollow-core Bragg fiber as a bio-sensor", presented at the Third European Workshop on Optical Fiber Sensors, Italy, 4-6 July, 2007. 4. T. Ritari, J. Tuominen, H. Ludvigsen, J. C. Petersen, T. Sφrensen, T. P. Hansen, AND H. Simonsen, “Gas sensing using air-guiding photonic bandgap fibers,” Opt. Express 12 4080-4087 (2004). 5. J. B. Jensen, L. H. Pedersen, P. E. Hoiby, L. B. Nielsen, T. P. Hansen, J. R. Folkenberg, J. Riishede, D. Noordegraaf, K. Nielsen, A. Carlsen, and A. Bjarklev, “Photonic crystal fiber based evanescent-wave sensor for detection of biomolecules in aqueous solutions,” Opt. Lett. 29, 1974-1976 (2004). 6. S. Smolka, M. Barth, and O. Benson, “Selectively coated photonic crystal fiber for highly sensitive fluorescence detection,” Appl. Phys. Lett. 90, 111101(2007). 7. S. Smolka, M. Barth, and O. Benson, “Highly efficient fluorescence sensing with hollow core photonic crystal fibers”, Opt. Express 15, 12783-12791(2007). 8. A. S. Webb, F. Poletti, D. J. Richardson and J. K. Sahu, “Suspended-core holey fiber for evanescent-field sensing,” Opt. Eng. 46, 010503(2007). 9. W. Henry, “Evanescent field devices: a comparison between tapered optical fibers and polished or D- fibers,” Opt. Quantum Electron. 26, S261-S272 (1994). 10. J. Lou, L. Tong, and Z. Ye, “Modeling of silica nanowires for optical sensing,” Opt. Express 13, 2135- 2140(2005). 11. S. Afshar V., S. Warren-Smith, and T. M. Monro, “Fluorescence-based sensing within microstructured fibers,” Opt. Express, in press, 2007. 12. http://www.schott.com/optics_devices/english/download/index.html. 13. http://probes.invitrogen.com/products/qdot/ . 14. H. Ebendorff-Heidepriem, P. Petropoulos, R. C. Moore, K. Frampton, D. J. Richardson and T. M. Monro, “Fabrication and optical properties of lead silicate glass holey fibers,” J. Non-Cryst. Solids 345-346, 293- 296(2004). 15. http://www.licor.com/bio/IRDyes/PL-IRDye800CW.jsp . 16. http://www.schott.com/optics_devices/english/download/ti-36_fluorescence_of_optical_glass.pdf/ . 17. http://probes.invitrogen.com/resources/spectraviewer/ . #89286 - $15.00 USD Received 1 Nov 2007; revised 10 Dec 2007; accepted 11 Dec 2007; published 13 Dec 2007 (C) 2007 OSA 24 December 2007 / Vol. 15, No. 26 / OPTICS EXPRESS 17819
Transcript of Detection of quantum-dot labelled proteins using soft glass microstructured optical fibers
Detection of quantum-dot labeled proteins using soft glass microstructured optical fibers
Yinlan Ruan1, Erik P. Schartner1, Heike Ebendorff-Heidepriem1, Peter Hoffmann2, Tanya M. Monro1
1Centre of Expertise in Photonics, School of Chemistry & Physics 2Adelaide Proteomics Centre, School of Molecular & Biomedical Science
University of Adelaide, Adelaide 5005 Australia [email protected]
Abstract: The detection of quantum-dot labeled proteins is demonstrated within lead silicate soft glass microstructured optical fibers using near infrared light. The protein concentration is measured using a new fluorescence capture approach. Light guided within the fiber is used both to excite and collect fluorescent photons, and the detection limit achieved without optimization of the fiber geometry is 1 nM, using just 3% of the guided mode of the fiber. Issues that currently restrict the detection of lower protein concentrations are discussed.
©2007 Optical Society of America
OCIS codes: (060.2370) Fiber optics sensors; (170.6280) Spectroscopy fluorescence and luminescence; (300.1030) Absorption; (300.2140) Emission.
References and links
1. T. M. Monro, W. Belardi, K. Furusawa, J. C. Baggett, N. G. R. Broderick, D. J. Richardson, “Sensing with microstructured optical fibers,” Meas. Sci. Technol. 12, 854-858 (2001).
2. W. Urbanczyk, "Photonic crystal fibers: new opportunities for sensing", presented at the Third European Workshop on Optical Fiber Sensors, Italy, 4-6 July, 2007.
3. D. Passaro, M. Foroni, F. Poli, A. Cucinotta, S. Selleri, J. Lægsgaard, and A. Bjarklev, "Hollow-core Bragg fiber as a bio-sensor", presented at the Third European Workshop on Optical Fiber Sensors, Italy, 4-6 July, 2007.
4. T. Ritari, J. Tuominen, H. Ludvigsen, J. C. Petersen, T. Sφrensen, T. P. Hansen, AND H. Simonsen, “Gas sensing using air-guiding photonic bandgap fibers,” Opt. Express 12 4080-4087 (2004).
5. J. B. Jensen, L. H. Pedersen, P. E. Hoiby, L. B. Nielsen, T. P. Hansen, J. R. Folkenberg, J. Riishede, D. Noordegraaf, K. Nielsen, A. Carlsen, and A. Bjarklev, “Photonic crystal fiber based evanescent-wave sensor for detection of biomolecules in aqueous solutions,” Opt. Lett. 29, 1974-1976 (2004).
6. S. Smolka, M. Barth, and O. Benson, “Selectively coated photonic crystal fiber for highly sensitive fluorescence detection,” Appl. Phys. Lett. 90, 111101(2007).
7. S. Smolka, M. Barth, and O. Benson, “Highly efficient fluorescence sensing with hollow core photonic crystal fibers”, Opt. Express 15, 12783-12791(2007).
8. A. S. Webb, F. Poletti, D. J. Richardson and J. K. Sahu, “Suspended-core holey fiber for evanescent-field sensing,” Opt. Eng. 46, 010503(2007).
9. W. Henry, “Evanescent field devices: a comparison between tapered optical fibers and polished or D-fibers,” Opt. Quantum Electron. 26, S261-S272 (1994).
10. J. Lou, L. Tong, and Z. Ye, “Modeling of silica nanowires for optical sensing,” Opt. Express 13, 2135-2140(2005).
11. S. Afshar V., S. Warren-Smith, and T. M. Monro, “Fluorescence-based sensing within microstructured fibers,” Opt. Express, in press, 2007.
12. http://www.schott.com/optics_devices/english/download/index.html. 13. http://probes.invitrogen.com/products/qdot/. 14. H. Ebendorff-Heidepriem, P. Petropoulos, R. C. Moore, K. Frampton, D. J. Richardson and T. M. Monro,
“Fabrication and optical properties of lead silicate glass holey fibers,” J. Non-Cryst. Solids 345-346, 293-296(2004).
15. http://www.licor.com/bio/IRDyes/PL-IRDye800CW.jsp. 16. http://www.schott.com/optics_devices/english/download/ti-36_fluorescence_of_optical_glass.pdf/. 17. http://probes.invitrogen.com/resources/spectraviewer/.
#89286 - $15.00 USD Received 1 Nov 2007; revised 10 Dec 2007; accepted 11 Dec 2007; published 13 Dec 2007
(C) 2007 OSA 24 December 2007 / Vol. 15, No. 26 / OPTICS EXPRESS 17819
18. H. Ebendorff-Heidepriem, Y. Li, and T. M. Monro, “Reduced loss in extruded micorstructured optical fiber,” presented at the Australian Conference on Fibre Technology, Australia, 24-27 July 2007.
19. Y. Ruan, W. Li, R. Jarvis, N. Madsen, A. Rode, and B. Luther-Davies, “ Fabrication and characterization of low loss rib chalcogenide waveguide made by dry etching,” Opt. Express 12, 5140-5145(2004).
20. T. Nakamura, H. Kimura, M. Kato, S. Kurashige and K. Wakamatsu, “A sensitive and reliable quantification method for mouse interleukin-12 p70 based on fluorometric sandwich ELISA (FS-ELISA),” Cell Biol. Int. 31, 173-179(2007).
1. Introduction
Microstructured optical fibers (MOFs) possess a cladding region that is defined by a fine array of air holes extending along the full fiber length, and they are typically made from a single material. MOFs can be designed so that the overlap between the guided mode and the holes is significant [1]. If these holes are filled with an aqueous solution, it is possible to detect species of interest within the solution via exploiting interactions with the guided light.
Hollow core photonic bandgap fibers (a sub-class of MOFs) are attractive for sensing because they allow light to be guided within the central hole, which is surrounded by smaller cladding holes that provide the bandgap confinement [2]. They have been used to detect gas and biomolecules [4-5]. Ref.[6-7] reports the detection of 1 nM of rhodamine 6G dye using hollow core silica photonic bandgap fiber. However, due to the narrow transmission bandwidth of this class of fibers (approximately 200 nm in this example) [4], applications are restricted since only those samples with strong absorption and/or emission features within this band can be detected.
Solid core MOFs make use of the holey cladding region to transmit light within and around a solid core based on the effective index-guiding mechanism. The transmission spectrum of these fibers is in general defined by the material loss (provided that the confinement loss is negligible, which can be achieved through appropriate design). This provides more flexibility than photonic bandgap fibers for the detection of a variety of samples. For example, a one meter long solid core MOF made from silica glass has been used to detect acetylene from an observation of the spectral absorption lines of the sample [8].
Solid core MOFs can also combine the advantages of an optical fiber host (in terms of robustness and a long interaction length) with the large available evanescent field that can be achieved in a fiber taper [9] or nanowire [10] and the ability of a high index fiber core to capture fluorescent photons. The use of a jacket provides a robust (>100 μm) outer diameter for easy handling and response stability. Note that the interaction length is not only determined by the available fiber length, but also by the fiber loss. We have recently developed a formalism that is capable of predicting the fluorescence intensity that is captured by the fiber core and propagates to the fiber end and thus can be detected [11]. For any given set of parameters, this model predicts that there is an optimal length of fiber for which the fluorescence at the output end of the fiber is maximized. When the fiber length is less than the optimum length, the fluorescence increases with increased fiber length. For longer fiber lengths, fiber attenuation dominates, and the fluorescence power decays with fiber length.
Here we report a highly efficient biological sensor based on small solid core low index soft glass MOFs made from commercial lead silicate glasses SF57, F2 or LLF1 purchased from the Schott Glass Company [12]. The biological sample chosen for this study is a commercially available CdTe-ZnS quantum-dot labeled goat F(ab')2 anti-mouse IgG conjugate in aqueous solution from Invitrogen [13]. We have detected concentrations of the conjugate as low as 1 nM via direct measurements of the dye fluorescent intensity from the output end of the fibers.
2. Experimental set-up
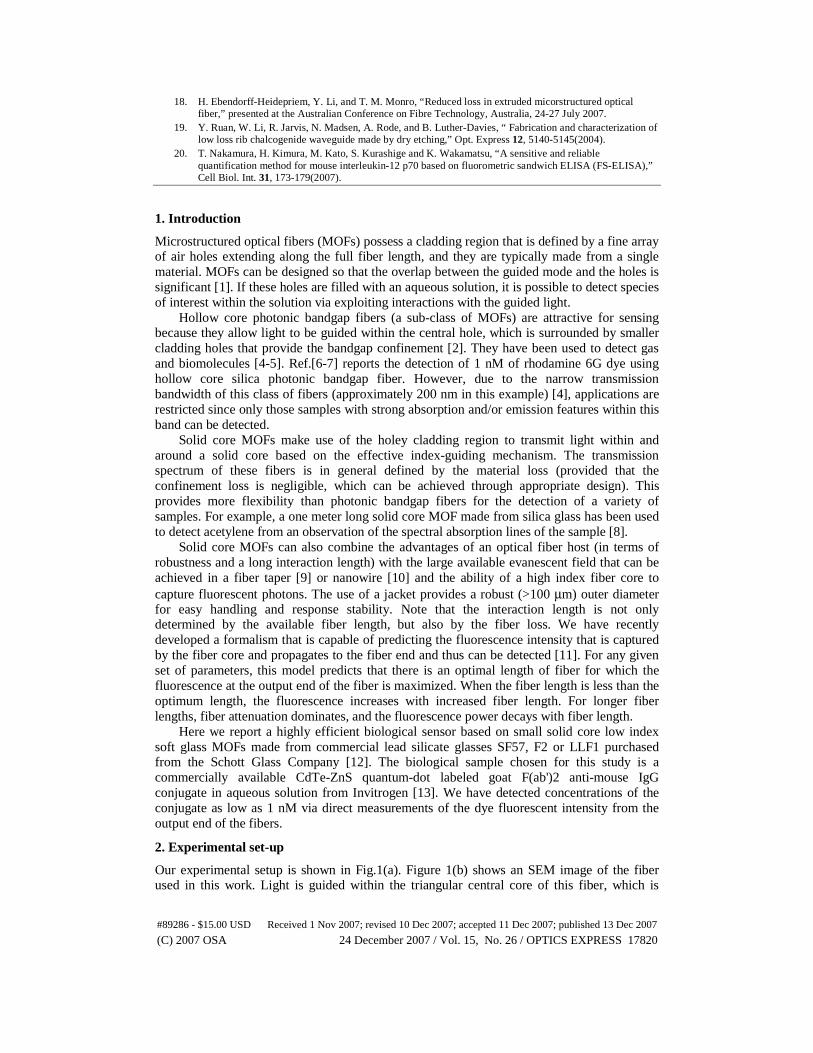
Our experimental setup is shown in Fig.1(a). Figure 1(b) shows an SEM image of the fiber used in this work. Light is guided within the triangular central core of this fiber, which is
#89286 - $15.00 USD Received 1 Nov 2007; revised 10 Dec 2007; accepted 11 Dec 2007; published 13 Dec 2007
(C) 2007 OSA 24 December 2007 / Vol. 15, No. 26 / OPTICS EXPRESS 17820
optically isolated from the outer solid glass region via 3 fine supporting struts. The dye-labeled protein is first filled into the holes of the fibers via capillary forces. Dye molecules within the solution-filled holes are excited by the portion of the modal field that is located within the holes surrounding the core. Fluorescent photons are emitted in all directions, and a fraction of these are captured within the fiber core, and guided along the fiber to the fiber end, where it can be detected by an optical spectrum analyzer (OSA). The fluorescent intensity that can be measured at the fiber output depends on the quantum efficiency of the dye, the intensity of the evanescent field and the interaction length. The fiber loss leads to attenuation for both the excitation and emitted light. At the output end of the fiber, a spatial filter is used to block the light present in the cladding modes.
(a) (b)
Fig. 1. (a). Experimental setup; (b). Suspended core fibers in lead silicate glasses used in our experiments.
3. Fiber design
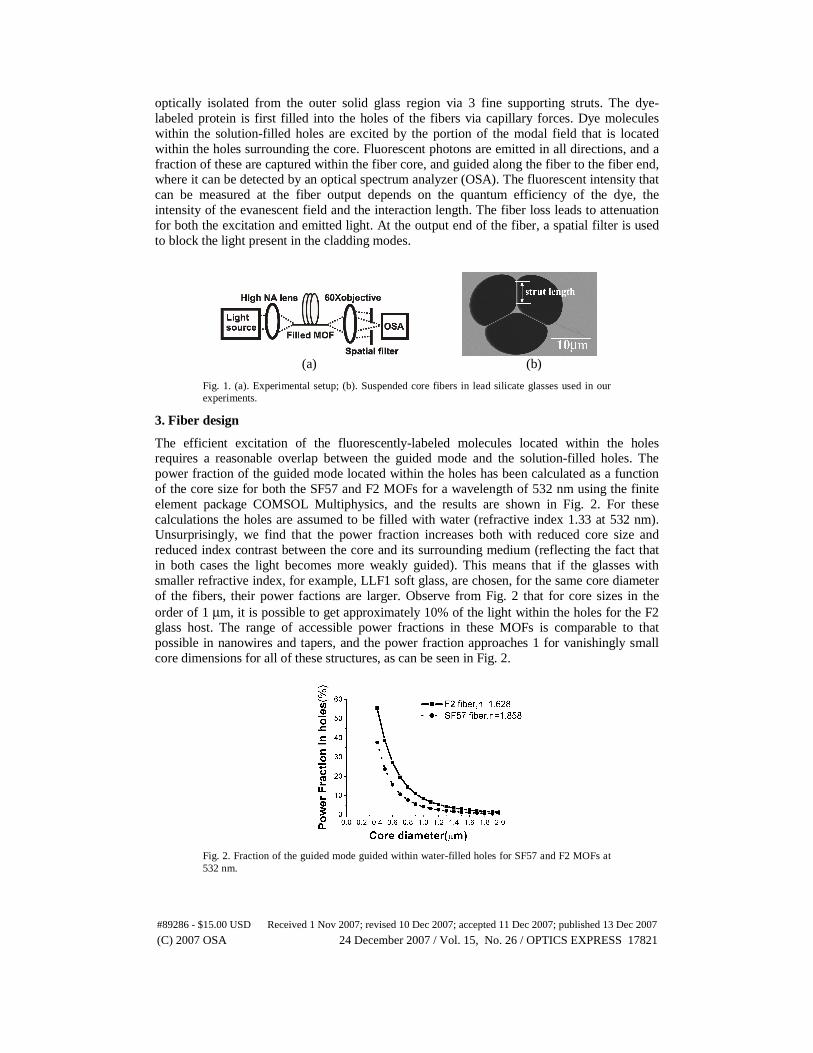
The efficient excitation of the fluorescently-labeled molecules located within the holes requires a reasonable overlap between the guided mode and the solution-filled holes. The power fraction of the guided mode located within the holes has been calculated as a function of the core size for both the SF57 and F2 MOFs for a wavelength of 532 nm using the finite element package COMSOL Multiphysics, and the results are shown in Fig. 2. For these calculations the holes are assumed to be filled with water (refractive index 1.33 at 532 nm). Unsurprisingly, we find that the power fraction increases both with reduced core size and reduced index contrast between the core and its surrounding medium (reflecting the fact that in both cases the light becomes more weakly guided). This means that if the glasses with smaller refractive index, for example, LLF1 soft glass, are chosen, for the same core diameter of the fibers, their power factions are larger. Observe from Fig. 2 that for core sizes in the order of 1 μm, it is possible to get approximately 10% of the light within the holes for the F2 glass host. The range of accessible power fractions in these MOFs is comparable to that possible in nanowires and tapers, and the power fraction approaches 1 for vanishingly small core dimensions for all of these structures, as can be seen in Fig. 2.
Fig. 2. Fraction of the guided mode guided within water-filled holes for SF57 and F2 MOFs at 532 nm.
#89286 - $15.00 USD Received 1 Nov 2007; revised 10 Dec 2007; accepted 11 Dec 2007; published 13 Dec 2007
(C) 2007 OSA 24 December 2007 / Vol. 15, No. 26 / OPTICS EXPRESS 17821
The fluorescence formalism developed within Ref.[11] also demonstrates that (unsurprisingly) the detectable fluorescent power increases for smaller core sizes, and reduces with lower dye concentrations. The optimum fiber length increases with reduced fiber loss and reduced concentration of the dyes. For example, this model predicts that the optimal length of a F2 MOF filled with 50 μM rhodamine B is approximately 6 meters, assuming a filled fiber loss of 0.5 dB/m at both excitation wavelength (532 nm) and emission wavelength (590 nm) and a core size of 1 μm [11]. Such fibers are helpful for improving the detection sensitivity for protein sensing. However, for such a relatively long length, in order to achieve reasonable filling times it becomes necessary to use pressurization techniques to force the samples into the holes along the fiber length. For the work reported here, relatively short fiber lengths have been used (tens of centimeters) due to degradation of the output power for buffer filled fibers (which will be described later), and capillary action alone is used to fill the holes.
The SF57 and F2 MOFs used here were fabricated using extrusion [14] to produce the fiber preforms, and the final drawn fibers used within these experiments have core diameters of 1.3 and 1.9 μm respectively, and strut lengths (as defined in Fig. 1(b)) of 6 and 7.5 μm. Hence 2.0% of the total power of the 532 nm pump is located in the holes for the SF57 MOF, and 1.5% for the F2 MOF. As is evident from Fig. 2, there is clearly room for a great deal of improvement in the power fraction simply by reducing the size of the core in future fibers. The losses of the unfilled SF57 and F2 fibers were recorded to be 5 dB/m and 1.8 dB/m respectively at 532. These losses in the visible are relatively higher than the losses at near infrared wavelengths for the soft glasses. The calculated optimum lengths for the SF57 and F2 MOFs are 1.6 m and 4.2 m, respectively.
4. Identification of suitable dyes for soft glasses
In identifying suitable dyes for labeling protein samples for sensing using soft glass-based MOFs, wavelength constraints associated with the use of soft glass materials must be considered. Both SF57 and F2 glass have a transmission window ranging from approximately 500 nm to 2 microns, so it is necessary to choose dyes with excitation and fluorescence wavelengths within this range. Originally the organic IRDye800 dye [15] was chosen in our study since it exhibits an absorption maximum at 774 nm and an emission maximum of 789 nm in phosphate buffered saline (PBS) buffer. This is a region of the near-infrared spectrum in which aqueous media are largely transparent and which also works well for transmitting light within soft glasses. However, when a 774 nm pump laser was used as excitation source, it was found that the tail of the field of the pump laser easily swamped the fluorescent signal due to the relatively small separation between the maximum absorption and emission wavelengths in this dye. In addition, photobleaching is a very significant issue for this organic dye. In order to achieve stable detection of the proteins, the quantum dot dye Qdot800 from Invitrogen [13] was selected to replace IRDye800. The Qdot800 dye possesses a very broad absorption spectrum ranging from UV to near infrared. Thus its excitation wavelength can be chosen to achieve a reasonable separation from the maximum emission wavelength of 800 nm for easy fluorescence detection, while the dye still maintains high emission efficiency and the loss of the SF57 and F2 glasses is not prohibitive.
For our experiments, a 532 nm laser with 22 mW power is employed as an excitation source in order to exploit the reasonably high extinction coefficient of the Qdots (around 10 times higher than that of IRDye800 at 532 nm) and relatively low fiber loss. Due to its emission wavelength being dependent on the Qdot crystal size, the emission spectrum of the Qdot is much narrower than most organic dyes. This makes its fluorescence more easily identified above the background signal. The photostability of the Qdots are also several orders of magnitude greater than the IRDye 800 [13].
#89286 - $15.00 USD Received 1 Nov 2007; revised 10 Dec 2007; accepted 11 Dec 2007; published 13 Dec 2007
(C) 2007 OSA 24 December 2007 / Vol. 15, No. 26 / OPTICS EXPRESS 17822
5. Experimental results
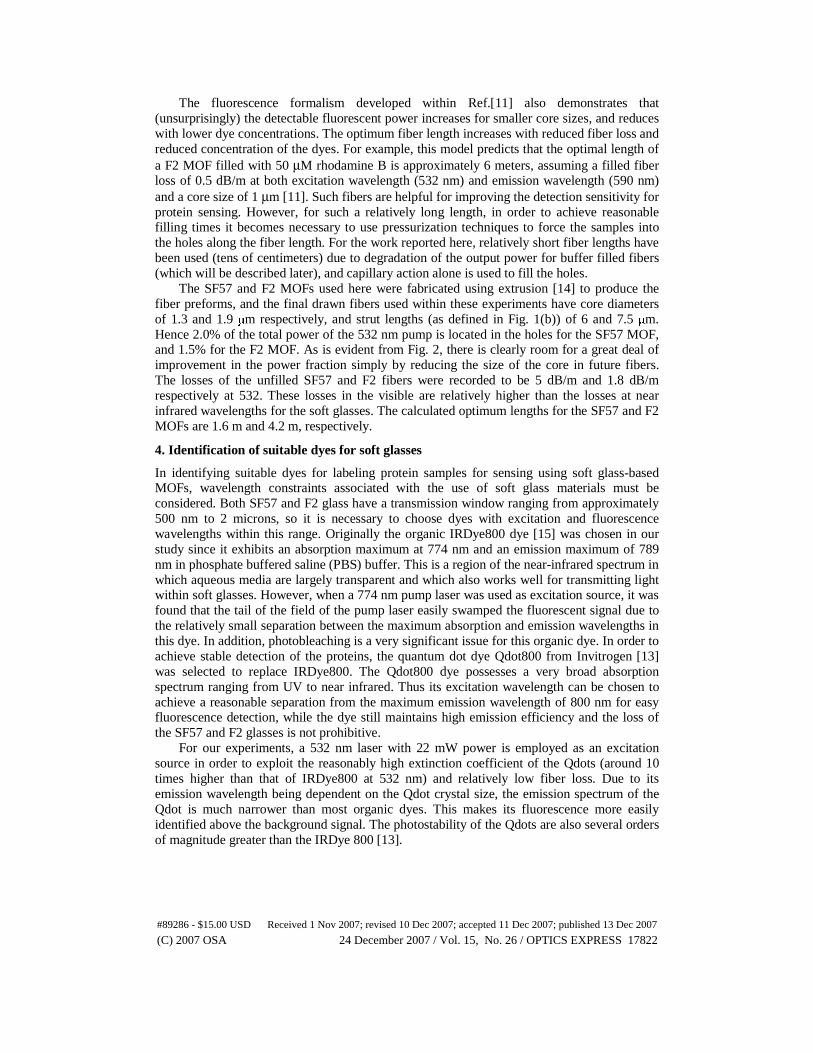
Experimental work commenced with a SF57 MOF filled with CdTe-ZnS quantum-dot labeled protein solution diluted in 1×PBS buffer. Two spectra of the two fibers separately filled with 0.1 μM and 1 μM are shown in Fig. 3(a) (reduced in scale by a factor of 10 for the 1 μM case). The maximum fluorescence powers of both spectra were several orders lower than theoretically predicted maximum using the fluorescence formalism from Ref.[11]. Also detectable fluorescence signals were observed only in tens of centimeters of the SF57 fibers. This is due to much increased coupling and fiber loss caused by fiber degradation after PBS filling in our experiments, which will be described later. It is also noted that the maximum emission wavelengths for both concentrations are shifted, which is caused by free-space coupling of the light into the OSA, and has been avoided in the later experiments shown in this paper. Due to relatively low fiber loss and high coupling efficiency compared with the SF57 MOFs, the F2 MOF showed a peak fluorescence 7 times of that in detected in the SF57 MOF using a 1 μM concentration. All the spectra of the F2 MOFs for different concentrations are presented in Fig. 3(b) (reduced in scale by a factor of 20 for the 1 μM case). The detection limit for the F2 MOF was found to be 50 nM. When the concentration was reduced to 10 nM, the spectrum of the fluorescence from the F2 MOF was broader than that of the Qdots as shown in Fig. 4(a). Similar spectral features were also observed in the un-filled F2 MOF, as shown in the same figure, which is thought to be background fluorescence from the glass itself. This background fluorescence signature originates from impurities within the F2 glass material [16]. It swamped the signal from the Qdots, thus limiting the direct detection of the fluorescence from relatively low protein concentrations.
(a) (b)
Fig. 3. (a). Measured fluorescence of the SF57 MOF; (b). Measured fluorescence of the F2 MOF. The insert is magnified spectrum for 10 nM fluorescence.
Another experimental issue we observed was that the output power from the PBS-filled
F2 or SF57 MOFs reduced quickly over time, while distilled water filled MOFs showed no variation in the output power. The SEM image of the input endface of the PBS-filled F2 MOF after degradation is presented in Fig. 4(b). Contamination from crystals is evident at the endface, which is likely to be salt deposits crystallized out from the PBS solution due to water evaporation from the fiber ends. Scattering from these crystals provides an explanation for the observed power degradation. The high losses associated with scattering from the deposited crystals also explain why the fluorescence signals were only observed from relatively short (tens of centimeters long) SF57 or F2 MOFs.
#89286 - $15.00 USD Received 1 Nov 2007; revised 10 Dec 2007; accepted 11 Dec 2007; published 13 Dec 2007
(C) 2007 OSA 24 December 2007 / Vol. 15, No. 26 / OPTICS EXPRESS 17823
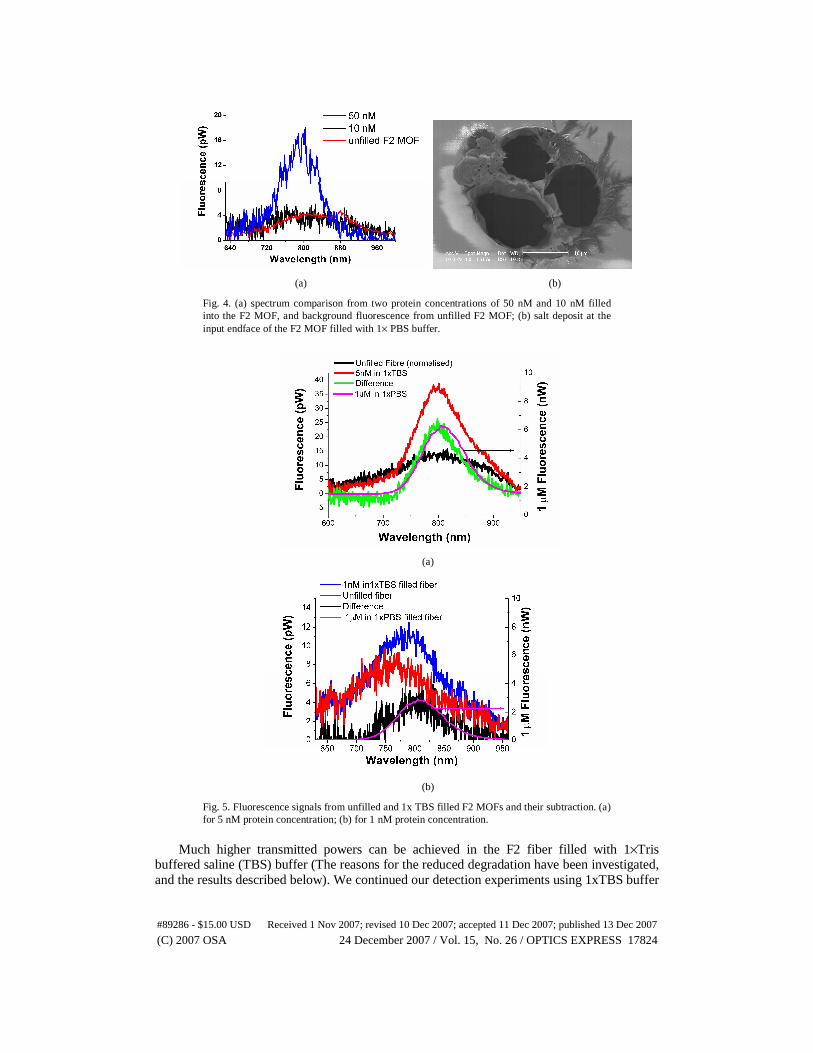
(a) (b)
Fig. 4. (a) spectrum comparison from two protein concentrations of 50 nM and 10 nM filled into the F2 MOF, and background fluorescence from unfilled F2 MOF; (b) salt deposit at the input endface of the F2 MOF filled with 1× PBS buffer.
(a)
(b)
Fig. 5. Fluorescence signals from unfilled and 1x TBS filled F2 MOFs and their subtraction. (a) for 5 nM protein concentration; (b) for 1 nM protein concentration.
Much higher transmitted powers can be achieved in the F2 fiber filled with 1×Tris
buffered saline (TBS) buffer (The reasons for the reduced degradation have been investigated, and the results described below). We continued our detection experiments using 1xTBS buffer
#89286 - $15.00 USD Received 1 Nov 2007; revised 10 Dec 2007; accepted 11 Dec 2007; published 13 Dec 2007
(C) 2007 OSA 24 December 2007 / Vol. 15, No. 26 / OPTICS EXPRESS 17824
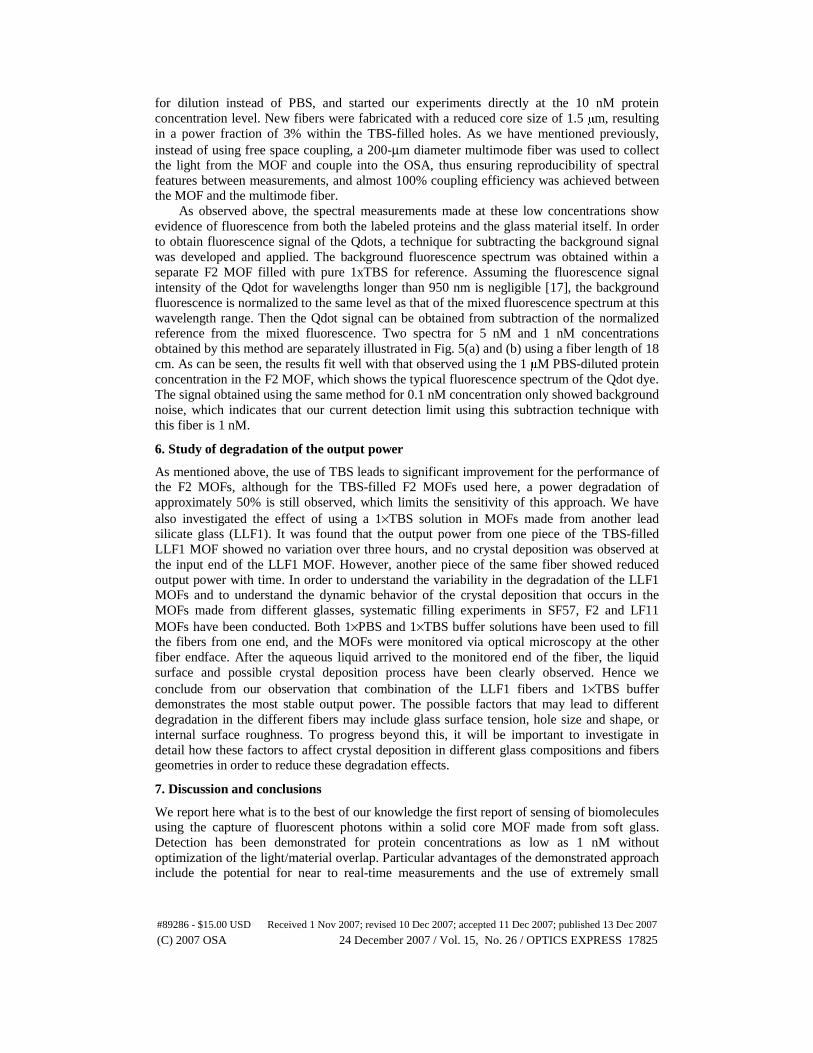
for dilution instead of PBS, and started our experiments directly at the 10 nM protein concentration level. New fibers were fabricated with a reduced core size of 1.5 μm, resulting in a power fraction of 3% within the TBS-filled holes. As we have mentioned previously, instead of using free space coupling, a 200-μm diameter multimode fiber was used to collect the light from the MOF and couple into the OSA, thus ensuring reproducibility of spectral features between measurements, and almost 100% coupling efficiency was achieved between the MOF and the multimode fiber.
As observed above, the spectral measurements made at these low concentrations show evidence of fluorescence from both the labeled proteins and the glass material itself. In order to obtain fluorescence signal of the Qdots, a technique for subtracting the background signal was developed and applied. The background fluorescence spectrum was obtained within a separate F2 MOF filled with pure 1xTBS for reference. Assuming the fluorescence signal intensity of the Qdot for wavelengths longer than 950 nm is negligible [17], the background fluorescence is normalized to the same level as that of the mixed fluorescence spectrum at this wavelength range. Then the Qdot signal can be obtained from subtraction of the normalized reference from the mixed fluorescence. Two spectra for 5 nM and 1 nM concentrations obtained by this method are separately illustrated in Fig. 5(a) and (b) using a fiber length of 18 cm. As can be seen, the results fit well with that observed using the 1 μM PBS-diluted protein concentration in the F2 MOF, which shows the typical fluorescence spectrum of the Qdot dye. The signal obtained using the same method for 0.1 nM concentration only showed background noise, which indicates that our current detection limit using this subtraction technique with this fiber is 1 nM.
6. Study of degradation of the output power
As mentioned above, the use of TBS leads to significant improvement for the performance of the F2 MOFs, although for the TBS-filled F2 MOFs used here, a power degradation of approximately 50% is still observed, which limits the sensitivity of this approach. We have also investigated the effect of using a 1×TBS solution in MOFs made from another lead silicate glass (LLF1). It was found that the output power from one piece of the TBS-filled LLF1 MOF showed no variation over three hours, and no crystal deposition was observed at the input end of the LLF1 MOF. However, another piece of the same fiber showed reduced output power with time. In order to understand the variability in the degradation of the LLF1 MOFs and to understand the dynamic behavior of the crystal deposition that occurs in the MOFs made from different glasses, systematic filling experiments in SF57, F2 and LF11 MOFs have been conducted. Both 1×PBS and 1×TBS buffer solutions have been used to fill the fibers from one end, and the MOFs were monitored via optical microscopy at the other fiber endface. After the aqueous liquid arrived to the monitored end of the fiber, the liquid surface and possible crystal deposition process have been clearly observed. Hence we conclude from our observation that combination of the LLF1 fibers and 1×TBS buffer demonstrates the most stable output power. The possible factors that may lead to different degradation in the different fibers may include glass surface tension, hole size and shape, or internal surface roughness. To progress beyond this, it will be important to investigate in detail how these factors to affect crystal deposition in different glass compositions and fibers geometries in order to reduce these degradation effects.
7. Discussion and conclusions
We report here what is to the best of our knowledge the first report of sensing of biomolecules using the capture of fluorescent photons within a solid core MOF made from soft glass. Detection has been demonstrated for protein concentrations as low as 1 nM without optimization of the light/material overlap. Particular advantages of the demonstrated approach include the potential for near to real-time measurements and the use of extremely small
#89286 - $15.00 USD Received 1 Nov 2007; revised 10 Dec 2007; accepted 11 Dec 2007; published 13 Dec 2007
(C) 2007 OSA 24 December 2007 / Vol. 15, No. 26 / OPTICS EXPRESS 17825
sample volumes (of order 10 pL). These results are ultimately limited by the intrinsic glass fluorescence and the formation of crystals from the buffer solution.
The background fluorescence within these glasses is mainly generated by impurities in the glass such as transition metal and rare earth elements and other impurities [16]. If a different Qdot dye with longer emission wavelength were chosen, it should be possible to limit the impact of material fluorescence. In addition, by reducing the core size, the background fluorescence can be reduced as a consequence of the reduced field intensity in the fiber core. This simultaneously increases the power fraction in the holes, thus increasing the contrast between the fluorescence and background signals, allowing improved detection sensitivity.
The fabrication of MOFs that are optimized for reduced core size and increased strut length will allow the power fraction to be pushed beyond 50% from the current value of 3%. Recently, due to improvements in the extrusion process, the loss of our in-house fabricated MOFs with 2 μm core diameter made from F2 glass has been reduced to 0.6 dB/m in the visible and near infrared, which will enable the use of much longer fibers for sensing [18]. Although the use of smaller core sizes required for increased detection sensitivity leads to larger fiber losses and increased coupling loss from the laser source to fibers, improved fiber fabrication processes and new coupling methods such as use of high numerical aperture buffer fibers [19] have the potential to reduce these losses to a low level.
By combining these improvements with work to eliminate the degradation due to the formation of crystals we anticipate that the detection sensitivity of this device should be able to be improved by as much as 2-3 orders of magnitude. Hence this new approach has the potential to offer significant sensitivity enhancements, and is competitive with biological Enzyme Linked Immunosorbent Assay (ELISA) technology, which achieves 10 fM detection limit [20]. The advantages of our approach include real time monitoring, in-situ measurement, and much lower cost compared to ELISA.
Acknowledgements
The authors thank DSTO for supporting work within the Centre of Expertise in Photonics. We also thank Dr. Shahraam Afshar for providing the theoretically calculated optimal fiber length for maximum fluorescence capture, and Mr Roger Moore for drawing microstructured fibers in soft glasses.
#89286 - $15.00 USD Received 1 Nov 2007; revised 10 Dec 2007; accepted 11 Dec 2007; published 13 Dec 2007
(C) 2007 OSA 24 December 2007 / Vol. 15, No. 26 / OPTICS EXPRESS 17826
![Anthracene Fibers Grown in a Microstructured Optical Fiber ...€¦ · Many experimental techniques have been explored to grow and characterize anthracene crystals [21–24]. Large](https://static.fdocuments.in/doc/165x107/60052648d534fa307c57888b/anthracene-fibers-grown-in-a-microstructured-optical-fiber-many-experimental.jpg)