DETECTION OF MENTAL RETARDATION BY … OF MENTAL RETARDATION BY FACIAL FEATURES EXTRACTION USING EMD...
13
International Journal Of Advance Research In Science And Engineering http://www.ijarse.com IJARSE, Vol. No.2, Issue No.8, August 2013 ISSN-2319-8354(E) 9 | Page www.ijarse.com DETECTION OF MENTAL RETARDATION BY FACIAL FEATURES EXTRACTION USING EMD METHOD Shila Dhande 1 , Uday Chhatre 2 1,2 Department of Electronics Engineering, K. J. Somaiya College of Engineering, Vidyavihar, Mumbai-77 (India) ABSTRACT The objective of this paper is to provide an overview of mental retardation, a developmental disability with a long and sometimes controversial history. In particular, the current definitions, degree of mental retardation from face will be presented. Mental retardation (MR) is a genetic disorder manifested in significantly below average overall intellectual functioning and deficits in adaptive behavior. Mental retardation is a particular state of functioning that begins in childhood and is characterized by decreased intelligence and adaptive skills and also is the most common developmental disorder. Diagnosis is highly dependent on a comprehensive personal and family medical history, a complete physical examination and a careful developmental assessment of the child. These will guide appropriate evaluations and referrals to provide genetic counseling, resources for the family and early intervention programs for the child. An accurate and consistent definition of mental retardation is critical because of its impact on the prevalence, or count, of those with MR. However, despite the importance of consistency, MR is not always defined in the same way across research studies or service agencies, even within the same state. While some definitions rely on Intelligence Quotient (IQ) scores alone to classify individuals with MR, some only use adaptive behaviors for classification, and others include both IQ scores and measures of adaptive skills. In addition, many studies are based on broad categories of either severity (using labels such as mild, moderate, severe and profound MR) or etiology (utilizing the terms cultural/familial and organic MR). The American Association on Intellectual and Developmental Disabilities (AAIDD, 2002) has defined MR as significant limitations both in intellectual functioning and in adaptive behavior, which covers many everyday social and practical skills. This disability originates before the age of18. Intellectual limitations refer to an Intelligence Quotient (IQ) which falls two standard deviations below the population mean of 100 (<70), and adaptive functioning limitations refer to impairments in at least two out of ten skill areas. MR is also defined in the Diagnostic and Statistical Manual of Mental Disorders, by the American Psychiatric Association (APA). Literature survey is done on mental retardation due to fetal alcohol spectrum disorder shows that a lot of work is being carried out in alcohol consumption during pregnancy has a serious risk to the exposed fetus. Consuming 5 or more alcoholic drinks on one occasion increases the risk for women and their children. On the other hand 3 or more drinks in a day and daily or almost daily drinking, increase the risk for fetal alcohol spectrum disorders like fetal alcohol syndrome (FAS), which is the most clinically recognized form of FASD compared to other fetal alcohol disorders within this spectrum.
Transcript of DETECTION OF MENTAL RETARDATION BY … OF MENTAL RETARDATION BY FACIAL FEATURES EXTRACTION USING EMD...

International Journal Of Advance Research In Science And Engineering http://www.ijarse.com
IJARSE, Vol. No.2, Issue No.8, August 2013 ISSN-2319-8354(E)
9 | P a g e
www.ijarse.com
DETECTION OF MENTAL RETARDATION BY
FACIAL FEATURES EXTRACTION USING EMD
METHOD
Shila Dhande1, Uday Chhatre
2
1,2Department of Electronics Engineering, K. J. Somaiya College of Engineering,
Vidyavihar, Mumbai-77 (India)
ABSTRACT
The objective of this paper is to provide an overview of mental retardation, a developmental disability with a
long and sometimes controversial history. In particular, the current definitions, degree of mental retardation
from face will be presented.
Mental retardation (MR) is a genetic disorder manifested in significantly below average overall intellectual
functioning and deficits in adaptive behavior. Mental retardation is a particular state of functioning that begins
in childhood and is characterized by decreased intelligence and adaptive skills and also is the most common
developmental disorder. Diagnosis is highly dependent on a comprehensive personal and family medical
history, a complete physical examination and a careful developmental assessment of the child. These will guide
appropriate evaluations and referrals to provide genetic counseling, resources for the family and early
intervention programs for the child. An accurate and consistent definition of mental retardation is critical
because of its impact on the prevalence, or count, of those with MR. However, despite the importance of
consistency, MR is not always defined in the same way across research studies or service agencies, even within
the same state. While some definitions rely on Intelligence Quotient (IQ) scores alone to classify individuals
with MR, some only use adaptive behaviors for classification, and others include both IQ scores and measures
of adaptive skills. In addition, many studies are based on broad categories of either severity (using labels such
as mild, moderate, severe and profound MR) or etiology (utilizing the terms cultural/familial and organic MR).
The American Association on Intellectual and Developmental Disabilities (AAIDD, 2002) has defined MR as
significant limitations both in intellectual functioning and in adaptive behavior, which covers many everyday
social and practical skills. This disability originates before the age of18. Intellectual limitations refer to an
Intelligence Quotient (IQ) which falls two standard deviations below the population mean of 100 (<70), and
adaptive functioning limitations refer to impairments in at least two out of ten skill areas. MR is also defined in
the Diagnostic and Statistical Manual of Mental Disorders, by the American Psychiatric Association (APA).
Literature survey is done on mental retardation due to fetal alcohol spectrum disorder shows that a lot of work
is being carried out in alcohol consumption during pregnancy has a serious risk to the exposed fetus.
Consuming 5 or more alcoholic drinks on one occasion increases the risk for women and their children. On the
other hand 3 or more drinks in a day and daily or almost daily drinking, increase the risk for fetal alcohol
spectrum disorders like fetal alcohol syndrome (FAS), which is the most clinically recognized form of FASD
compared to other fetal alcohol disorders within this spectrum.

International Journal Of Advance Research In Science And Engineering http://www.ijarse.com
IJARSE, Vol. No.2, Issue No.8, August 2013 ISSN-2319-8354(E)
10 | P a g e
www.ijarse.com
In this report gives exhaustive study on analysis of mental retardation is presented. In this initially the facial
features are extracted and feature vectors are formed. These feature vectors are given as input to the fuzzy
inference system and then output is taken in the form of analysis of mental retardation.
Keywords: Mental Retardation, fetal alcohol spectrum disorder.
I INTRODUCTION
Mental retardation (MR) is a genetic disorder manifested in significantly below average overall intellectual
functioning and deficits in adaptive behavior. Mental retardation is a particular state of functioning that begins
in childhood and is characterized by decreased intelligence and adaptive skills and also is the most common
developmental disorder. Mental retardation in young children is often missed by clinicians. The condition is
present in 2 to 3 percent of the population, either as an isolated finding or as part of a syndrome or broader
disorder. Causes of mental retardation are numerous and include genetic and environmental factors. In at least
30 to 50 percent of cases, physicians are unable to determine etiology despite thorough evaluation.
1.1 Mild mental retardation
Approximately 85% of the mentally retarded population is in the mildly retarded category. Their IQ score
ranges from 50-75, and they can often acquire academic skills up to the 6th grade level. They can become fairly
self-sufficient and in some cases live independently, with community and social support.
1.2 Moderate mental retardation
About 10% of the mentally retarded population is considered moderately retarded. Moderately retarded
individuals have IQ scores ranging from 35-55. They can carry out work and self-care tasks with moderate
supervision. They typically acquire communication skills in childhood and are able to live and function
successfully within the community in a supervised environment such as a group home.
1.3 Severe mental retardation
About 3-4% of the mentally retarded population is severely retarded. Severely retarded individuals have IQ
scores of 20-40. They may master very basic self-care skills and some communication skills. Many severely
retarded individuals are able to live in a group home.
1.4 Profound mental retardation
Only 1-2% of the mentally retarded population is classified as profoundly retarded. Profoundly retarded
individuals have IQ scores under 20-25. They may be able to develop basic self-care and communication skills
with appropriate support and training. Their retardation is often caused by an accompanying neurological
disorder. The profoundly retarded need a high level of structure and supervision.
II LITERATURE SURVEY
Fetal alcohol spectrum disorders (FASD) was first observed in 1968 which described similar dysmorphic facial
features and growth delays in 127 infants of pregnant alcohol-drinking mothers [1]. Over the past 15 years the
drinking habits among women of child-bearing age and pregnant women have changed little [5]. One study

International Journal Of Advance Research In Science And Engineering http://www.ijarse.com
IJARSE, Vol. No.2, Issue No.8, August 2013 ISSN-2319-8354(E)
11 | P a g e
www.ijarse.com
showed that nearly 45% of women consumed alcohol during the 3 months before they found they were pregnant
[6]. It is known that heavy alcohol consumption during pregnancy has a serious risk to the exposed fetus [6].
However, experiments in animals show that even lesser amounts of alcohol may also have harmful effects on
the fetus so the question is what amount is significantly dangerous? Factors like a younger age, being unmarried
and having an unintended pregnancy are also correlated with maternal alcohol consumption habits during
pregnancy [2].
Consuming 5 or more alcoholic drinks on one occasion increases the risk for women and their children. On the
other hand [4] suggest that 3 or more drinks in a day and daily or almost daily drinking, increase the risk for
fetal alcohol spectrum disorders like fetal alcohol syndrome (FAS), which is the most clinically recognized form
of FASD compared to other fetal alcohol disorders within this spectrum.
There are many criteria for risk, but there are no data on what is a safe level of drinking during pregnancy.
Consequently, many women of child-bearing age who are light drinkers are at risk for giving birth to babies
with no identifiable dysmorphology, but who could have significant cognitive and behavioral control problems.
[5]
Prenatal alcohol exposure can affect several developmental processes, especially for the fetal growth and
morphogenesis. While drinking during any period of pregnancy could be harmful to the fetus, various reports
underestimate the period around conception and the first trimester of pregnancy when the central nervous
system (CNS) develops and is most vulnerable to damage [5]. Maternal demographic factors play a significant
role in understanding maternal alcohol consumption during pregnancy and engaging in preconceptional binge
drinking. Most of women who drink during pregnancy are from socioeconomically disadvantageous groups and
have little or no access to health care services.
2.1 Historical Overview Of Fetal Alcohol Spectrum Disorder
The connection between prenatal maternal alcohol consumption and the subsequent difficulties encountered by
children has seemingly been known throughout history. The medical profession took notice of the connection
between prenatal maternal alcohol consumption and developmental difficulties in children.
A group of national experts representing the Centers for Disease Control and Prevention (CDC); the National
Institute on Alcohol Abuse and Alcoholism (NIAAA), the Substance Abuse and Mental Health Service
Administration (SAMHSA), Health Canada and professionals in the fields of research, psychiatry and justice
attended a meeting facilitated by the National Organization on Fetal Alcohol Syndrome (NOFAS). At this
meeting, the descriptive term Fetal Alcohol Spectrum Disorders (FASD) was coined. Fetal Alcohol Spectrum
Disorders is an umbrella term describing the range of effects that can occur in an individual whose mother drank
alcohol during pregnancy. These effects may include physical, mental, behavioral or learning disabilities with
possible lifelong implications. Each year scientists continue to devote their time and energy to understanding the
biological and psychological effects of prenatal alcohol exposure. Through their efforts, the effects of alcohol on
the developing fetus are being better understood. In addition, there is a better understanding of individuals
affected by Fetal Alcohol Spectrum Disorders and the difficulties they face [3].

International Journal Of Advance Research In Science And Engineering http://www.ijarse.com
IJARSE, Vol. No.2, Issue No.8, August 2013 ISSN-2319-8354(E)
12 | P a g e
www.ijarse.com
III. MENTAL RETARDATION DUE TO FASD
Mental retardation affects about 1 – 3% of the population. There are many causes of mental retardation, but
doctors find a specific reason in only 25% of cases.
Fetal alcohol spectrum disorders (FASD) are a broad spectrum of structural anomalies and neuro cognitive and
behavioral disabilities resulting from the exposure of the developing fetus to alcohol; fetal alcohol syndrome
(FAS) is the most severe form of FASD. The characteristics of Fetal Alcohol Spectrum Disorders fall into three
categories – Growth Deficiency, Facial Characteristics and Central Nervous System Dysfunction. It is important
to remember that all the characteristics below can be present in the individual to varying degrees. In individuals
diagnosed with certain Fetal Alcohol Spectrum Disorder, the following characteristics may not be present. It is
not necessary for all the following characteristics to be present for a diagnosis.
FACIAL CHARACTERISTICS (MOST NOTABLE IN FETAL ALCOHOL SYNDROME)
Smooth or Long Philtrum (Ridges between nose and mouth.)
Short Palpebral Fissures (Eye Slits)
Thin Upper Lip
Minor Anomalies May Include
Flat Midface
Short Upturned Nose
Figure 1: Facial Characteristics (Most Notable in Fetal Alcohol Syndrome)
IV. EMPIRICAL MODE DECOMPOSITION (EMD)
To begin the EMD, a function or signal is decomposed as follows:
Identify all the local extrema; then connect all the local maxima by cubic spline as the upper envelope. Repeat
the procedure for the local minima to produce the lower envelope. The upper and lower envelopes should
include all the data. If the mean of the upper and lower envelopes is designated as m1 and the difference
between the data and m1 is the first component h1, then
x(t)−m1=h1. (1)
The mean m1 is given by

International Journal Of Advance Research In Science And Engineering http://www.ijarse.com
IJARSE, Vol. No.2, Issue No.8, August 2013 ISSN-2319-8354(E)
13 | P a g e
www.ijarse.com
m1=L+U/2 (2)
Where U is the local maxima and L is the local minima. Technically, h1 is supposed to be an intrinsic mode
function (IMF), except some error might be introduced by the spline curve fitting process — in many cases there
are overshoots and undershoots after the first round of processing; therefore, the sifting process has to be
repeated many times. The sifting process serves two purposes [Huang et al. (1998)]: it eliminates riding waves
(smaller waves that seem to ―ride‖ bigger waves), and it makes the signal or profile more symmetric about the
local zero-mean line.
In the second round of sifting, h1 is treated as the data or the first component; then a new mean is computed as
before. If the new mean is m11, then
h1−m11=h11. (3)
After repeating the sifting process up to k times, h1k becomes an IMF; that is:
h1(k−1)−m1k=h1k (4)
Let h1k = c1, the first IMF from the data. c1 should contain the finest scale or the shortest period
component of the data. The process to generate one IMF may be considered as the inner loop. Now c1 is
separated from the original data as:
x(t)−c1=r1 (5)
Where r1 is the residue, and it contains information on longer period components; it is now treated as the new
data and subjected to the same sifting process (this is now the beginning of the outer loop, which will go on to
the next inner loop for the next IMF). The procedure is repeated for all subsequent rj s resulting in
r1−c2=r2,………rn−1−cn=rn (6)
Where c2 to cn are the subsequent IMFs of the data. A schematic of the inner and outer loops of the EMD is
shown in Fig. 2.There are stopping criteria for the sifting process for IMFs since allowing sifting to go beyond a
certain point may remove important signal variations and features that arise from the natural dynamics of the
system — the IMF components need to retain enough physical sense of both amplitude and frequency
modulations. This can be achieved by limiting the value of the sum of the difference (SD), computed from two
consecutive sifting results as:
A value of SD between 0.2 and 0.3 is usually preferable based on experimental analyses performed by Huang et
al. (1998). To check that the number of zero crossings is equal to, or differs by at most one from the number of
extrema, an alternate stopping criterion is proposed by Huang et al. (2003). Sifting is stopped when the number
of zero crossings is equal to, or differs by at most one from the number of extrema for S successive sifting steps;
the optimum value for S was found to be between 4 and 8.
A number of issues have come up concerning empirical mode decomposition, including the following:

International Journal Of Advance Research In Science And Engineering http://www.ijarse.com
IJARSE, Vol. No.2, Issue No.8, August 2013 ISSN-2319-8354(E)
14 | P a g e
www.ijarse.com
• finding mathematical and physical meaning for IMFs, since EMD is essentially algorithmic in nature and
lacking mathematical rigor;
• determining the most appropriate interpolation scheme;
• handling of boundary or end effects during data interpolation.
Figure 2: Pictorial representation of EMD
Hilbert-Haung transform (HHT) has had wide applications in ocean engineering in which the method has been
used to analyze the properties and behavior of ocean waves [Datig and Schlurmann (2004); Veltcheva and
Soares (2004); Gloersen and Huang (2003)], in biomedical applications such as analysis of signals from
heartbeats and investigation of obstructive sleep apnea [Echeverria et al. (2001); Salisbury and Sun (2007)], and
in the financial industry where HHT has been applied to financial time series to examine volatility of markets
and the correlation of foreign exchange rates in currency markets [Wu (2007); Huang et al. (2003)]. However,
one issue still persists in all these advancements: the physical significance of IMFs derived from the original
data series or signal. A thorough understanding of the physical processes that generate data is required before
any form of scientific explanation can be attributed to any particular IMF or group of IMFs. Even with this kind
of thorough knowledge there is still a level of ambiguity when trying to extract information from the IMFs that
are directly relevant to the original signal and the physics of the underlying system. Before getting to the point
where essential information can be extracted from the IMFs there is a need to determine which IMFs are really
relevant to the decomposition process and which carry the necessary information required to understanding the
underlying system, for EMD is a numerical procedure with possible numerical errors in the results. Therefore, a
repeatable method is needed to discriminate between relevant and not so relevant IMFs. The uncertainties about
which IMFs are relevant in any EMD process contribute to the overall difficulty in trying to physically interpret
the IMFs of signals; the question always arises about the physical meaning of each IMF when there is no prior
International Journal Of Advance Research In Science And Engineering http://www.ijarse.com
IJARSE, Vol. No.2, Issue No.8, August 2013 ISSN-2319-8354(E)
15 | P a g e
www.ijarse.com
knowledge of the system producing the signals. A way to increase the level of confidence in the IMFs would be
to somehow narrow down the IMFs to only the relevant ones by some theoretical and repeatable means. In this
paper an expression is presented that attempts to discriminate between relevant and irrelevant IMFs. Wu and
Huang (2004; 2005) studied the statistical characteristics of uniformly distributed white noise using the EMD
method and numerical experiments. Based on results obtained from the numerical experiments, the authors put
forward a method of assigning statistical significance to information content of IMFs from noisy signals. The
results presented were that the product of the energy density of an IMF and the averaged period of the IMF is a
constant, and the energy-density distribution of an IMF sample follows the Chi-squared distribution. A spread
function for the energy distribution of an IMF was also obtained. The test method for IMF information content
was consistent with the Monte Carlo test. The test method begins with first decomposing the target data set into
IMFs using the EMD method. Now, construct a long artificial normalized white-noise data set, divide it into
sections with identical lengths as the target data set, and determine the spread function of various percentiles.
Select a confidence limit, say 99%, and determine upper and lower spread lines. The final step is to compare the
energy density of the IMFs from the target data set with the spread functions. At the chosen confidence level,
the IMFs with energy located above the upper spread line and below the lower spread line are considered to
contain information. Essentially, Wu and Huang presented a method of determining information content of
IMFs from the statistical characteristics of uniformly distributed white noise. EMD is a numerical procedure and
prone to numerical errors that may persist in the decomposition results. Before assigning statistical significance
to information content in the IMFs, the IMFs themselves need to be relevant to the decomposition; in other
words, IMFs need to be sought that are less likely to have been generated solely by the numerical errors that
persisted. Therefore, whileWu and Huang (2004) presented sound and effective analytical expressions for
statistical significance of information content, an additional step that could be potentially important was
disqualifying any spurious IMF that could have been the result of numerical errors. Peng et al. (2005) proposed
an expression to discriminate between relevant and irrelevant IMFs in order to improve the overall EMD
process. Since the IMFs are supposed to be almost orthogonal components of the original signal, each IMF
would have a relatively good correlation with the original signal; this presupposes that the irrelevant
components would have relatively poor correlation with the original signal. Therefore, a threshold, λ, is
introduced, which is given by
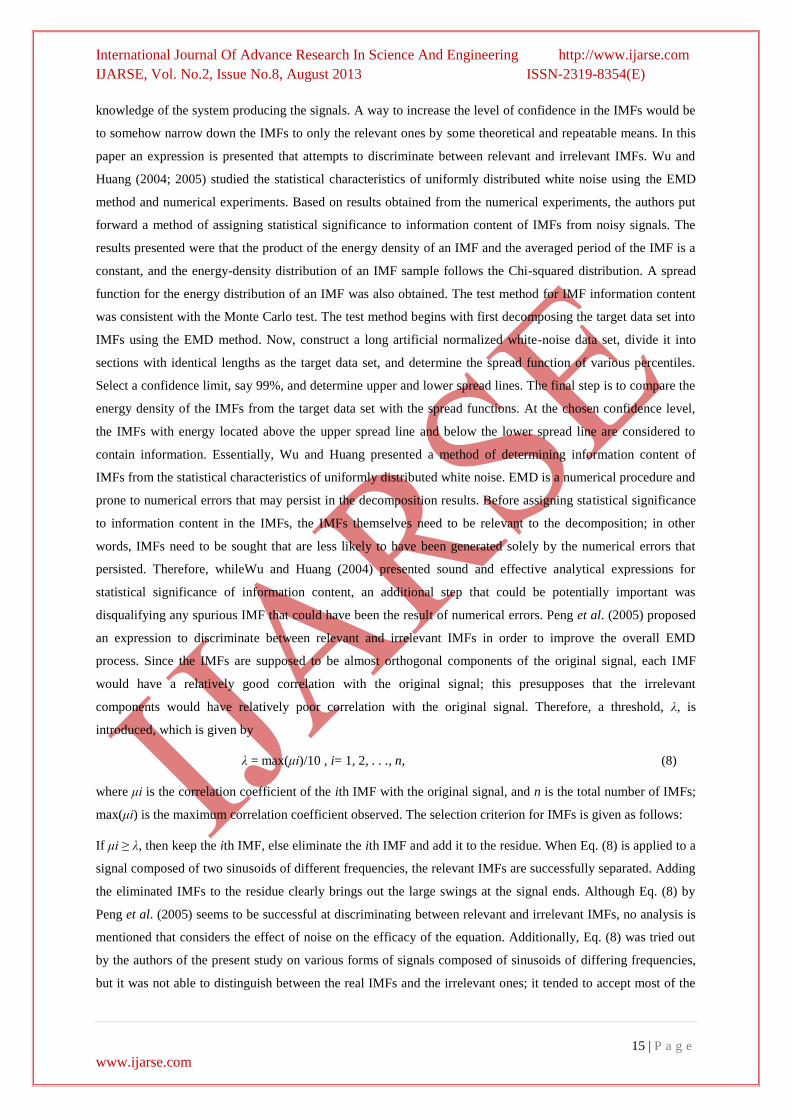
λ = max(μi)/10 , i= 1, 2, . . ., n, (8)
where μi is the correlation coefficient of the ith IMF with the original signal, and n is the total number of IMFs;
max(μi) is the maximum correlation coefficient observed. The selection criterion for IMFs is given as follows:
If μi ≥ λ, then keep the ith IMF, else eliminate the ith IMF and add it to the residue. When Eq. (8) is applied to a
signal composed of two sinusoids of different frequencies, the relevant IMFs are successfully separated. Adding
the eliminated IMFs to the residue clearly brings out the large swings at the signal ends. Although Eq. (8) by
Peng et al. (2005) seems to be successful at discriminating between relevant and irrelevant IMFs, no analysis is
mentioned that considers the effect of noise on the efficacy of the equation. Additionally, Eq. (8) was tried out
by the authors of the present study on various forms of signals composed of sinusoids of differing frequencies,
but it was not able to distinguish between the real IMFs and the irrelevant ones; it tended to accept most of the
International Journal Of Advance Research In Science And Engineering http://www.ijarse.com
IJARSE, Vol. No.2, Issue No.8, August 2013 ISSN-2319-8354(E)
16 | P a g e
www.ijarse.com
IMFs, which meant that the criterion was possibly not stringent enough. Furthermore, in the presence of
uniformly distributed white noise, there was no apparent improvement [6].
V FUZZY LOGIC
Fuzzy logic techniques have been used in image-understanding applications such as detection of edges, feature
extraction, classification, and clustering. Fuzzy logic poses the ability to mimic the human mind to effectively
employ modes of reasoning that are approximate rather than exact. In traditional hard computing, decisions or
actions are based on precision, certainty, and vigor. Precision and certainty carry a cost. In soft computing,
tolerance and impression are explored in decision making. The exploration of the tolerance for imprecision and
uncertainty underlies the remarkable human ability to understand distorted speech, decipher sloppy handwriting,
comprehend nuances of natural language, summarize text, and recognize and classify images. With FL, we can
specify mapping rules in terms of words rather than numbers. Computing with the words explores imprecision
and tolerance. Another basic concept in FL is the fuzzy if–then rule. Although rule-based systems have a long
history of use in artificial intelligence, what is missing in such systems is machinery for dealing with fuzzy
consequents or fuzzy antecedents. In most applications, an FL solution is a translation of a human solution.
Thirdly, FL can model nonlinear functions of arbitrary complexity to a desired degree of accuracy. FL is a
convenient way to map an input space to an output space. FL is one of the tools used to model a multiinput,
multioutput system. Lotfi Zadeh introduced the theory of Fuzzy Logic in his paper, Fuzzy Sets (1965). Fuzzy
Logic provides a method of reducing as well as explaining the system complexity.
Soft computing includes fuzzy logic, neural networks, probabilistic reasoning, and genetic algorithms. Today,
techniques or a combination of techniques from all these areas are used to design an intelligence system. Neural
networks provide algorithms for learning, classification, and optimization, whereas fuzzy logic deals with issues
such as forming impressions and reasoning on a semantic or linguistic level. Probabilistic reasoning deals with
uncertainty. Although there are substantial areas of overlap between neural networks, FL, and probabilistic
reasoning, in general they are complementary rather than competitive. Recently, many intelligent systems called
neuro fuzzy systems have been used. There are many ways to combine neural networks and FL techniques.
Before doing so, however, it is necessary to understand basic ideas in the design of FL techniques. In this
chapter, we will introduce FL concepts such as fuzzy sets and their properties, FL operators, hedges, fuzzy
proposition and rule-based systems, fuzzy maps and inference engine, defuzzification methods, and the design
of FL decision system.
In general, a fuzzy inference system consists of four modules:
Fuzzification module: transforms the system inputs, which are crisp numbers, into fuzzy sets. This is
done by applying a fuzzification function.
Knowledge base: stores IF-THEN rules provided by experts.
Inference engine: simulates the human reasoning process by making fuzzy inference on the inputs and
IF-THEN rules.
Defuzzification module: transforms the fuzzy set obtained by the inference engine into a crisp value.
International Journal Of Advance Research In Science And Engineering http://www.ijarse.com
IJARSE, Vol. No.2, Issue No.8, August 2013 ISSN-2319-8354(E)
17 | P a g e
www.ijarse.com
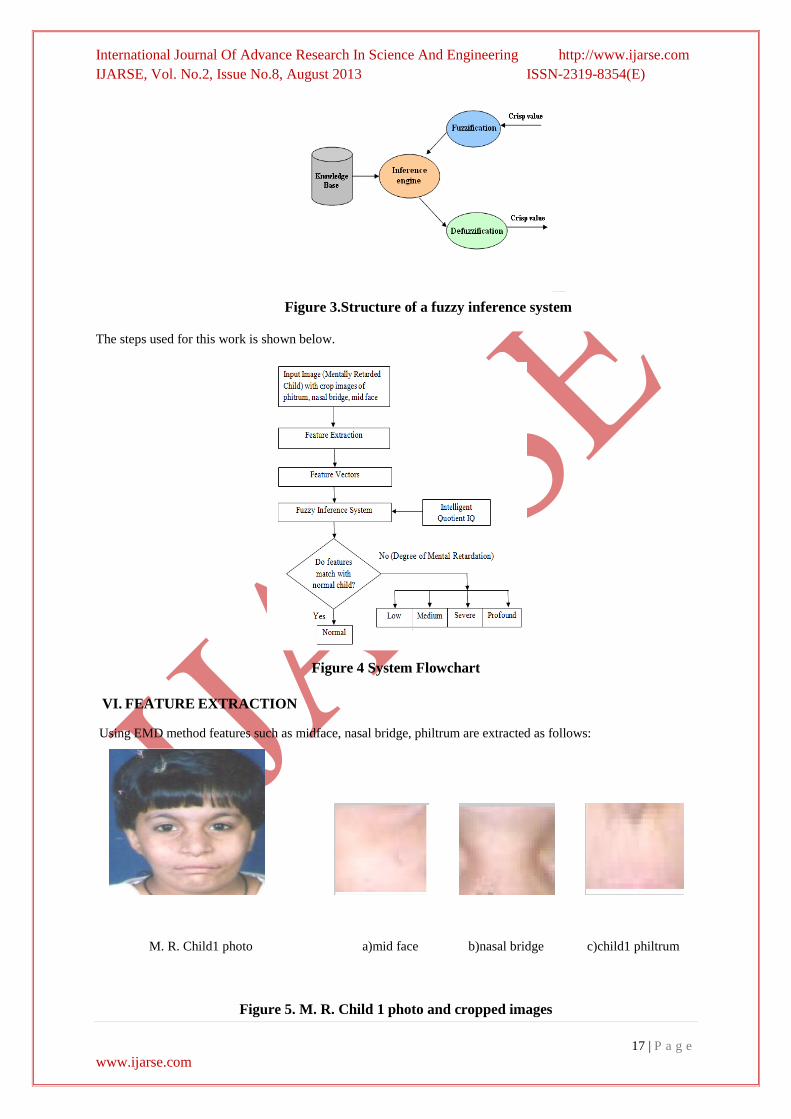
Figure 3.Structure of a fuzzy inference system
The steps used for this work is shown below.
Figure 4 System Flowchart
VI. FEATURE EXTRACTION
Using EMD method features such as midface, nasal bridge, philtrum are extracted as follows:
M. R. Child1 photo a)mid face b)nasal bridge c)child1 philtrum
Figure 5. M. R. Child 1 photo and cropped images

International Journal Of Advance Research In Science And Engineering http://www.ijarse.com
IJARSE, Vol. No.2, Issue No.8, August 2013 ISSN-2319-8354(E)
18 | P a g e
www.ijarse.com
Middle row-Signal-Midface Signal-midface-IMF
Middle row-Signal philtrum Signal-philtrum-IMF
Middle row-Signal nasal bridge Signal-Nasal Bridge-IMF
Figure 6 Results of M. R. Child1 with middle row signal and IMF
M. R. Child2 photo a) mid face b) nasal bridge c) philtrum
Figure 7. M. R. Child 2 photo and cropped images

International Journal Of Advance Research In Science And Engineering http://www.ijarse.com
IJARSE, Vol. No.2, Issue No.8, August 2013 ISSN-2319-8354(E)
19 | P a g e
www.ijarse.com
Middle row-signal midface signal midface IMF
Middle row-signal nasal bridge signal nasal bridge IMF
Middle row-signal philtrum Signal philtrum IMF
Figure 8. Results of M. R. Child2 with middle row Signal and IMF
Figure9. FIS editor Figure 10. GUI for analysis of Figure11. GUI for
mental retardation Doctor’s Remarks

International Journal Of Advance Research In Science And Engineering http://www.ijarse.com
IJARSE, Vol. No.2, Issue No.8, August 2013 ISSN-2319-8354(E)
20 | P a g e
www.ijarse.com
VII.CONCLUSIONS
The results of facial features such as nasal bridge, philtrum, mid face using empirical mode decomposition are
shown above and generated feature vector in the form of text file. These text files (feature vectors) and
intelligent quotient (IQ) of respective child are given to fuzzy inference system as an input. The output fuzzy
logic will be generated in the form of text file indicates analysis of mental retardation i.e., M. R. as low,
medium, severe, profound which includes doctor’s remark also.
7.1 Future Scope
From previous studies it is found that the manual processing was done for the detection of mental retardation. In
manual processing, measurements of facial features were done using scale. This process can be made automatic
in which face, IQ level would act as input. In future this technique can be implemented in medical field.
7.2 Acknowledgment
I place on record and warmly acknowledge the continuous encouragement, invaluable supervision, timely
suggestions and inspired guidance offered by my guide Prof. U. P. Chhatre, Professor, Department of
Electronics Engineering, K. J. Somaiya College of Engineering, Vidyavihar-Mumbai, who’s idea is been
implemented in the work presented.
REFERENCES
[1]The Fetal Alcohol Spectrum Disorders Handbook federal funds South Dakota Council on Developmental
Disabilities, visit their website at <http://dhs.sd.gov/ddc>.
[2] Aida Biglari, ―The Effects of Prenatal Alcohol Exposure on Cognitive Functioning‖ Department of
Psychology & Health, Cognitive Neurosciences
[3]Foetal alcohol syndrome/ Alcohol related neurodevelopmental disorder, Society for the study of behavioural
phenotypes , An International Organisation The SSBP is a Registered Charity No.1013849.
[4] Bookstein, FL, Sampson, PD, Streissguth, AP, & Connor, PD (2001). Geometric morphometrics of corpus
callosum and subcortical structures in the fetal-alcohol- affected brain. Teratology. 64, 4-32.
[5] Caetano, Ramisetty-Mikler, Floyd, And Mcgrath (2006): "The epidemiology of drinking among women of
child-bearing age"
[6] R.LOUISE FLOYD, RN, DSN, CLARK DENNY, phd, MARY KATE WEBER, MPH ―Prevention
of Fetal Alcohol Spectrum Disorders‖ Centers for Disease Control and Prevention National Center on Birth
Defects and Developmental Disabilities, USA.
[7] Rui Fonseca-Pinto, A New Tool for Nonstationary and Nonlinear Signals: The Hilbert-Huang Transform in
Biomedical Applications, Biomedical Engineering Trends in Electronics, Communications and Software.
[8] Albert Ayenu Prah, and Niiattoh-Okine, A Criterion for selecting relevant intrinsic mode function in
empirical mode decomposition, Advances in Adaptive Data Analysis Vol. 2, No. 1 (2010) 1–24.

International Journal Of Advance Research In Science And Engineering http://www.ijarse.com
IJARSE, Vol. No.2, Issue No.8, August 2013 ISSN-2319-8354(E)
21 | P a g e
www.ijarse.com
[9] Sourav Pramanik, Debotosh Bhattacharjee ―Geometric Feature Based Face Sketch Recognition‖,
Proceedings of the International Conference onPattern Recognition, Informatics and Medical Engineering ,
March 21-23, 2012.
[10]Available online at http://www.nlm.nih.gov/medlineplus/ency/article/001593.htm
[11] http://medical-dictionary.thefreedictionary.com/mental+retardation
[12] Wu H, Chen Q, Yachida M (1995) An application of fuzzy theory: face detection. In: Proceedings of
IWAFGR’95, pp 314–319.
[13]Yang MH, Kriegman, DJ, Ahuja N (2002) Detecting faces in images: a survey. IEEE Trans Pattern Anal
Mach Intell 24(1):34–58.
[14]Rowley HA, Baluja S, Kanade (1998) Neural network-based face detection. IEEE Trans Pattern Anal Mach
Intell 20(1):23–38.
[15] Choi HC, Oh SY (2005) Face detection in static images using Bayesian discriminating feature and particle
attractive genetic algorithm. In: Intelligent robots and systems (IROS2005), pp 1072–1077.
[16] Gu H, Su G, Du C (2003) ―Feature points extraction from faces. In: Image and vision computing‖
(IVCNZ’03), pp 154–158.
[17] D. Bhattacharjee, S. Halder, M. Nasipuri, D.K. Basu, M. Kundu ―Construction of human faces from textual
description‖, Springer, Nov.2009.
[18]Bhatia N, Kumar R, Menon S (2007) FIDA: ―Face recognition using descriptive input semantics‖,
December 14.
[19]K. Sobottka, I. Pitas, ―A novel method for automatic face segmentation, facial feature extraction and
tracking, Signal Process. Image Commun‖. 12 (1998) 263}281.
[20] H. Wang, S.F. Chang, ―A highly e$cient system for automatic face region detection in MPEG video, IEEE
Trans. Circuits Systems” Video Technol. 7 (4) (1997) 615}628.
[21] A.M. Mohamed, A. Elgammal, ―Face detection in complex environments from color images”, Proceedings
of International Conference on Image Processing 3 (1999) 6.