Detection of leadership in informal (small) groups based...
66
Detection of leadership in informal (small) groups based on CCTV information Jan-Willem Bull´ ee [email protected] Twente University Faculty of Electrical Engineering, Mathematics and Computer Science Chair of Signals and Systems
Transcript of Detection of leadership in informal (small) groups based...

Detection of leadership in informal (small)groups based on CCTV information
Jan-Willem [email protected]
Twente University
Faculty of Electrical Engineering, Mathematics and Computer Science
Chair of Signals and Systems

2

Contents
1 Introduction 91.1 Psychological research . . . . . . . . . . . . . . . . . . . . . . 11
1.1.1 Theoretical introduction . . . . . . . . . . . . . . . . . 121.1.1.1 Groups . . . . . . . . . . . . . . . . . . . . . 121.1.1.2 Leadership . . . . . . . . . . . . . . . . . . . 121.1.1.3 Dominance . . . . . . . . . . . . . . . . . . . 13
1.1.2 Experimental description . . . . . . . . . . . . . . . . . 131.1.2.1 Participants . . . . . . . . . . . . . . . . . . . 131.1.2.2 Procedure . . . . . . . . . . . . . . . . . . . . 131.1.2.3 Team building games . . . . . . . . . . . . . . 141.1.2.4 Group task . . . . . . . . . . . . . . . . . . . 141.1.2.5 Team Measure . . . . . . . . . . . . . . . . . 14
1.1.3 Team Measure . . . . . . . . . . . . . . . . . . . . . . . 151.1.3.1 Introspective Dominance . . . . . . . . . . . . 151.1.3.2 Team Member Dominance . . . . . . . . . . . 161.1.3.3 Ranking (intern) . . . . . . . . . . . . . . . . 16
1.1.4 Observed initiative taking (first movers) . . . . . . . . 161.1.5 Results . . . . . . . . . . . . . . . . . . . . . . . . . . . 16
1.1.5.1 Initiative taking (first movers) . . . . . . . . . 171.1.5.2 Correlational overview . . . . . . . . . . . . . 17
1.1.6 Discussion . . . . . . . . . . . . . . . . . . . . . . . . . 18
2 Literature Study 212.1 Leadership . . . . . . . . . . . . . . . . . . . . . . . . . . . . . 22
2.1.1 Verbal (speech) . . . . . . . . . . . . . . . . . . . . . . 222.1.1.1 Debate Contribution . . . . . . . . . . . . . . 222.1.1.2 Speaking Time . . . . . . . . . . . . . . . . . 232.1.1.3 Speaker Energy . . . . . . . . . . . . . . . . . 232.1.1.4 Speaker Turns . . . . . . . . . . . . . . . . . 24
2.1.2 Nonverbal (movement) . . . . . . . . . . . . . . . . . . 242.1.2.1 Direction of sight . . . . . . . . . . . . . . . . 24
3

CONTENTS CONTENTS
2.1.2.2 Initiative (First movers) . . . . . . . . . . . . 252.1.2.3 Movement (Visual activity) . . . . . . . . . . 25
3 Algorithms 273.1 Find the beginning of the recording . . . . . . . . . . . . . . . 273.2 Divide the recordings . . . . . . . . . . . . . . . . . . . . . . . 283.3 Frame-rate reduction . . . . . . . . . . . . . . . . . . . . . . . 283.4 Color reduction . . . . . . . . . . . . . . . . . . . . . . . . . . 283.5 Background subtraction . . . . . . . . . . . . . . . . . . . . . 293.6 Noise reduction . . . . . . . . . . . . . . . . . . . . . . . . . . 303.7 Gesticulation . . . . . . . . . . . . . . . . . . . . . . . . . . . 303.8 Analysis . . . . . . . . . . . . . . . . . . . . . . . . . . . . . . 33
4 Data Description 354.1 Experimental data . . . . . . . . . . . . . . . . . . . . . . . . 35
4.1.1 Video Data . . . . . . . . . . . . . . . . . . . . . . . . 354.1.2 Questionnaire . . . . . . . . . . . . . . . . . . . . . . . 35
4.2 Observed behaviour . . . . . . . . . . . . . . . . . . . . . . . . 364.2.1 Gesticulation . . . . . . . . . . . . . . . . . . . . . . . 36
4.2.1.1 Procedure . . . . . . . . . . . . . . . . . . . . 374.2.1.2 Ranking . . . . . . . . . . . . . . . . . . . . . 374.2.1.3 Data Analysis . . . . . . . . . . . . . . . . . . 37
5 Results 39
6 Conclusion and Recommendation 53
7 Acknowledgments 57References . . . . . . . . . . . . . . . . . . . . . . . . . . . . . . . . 58
A Documents 63A.1 Informed Consent . . . . . . . . . . . . . . . . . . . . . . . . . 64A.2 Experiment Desription . . . . . . . . . . . . . . . . . . . . . . 65
4

List of Figures
3.1 Separation and reduction of recording information . . . . . . . 293.2 Median Smoothing algorithm . . . . . . . . . . . . . . . . . . 313.3 Multiple thresholds to visualizing people at subtraction of the
background . . . . . . . . . . . . . . . . . . . . . . . . . . . . 32
4.1 Visual representation of the experimental area . . . . . . . . . 36
5.7 ROC Ground truth - Gesticulation score . . . . . . . . . . . . 485.8 ROC performance gesticulation algorithm with observations
as basis . . . . . . . . . . . . . . . . . . . . . . . . . . . . . . 495.9 Visual representation of True Positive Rate and False Positive
Rate of the rankings with the internal chosen leader as basisas shown in Table 5.4 . . . . . . . . . . . . . . . . . . . . . . . 50
5

LIST OF FIGURES LIST OF FIGURES
6

List of Tables
1.1 Sex and nationality distribution . . . . . . . . . . . . . . . . . 131.2 Descriptive Statistics for al measures (N=124) . . . . . . . . . 171.3 Correlations for all measures (N=124). . . . . . . . . . . . . . 19
3.1 Contingency Table Structure . . . . . . . . . . . . . . . . . . . 34
5.1 Results T-test gesticulation score leaders versus non-leaders . 475.2 True Positive Rate, False Positive Rate and Pearsons R of the
rankings on basis of the gesticulation score compared to theobserved score of the video segments. . . . . . . . . . . . . . . 49
5.3 Correlations for all measures. . . . . . . . . . . . . . . . . . . 515.4 True Positive Rate and False Positive Rate of the rankings
with the internal chosen leader as basis. . . . . . . . . . . . . . 52
7

LIST OF TABLES LIST OF TABLES
8

Chapter 1
Introduction
Become the kind of leader that people wouldfollow voluntarily; even if you had no title or
position.
Brian Tracy
In general, events such as concerts and public celebrations elapse qui-etly and easy, without problems. The occurrence of an incident, however,may have terrible consequences (Hijum, 2011). Numerous examples fromthe last 30 years can be given of asphyxia, crushing and stampeding dur-ing events (CNN Sports, 2001; Helbing & Johansson, 2009). The numberof reported incidents increases each decade. This trend is, not entirely re-markable, accompanied by an increased attention for public safety problems(Fan Weicheng, Liu Yi, 2008 (as cited in Wei, Guo, Dong, & Li, 2012)).The report of Hughes states that in the last decades the number of victimsof crowd related incidents is approximately 2000 per year (Lee & Hughes,2006; Hughes, 2003). Most of the incidents occur at sport matches, concerts,festivals and nightclubs (Langston, Masling, & Asmar, 2006).
To tackle these public safety problems it is important to have an insightinto crowds. Especially when a large number of people are gathering at agiven time at events, for example a rock concert or a sport event (Smith etal., 2009). Crowds are generally constructed from small groups (Cartwright& Zander, 1968; Ge, Collins, & Ruback, 2009; Johnson, 1987). The unpub-lished study of McPhail shows that visitors of an event, in 89% of the cases,are accompanied by at least one other person (Ge et al., 2009). So, the crowdat events mainly consist of groups of minimally two persons, who thus alsointeract with each other. These groups consist mainly of friends or acquain-tances who share an interest or like each other. These so-called self-formed
9

CHAPTER 1. INTRODUCTION
groups are not part of any institutional framework and do not have a leaderinstalled by authority. This form of leadership is called emerging leadershipand this kind of leadership has a larger influence over the group, in compar-ison with a leader installed by some authority (Sanchez-Cortes, Aran, Mast,& Gatica-Perez, 2010). The strength of a leader is his ability to transform in-dividual action into group action (Hogg et al., 2006). Interventions could bemore effective if the leader of the group will be addressed (Haslam, Reicher,& Platow, 2011).
The number of cameras in our daily lives increase quickly; in shoppingmalls, railway stations, concert halls and on the street. In London onlytens of thousands of cameras are active in multiple Closed-circuit television(CCTV) systems (Boom, 2010). The main goal of these systems is to detect,prevent and monitor anti-social and obnoxious behaviour. More installedcameras does not directly lead to an increase in public safety. Having morecameras means that there is more information to observe, and thus a higherworkload in observing all cameras. To make CCTV contribute to publicsafety is difficult. Despite the fact that cameras provide a wide angle ofview and possibilities to focus and zoom, their intelligence and analyticalcapacities are limited. The functionality that is missing in a CCTV systemis an intelligent tool that helps interpreting data. With the informationprovided from the tools, you can act right away when arriving at the location(instead of figuring out what the problem is at that moment).
The evolution of technology and the possibility of realtime video process-ing gives hope and new perspectives, but also leads to more questions. Theuse of CCTV could be useful in public safety and crowd observation applica-tions. How can this be used to find group leaders, based on visual observablebehaviour?
In the preceding research, the psychological aspects of this problem wereanalyzed. The main focus was the emergence of leadership from within thegroup. The group of interest is a small informal group. Compared to formalgroups, leadership is not assigned by an authority, but has to emerge fromwithin the group. Everybody is equal in an informal group, and has anequal chance to become the leader of the group. The research question was:“How can CCTV information be used to find group leaders, based on visualobservable behaviour?”. Small groups mainly consisting of four people werecreated and given a task. During this task leadership emerged from withinthe group. A questionnaire measured the personality characteristics andthe perception of dominance and leadership of the team members. Videorecordings were shown to multiple observers for interpretation as a validationmeasure. More details of these results can be found in Section 1.1.5.
In other research the behaviour of four people in a group has been ob-
10

CHAPTER 1. INTRODUCTION 1.1. PSYCHOLOGICAL RESEARCH
served (Ashby et al., 2005; Hung & Gatica-Perez, 2010; Sanchez-Cortes etal., 2010). During these studies, people are placed in a chair around a tableand given a special role to carry out. The presented study is comparable tothese studies, with the exception that the group is free to walk through theroom and there are no predefined roles.
The goal of this research is to investigate the possibilities of finding groupleadership in a small self-formed group, based on CCTV data. In the psy-chological research initiative was found as one predictor for leadership withinthe group. Another proposed predictor from literature is the amount ofmovement. Where leaders and dominant people tend to move more thannon-dominant people and non-leaders. The video recordings that are cre-ated during the psychological research will be used as input for this research.The precise question is:“To what extend is it possible to use gesticulating asa measure for leadership when using CCTV data?”. First, a short theoret-ical explanation of the field of social groups, leadership and dominance isgiven, followed by a description of the data collection and the result of thealgorithms for leadership detection.
This thesis is the sequel of a psychological study and consists of five chap-ters. The second part of this introduction provides a short explanation of thepreceding psychological research, this will give a short introduction into thetopic of social groups, leadership and dominance. In addition to this the col-lection of data and preparatory to this study is described. Firstly, a literaturestudy is done in Chapter 2. The whole data collection process is described inChapter 4. This also includes a description of the data validation. In Chap-ter 3, the algorithm for preprocessing and gesticulation measure is presented.The results of the experiments are described in Chapter 5. The final chapter,Chapter 6, contains conclusions and suggestions for further research.
1.1 Psychological research
This section will give a short introduction into the topics of social groups,leadership and dominance. Besides this, the collection of data preparatory tothis study is described. In that study initiative taking is used as a predictorfor leadership, it is found that the first person to start walking is more likelyto become the leader of the group.
This research is about detecting leaders of small self formed groups. Toget a better understanding of the context, short introductions are given aboutthe topics of groups, leadership and visual observable characteristics of lead-ership. This will be continued with a summary of algorithms that can beused to accomplish the aim of this research.
11
1.1. PSYCHOLOGICAL RESEARCH CHAPTER 1. INTRODUCTION
1.1.1 Theoretical introduction
1.1.1.1 Groups
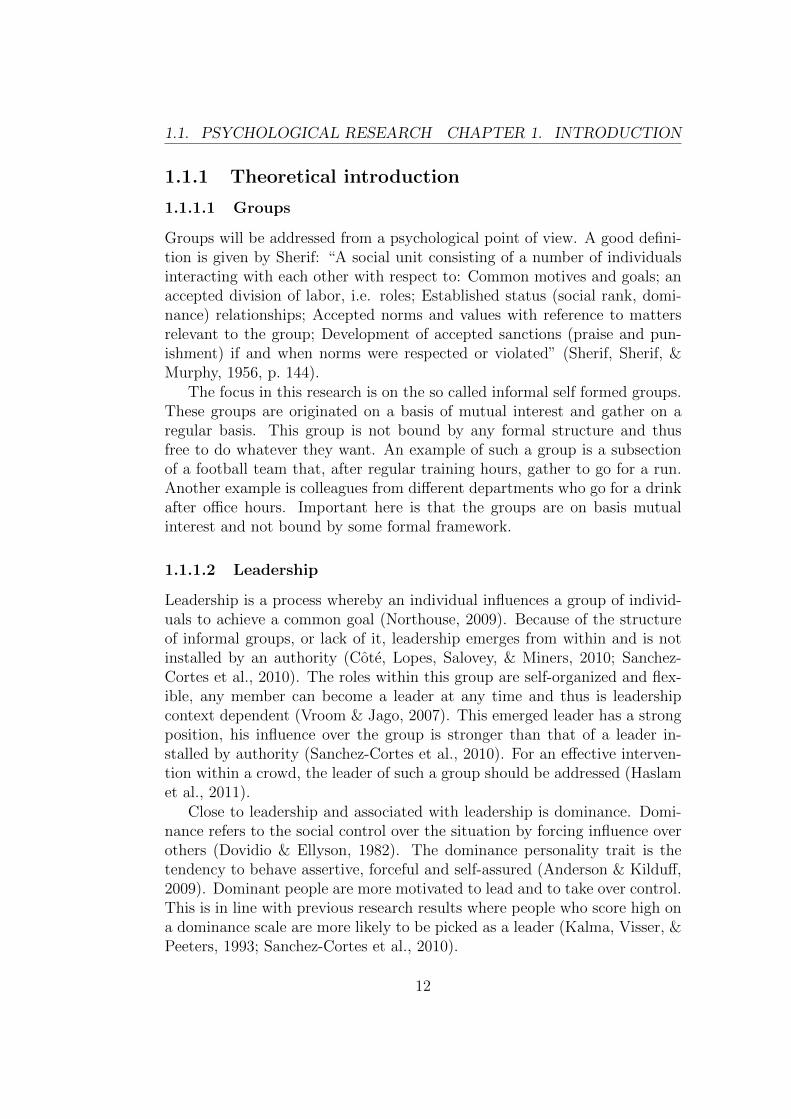
Groups will be addressed from a psychological point of view. A good defini-tion is given by Sherif: “A social unit consisting of a number of individualsinteracting with each other with respect to: Common motives and goals; anaccepted division of labor, i.e. roles; Established status (social rank, domi-nance) relationships; Accepted norms and values with reference to mattersrelevant to the group; Development of accepted sanctions (praise and pun-ishment) if and when norms were respected or violated” (Sherif, Sherif, &Murphy, 1956, p. 144).
The focus in this research is on the so called informal self formed groups.These groups are originated on a basis of mutual interest and gather on aregular basis. This group is not bound by any formal structure and thusfree to do whatever they want. An example of such a group is a subsectionof a football team that, after regular training hours, gather to go for a run.Another example is colleagues from different departments who go for a drinkafter office hours. Important here is that the groups are on basis mutualinterest and not bound by some formal framework.
1.1.1.2 Leadership
Leadership is a process whereby an individual influences a group of individ-uals to achieve a common goal (Northouse, 2009). Because of the structureof informal groups, or lack of it, leadership emerges from within and is notinstalled by an authority (Cote, Lopes, Salovey, & Miners, 2010; Sanchez-Cortes et al., 2010). The roles within this group are self-organized and flex-ible, any member can become a leader at any time and thus is leadershipcontext dependent (Vroom & Jago, 2007). This emerged leader has a strongposition, his influence over the group is stronger than that of a leader in-stalled by authority (Sanchez-Cortes et al., 2010). For an effective interven-tion within a crowd, the leader of such a group should be addressed (Haslamet al., 2011).
Close to leadership and associated with leadership is dominance. Domi-nance refers to the social control over the situation by forcing influence overothers (Dovidio & Ellyson, 1982). The dominance personality trait is thetendency to behave assertive, forceful and self-assured (Anderson & Kilduff,2009). Dominant people are more motivated to lead and to take over control.This is in line with previous research results where people who score high ona dominance scale are more likely to be picked as a leader (Kalma, Visser, &Peeters, 1993; Sanchez-Cortes et al., 2010).
12

CHAPTER 1. INTRODUCTION 1.1. PSYCHOLOGICAL RESEARCH
1.1.1.3 Dominance
Dominance refers to the social control over the situation through influenceover others (Dovidio & Ellyson, 1982). The personality trait dominancerefers to the tendency to behave in assertive, forceful, and self-assured ways(Anderson & Kilduff, 2009; Buss & Craik, 1980; Wiggins, 1979). A high scorein the dominance trait means more assertiveness and motivation to lead,which implies taking control. Research shows that taking over leadership byforce is not enough, the social competence is an important aspect as well(Anderson & Kilduff, 2009; Van Vugt, 2006). Based on the scores on thesocial dominance scale, people with high scores on this scale are more likelyto be selected as a leader than low scorers (Kalma et al., 1993). A highcorrelation is found between leadership and sociable dominance (Sanchez-Cortes et al., 2010).
1.1.2 Experimental description
The goal of the experiments is to let leadership emerge in small groups.This with the aim of finding visual observable predictors for leadership. Theexperiment is purely observable and consist of three parts: 1) get-to-know-games. 2) brainstorm session. 3) questionnaire.
1.1.2.1 Participants
A total of 124 participants, divided over 32 groups, participated in this re-search. The age of the participants differed between 18 and 25 years, withan average of 20.56 years (SD = 1.51). The distribution information of thesex and nationality can be found in Table 1.1.
Table 1.1: Sex and nationality distribution
CountrySex Germany Netherlands TotalFemale 58 (46.8%) 41 (33.1%) 99 (79.8%)Male 10 (8.1%) 15 (12.1%) 25 (20.2%)Total 68 (54.8%) 56 (45.2%) 124 (100%)
1.1.2.2 Procedure
The experiment started with the participants gathering in the room wherethe experiment was conducted. When the group of 3 or 4 people was com-plete, the session began. First, to get to know each other, four simple team
13

1.1. PSYCHOLOGICAL RESEARCH CHAPTER 1. INTRODUCTION
building games were played. The first two games were get-to-know-each-other-games, the third game involved trust and coordination and the finalgame revolved around creativity. A more detailed description can be foundin Section 1.1.2.3. The duration of this part was about 10 minutes. Whenthe group was finished, the main task began. Here the group had to developa game, based on certain criteria which were given in the assignment, moredetails can be found in Section 1.1.2.4. The time limit of this session was 20minutes, after that, the results had to be presented. The final task for theparticipants was to fill in a questionnaire, see Section 1.1.2.5.
1.1.2.3 Team building games
A collection of 4 games is described on a piece of paper. The group had tocomplete each item on the list from top to bottom. The only item that wasused, was a tennis ball to throw at each other. The first two games revolvedaround learning the names of the other team members. In the first game,the team members had to introduce themselves and in the second game theaim was about practicing the names. The third game is a task that requirestrust and coordination to be completed. During this game the members hadto stand in a circle and face each others back. The final goal of this gamewas to sit on each others laps. The game combines creativity and knowledge,within this game a series of country and city had to be stated alternately.
1.1.2.4 Group task
The participants were standing around a round table, see Figure 4.1, andgot one assignment (see Appendix A), one whiteboard and one marker. Inaddition each participant was given one piece of plain paper and a pencil.The assignment described a illness, a therapy and a goal. The goal was todevelop at least two games that meet the requirements of the therapy in sucha way that the therapy gets more interesting for 7 to 10 year olds. After thedevelopment session one team member had to give a short presentation ofthe results.
1.1.2.5 Team Measure
The final measure consisted of six standardized and validated scales fromdifferent questionnaires. This final measure is conducted by pencil and paper.More details of these questionnaires can be found in the section 1.1.3 FinalMeasure.
14
CHAPTER 1. INTRODUCTION 1.1. PSYCHOLOGICAL RESEARCH
1.1.3 Team Measure
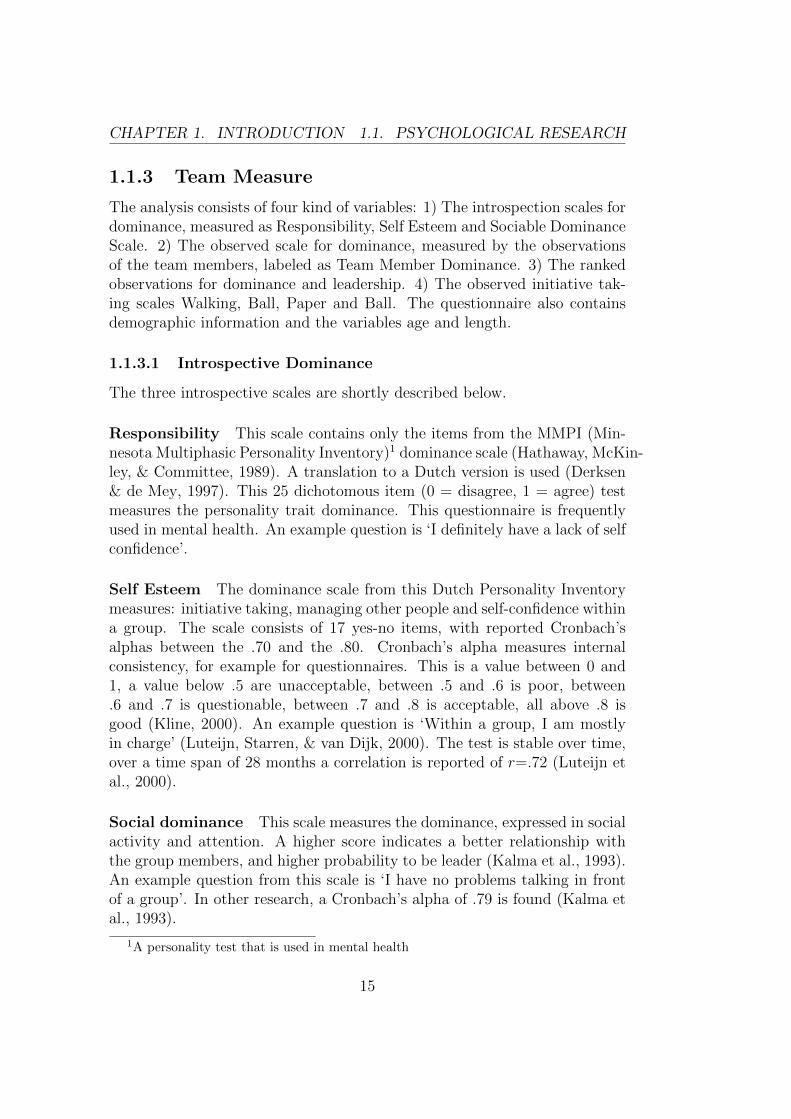
The analysis consists of four kind of variables: 1) The introspection scales fordominance, measured as Responsibility, Self Esteem and Sociable DominanceScale. 2) The observed scale for dominance, measured by the observationsof the team members, labeled as Team Member Dominance. 3) The rankedobservations for dominance and leadership. 4) The observed initiative tak-ing scales Walking, Ball, Paper and Ball. The questionnaire also containsdemographic information and the variables age and length.
1.1.3.1 Introspective Dominance
The three introspective scales are shortly described below.
Responsibility This scale contains only the items from the MMPI (Min-nesota Multiphasic Personality Inventory)1 dominance scale (Hathaway, McKin-ley, & Committee, 1989). A translation to a Dutch version is used (Derksen& de Mey, 1997). This 25 dichotomous item (0 = disagree, 1 = agree) testmeasures the personality trait dominance. This questionnaire is frequentlyused in mental health. An example question is ‘I definitely have a lack of selfconfidence’.
Self Esteem The dominance scale from this Dutch Personality Inventorymeasures: initiative taking, managing other people and self-confidence withina group. The scale consists of 17 yes-no items, with reported Cronbach’salphas between the .70 and the .80. Cronbach’s alpha measures internalconsistency, for example for questionnaires. This is a value between 0 and1, a value below .5 are unacceptable, between .5 and .6 is poor, between.6 and .7 is questionable, between .7 and .8 is acceptable, all above .8 isgood (Kline, 2000). An example question is ‘Within a group, I am mostlyin charge’ (Luteijn, Starren, & van Dijk, 2000). The test is stable over time,over a time span of 28 months a correlation is reported of r=.72 (Luteijn etal., 2000).
Social dominance This scale measures the dominance, expressed in socialactivity and attention. A higher score indicates a better relationship withthe group members, and higher probability to be leader (Kalma et al., 1993).An example question from this scale is ‘I have no problems talking in frontof a group’. In other research, a Cronbach’s alpha of .79 is found (Kalma etal., 1993).
1A personality test that is used in mental health
15

1.1. PSYCHOLOGICAL RESEARCH CHAPTER 1. INTRODUCTION
1.1.3.2 Team Member Dominance
Compared to the previous three scales, which are introspective scales, thisscale uses context information. Each team member gives a score for everyother individual team member. This scale contains 10 items, where eachitem consists of an adjective pair where one of the items is the inverse of theother. Each pair has the be scored on a 5-point scale. An example pair is‘dynamic - passive’ (Manusov, 2005).
1.1.3.3 Ranking (intern)
Each group member is asked to make a ranking of the level of dominance ofall members (including himself). Since the focus of this study is on leadershipand not on peck order, the most dominant person is ranked as 1 and all theothers as 0. This is based on the relation between leadership and dominance,as suggested in the literature. This variable is defined as Dominance Rank(DRank).
To extend this measure, a distinction could be made by ten dominancepoints that had to be divided over all group members. More points given indi-cates a higher level of dominance, this is described in the variable DominancePoints (DPoints). By dividing points, the difference of perceived leadershipcan be shown. To determine the perception of leadership it is also asked tomake a ranking of group leadership, this variable is called Leadership Rank(LRank).
1.1.4 Observed initiative taking (first movers)
One of the observable predictors of leadership is initiative taking. Before theteam building games started, the team members were standing literally withtheir backs against a wall. The instruction is given and the needed materialsare put on the ground. This is used as starting point for measuring initiative.Four types of initiative are measured: 1) Walk away from the wall. 2) Pickup the ball. 3) Pick up the paper. 4) Start reading from the paper. Tovalidate this measure, recordings of this were shown to five observers. Theymade a ranking of each of the initiative behaviours.
1.1.5 Results
The descriptive statistics are shown in Table 1.2. Per questionnaire, theMean score and Standard Deviation is given for all participants. Based onthe given answers, the Chronbach’s alpha (α) is calculated. This is a measurefor internal consistency for the questionnaire. The scores of the Chronbach’s
16

CHAPTER 1. INTRODUCTION 1.1. PSYCHOLOGICAL RESEARCH
alpha can be interpreted as follows: Values below 0.5 indicate no consistencyat all, values between the 0.5 and 0.7 are questionable and values above the0.7 are fine. The score range for Self Esteem and Responsibility is between0 and 1, Sociable Dominance and Team Member Dominance scores rangebetween 1 and 5. Both the Self Esteem and the Responsibility score arebelow half of the scale score (.5), quite a low score. The Sociable Dominancewas around the average, which is with a score of 2.694. In comparison, theTeam Member Dominance shows on average a higher score. The alpha’s ofthe Self Esteem is quite low. The scale will not be deleted, but this needs tobe taken into account when interpreting the data.
Table 1.2: Descriptive Statistics for al measures (N=124)
Questionnaire Mean SD αSelf Esteem .411 .165 .554Responsibility .341 .183 .777Sociable Dominance 2.694 .647 .763Team Member Dominance 3.332 .565 .986
1.1.5.1 Initiative taking (first movers)
The Intraclass Correlation (ICC) of the five observers, scoring the initiativetaking of the participants, as described in Section 1.1.4, is calculated as ameasure of agreement. This agreement is quantified as .85, with a statisticalsignificant p < .0001. Within this analysis, 432 measures are used for eachrater.
1.1.5.2 Correlational overview
The correlations in Table 1.3, show the statistical correlation between twovariables, expressed in Pearsons r.
Pearsons r is also known as Pearson product-moment correlation coeffi-cient, which is the centered standardized sum of the cross product of twovariables. De domain of r is between -1 and +1, where 0 is the neutral pointand has no correlation. The closer the value approximates 1, the strongerthe relation between the two variables.
In the social sciences the following interpretation is given to the cor-relational values. A value between 0 and ±0.09 can be interpreted as nocorrelation. Small or weak correlations are found between ±0.1 and ±0.3.Between the ±0.3 and ±0.5 is a moderate or medium correlation. All valuesgreater than +0.5 and below -0.5 indicate a strong correlation (Cohen, 1988).
17

1.1. PSYCHOLOGICAL RESEARCH CHAPTER 1. INTRODUCTION
1.1.6 Discussion
A relation between leadership and dominance found is found in literature.This is result is supported by this study. The data in Table 1.3 shows thisrelation with the significant correlation between the variables DominanceRank (DRKN), Dominance Points (DPNT) and Leadership Points (LPNT).A difference is found between the observed dominance behaviour and theintrospective measures of dominance (in the variables Responsibility, SelfEsteem, Social Dominance and Team Member Dominance). The introspec-tive measures look at behaviour via introspection (self observation), whilethe Team Member Dominance measures behaviour by how it is perceivedby others. One of the reasons for this difference could be context. In smallself-formed groups there is no control by an institutional framework or au-thority. The role of leadership emerges from within the group and everyonehas an equal opportunity to be the leader. Besides this, the role of leadercan change at the occurrence of an event.
In the experimental setting is initiative taking used as an indicator forleadership. During the analysis four different actions of initiative takingcould be distinguished. The best indicator for leadership that is found inthis study is when someone starts walking first. This is indicated by thesignificant correlation between Walking and Leadership Points, DominanceRank and Dominance Points.
18

CHAPTER 1. INTRODUCTION 1.1. PSYCHOLOGICAL RESEARCH
Tab
le1.
3:C
orre
lati
ons
for
all
mea
sure
s(N
=12
4).
Tra
itDom
inan
ceInitiative
Con
stru
ctIntrospection
Observe
Ran
king
Vari
abl
eResp
SE
SD
TMD
DRNK
DPNT
LPNT
Walk
Pap
erBall
Read
Responsibility
1.0
.412∗∗
.322∗∗
-.22
2∗
-.07
7-.10
2.006
-.01
0-.08
6-.09
0-.08
9SelfEsteem
.1.0
-.25
5∗∗
-.03
3-.05
1-.07
8.007
.070
.175
.146
.106
Sociable
Dom
inance
..
1.0
-.17
8∗.017
-.04
6-.04
8.096
-.13
5-.12
3-.06
8Team
Mem
ber
Dom
..
.1.0
.432∗∗
.483∗∗
.462∗∗
.222∗
.089
.099
.147
Dominan
ceRank
..
..
1.0
.794∗∗
.693∗∗
.346∗∗
.276∗∗
.305∗∗
.346∗∗
Dom
inance
Points
..
..
.1.0
.816∗∗
.213∗
.182∗
.213∗
.213∗
Leadership
Points
..
..
..
1.0
.245∗∗
.218∗
.202∗
.158
Walking
..
..
..
.1.0
.201∗
.187∗
.195∗
Pap
er.
..
..
..
.1.0
.922∗∗
.754∗∗
Bals
..
..
..
..
.1.0
.830∗∗
Reading
..
..
..
..
..
1.0
Notes:∗ p
<.05,∗∗p<
.01,∗∗∗ p
<.001
19

1.1. PSYCHOLOGICAL RESEARCH CHAPTER 1. INTRODUCTION
20
Chapter 2
Literature Study
Leadership is the capacity to translate vision intoreality.
Warren Bennis
The number of Closed-circuit television (CCTV) systems increases quicklyin our daily lives, on the street in shopping malls, railway stations and con-cert halls (Boom, 2010). The main goal of these systems is to detect, preventand monitor anti-social, aggressive and obnoxious behaviour. The value ofautomatic analysis in human behaviour is undeniable and essential to safetyand security (Burghouts et al., 2013). To make these CCTV systems effectiveand contributing to safety, intelligent tools are needed to detect unwantedbehaviour.
Generally, public events elapse quiet and easy without any problems. Inthis case, the CCTV system is just used for monitoring the crowd. At theoccurrence of an incident, the consequences can be terrible (Hijum, 2011).Before you reach this state you want as intelligent system, based on theCCTV input, to detect the unwanted behaviour that causes incidents. Oneof the behaviours that could lead to incidents and violence in a public set-ting is aggression (McEllistrem, 2004). Aggressive behaviour can be detectedby a combination of verbal and/or non-verbal information. The actual de-tection of aggression are the outliers of the baseline of normal behaviour(Lefter, Rothkrantz, Burghouts, Yang, & Wiggers, 2011; Lefter, Burghouts,& Rothkrantz, 2012). When aggression is found during an event, it is notonly necessary to intervene to the aggressor, but also the surrounding area.
From the groups of people at public events it is known that they come in89% of the cases at least with one other person (Ge et al., 2009). These groupsconsist mainly of friends or acquaintances who share an interest or like each
21

2.1. LEADERSHIP CHAPTER 2. LITERATURE STUDY
other. These so-called self-formed groups are not part of any institutionalframework and do not have a leader installed by the authority. This form ofleadership is called emerging leadership and has a larger influence over thegroup, in comparison with a leader installed by some authority (Sanchez-Cortes et al., 2010). The strength of a leader is his ability to transformindividual action into group action (Hogg et al., 2006). Interventions couldbe more effective if the leader of the group will be addressed (Haslam et al.,2011).
2.1 Leadership
After an internet literature search, two modalities for predicting leadershipwere found, verbal and non-verbal. For each modality and a combination ofthose two, the different aspects are discussed. This section will be concludedwith a discussion about the modality chosen for this research.
2.1.1 Verbal (speech)
Verbal communication is a powerful way to expressing yourself. From socialpsychology it is know that verbal expression is positively correlated to statusand dominance (Dunbar & Burgoon, 2005). Vocally expressive people aremore dominant and also often have a high-status (Jayagopi, Ba, Odobez, &Gatica-Perez, 2008).
Four types of verbal expression will shortly be discussed. First the relationbetween dominance and the total contribution to a discussion is discussed.Second the relation with speaking time is discussed, followed by speakerenergy. Fourth, the speaker turns and interruptions are explained.
2.1.1.1 Debate Contribution
Within a group debate, the members all contribute differently to the conver-sation. This is clearly visible in an assignment, where the group had to solvea problem by discussion (Bales, 1953; Bass, 1954). An asymmetric distribu-tion in quantity of the contribution became visible for the group members.The differences remained stable over multiple discussions within a session. Ingroups with three, five or seven members, the member with the most input,contributes between 40 and 50% of all contributions (Bales, 1953).
Members who contribute a lot, obviously have an influence on the con-tent, direction and outcome of a discussion. These members determine thedirection of the group, while low input members tend to listen and follow the
22

CHAPTER 2. LITERATURE STUDY 2.1. LEADERSHIP
lead of the high input members. Due to this behaviour, the high input mem-bers become more dominant over the low input members within the group(Bales, 1953; Bass, 1954).
2.1.1.2 Speaking Time
The feature speaking length is the time that a person speaks (Jayagopi et al.,2008). The literature from social psychology supports the result that speak-ing time is a strong predictor for dominance and leadership within a group(Mast, 2002). Two meta-analyses support these findings, with a strong effectsize by 15 and 25 studies. To explain the relationship between speaking timeand dominance, the Expectation States Theory can be used. This theorystates that in task-oriented groups, the expected performance of the teammembers transforms into a self-fulfilling prophecy and becomes the basis forthe differences in dominance within the group (Mast, 2002). The relationbetween dominance and speaking time is not perfect and context dependent.Great amounts of speaking time, does not directly mean a significant dom-inance. This might have to do with the involvement or personal interest inthe topic of discussion. It can be said that high status or high dominantpeople talk more than their low status or low dominant counter parts (Mast,2002).
2.1.1.3 Speaker Energy
Speaker energy refers to a set of labels that is used interchangeably; speechloudness, speech energy, speech tempo, pitch and vocal control (Jayagopiet al., 2008). Speaking loud and expressive has a negative connotation andis associated with attempts to dominate and anger (Costanzo, Markel, &Costanzo, 1969). People speak louder when they are trying to express intenseanger, a dominant type of expressive behaviour (Kimble, Forte, & Yoshikawa,1981). Extrovert people who are socially dominant, speak louder than so-cially introvert people, (Siegman, 1978, as cited in Kimble and Musgrove,(1988)). The loudness of speech seems to be a predictor for dominant be-haviour (Kimble & Musgrove, 1988).
Results validate the presumption that speaker energy can be a predictorfor dominance. Assertive people talk louder and more than unassertive peo-ple. Men also talk louder than female in mixed-sex discussion teams, observedby a team of independent raters (Kimble & Musgrove, 1988). The averagespeaking energy has as prediction accuracy of 66.7% to predict dominancecorrect (Jayagopi et al., 2008).
23

2.1. LEADERSHIP CHAPTER 2. LITERATURE STUDY
2.1.1.4 Speaker Turns
The number of times someone speaks or the number of times someone takesover the conversation is defines as a speaking turn (Jayagopi et al., 2008).Taking over the conversation is a typical indicator of taking control of thesituation, a characteristic of dominant behaviour (Smith-Lovin & Brody,1989). Although it is clearly visible what is going on, it is difficult to analyzeinterruptions. Interruptions are rare events, with little occurrences duringconversations. Because of their infrequency, long conversations and hugedatasets are needed to find them (Smith-Lovin & Brody, 1989). From studieson interruptions is found that men interrupt women more and masculineidentities interrupt those with more feminine images more often. As discussedby Kallock et al. (1985, p. 40, as sited in (Smith-Lovin & Brody, 1989))interruptions are an excellent mechanism for taking over the conversation anda effective measure for dominance. It is a successful mechanism to accomplishleadership and dominance in a discussion.
2.1.2 Nonverbal (movement)
Nonverbal communication contains many aspects for analysis. Only a smallsubset is discussed here. The relation between dominance and leadershipis discussed in the context of the direction of sight, initiative taking andquantity of movement.
2.1.2.1 Direction of sight
Where is someone looking at during a conversation? Is the speaker lookingat the ground or at the other people who participate in the conversation? Isthe speaker looked at during the conversation and how does this influencethe status. High status people receive more visual attention than low statuspeople. People who rarely look at others during a conversation are perceivedas weaker (Exline, Ellyson, & Long, 1975; Jayagopi et al., 2008). In line withthis is the Visual Dominance Ratio (VDR), the proportion of time someonespends looking at the other while speaking over the the proportion of timespent looking at the other while listening (Dovidio & Ellyson, 1982; Exlineet al., 1975). VDR quantifies visual dominance through active or passiveparticipation. When this ratio increases, the strength of dominance alsoincreases (Dunbar & Burgoon, 2005). High power people have a higher VDRthan people with low power (Dovidio & Ellyson, 1982; Jayagopi et al., 2008).Dovidio and Ellyson originally defined VDR as a measure for dyads. In orderto apply this in a multi-party scenario, M-VDR is developed. The looking-
24

CHAPTER 2. LITERATURE STUDY 2.1. LEADERSHIP
while- speaking feature is redefined as when a person who is speaking looks atany participant rather than at other objects in the meeting (Hung, Jayagopi,Ba, Odobez, & Gatica-Perez, 2008).
2.1.2.2 Initiative (First movers)
In the evolutionary game theory is inclined that within a group, the per-son who takes the initiative is more likely to become the leader (Van Vugt,2006). This theory is developed during World War 2 as an analysis tool forstrategies during combat. Nowadays it has become a tool for studying socialinteractions and processes. The literature review of Van Vugt, Hogan, andKaiser, is in line with this game theory and they found that initiative takingis positively correlated with leadership (Van Vugt, 2006). High self-esteemshows the same as initiative taking, namely a better chance to be picked asleader. When the self-esteem is high, it is more likely that this person showsinitiative to act and emerges as group leader (Andrews, 1984). The oppo-site is also shown, shy students show a negative correlation with leadership(Judge, Bono, Ilies, & Gerhardt, 2002).
The preceding psychological research shows that initiative taking can beused as a predictor for dominance and leadership. Although statistical sig-nificant correlations are found, it needs to be noted that this leadership inself-formed small groups is context dependent. Someone could have the ad-vantage of familiarity with the problem to obtain the leadership position.
2.1.2.3 Movement (Visual activity)
From social psychology it is known that dominant people are visual more ac-tive than non-dominant people (Mullen, Salas, & Driskell, 1989; Van Vugt,2006). Visual activity and body movement contains many facets. Domi-nance is related to body movement (Coulson, 2004), posture (Carney, Hall,& LeBeau, 2005; Weisfeld & Beresford, 1982), head movement (Jayagopi etal., 2008; Mignault & Chaudhuri, 2003), gaze (Shang, Liu, & Fu, 2008) andfacial expressions (Knutson, 1996; Mazur & Mueller, 1996) is found (Dunbar& Burgoon, 2005; Hall, Coats, & LeBeau, 2005; Lance & Marsella, 2007;Ridgeway, 1987). Dominant people have more body movement than non-dominant people. Those dominant people also claim notably more spacewith their bodies than their non-dominant counterparts (Jayagopi et al.,2008).
Automated leadership prediction in small groups performs well. The datathat is used originates from a camera that only captures the head of a teammember. The focus here is to capture subtle changes in the facial expression.
25

2.1. LEADERSHIP CHAPTER 2. LITERATURE STUDY
This method performs well with a score between the 62 and 83% correct(Hung & Gatica-Perez, 2010; Jayagopi et al., 2008).
The techniques discussed to predict leadership work well and can be ap-plicable in many situations. In the context of public safety, this does notwork out well. In a crowded environment, the use of vocal information isunfeasible. It is undoable to filter the voice of each individual. Besides that,a second problem is introduced, the mapping from voice to individual.
The information is useful, but the level of analysis will be coarse-grained.The technological evolution has not reached the state of capturing facialexpressions of a crowd at a public event. So the expressed visual behaviourto analyze will also be less fine-grained. For this reason, the choice is made touse body movements. To be sure that everybody is always visible on camera,a fisheye from above is used.
In the next chapter will discuss the algorithm that is created. This al-gorithm uses the fisheye camera in the ceiling to capture the movements ofthe group. With the use of this camera, everybody is always visible. It ishereby assumed that the people will not sit on each other’s shoulders (Whichis due to the height of the experiment room a safe assumption). During thedevelopment of the algorithm, some challenges are faced. What to do withpeople that are taller, or people that wear cloths with a pattern comparedto plain clothes?
26

Chapter 3
Algorithms
Any sufficiently advanced technology isindistinguishable from magic.
Arthur C. Clarke
The recordings from the ceiling camera that were made during the psycho-logical study were analyzed. Before the actual gesticulation measure couldtake place, the recordings needed to be preprocessed. This preprocessingconsisted of a series of steps executed in chain. The following steps can bedistinguished and are described in this chapter.
First the starting point of the discussion had to be found and a sectionof three minutes is made. Second, the sections are cut into segments of tenseconds. The third step is to reduce the frame rate of the segments, wherein the fourth step the color from the frames is transformed to gray scale. Instep five the background is removed from the frames and only the peoplestay visible in the room. The quality of the image is increased in step six byremoving the noise. The final step is the gesticulation calculation.
3.1 Find the beginning of the recording
The start of the brainstorm session is defined as the moment that the groupis finished reading the assignment. This is characterized by flipping theassignment back to the front page of the assignment, see Appendix A.2.From this moment on a segment of three minutes is taken from the recording.Cutting the recording is done by hand with the use of ffmpeg1, a tool thatcan cut and encode movies.
1http://www.ffmpeg.org
27

3.2. DIVIDE THE RECORDINGS CHAPTER 3. ALGORITHMS
3.2 Divide the recordings
From the recording a 3-minute section is created. These sections are cutinto segments of 10 seconds, as shown in Figure 3.1. To reduce the dataand increase the processing speed, each third segment will be used in furtheranalysis.
3.3 Frame-rate reduction
The video recordings are shot with a frame rate around the 25 frames persecond. When analyzing the movie files, 251 frames could be collected. Thisresulted in 250 comparisons of frames. When comparing all adjacent frames,the time interval between them is around the 40ms. In this time span smallmovements as shaking and shivering with the hands become visible reallywell, but the bigger and broader movements got neglected. To avoid thisissue and shift from micro to macro movements, the original number of 25fps is reduced to 1.6 fps in the analysis. The reduction of frames is also donein the study of Jayagopi et al., here the recording is reduced to 5 framesper second (200ms) (Jayagopi et al., 2008). The focus here was on subtilemovements with the head. Manual comparison of 251, 32, 16, 6 and 4 framemovies is performed to see which number of frames had the best visual resultin showing macro movements. This reduction to 16 frames had the bestresults, which is equal to a frame rate of 1.6 frames per second, a reductionfrom 40ms to 625ms. A visual representation of Finding the beginning of therecording, Divide the recording and Frame-rate reduction is shown in Figure3.1.
3.4 Color reduction
A color is a composition of three prime colors, red green and blue. Theamount of contribution of each prime color is expressed in a value between0 and 255 and can be represented in a range of 8 bits. An intuitive way ofmerging these these prime colors into one set of gray shades is by taking theaverage value of each prime color as shown in Equation 3.1.
gray = (red+ green+ blue)/3 (3.1)
This method works fine and quick, but has some shortcomings. The trans-formation of luminosity (brightness) deviates. Pure green is much lighterthan pure red and that is more brighter than pure blue. This is solved by
28

CHAPTER 3. ALGORITHMS 3.5. BACKGROUND SUBTRACTION
Figure 3.1: Separation and reduction of recording information
adding a weight factor to each color and results in Equation 3.2. Blue is thedarkest and gets less weight than the others (Hunt, 2005, p. 408).
gray = (blue× 0.114 + green× 0.587 + red× 0.229) (3.2)
3.5 Background subtraction
Each frame is now represented in shades of gray. To get a clearer view of thepeople in the room, the background is removed. This is done by subtractingan empty shot of the room from each frame. The result of this subtraction isapplied to a threshold. If the chosen threshold is to low, more pixels will beclassified as background. When the threshold is to high, less pixels will beclassified as background. For each pixel, if the difference between the currentframe and the background image is smaller than a certain threshold, thatpixel will be set to zero. For a formal notation see Equation 3.3, here B(x,y)
is the background image with x and y coordinates, F(x,y,t) is the foregroundimage also with x and y coordinates and time indication or frame number t.
B(x,y) − F(x,y,t) < τ = 0 (3.3)
This results in a frame with objects that are not in the background im-age. In the most optimal situation, the whole frame is black, with 3 or 4white blobs in it. The noise that is left behind can be removed with a noise
29

3.6. NOISE REDUCTION CHAPTER 3. ALGORITHMS
reduction filter, as described in Section 3.6. Each blob represents a person.In this case, the threshold is set to 15, this gives well recognizable people.
3.6 Noise reduction
Noise in digital images occurs during the conversion from analog, the realworld, to digital conversion. A digital photo camera uses a CCD (Charge-coupled device) array as image sensors, which work on the photoelectric prin-ciple. When light reaches the sensor, electrons are produced and captured.Faulty electrons, for example caused by heat, are also captured by the sensorand cause noise. Although the behaviour of this product is uncontrolled, itsdistribution is gaussian (Bovik, 2005).
This noise could be removed with a relatively easy and commonly usedrobust technique, called median smoothing. With a median smoothing filter,the pixel is replaced with the center value of the set surrounding values, afterordering. The original value is included in this set. This filter is robust forextreme outliers of one of the neighbours. Besides this, the new value is avalue out of the set, and not a newly calculated one, as shown in Equation 3.4.A graphical representation of an image before and after the noise reductionis shown in Figure 3.2.
r(i, j) = median{x[i, j], (i, j) ∈ ω} (3.4)
Computational complexity of median smoothing has an order ofO(n log2n).This is mainly caused by the sorting part of the algorithm. This complexitycan be neglected since it is only used for a small set of items that need to besorted (Huang, Yang, & Tang, 1979).
3.7 Gesticulation
It is found in social psychology that dominant people move more than non-dominant people (Mullen et al., 1989; Van Vugt, 2006). To measure move-ment, a quantification had to be made. The measurement of movement isdefined as the amount of someone moves with their hands, arms and bodyduring a conversation, expressed in changed pixels. This measure is mainlythe movement of the limbs, but also the movement of one step off centre,since it is hard to stand still. If someone starts walking through the room,this does not count as gesticulation.
30

CHAPTER 3. ALGORITHMS 3.7. GESTICULATION
(a) Original image Gray Scale (b) Median Smoothing 3
Figure 3.2: Median Smoothing algorithm
After the frame rate reduction, the gesticulation can be measured. Toachieve this, the color reduction is applied to reduce the amount of infor-mation in each frame to increase the processing speed. The backgroundsubtraction algorithm is applied to handle the issue of dependency on thepattern of the cloths.
When wearing a solid colored shirt, the movement is only visible on theedges of the person in the direction of the movement. While wearing a blockedshirt, the movement was also visible within the person, on the side of theblocks. This problem was tackled by introducing background subtractionand thresholding. A person now becomes, where all differences are below thethreshold, a white blob on a black screen. Again, the threshold is 15, and avariation of thresholds is shown in Figure 3.3.
People who are taller are closer to the camera. By definition, these peoplefill a bigger area on the screen. When moving the same distance through theroom as a smaller person, the amount of movement and thus gesticulation,is larger. To control this length issue, the values will be normalized. Thismeans that the number of changed pixels is divided by the number of pixelsabove the threshold. This has some adverse consequences for larger people.The gesticulation movement index is now defined as the absolute differencebetween two adjacent frames divided by the square root of the number ofpixels of the second frame above the threshold. The formula is stated inEquation 3.5, where i is the frame number, (x, y) is the pixel in the frame,and the result is a value between 0 and 1. The whole is multiplied by 100 tomake it a percent score.
31

3.7. GESTICULATION CHAPTER 3. ALGORITHMS
(a) Original Image (b) Gray Scaling
(c) Treshold 00 (d) Treshold 05 (e) Treshold 15
(f) Treshold 25 (g) Treshold 50 (h) Treshold 100
Figure 3.3: Multiple thresholds to visualizing people at subtraction of thebackground
Gesticulation score ∆i =
∑(x,y) | I
(x,y)i+1 − I(x,y)i |∑
(x,y) I(x,y)i
× 100 (3.5)
32

CHAPTER 3. ALGORITHMS 3.8. ANALYSIS
3.8 Analysis
After processing each video file, per group member, 15 values of gesticulationare returned. For each collection of measures a mean and standard deviationis calculated. These values will be used in further analysis. Combined withthis, a ranking per group will be made on the basis of the average score pervideo. Since this research is about leadership, the value of the leader, relativeto the group is of interest. The rest of this section contains the different teststhat are performed.
In the analysis the hypothesis and research questions answers will be an-swers. First, the difference in gesticulation between leaders and non-leadersis discussed. The following hypothesis will be tested:H0: µ = µ0 In words: The mean score of leader gesticulation is equal to thenon-leader gesticulation. This is tested for each of the six segments individ-ually and for all of them together. A T-test will be sufficient to test thehypothesis. Besides this the difference between two samples is calculated.This is illustrated by the d′-value, used in the Signal Detection Theory. Incase of two equal standard deviations σ1 = σ2 the equation
d′ =(µ1 − µ2)
σ
is used. This is only applicable in a few cases. In many others, when thestandard deviations are not equal, (σ1 6= σ2) the appropriate measure ofsensitivity da is used (Simpson & Fitter, 1973; Swets, 1986a, 1986b).
da =(µ1 − µ2)√
σ21+σ
22
2
Based on the available distribution information, Receiver Operating Char-acteristics are plotted. This is a graphical representation to show the per-formance of a classifier system. It shows the True Positive Rate (TPR) as afunction of the False Positive Rate (FPR) for different points. The closer thecurve to the upper left corner, the better the performance of the classifier(Zweig & Campbell, 1993).
Second, the question how the gesticulation algorithm performs comparedto the manual validation, is discussed. To answer this, a series of T-tests isperformed. The TPR and FPR are calculated on the basis of a contingencytable. The structure of the table is shown in Table 3.1. The TPR or hit rate iscalculated by (A/(A+B)) and FPR or miss rate is calculated by (C/(C+D)).Based on these measures Receiver Operating Characteristics (ROC) can beplotted, which gives a visual representation of the performance.
33

3.8. ANALYSIS CHAPTER 3. ALGORITHMS
Table 3.1: Contingency Table Structure
Event Event Observedforecast Yes No Marginal total
Yes A B A+BNo C D C+D
Marginal A+C B+D A+B+C+D = Ntotal
In the third question the predictability of leadership by the gesticulationalgorithm is discussed. The measures will be included in the correlationaltable that looks like Table 1.3. This shows how the algorithm correlateswith all the other measures of dominance and leadership. On the basis ofthe assumed ground-truth the TPR and FPR are calculated for the differentrecording segments. To visualize the performance, ROC-curves are plotted.
34
Chapter 4
Data Description
The supreme quality of leadership is integrity.
Dwight Eisenhower
4.1 Experimental data
In the conducted experiment from the psychological research, a collection ofvideo recordings is created. During this experiment, the team members arerecorded with five camera’s. This data will be used as input for the algo-rithms. Next to the video recordings, a questionnaire from the psychologicalresearch is used as input data for analysis.
4.1.1 Video Data
The room where the experiment was conducted is equipped with five cameras.In each corner of the room a standard security camera, with a vision angleof approximate 64◦, is mounted. In the center of the room, in the ceiling,a fisheye camera records from above. This angle of sight is nearly 187◦. Avisual representation of the room is shown in Figure 4.1. The colored slicesrepresent an approximation of the visual area of the cameras. In the centreunder the fisheye, a table is positioned where the people could stand around.
4.1.2 Questionnaire
The results from the questionnaire, as described in Section 1.1.3, are usedand extended by the addition of the results from the gesticulation algorithm
35

4.2. OBSERVED BEHAVIOUR CHAPTER 4. DATA DESCRIPTION
360◦
≈ 64◦
Table
Figure 4.1: Visual representation of the experimental area
(Section 3.7) and manual validation (Section 4.2). This combined result willbe used as dataset during the analysis.
4.2 Observed behaviour
It is found in literature that people who score high on the dominance scale,make more movements with their hands and body than people who score lowon the scale. This movement of the hands and arms is called gesticulationand will be used as a measure for predicting leadership. Before an automatedrecognition can be used, a manual validation has to be performed. Thisvalidation is necessary to validate that the behaviour of interest is observablein the recordings.
4.2.1 Gesticulation
Recordings of 24 of the participating groups were suitable for the manualvalidation. During this validation four people ranked the members of each
36

CHAPTER 4. DATA DESCRIPTION 4.2. OBSERVED BEHAVIOUR
group in sessions of 10 seconds each. A ranking is made of the amount ofmovement through the space. The person who had the most gesticulationwas ranked as 1, the person with second most gesticulation was ranked as 2,and so on.
4.2.1.1 Procedure
Each observer is given a short description of the context of the experiment.The recordings from the fisheye camera are shown to four observers. In theserecordings, all the participants in the experiment were always visible. It wasnot possible to hide behind each other. From each team six recordings of 10seconds were shown, within a time frame of 3 minutes. It was possible forthe observers to pause and replay the recordings.
The movie started at the moment that the group finishes reading theassignment and start discussing. The group had to turn the paper of theassignment, to see some images that are necessary for the discussion. At themoment that the page is turned, the selection of the recording starts.
4.2.1.2 Ranking
The first three minutes of the group task are analyzed. This section of therecording is cut into pieces of 10 seconds, where every third segment is usedin the analysis, see Figure 3.1. Each member of the group is examined andranked, based on gesticulation, within the group. The focus in this rankingis on the change in space that is used for movements of a person. Is thisperson gesticulating, making the personal space around as big as possible,active and attendant in the room?
A ranking of this movement will be made. The person that gesticulatesmost during the 10 second session will be ranked as 1, the second as 2, andso on. The table in the middle can be used as a static reference point.
Since the topic of this study is about leadership, the main focus is onthe person who gesticulates most. The data from this manual analysis istransformed in such a way that the person with rank 1 will keep rank 1 andall the others get rank 0.
4.2.1.3 Data Analysis
The recordings that are shown are from the fisheye camera is on the ceiling.With this kind of camera comes transformation of the image to capture thewhole area. The videos are shown unedited. The observers who ranked the10 second segments have backgrounds in different areas. Two of them are
37

4.2. OBSERVED BEHAVIOUR CHAPTER 4. DATA DESCRIPTION
female and two of them are male with respectively ages of 21, 23, 17 and 27year.
Based on the rankings from the observers, the Intraclass Correlation Co-efficient (ICC) is calculated to measure the inter-rater reliability within theobservers. ICC is a quantitative measure that describes the strength of con-sistency between the observers. To make a single measure of all observations,the most common value is taken. In case of a conflict, first the non-conflictingvalues are processed.
The Intraclass Correlation (ICC) of the four raters is calculated as ameasure of agreement. This agreement is quantified in .816, with a statisticalsignificant p < .0001. Within this analysis, 336 measures are used for eachrater.
38

Chapter 5
Results
A leader is one who knows the way, goes theway, and shows the way.
John Maxwell
In this chapter the results of the analysis, as described in the previouschapter, will be presented. First the results of the hypothesis ‘The meanscore of leader gesticulation is equal to the non-leader gesticulation’ will bediscussed. Second, the performance of the gesticulation algorithm is shown.Third the predictability of leadership is shown for the gesticulation algorithm.
In each adjacent frame, the mean and standard deviation was calculatedfor each individual team member. A visual representation of this is presentedin Figure 5.1 - 5.6. Each column in the figure represents a group, where eachrow represents a moment in time. When reading the figure from top tillbottom, the evolution of movement per group can be seen. Each graph has3 or 4 lines in different colors, per person this color is unique. The line typediffers per color. The ‘=’ line represents the leader of the group on basis ofthe ground-truth. The dotted line ‘–’ represents the leader on basis of themanual video observations. The combination of these two, a dotted doubleline’ (‘==’), is a leader both on basis of the ground-truth and on the basis ofthe observers. The curve with the highest mean score is the leader on basisof the algorithm.
When analysing the plots in Figure 5.1 - 5.6, there are some peaks near the0-value on the x-axis visible. This are people standing still and barely move.The lower and broader waves are people who move more. This behaviour,based on a quick visible observation is quite stable. In a few cases, thebehaviour of almost no movement changes to movement. During the periodof no movement, someone could be reading the assignment again or listening
39
CHAPTER 5. RESULTS
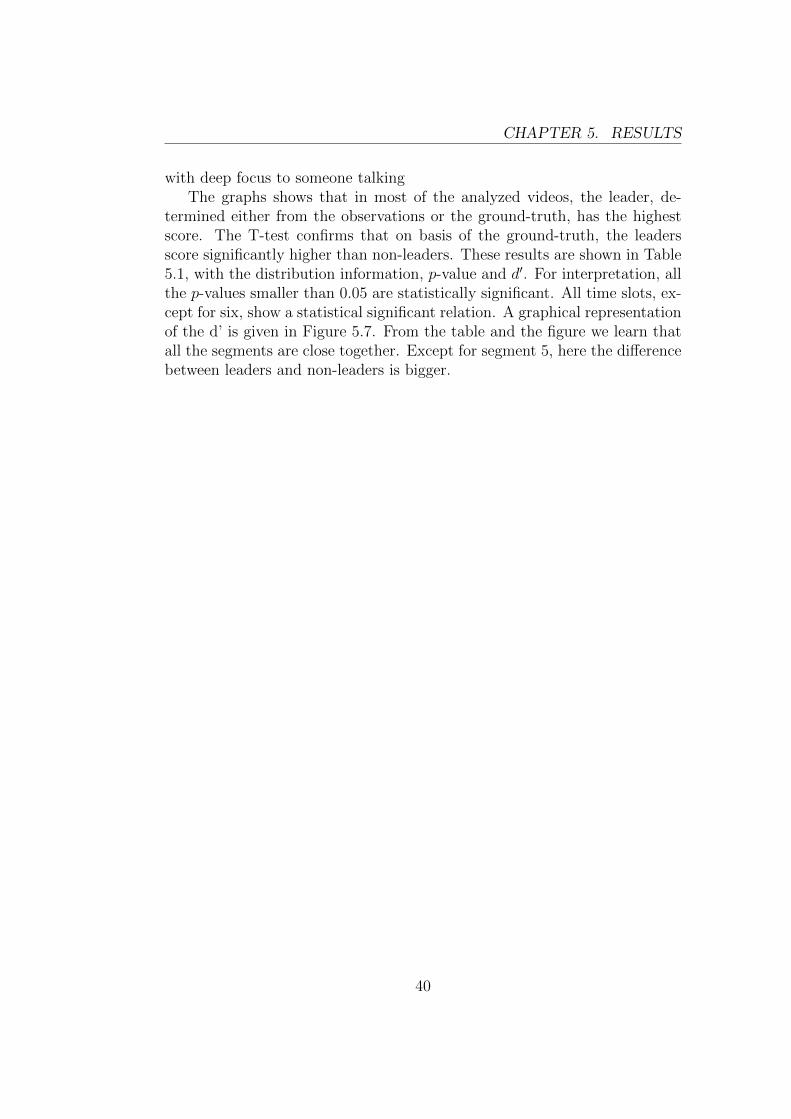
with deep focus to someone talkingThe graphs shows that in most of the analyzed videos, the leader, de-
termined either from the observations or the ground-truth, has the highestscore. The T-test confirms that on basis of the ground-truth, the leadersscore significantly higher than non-leaders. These results are shown in Table5.1, with the distribution information, p-value and d′. For interpretation, allthe p-values smaller than 0.05 are statistically significant. All time slots, ex-cept for six, show a statistical significant relation. A graphical representationof the d’ is given in Figure 5.7. From the table and the figure we learn thatall the segments are close together. Except for segment 5, here the differencebetween leaders and non-leaders is bigger.
40

−10 −5 0 5 10 150
0.1
0.2
0.3
0.4
Gesticulation Score
BlackBlueRedGreen
(a) 0401 - 1-1
−10 −5 0 5 10 150
5 · 10−2
0.1
0.15
MISSING
Gesticulation Score
Missing
(b) 0501 MISSING
−10 −5 0 5 10 150
5 · 10−2
0.1
0.15
Gesticulation Score
BlackBlueRedGreen
(c) 0801 - 3-4
−10 −5 0 5 10 150
0.2
0.4
0.6
0.8
Gesticulation Score
BlackBlueRedGreen
(d) 0901 - 3-1
−10 −5 0 5 10 150
0.1
0.2
0.3
0.4
0.5
Gesticulation Score
BlackBlueRedGreen
(e) 0404 - 1-1
−10 −5 0 5 10 150
0.2
0.4
0.6
0.8
1
Gesticulation Score
BlackBlueRedGreen
(f) 0504 - 4-3
−10 −5 0 5 10 150
0.1
0.2
0.3
Gesticulation Score
BlackBlueRedGreen
(g) 0804 - 3-2
−10 −5 0 5 10 150
0.1
0.2
0.3
0.4
Gesticulation Score
BlackBlueRedGreen
(h) 0904 - 1-1
−10 −5 0 5 10 150
0.5
1
1.5
2
Gesticulation Score
BlackBlueRedGreen
(i) 0407 - 2-2
−10 −5 0 5 10 150
0.1
0.2
0.3
0.4
0.5
Gesticulation Score
BlackBlueRedGreen
(j) 0507 - 4-4
−10 −5 0 5 10 150
0.1
0.2
0.3
0.4
Gesticulation Score
BlackBlueRedGreen
(k) 0807 - 2-2
−10 −5 0 5 10 150
0.1
0.2
0.3
Gesticulation Score
BlackBlueRedGreen
(l) 0907 - 3-4
−10 −5 0 5 10 150
0.2
0.4
0.6
0.8
1
1.2
Gesticulation Score
BlackBlueRedGreen
(m) 0410 - 1-1
−10 −5 0 5 10 150
0.2
0.4
0.6
0.8
1
1.2
Gesticulation Score
BlackBlueRedGreen
(n) 0510 - 3-3
−10 −5 0 5 10 150
0.1
0.2
0.3
0.4
Gesticulation Score
BlackBlueRedGreen
(o) 0810 - 1-1
−10 −5 0 5 10 150
0.1
0.2
0.3
0.4
Gesticulation Score
BlackBlueRedGreen
(p) 0910 - 1-3
−10 −5 0 5 10 150
0.1
0.2
0.3
0.4
Gesticulation Score
BlackBlueRedGreen
(q) 0413 - 1-1
−10 −5 0 5 10 150
0.5
1
1.5
2
Gesticulation Score
BlackBlueRedGreen
(r) 0513 - 3-1
−10 −5 0 5 10 150
2 · 10−2
4 · 10−2
6 · 10−2
8 · 10−2
0.1
Gesticulation Score
BlackBlueRedGreen
(s) 0813 - 2-1
−10 −5 0 5 10 150
0.1
0.2
0.3
0.4
Gesticulation Score
BlackBlueRedGreen
(t) 0913 - 1-1
−10 −5 0 5 10 150
0.1
0.2
0.3
0.4
Gesticulation Score
BlackBlueRedGreen
(u) 0416 - 3-3
−10 −5 0 5 10 150
0.5
1
1.5
Gesticulation Score
BlackBlueRedGreen
(v) 0516 - 4-2
−10 −5 0 5 10 150
0.2
0.4
0.6
0.8
1
1.2
Gesticulation Score
BlackBlueRedGreen
(w) 0816 - 1-1
−10 −5 0 5 10 150
0.2
0.4
0.6
Gesticulation Score
BlackBlueRedGreen
(x) 0916 - 2-2
Figure 5.1: Groups 04, 05, 08 and 09
CHAPTER 5. RESULTS
41

−10 −5 0 5 10 150
0.1
0.2
0.3
0.4
Gesticulation Score
BlackBlueRedGreen
(a) 1001 - 3-1
−10 −5 0 5 10 150
5 · 10−2
0.1
0.15
MISSING
Gesticulation Score
Missing
(b) 1101 MISSING
−10 −5 0 5 10 150
0.2
0.4
0.6
Gesticulation Score
BlackBlueGreen
(c) 1201 - 2-1
−10 −5 0 5 10 150
5 · 10−2
0.1
0.15
0.2
Gesticulation Score
BlackBlueRedGreen
(d) 1301 - 3-4
−10 −5 0 5 10 150
0.1
0.2
0.3
Gesticulation Score
BlackBlueRedGreen
(e) 1004 - 3-3
−10 −5 0 5 10 150
0.2
0.4
0.6
0.8
Gesticulation Score
BlackBlueRedGreen
(f) 1104 - 4-4
−10 −5 0 5 10 150
0.1
0.2
0.3
0.4
0.5
Gesticulation Score
BlackRedGreen
(g) 1204 - 1-1
−10 −5 0 5 10 150
0.5
1
1.5
2
Gesticulation Score
BlackBlueRedGreen
(h) 1304 - 4-1
−10 −5 0 5 10 150
0.2
0.4
0.6
Gesticulation Score
BlackBlueRedGreen
(i) 1007 - 2-3
−10 −5 0 5 10 150
0.5
1
1.5
2
Gesticulation Score
BlackBlueRedGreen
(j) 1107 - 4-1
−10 −5 0 5 10 150
0.2
0.4
0.6
0.8
1
Gesticulation Score
BlackRedGreen
(k) 1207 - 1-1
−10 −5 0 5 10 150
0.1
0.2
0.3
Gesticulation Score
BlackBlueRedGreen
(l) 1307 - 3-1
−10 −5 0 5 10 150
0.5
1
1.5
Gesticulation Score
BlackBlueRedGreen
(m) 1010 - 3-3
−10 −5 0 5 10 150
0.5
1
1.5
Gesticulation Score
BlackBlueRedGreen
(n) 1110 - 4-1
−10 −5 0 5 10 150
0.2
0.4
0.6
0.8
1
1.2
Gesticulation Score
BlackRedGreen
(o) 1210 - 2-1
−10 −5 0 5 10 150
0.2
0.4
0.6
0.8
1
1.2
Gesticulation Score
BlackBlueRedGreen
(p) 1310 - 2-1
−10 −5 0 5 10 150
0.5
1
1.5
Gesticulation Score
BlackBlueRedGreen
(q) 1013 - 2-1
−10 −5 0 5 10 150
0.5
1
Gesticulation Score
BlackBlueRedGreen
(r) 1113 - 4-2
−10 −5 0 5 10 150
0.2
0.4
0.6
0.8
1
1.2
Gesticulation Score
BlackRedGreen
(s) 1213 - 1-1
−10 −5 0 5 10 150
0.2
0.4
0.6
0.8
1
Gesticulation Score
BlackBlueRedGreen
(t) 1313 - 3-1
−10 −5 0 5 10 150
5 · 10−2
0.1
0.15
0.2
0.25
Gesticulation Score
BlackBlueRedGreen
(u) 1016 - 2-4
−10 −5 0 5 10 150
0.2
0.4
0.6
0.8
1
1.2
Gesticulation Score
BlackBlueRedGreen
(v) 1116 - 4-1
−10 −5 0 5 10 150
0.2
0.4
0.6
0.8
Gesticulation Score
BlackRedGreen
(w) 1216 - 1-2
−10 −5 0 5 10 150
5 · 10−2
0.1
0.15
Gesticulation Score
BlackBlueRedGreen
(x) 1316 - 2-4
Figure 5.2: Groups 10, 11, 12 and 13
CHAPTER 5. RESULTS
42

−10 −5 0 5 10 150
0.5
1
1.5
Gesticulation Score
BlackBlueRedGreen
(a) 1401 - 1-1
−10 −5 0 5 10 150
5 · 10−2
0.1
0.15
0.2
Gesticulation Score
RedRedRedRed
(b) 1601 - 3-1
−10 −5 0 5 10 150
0.2
0.4
0.6
0.8
1
1.2
Gesticulation Score
RedRedRedRed
(c) 1701 - 4-4
−10 −5 0 5 10 150
0.2
0.4
0.6
Gesticulation Score
BlackBlueRedGreen
(d) 1801 - 1-2
−10 −5 0 5 10 150
0.5
1
1.5
2
Gesticulation Score
BlackBlueRedGreen
(e) 1404 - 3-3
−10 −5 0 5 10 150
0.1
0.2
0.3
0.4
0.5
Gesticulation Score
RedRedRedRed
(f) 1604 - 2-1
−10 −5 0 5 10 150
0.2
0.4
0.6
0.8
Gesticulation Score
BlackBlueRedGreen
(g) 1704 - 3-1
−10 −5 0 5 10 150
0.2
0.4
0.6
Gesticulation Score
BlackBlueRedGreen
(h) 1804 - 1-1
−10 −5 0 5 10 150
0.2
0.4
0.6
Gesticulation Score
BlackBlueRedGreen
(i) 1507 - 1-1
−10 −5 0 5 10 150
0.1
0.2
0.3
Gesticulation Score
BlackBlueRedGreen
(j) 1607 - 4-1
−10 −5 0 5 10 150
0.2
0.4
0.6
0.8
1
Gesticulation Score
BlackBlueRedGreen
(k) 1707 - 3-3
−10 −5 0 5 10 150
0.5
1
1.5
Gesticulation Score
BlackBlueRedGreen
(l) 1807 - 1-1
−10 −5 0 5 10 150
0.2
0.4
0.6
Gesticulation Score
BlackBlueRedGreen
(m) 1510 - 1-1
−10 −5 0 5 10 150
0.1
0.2
0.3
0.4
Gesticulation Score
BlackBlueRedGreen
(n) 1610 - 3-1
−10 −5 0 5 10 150
0.5
1
1.5
2
Gesticulation Score
BlackBlueRedGreen
(o) 1710 - 3-3
−10 −5 0 5 10 150
0.2
0.4
0.6
0.8
1
1.2
Gesticulation Score
BlackBlueRedGreen
(p) 1810 - 1-1
−10 −5 0 5 10 150
0.1
0.2
0.3
0.4
0.5
Gesticulation Score
BlackBlueRedGreen
(q) 1513 - 3-3
−10 −5 0 5 10 150
0.1
0.2
0.3
0.4
0.5
Gesticulation Score
BlackBlueRedGreen
(r) 1613 - 4-3
−10 −5 0 5 10 150
0.2
0.4
0.6
0.8
Gesticulation Score
BlackBlueRedGreen
(s) 1713 - 4-1
−10 −5 0 5 10 150
0.2
0.4
0.6
Gesticulation Score
BlackBlueRedGreen
(t) 1813 - 1-2
−10 −5 0 5 10 150
0.2
0.4
0.6
Gesticulation Score
BlackBlueRedGreen
(u) 1516 - 2-2
−10 −5 0 5 10 150
0.2
0.4
0.6
0.8
1
1.2
Gesticulation Score
BlackBlueRedGreen
(v) 1616 - 1-1
−10 −5 0 5 10 150
0.5
1
1.5
2
Gesticulation Score
BlackBlueRedGreen
(w) 1716 - 3-3
−10 −5 0 5 10 150
0.5
1
1.5
Gesticulation Score
BlackBlueRedGreen
(x) 1816 - 2-2
Figure 5.3: Groups 14, 15, 16, 17 and 18
CHAPTER 5. RESULTS
43

−10 −5 0 5 10 150
5 · 10−2
0.1
0.15
0.2
0.25
Gesticulation Score
BlackBlueRedGreen
(a) 1901 - 3-1
−10 −5 0 5 10 150
5 · 10−2
0.1
0.15
Gesticulation Score
BlackBlueGreen
(b) 2101 - 3-1
−10 −5 0 5 10 150
5 · 10−2
0.1
0.15
0.2
0.25
Gesticulation Score
BlackBlueRedGreen
(c) 2201 - 2-1
−10 −5 0 5 10 150
5 · 10−2
0.1
0.15
MISSING
Gesticulation Score
Missing
(d) 1904 - MISSING
−10 −5 0 5 10 150
0.1
0.2
0.3
Gesticulation Score
BlackBlueGreen
(e) 2104 - 1-1
−10 −5 0 5 10 150
0.2
0.4
0.6
0.8
1
Gesticulation Score
BlackBlueRedGreen
(f) 2204 - 1-3
−10 −5 0 5 10 150
0.2
0.4
0.6
0.8
Gesticulation Score
BlackBlueRedGreen
(g) 1907 - 2-1
−10 −5 0 5 10 150
5 · 10−2
0.1
0.15
0.2
Gesticulation Score
BlackBlueGreen
(h) 2107 - 3-3
−10 −5 0 5 10 150
0.2
0.4
0.6
Gesticulation Score
BlackBlueRedGreen
(i) 2207 - 1-2
−10 −5 0 5 10 150
0.5
1
1.5
Gesticulation Score
BlackBlueRedGreen
(j) 1910 - 2-2
−10 −5 0 5 10 150
5 · 10−2
0.1
0.15
MISSING
Gesticulation Score
Missing
(k) 2110 - MISSING
−10 −5 0 5 10 150
0.1
0.2
0.3
Gesticulation Score
BlackBlueRedGreen
(l) 2210 - 2-1
−10 −5 0 5 10 150
5 · 10−2
0.1
0.15
0.2
0.25
Gesticulation Score
BlackBlueRedGreen
(m) 1913 - 3-4
−10 −5 0 5 10 150
0.1
0.2
0.3
Gesticulation Score
BlackBlueGreen
(n) 2113 - 2-1
−10 −5 0 5 10 150
0.2
0.4
0.6
0.8
1
Gesticulation Score
BlackBlueRedGreen
(o) 2213 - 1-1
−10 −5 0 5 10 150
0.1
0.2
0.3
Gesticulation Score
BlackBlueRedGreen
(p) 1916 - 2-1
−10 −5 0 5 10 150
5 · 10−2
0.1
0.15
Gesticulation Score
BlackBlueGreen
(q) 2116 - 3-1
−10 −5 0 5 10 150
0.2
0.4
0.6
0.8
Gesticulation Score
BlackBlueRedGreen
(r) 2216 - 1-1
Figure 5.4: Groups 19, 21 and 22
CHAPTER 5. RESULTS
44

−10 −5 0 5 10 150
0.5
1
1.5
2
Gesticulation Score
BlackBlueRedGreen
(a) 2301 - 1-3
−10 −5 0 5 10 150
0.1
0.2
0.3
0.4
0.5
Gesticulation Score
BlackBlueRedGreen
(b) 2401 - 1-1
−10 −5 0 5 10 150
0.2
0.4
0.6
Gesticulation Score
BlackBlueRedGreen
(c) 2601 - 3-2
−10 −5 0 5 10 150
5 · 10−2
0.1
0.15
Gesticulation Score
BlackBlueRedGreen
(d) 2701 - 4-2
−10 −5 0 5 10 150
0.5
1
1.5
2
Gesticulation Score
BlackBlueRedGreen
(e) 2304 - 1-1
−10 −5 0 5 10 150
5 · 10−2
0.1
0.15
0.2
Gesticulation Score
BlackBlueRedGreen
(f) 2401 - 1-1
−10 −5 0 5 10 150
0.1
0.2
0.3
Gesticulation Score
BlackBlueRedGreen
(g) 2604 - 1-1
−10 −5 0 5 10 150
0.1
0.2
0.3
0.4
Gesticulation Score
BlackBlueRedGreen
(h) 2704 - 4-4
−10 −5 0 5 10 150
0.5
1
1.5
2
Gesticulation Score
BlackBlueRedGreen
(i) 2307 - 1-2
−10 −5 0 5 10 150
0.1
0.2
0.3
Gesticulation Score
BlackBlueRedGreen
(j) 2407 - 1-1
−10 −5 0 5 10 150
0.2
0.4
0.6
0.8
1
Gesticulation Score
BlackBlueRedGreen
(k) 2607 - 3-2
−10 −5 0 5 10 150
0.2
0.4
0.6
Gesticulation Score
BlackBlueRedGreen
(l) 2707 - 4-1
−10 −5 0 5 10 150
1
2
3
Gesticulation Score
BlackBlueRedGreen
(m) 2310 - 1-2
−10 −5 0 5 10 150
0.1
0.2
0.3
0.4
0.5
Gesticulation Score
BlackBlueRedGreen
(n) 2410 - 1-1
−10 −5 0 5 10 150
0.2
0.4
0.6
0.8
Gesticulation Score
BlackBlueRedGreen
(o) 2610 - 3-3
−10 −5 0 5 10 150
0.2
0.4
0.6
0.8
1
1.2
Gesticulation Score
BlackBlueRedGreen
(p) 2710 - 4-4
−10 −5 0 5 10 150
0.1
0.2
0.3
0.4
0.5
Gesticulation Score
BlackBlueRedGreen
(q) 2313 - 2-1
−10 −5 0 5 10 150
0.2
0.4
0.6
0.8
Gesticulation Score
BlackBlueRedGreen
(r) 2413 - 2-2
−10 −5 0 5 10 150
0.2
0.4
0.6
0.8
1
1.2
Gesticulation Score
BlackBlueRedGreen
(s) 2613 - 2-3
−10 −5 0 5 10 150
5 · 10−2
0.1
0.15
0.2
0.25
Gesticulation Score
BlackBlueRedGreen
(t) 2713 - 3-1
−10 −5 0 5 10 150
1
2
3
Gesticulation Score
BlackBlueRedGreen
(u) 2316 - 3-1
−10 −5 0 5 10 150
0.1
0.2
0.3
0.4
0.5
Gesticulation Score
BlackBlueRedGreen
(v) 2416 - 2-2
−10 −5 0 5 10 150
0.5
1
1.5
Gesticulation Score
BlackBlueRedGreen
(w) 2616 - 2-3
−10 −5 0 5 10 150
0.1
0.2
0.3
Gesticulation Score
BlackBlueRedGreen
(x) 2716 - 1-1
Figure 5.5: Groups 23, 24, 26 and 27
CHAPTER 5. RESULTS
45

−10 −5 0 5 10 150
0.2
0.4
0.6
Gesticulation Score
BlackBlueRedGreen
(a) 2801 - 3-4
−10 −5 0 5 10 150
0.1
0.2
0.3
0.4
Gesticulation Score
BlueRedGreen
(b) 2901 - 1-3
−10 −5 0 5 10 150
0.1
0.2
0.3
0.4
Gesticulation Score
BlackBlueRedGreen
(c) 3001 - 2-2
−10 −5 0 5 10 150
0.1
0.2
0.3
0.4
Gesticulation Score
BlackBlueRedGreen
(d) 3101 - 1-3
−10 −5 0 5 10 150
5 · 10−2
0.1
0.15
Gesticulation Score
BlackBlueRedGreen
(e) 2804 - 4-2
−10 −5 0 5 10 150
0.1
0.2
0.3
0.4
Gesticulation Score
BlueRedGreen
(f) 2904 - 1-1
−10 −5 0 5 10 150
5 · 10−2
0.1
0.15
MISSING
Gesticulation Score
Missing
(g) 3004 - MISSING
−10 −5 0 5 10 150
0.2
0.4
0.6
Gesticulation Score
BlackBlueRedGreen
(h) 3104 - 1-2
−10 −5 0 5 10 150
0.2
0.4
0.6
Gesticulation Score
BlackBlueRedGreen
(i) 2807 - 3-4
−10 −5 0 5 10 150
0.2
0.4
0.6
0.8
1
Gesticulation Score
BlueRedGreen
(j) 2907 - 1-1
−10 −5 0 5 10 150
5 · 10−2
0.1
0.15
MISSING
Gesticulation Score
Missing
(k) 3007 - MISSING
−10 −5 0 5 10 150
0.1
0.2
0.3
Gesticulation Score
BlackBlueRedGreen
(l) 3107 - 1-4
−10 −5 0 5 10 150
5 · 10−2
0.1
0.15
0.2
0.25
Gesticulation Score
BlackBlueRedGreen
(m) 2810 - 4-3
−10 −5 0 5 10 150
0.2
0.4
0.6
Gesticulation Score
BlueRedGreen
(n) 2910 - 1-1
−10 −5 0 5 10 150
5 · 10−2
0.1
0.15
MISSING
Gesticulation Score
Missing
(o) 3010 - MISSING
−10 −5 0 5 10 150
0.2
0.4
0.6
0.8
Gesticulation Score
BlackBlueRedGreen
(p) 3110 - 1-1
−10 −5 0 5 10 150
0.1
0.2
0.3
0.4
Gesticulation Score
BlackBlueRedGreen
(q) 2813 - 3-1
−10 −5 0 5 10 150
0.1
0.2
0.3
0.4
Gesticulation Score
BlueRedGreen
(r) 2913 - 1-1
−10 −5 0 5 10 150
5 · 10−2
0.1
0.15
MISSING
Gesticulation Score
Missing
(s) 3013 - MISSING
−10 −5 0 5 10 150
0.1
0.2
0.3
Gesticulation Score
BlackBlueRedGreen
(t) 3113 - 3-1
−10 −5 0 5 10 150
0.1
0.2
0.3
0.4
0.5
Gesticulation Score
BlackBlueRedGreen
(u) 2816 - 4-1
−10 −5 0 5 10 150
0.1
0.2
0.3
Gesticulation Score
BlueRedGreen
(v) 2916 - 1-2
−10 −5 0 5 10 150
5 · 10−2
0.1
0.15
MISSING
Gesticulation Score
Missing
(w) 3001 - MISSING
−10 −5 0 5 10 150
0.1
0.2
0.3
0.4
0.5
Gesticulation Score
BlackBlueRedGreen
(x) 3101 - 4-4
Figure 5.6: Groups 28, 29, 30 and 31
CHAPTER 5. RESULTS
46

CHAPTER 5. RESULTS
Table 5.1: Results T-test gesticulation score leaders versus non-leaders
Leader Non-LeaderSegment P-value M SD M SD D’
1 0.0134∗ 4.24 2.84 2.91 1.82 0.7572 0.0011∗∗ 3.94 2.43 2.38 1.53 0.7683 0.0024∗∗ 3.72 2.43 2.23 1.72 0.7074 0.0313∗ 3.42 2.38 2.31 1.84 0.5195 0.0001∗∗∗ 4.76 2.90 2.16 1.37 1.1026 0.0806 3.58 2.14 2.65 2.11 0.437
all 0.0001∗∗∗ 3.93 2.52 2.44 1.76 0.685∗p < .05, ∗∗p < .01, ∗∗∗p < .001
In order to test the performance of the gesticulation algorithm comparedto the manual validation, the TPR and the FPR are calculated. For eachsegment, the score is based on the ranked score of the gesticulation algo-rithm and the observed validation rankings. The calculation can easily bedone by plugging the data into the table, as described in Section 3.8. APearson Correlation test is performed on the same variables, to calculate thecorrelational strength. These results are shown in Table 5.2. In the table, asomehow proportional relation ship is visible between the TPR/FPR and theR-values. When there is a good TPR/FPR score, the R-score is also goodand can even be statistically significant. A visual representation in the formof a ROC is shown in Figure 5.8. The results show that all the segmentsare close together. The segments four and five have the best score, this canboth be seen on the correlation coefficient R and the TPR/FPR score inTable 5.2. This is only a performance measure of the gesticulation algorithmto the visual observation and has nothing to do with the performance onthe detection of leadership. Later on in this section, the performance of thegesticulation algorithm is shown on basis of the ground.
In a comparison of the rankings between the gesticulation algorithm andthe manual validation, the highest rank of the manual validation is comparedwith the rank based on the algorithm. The score of the rank comparisonshows that 52.34% is ranked correct on rank 1. For the second rank this is18.75 %, for the third rank this is 17.19% and 11.72% is ranked fourth.
The third question to discuss is the predictability of leadership. Thedataset from preceding psychological research is reused. After adding theresults from the new tests, a correlational overview is calculated. The resultsare shown in Table 5.3. It can be observed that the different standardizedintrospective dominance tests correlate significantly with each other. The
47

CHAPTER 5. RESULTS
0 0.1 0.2 0.3 0.4 0.5 0.6 0.7 0.8 0.9 10
0.1
0.2
0.3
0.4
0.5
0.6
0.7
0.8
0.9
1
p(False Alarm)
p(H
it)
Segment 10−refTPR/FPR
(a) Gesticulation1
0 0.1 0.2 0.3 0.4 0.5 0.6 0.7 0.8 0.9 10
0.1
0.2
0.3
0.4
0.5
0.6
0.7
0.8
0.9
1
p(False Alarm)
p(H
it)
Segment 20−refTPR/FPR
(b) Gesticulation2
0 0.1 0.2 0.3 0.4 0.5 0.6 0.7 0.8 0.9 10
0.1
0.2
0.3
0.4
0.5
0.6
0.7
0.8
0.9
1
p(False Alarm)
p(H
it)
Segment 30−refTPR/FPR
(c) Gesticulation3
0 0.1 0.2 0.3 0.4 0.5 0.6 0.7 0.8 0.9 10
0.1
0.2
0.3
0.4
0.5
0.6
0.7
0.8
0.9
1
p(False Alarm)
p(H
it)
Segment 40−refTPR/FPR
(d) Gesticulation4
0 0.1 0.2 0.3 0.4 0.5 0.6 0.7 0.8 0.9 10
0.1
0.2
0.3
0.4
0.5
0.6
0.7
0.8
0.9
1
p(False Alarm)
p(H
it)
Segment 50−refTPR/FPR
(e) Gesticulation5
0 0.1 0.2 0.3 0.4 0.5 0.6 0.7 0.8 0.9 10
0.1
0.2
0.3
0.4
0.5
0.6
0.7
0.8
0.9
1
p(False Alarm)p(
Hit)
Segment 60−refTPR/FPR
(f) Gesticulation6
0 0.1 0.2 0.3 0.4 0.5 0.6 0.7 0.8 0.9 10
0.1
0.2
0.3
0.4
0.5
0.6
0.7
0.8
0.9
1
p(False Alarm)
p(H
it)
All segments0−referenceHit All segments
(g) Gesticulation All
0 0.1 0.2 0.3 0.4 0.5 0.6 0.7 0.8 0.9 10
0.1
0.2
0.3
0.4
0.5
0.6
0.7
0.8
0.9
1
p(False Alarm)
p(H
it)
Segment 1
TPR/FPR
Segment 2TPR/FPR
Segment 3
TPR/FPRSegment 4
TPR/FPR
Segment 5TPR/FPR
Segment 6
TPR/FPRSegment All
TPR/FPR
0−Reference
(h) Gesticulation Combined
Figure 5.7: ROC Ground truth - Gesticulation score
internal rankings also correlate high with each other. For the gesticulationscores, all correlate significantly with each other, except for segment 6. Thescores of the Team Member Dominance test correlate with the internal rank-ings.
48

CHAPTER 5. RESULTS
Table 5.2: True Positive Rate, False Positive Rate and Pearsons R of therankings on basis of the gesticulation score compared to the observed scoreof the video segments.
Segment TPR FPR R1 .77 .64 .1342 .79 .57 .222∗
3 .81 .55 .261∗
4 .83 .48 .357∗∗
5 .87 .41 .469∗∗
6 .79 .57 .216ALL .81 .56Notes: ∗p < .05, ∗∗p < .01
0 0.1 0.2 0.3 0.4 0.5 0.6 0.7 0.8 0.9 10
0.1
0.2
0.3
0.4
0.5
0.6
0.7
0.8
0.9
1
p(False Alarm)
p(H
it)
Segment 1Segment 2Segment 3Segment 4Segment 5Segment 6All sements
Figure 5.8: ROC performance gesticulation algorithm with observations asbasis
As a final comparison, the hit and miss rate are calculated for the videoobservations and the gesticulation algorithm, compared to the ground-truth.The results from the psychological research are included for a completeoverview, see Table 5.4 and Figure 5.9. From Table 5.4 can be observedthat a high score is established for the Dominance Rank and Dominance
49

CHAPTER 5. RESULTS
Points. With the ground-truth as a basis, human observations score betterthan the personality questionnaires. The gesticulation algorithm scores bestof all as a measure for leadership. To interpret the values from the table,TPR is the True Positive Rate, which is the percentage of correctly identifiedcases. The FPR is the False Positive Rate, which is the percentage of falsealarms. The best performance is obviously achieved when the TRP is high(near 1.0) and the FPR is low (near 0.0). The best performance for the ges-ticulation algorithm is segment 2 and 4, here the hit rate is quite high andthe reject rate relatively low. The performance of the gesticulation algorithmis shown in a ROC in Figure 5.7. This means that leadership through thegesticulation measure is best detectable in segment 2 and 4.
0 0.1 0.2 0.3 0.4 0.5 0.6 0.7 0.8 0.9 10
0.1
0.2
0.3
0.4
0.5
0.6
0.7
0.8
0.9
1
Self EsteemResponsibilitySociable DominanceTeam Member DominanceDominance RankDominance PointsObservation 1Observation 2Observation 3Observation 4Observation 5Observation 6Gesticulation 1Gesticulation 2Gesticulation 3Gesticulation 4Gesticulation 5Gesticulation 6Average Gestirulation
Figure 5.9: Visual representation of True Positive Rate and False PositiveRate of the rankings with the internal chosen leader as basis as shown inTable 5.4
When quantifying the score of the gesticulation algorithm on basis of theground-truth, the scores are as follows. There is a 36.72% chance of scoringthe leader correct, 19.53% to score the second in the peck order correct,27.34% for rank 3 and 16.41% for rank 4. Effectively, this is an increase of11% over the random guess. The visualizations in Figure 5.1 - 5.6 show thatthe curves of rank 1 and 2, in many cases, lie real close together. Whencombining the first and second rank, more than 31% increase is established.
50

CHAPTER 5. RESULTS
Tab
le5.
3:C
orre
lati
ons
for
all
mea
sure
s.
Resp
SE
SD
TMD
Gest1
Gest2
Gest3
Gest4
Gest5
Gest6
Lpnt
Dord
Dpnt
Responsibility
1.0
.412∗∗
.322∗∗
-.223∗
.251∗
-.059
.143
.130
.034
.209
.006
-.077
-.102
SelfEsteem
.1.0
-.255∗∗
-.033
.047
-.068
-.117
-.156
-.046
.090
.007
-.051
-.078
Sociable
Dominance
..
1.0
-.178∗
.077
.047
-.042
.067
.132
.168
-.048
.017
-.046
Tea
mMem
ber
Dom
..
.1.0
-.018
.221
-.002
.018
.206
-.005
.462∗∗
.432∗∗
.483∗∗
Gesticu
lation1
..
..
1.0
.414∗∗
.554∗∗
.532∗∗
.279∗
.142
.075
.015
.015
Gesticu
lation2
..
..
.1.0
.321∗∗
.431∗∗
.457∗∗
.186
.222∗
.157
.157
Gesticu
lation3
..
..
..
1.0
.550∗∗
.323∗∗
.138
.076
.076
.015
Gesticu
lation4
..
..
..
.1.0
.357∗∗
.100
.164
.229∗
.100
Gesticu
lation5
..
..
..
..
1.0
.261∗
.076
.199
.138
Gesticu
lation6
..
..
..
..
.1.0
.015
.015
.076
Lea
dersh
ipPoints
..
..
..
..
..
1.0
.693∗∗
.816∗∗
Dominance
Ord
er.
..
..
..
..
..
1.0
.794∗∗
Dominance
Points
..
..
..
..
..
..
1.0
Notes:
∗p<.05,∗∗p<.01,∗∗
∗p<.001
51

CHAPTER 5. RESULTS
Table 5.4: True Positive Rate and False Positive Rate of the rankings withthe internal chosen leader as basis.
Questionnaire TPR FPR RSelf Esteem .74 .64 .007Responsibility .75 .68 .006Sociable Dominance .71 .77 -.048Team Member Dominance .73 .71 .462∗∗
Dominance Rank .91 .51 .693∗∗
Dominance Points .95 .12 .816∗∗
Observation TPR FPR RVideo Observation 1 .80 .68 .147Video Observation 2 .78 .57 .416∗∗
Video Observation 3 .76 .68 .199Video Observation 4 .78 .62 .421∗∗
Video Observation 5 .76 .68 .031Video Observation 6 .74 .73 .216
Video Gesticulation TPR FPR RVideo Gesticulation 1 .73 .73 .075Video Gesticulation 2 .84 .43 .222∗
Video Gesticulation 3 .79 .59 .076Video Gesticulation 4 .85 .43 .164Video Gesticulation 5 .76 .73 .076Video Gesticulation 6 .79 .57 .015
52
Chapter 6
Conclusion andRecommendation
A journey of a thousand miles begins with asingle step
Confucius
Many groups of at least two people visit public events such as a sportgame or a festival. For public safety, CCTV systems are used to monitor thecrowd. In case an intervention is required, it is advisable to address (thisto) the leader of the group (for a greater effect). To make CCTV systemsa more valuable addition to public safety, smart tools are needed. How canthe data provided by CCTV systems be used to detect leaders of a group?
Small groups of four people are formed and given a brainstorm task withlimited resources. During the execution of this task, recordings were madeby five cameras. After finishing the brainstorm session, a questionnaire wasconducted about leadership and dominance at personal and group level. Theresults of the questionnaire are used as a ground-truth for leadership. Therecordings are preprocessed, manually validated, and analyzed for the avail-ability and detectability of leadership characteristics. Movement of the armsand body, defined as gesticulation, is used as predictor for leadership in thegroup.
It is found that group leaders move more, and thus have a higher score ongesticulation, than non-leaders. The results of the questionnaire showed littlepredictive power for leadership. While the results from the manual validationshowed better predictive power. The gesticulation measure showed an evenbetter result as a predictive measure for leadership.
The results show that emerged leaders have a significant higher gesticu-
53

CHAPTER 6. CONCLUSION AND RECOMMENDATION
lation score and thus move more than non-leaders in small informal groups.This is both shown on basis of observations by humans and with the use ofthe gesticulation algorithm. From the results from the psychological ques-tionnaire can be said that the emerged leadership is context dependent. Thegroup members with a high score on questionnaire score do not automaticallyacquire the leadership position. The emerging character can for example risefrom the familiarity with the subject or the importance to complete the task.
Previous work showed that in a small group with assigned team roles,thus also the leader role compared to emerging leadership, the leader showedmore movement than non-leaders (Jayagopi et al., 2008). Another differencewas the focus of movements, in their study it was on subtile movements ofthe head, in this study it is on macro movements.
Although a practical application is not feasible yet, the results of thecurrent research, could be used to analyze CCTV footage from public eventsto increase the effectiveness of an intervention. Note that before this could beused, there are other problems that need to be tackled, for example findinga subgroup in a crowd. The results only show the person who is more likelyto be the leader in the group, this leadership can change by at a differentcontext or environment. Another issue is the increase of complexity when theproblem size increases. In the experimental setting, the groups only consistedof four people. Although the efficiency of the software was totally neglected,the results could be computed in real time. This is an important issue thatneeds to be further investigated.
In the result section is shown that based on the ground-truth, the gestic-ulation algorithm performs well in some cases. The recorded segments thatperform well are segment 2 and 4. These are the segments that occur justbefore minute 1 and minute 2 in the brainstorm session. It could be possiblethat leadership is not always visible or expressed. In the experiment, eachthird segment is analyzed and leadership is shown in two of these segments.Leadership is strongly shown in recordings 2 and 4. All participants fromthe experiment are university students, who should in general be able toperform a task individually. When the participants read or heard what theassignment was, they could start brainstorming with little guidance. At acertain point, decisions need to be made or need to be moved on to the nextstep. At theses moments, a strong sense of leadership could be shown andthis could be in segments 2 and 4.
The results show a better performance than random guess in all of therecordings that were analyzed. The gesticulation algorithm was revised twotimes, so it is questioned whether the optimal algorithm is found and used.The gesticulation algorithm takes the length of a person into account byusing normalized values. The algorithm can also handle different patterns in
54

CHAPTER 6. CONCLUSION AND RECOMMENDATION
clothing (solid color or block patterns). In order to further reduce the weightof the length parameter, the denominator in the equation could be squarerooted. Due to the quadratic relation between between the surface and theperimeter, taller people get a higher score. To remove the small irrelevantmovements, the number of frames is reduced to filter them out. It is notclear if there are some unseen factors that can increase the performance. Thiscould for example be the person its own shadow or the impact of crowdedness,where people are standing close together. In the lab setting, the people arestanding around a table and not close together. This makes it easy to observethe movements of a single person. When applying the same technique to acrowded environment, the observation of movements of a person becomes amore complex task.
It could also be questioned if the groups are formed properly. In thedesign of the experiment, it is assumed that the members within the groupsdon’t know each other and all have the same sex, nationality and mothertongue. Due to availability and time constraints, this was not feasible andconcessions had to be made. Finally, the groups consisted of a mix of theassumed properties. This could cause a bias where certain persons have ahigher chance of becoming a leader. It is shown that, in general, taller peopleare often dominant over smaller people, male over females and that age hasan influence (Van Vugt, 2006; Van Vugt et al., 2008).
From previous research it is known that leaders move more than non-leaders. This was known for subtile movements on the micro level where aclose-up of the head is analyzed. This study changed the micro movementsto macro movements, since these are better applicable in a real world setting,and showed that leaders move more than non-leaders. It was reported thatleaders have more micro movements than non-leaders, when they are assignedto a certain role. The results showed that the findings form previous researchcan be broadened to emerging leadership.
In the context of a public event, where most of the visitors come in groupswho can be classified as small informal groups, this can help to increase theeffectiveness of the security officers. When the security officer can effectivelysteer people, the threat can be reduced quickly and the atmosphere andpublic safety can be back to a comfortable level. This reduces the chance offurther escalation.
For future research, some changes can be made to increase the perfor-mance. In this research gesticulation is used as a measure to determine therank and leadership status in a group. This measure could be replaced with,for example, the number of short movements. Next to the recordings fromthe ceiling, a huge dataset of recordings is available. There are recordingsfrom the side that could be used, from here other information can be ex-
55

CHAPTER 6. CONCLUSION AND RECOMMENDATION
tracted. These allow better extraction of kinetic information about type ofmovements. Another possibility is to switch modality. Acoustic informa-tion is available from all sessions. From previous research is known that theamount of speech is a good predictor for leadership (Jayagopi et al., 2008).
This study was conducted in a lab with students who were put togetherand performed a task. This gives a nice introduction to the topic, but thestep to a real life application is far away. One of the steps in between couldbe the use of existing small groups. Colleagues from work who gather afterwork, or members from a football team that go for a run outside traininghours. How would these ‘real’ small informal groups perform on the sametask as the students did? Or how do they behave when they are together asa group.
Enjoying a life performance of your favorite band at a festival, watchingyour favorite sport club win the cup, this are two examples of events thatyou want to enjoy in peace. Disturbance of these events reduces the pleasureand gives it a bitter taste. With the ubiquity of CCTV cameras, big brotheris watching you, big brother is protecting you. Gesticulation shows somepromising results and can be a useful addition to ensure our beloved publicsafety.
56

Chapter 7
Acknowledgments
Leadership is unlocking peoples potential tobecome better.
Bill Bradley
Here I wish to thank various people for their contribution to this project.Without them, this thesis could not be established;Raymond Veldhuis I would like to express my appreciations to RaymondVeldhuis, my first and daily supervisor, for the supervision, suggestions andsparring sessions. It was always a joy for me, working under your supervisionon the various subjects. Over the past years I have learned a lot from you.The first course in Biometrics where we identified people by their hearts, themeta analysis on the prevalence of PII in biometrics and this final project.Peter de Vries Special thanks go to my second supervisor Peter de Vries.It was always a joy to come to our meetings and discuss the various obstacleswe met along the way.Staff Support The technical support from Henny Kuipers and Geert JanLaanstra was excellent, more than welcome and deeply appreciated.Alfred de Vries Support for recording the sessions in the lab.Sparring partners I hope you guys enjoined the sparring sessions as muchas I did, they were extremely useful for this study.Participants Thanks for participation, without you there was nothing toanalyze.Jessica Heijmans Special thanks for all your support, questions and help.My family Thank you so much for all those years of unconditional support,love and confidence in succeeding. It is questionable if the results were thesame without you.
57

References CHAPTER 7. ACKNOWLEDGMENTS
References
Anderson, C., & Kilduff, G. J. (2009, February). Why do dominant personal-ities attain influence in face-to-face groups? The competence-signalingeffects of trait dominance. Journal of Personality and Social Psychol-ogy , 96 (2), 491–503. doi: 10.1037/a0014201
Andrews, P. H. (1984). Performance self-steem, and perceptions of lead-ership emergence: A comparative study of men and women. West-ern Journal of Speech Communication, 48 (1), 1-13. doi: 10.1080/10570318409374137
Ashby, S., Bourban, S., Carletta, J., Flynn, M., Guillemot, M., Hain, T., . . .Wellner, P. (2005). The ami meeting corpus: A pre-announcement.In Workshop on multimodal interaction and related machine learningalgorithms (mlmi) (p. 4).
Bales, R. F. (1953). The equilibrium problem in small groups (R. F. Bales& A. E. Shils, Eds.). T. Parsons.
Bass, B. M. (1954). The leaderless group discussion. Psychological Bulletin,51 (5), 465 - 492.
Boom, B. J. (2010). Face recognition’s grand challenge: uncontrolled con-ditions under control. Unpublished doctoral dissertation, University ofTwente, Enschede. http://eprints.eemcs.utwente.nl/19351/.
Bovik, A. (2005). Handbook of image and video processing. Academy Press.Burghouts, G., de Penning, L., Kruithof, M., Hanckmann, P., ten Hove, J.,
Landsmeer, S., . . . others (2013). A search engine for retrieval andinspection of events with 48 human actions in realistic videos.
Buss, D. M., & Craik, K. H. (1980). The frequency concept of disposition:dominance and prototypically dominant acts1. Journal of Personality ,48 (3), 379–392. doi: 10.1111/j.1467-6494.1980.tb00840.x
Carney, D., Hall, J., & LeBeau, L. (2005). Beliefs about the nonverbalexpression of social power. Journal of Nonverbal Behavior , 29 (2), 105-123. doi: 10.1007/s10919-005-2743-z
Cartwright, D., & Zander, A. (1968). Group dynamics: research and theory.Harper & Row.
CNN Sports, I. (2001, may). Cnnsi.com - soccer - major stadium disas-ters. Retrieved from http://sportsillustrated.cnn.com/soccer/
world/news/2000/07/09/stadium disasters ap/
Cohen, J. (1988). Statistical power analysis for the behavioral sciencies.Lawrence Erlbaum Associates, Incorporated.
Costanzo, F. S., Markel, N. N., & Costanzo, P. R. (1969). Voice quality pro-file and perceived emotion. Journal of Counseling Psychology , 16 (3),267 - 270.
58

CHAPTER 7. ACKNOWLEDGMENTS References
Cote, S., Lopes, P. N., Salovey, P., & Miners, C. T. (2010). Emotionalintelligence and leadership emergence in small groups. The LeadershipQuarterly , 21 (3), 496 - 508. doi: 10.1016/j.leaqua.2010.03.012
Coulson, M. (2004). Attributing emotion to static body postures: Recogni-tion accuracy, confusions, and viewpoint dependence. Journal of Non-verbal Behavior , 28 (2), 117-139.
Derksen, J., & de Mey, H. (1997). Mmpi-2 - minnesota multiphasic person-ality inventory -2. Pen Tests Publishers.
Dovidio, J. F., & Ellyson, S. L. (1982). Decoding visual dominance: Attribu-tions of power based on relative percentages of looking while speakingand looking while listening. Social Psychology Quarterly , 45 (2), pp.106-113.
Dunbar, N. E., & Burgoon, J. K. (2005). Perceptions of power and interac-tional dominance in interpersonal relationships. Journal of Social andPersonal Relationships , 22 (2), 207-233.
Exline, R. V., Ellyson, S. L., & Long, B. (1975). Visual behavior as an aspectof power role relationships. In Pliner (Ed.), Nonverbal communicationof aggression (pp. 21–52). New York: Plenum.
Ge, W., Collins, R., & Ruback, B. (2009, dec.). Automatically detectingthe small group structure of a crowd. In Applications of computervision (wacv), 2009 workshop on (p. 1 -8). doi: 10.1109/WACV.2009.5403123
Hall, J., Coats, E., & LeBeau, L. (2005, 11). Nonverbal behavior and thevertical dimension of social relations: a meta-analysis. Psychologicalbulletin, 131 (6).
Haslam, S. A., Reicher, S., & Platow, M. (2011). The new psychology of lead-ership : identity, influence, and power. Hove, East Sussex [England];New York: Psychology Press.
Hathaway, S., McKinley, J., & Committee, M. R. (1989). Mmpi-2: Minnesotamultiphasic personality inventory-2 : manual for administration andscoring. University of Minnesota Press.
Helbing, D., & Johansson, A. (2009). Pedestrian, crowd and evacuationdynamics. In Encyclopedia of complexity and systems science (p. 6476-6495).
Hijum, v., H. (2011). Handreiking evenementenveiligheid delen i en ii, deprocessen geordend.
Hogg, M. A., Fielding, K. S., Johnson, D., Masser, B., Russell, E., & Svens-son, A. (2006). Demographic category membership and leadership insmall groups: A social identity analysis. The Leadership Quarterly ,17 (4), 335 - 350. doi: 10.1016/j.leaqua.2006.04.007
Huang, T., Yang, G., & Tang, G. (1979, feb). A fast two-dimensional me-
59

References CHAPTER 7. ACKNOWLEDGMENTS
dian filtering algorithm. Acoustics, Speech and Signal Processing, IEEETransactions on, 27 (1), 13 - 18. doi: 10.1109/TASSP.1979.1163188
Hughes, R. L. (2003). The flow of human crowds. Annual Review of Fluid Me-chanics , 35 (1), 169-182. doi: 10.1146/annurev.fluid.35.101101.161136
Hung, H., & Gatica-Perez, D. (2010, oct.). Estimating cohesion in smallgroups using audio-visual nonverbal behavior. Multimedia, IEEETransactions on, 12 (6), 563 -575. doi: 10.1109/TMM.2010.2055233
Hung, H., Jayagopi, D. B., Ba, S., Odobez, J.-M., & Gatica-Perez, D. (2008).Investigating automatic dominance estimation in groups from visualattention and speaking activity. In Proceedings of the 10th internationalconference on multimodal interfaces (pp. 233–236). New York, NY,USA: ACM.
Hunt, R. (2005). The reproduction of colour. Wiley.Jayagopi, D. B., Ba, S., Odobez, J.-M., & Gatica-Perez, D. (2008). Predicting
two facets of social verticality in meetings from five-minute time slicesand nonverbal cues. In Proceedings of the 10th international conferenceon multimodal interfaces (pp. 45–52). New York, NY, USA: ACM. doi:10.1145/1452392.1452403
Johnson, N. R. (1987). Panic at the who concert stampede: An empiricalassessment. National Emergency Training Center.
Judge, T. A., Bono, J. E., Ilies, R., & Gerhardt, M. W. (2002, August).Personality and leadership: a qualitative and quantitative review. TheJournal of applied psychology , 87 (4), 765–780.
Kalma, A. P., Visser, L., & Peeters, A. (1993). Sociable and aggressivedominance: Personality differences in leadership style? The LeadershipQuarterly , 4 (1), 45 - 64. doi: 10.1016/1048-9843(93)90003-C
Kimble, C. E., Forte, R. A., & Yoshikawa, J. C. (1981). Nonverbal concomi-tants of enacted emotional intensity and positivity: Visual and vocalbehavior1. Journal of Personality , 49 (3), 271–283.
Kimble, C. E., & Musgrove, J. I. (1988). Dominance in arguing mixed-sexdyads: Visual dominance patterns, talking time, and speech loudness.Journal of Research in Personality , 22 (1), 1 - 16. doi: 10.1016/0092-6566(88)90021-9
Kline, P. (2000). The handbook of psychological testing. Taylor & FrancisGroup.
Knutson, B. (1996). Facial expressions of emotion influence interpersonaltrait inferences. Journal of Nonverbal Behavior , 20 (3), 165-182. doi:10.1007/BF02281954
Lance, B., & Marsella, S. (2007). Emotionally expressive head and bodymovement during gaze shifts. In C. Pelachaud, J.-C. Martin, E. Andre,G. Chollet, K. Karpouzis, & D. Pele (Eds.), Intelligent virtual agents
60

CHAPTER 7. ACKNOWLEDGMENTS References
(Vol. 4722, p. 72-85). Springer Berlin Heidelberg.Langston, P. A., Masling, R., & Asmar, B. N. (2006). Crowd dynamics
discrete element multi-circle model. Safety Science, 44 (5), 395 - 417.doi: 10.1016/j.ssci.2005.11.007
Lee, R. S., & Hughes, R. L. (2006). Prediction of human crowd pressures.Accident Analysis & Prevention, 38 (4), 712 - 722. doi: 10.1016/j.aap.2006.01.001
Lefter, I., Burghouts, G., & Rothkrantz, L. J. M. (2012). Automatic audio-visual fusion for aggression detection using meta-information. In Ad-vanced video and signal-based surveillance (avss), 2012 ieee ninth in-ternational conference on (p. 19-24).
Lefter, I., Rothkrantz, L., Burghouts, G., Yang, Z., & Wiggers, P. (2011).Addressing multimodality in overt aggression detection. In Text, speechand dialogue (Vol. 6836, p. 25-32). Springer Berlin Heidelberg.
Luteijn, F., Starren, J., & van Dijk, H. (2000). Tweede heziene npv handlei-ding. Swets en Zeitlinger.
Manusov, V. (2005). The sourcebook of nonverbal measures: Going beyondwords. Lawrence Erlbaum. Retrieved from http://books.google.nl/
books?id=1I8Y\ AvrjvEC
Mast, M. S. (2002). Dominance as expressed and inferred through speakingtime. Human Communication Research, 28 (3), 420–450.
Mazur, A., & Mueller, U. (1996). Facial dominance. London, JAI Press.McEllistrem, J. E. (2004). Affective and predatory violence: A bimodal
classification system of human aggression and violence. Aggression andViolent Behavior , 10 (1), 1 - 30.
Mignault, A., & Chaudhuri, A. (2003, June 1). The Many Faces of a NeutralFace: Head Tilt and Perception of Dominance and Emotion. Journalof Nonverbal Behavior , 27 (2), 111–132.
Mullen, B., Salas, E., & Driskell, J. E. (1989). Salience, motivation, andartifact as contributions to the relation between participation rate andleadership. Journal of Experimental Social Psychology , 25 (6), 545 -559. doi: 10.1016/0022-1031(89)90005-X
Northouse, P. (2009). Leadership: Theory and practice. SAGE Publications.Ridgeway, C. L. (1987). Nonverbal behavior, dominance, and the basis of
status in task groups. American Sociological Review , 52 (5), pp. 683-694.
Sanchez-Cortes, D., Aran, O., Mast, M. S., & Gatica-Perez, D. (2010).Identifying emergent leadership in small groups using nonverbal com-municative cues. In International conference on multimodal interfacesand the workshop on machine learning for multimodal interaction (pp.39:1–39:4). New York, NY, USA: ACM. doi: 10.1145/1891903.1891953
61

References CHAPTER 7. ACKNOWLEDGMENTS
Shang, J., Liu, Y., & Fu, X. (2008). Dominance modulates the effects of eyegaze on the perception of threatening facial expressions. In Automaticface gesture recognition, 2008. fg ’08. 8th ieee international conferenceon (p. 1-6).
Sherif, M., Sherif, C., & Murphy, G. (1956). An outline of social psychology.Harper.
Simpson, A. J., & Fitter, M. J. (1973). What is the best index of detectabil-ity?. Psychological Bulletin, 80 (6), 481 - 488.
Smith, A., James, C., Jones, R., Langston, P., Lester, E., & Drury, J. (2009).Modelling contra-flow in crowd dynamics dem simulation. Safety Sci-ence, 47 (3), 395 - 404. doi: 10.1016/j.ssci.2008.05.006
Smith-Lovin, L., & Brody, C. (1989). Interruptions in group discussions:The effects of gender and group composition. American SociologicalReview , 54 (3), pp. 424-435.
Swets, J. A. (1986a). Form of empirical rocs in discrimination and diag-nostic tasks: Implications for theory and measurement of performance.Psychological Bulletin, 99 (2), 181 - 198.
Swets, J. A. (1986b). Indices of discrimination or diagnostic accuracy: Theirrocs and implied models. Psychological Bulletin, 99 (1), 100 - 117.
Van Vugt, M. (2006). Evolutionary origins of leadership and followership.Personality and Social Psychology Review , 10 (4), 354-371.
Van Vugt, M., Hogan, R., & Kaiser, R. B. (2008). Leadership, followership,and evolution: Some lessons from the past. American Psychologist ,63 (3), 182 - 196. doi: 10.1037/0003-066X.63.3.182
Vroom, V., & Jago, A. (2007).Am Psychol , 62 (1), 17-24; discussion 43–7.
Wei, Y., Guo, Y., Dong, D., & Li, D. (2012). Public places safety manage-ment evaluation of railway stations. Procedia Engineering , 45 (0), 240 -247. (2012 International Symposium on Safety Science and Technology)doi: 10.1016/j.proeng.2012.08.151
Weisfeld, G., & Beresford, J. (1982). Erectness of posture as an indicatorof dominance or success in humans. Motivation and Emotion, 6 (2),113-131. doi: 10.1007/BF00992459
Wiggins, J. S. (1979, March). A psychological taxonomy of trait-descriptiveterms: The interpersonal domain. Journal of Personality and SocialPsychology , 37 (3), 395–412.
Zweig, M. H., & Campbell, G. (1993). Receiver-operating characteristic(roc) plots: a fundamental evaluation tool in clinical medicine. ClinicalChemistry , 39 (4), 561-77.
62

Appendix A
Documents
ContentsA.1 Informed Consent . . . . . . . . . . . . . . . . . . 64
A.2 Experiment Desription . . . . . . . . . . . . . . . 65
63

A.1. INFORMED CONSENT APPENDIX A. DOCUMENTS
A.1 Informed Consent
Informed Consent
Bij dezen geef ik toestemming voor het maken van video en audio opna-mes van mijn gedrag tijdens dit experiment. De gemaakte opnames zullenuitsluitend gebruikt worden voor wetenschappenlijkonderzoek en zullen nietbuiten de Universiteit Twente gedistribueerd worden.
Alle gegevens zullen anoniem verwerkt worden, samengevoegd met die vanandere proefpersonen, aan statistische analyses onderworpen en eventueelgebruikt in wetenschappelijke publicaties. Na het ondertekenen van het con-sent zal ik tijdens het gehele onderzoek mijn volledige medewerking verlenenen mij volledig inzetten ten behoeve van het onderzoek.
Het is voor het huidige onderzoek noodzakelijk dat je de opzet en inhoudvan het onderzoek niet bekend maakt aan medestudenten die nog willendeelnemen. We gaan er vanuit dat je je hieraan houdt.
Alvast bedankt voor je medewerking.
64

APPENDIX A. DOCUMENTS A.2. EXPERIMENT DESRIPTION
A.2 Experiment Desription
Experiment DescriptionCerebral Paresis is an umbrella term for a group of disorders which result in adisorder of posture and or motor function. This is due to a permanent abnor-mality in the brain, caused in the first year of life. The prevalence of CerebralParesis is two till three occurrences per 1000 children, twice as much compared toDown Syndrome. Cerebral Paresis is the most common motor deficiency in earlychildhood. One of the symptoms of Cerebral Paresis is an above average muscletension in the hand and arm (Cans, 2000).
Unfortunately, Cerebral Paresis can not be healed, but surgery and therapy canhelp to improve the abilities of the patients. The so-called modified ConstraintInduced Movement Therapy (mCIMT) makes uses of the training joints in thearms and hands (Gordon, Charles, & Wolf, 2005). This therapy focusses on threetypes of movements:
• Dorsal flexion in the wrist (move the back of the hand to the arm).
• Pincer grasp (pick things up between you thumb and index finger).
• Supination and Pronation (rotate the the hand).
(a) Dorsal flexion (b) Pincer grasp (c) Supination
Figure 1: Training movements
65

A.2. EXPERIMENT DESRIPTION APPENDIX A. DOCUMENTS
Although this therapy is e↵ective, a lot of repetitions in an exercise is not stimu-lating for children and a negative attitude can be developed against the treatment.For motivational purposes, the use of games can be used to make the treatmentmore interesting and pleasant for children.
The objective is develop at least two games that are suitable for children inthe age category 7-10 years. These games should train the movements that fit thetreatment of Cerebral Paresis, as show in Figure 1. The duration of this session is30 minutes. Five minutes before the end I’ll notice you with a buzzer. At the endof this session one of you has to give a short presentation of the games/findings.This presentation, should per game at least include why this game fits the treat-ment, why this game is preferred over the normal treatment, the materials thatare needed to play this game. You can use the big paper to make some kind ofa presentation and visualise your ideas. The duration of the presentation shouldnot take longer than 2 or 3 minutes.
Good luck
References
Cans, C. (2000). Surveillance of cerebral palsy in europe: a collaboration of cere-bral palsy surveys and registers. Developmental Medicine & Child Neurology ,42 (12), 816–824.
Gordon, A. M., Charles, J., & Wolf, S. L. (2005). Methods of constraint-inducedmovement therapy for children with hemiplegic cerebral palsy: Develop-ment of a child-friendly intervention for improving upper-extremity function.Archives of Physical Medicine and Rehabilitation, 86 (4), 837 - 844.
66