Detection of diabetic retinopathy lesions in color retinal ...keerthiram/keerthi-thesis-ch1.pdf ·...
24
Detection of diabetic retinopathy lesions in color retinal images Thesis submitted in partial fulfillment of the requirements for the degree of Master of Science (by Research) in Computer Science by Keerthi Ram 200607013 keerthiram @ research.iiit.ac.in Centre for Visual Information Technology International Institute of Information Technology Hyderabad - 500 032, INDIA December 2009
-
Upload
truongtuyen -
Category
Documents
-
view
215 -
download
0
Transcript of Detection of diabetic retinopathy lesions in color retinal ...keerthiram/keerthi-thesis-ch1.pdf ·...

Detection of diabetic retinopathy lesions in color retinalimages
Thesis submitted in partial fulfillment
of the requirements for the degree of
Master of Science (by Research)
in
Computer Science
by
Keerthi Ram
200607013keerthiram @ research.iiit.ac.in
Centre for Visual Information Technology
International Institute of Information Technology
Hyderabad - 500 032, INDIA
December 2009

International Institute of Information Technology
Hyderabad, India
CERTIFICATE
It is certified that the work contained in this thesis, titled“Detection of diabetic retinopathy lesions in
color retinal images” by Keerthi Ram, has been carried out under my supervision and is not submitted
elsewhere for a degree.
Date Adviser: Prof. Jayanthi Sivaswamy

to Lord Muruga and all my Gurus

Acknowledgments
This thesis is but a humble river, whose tributaries and formative springs span an intelligentsia of
admirable brilliance. Foremost is my supervisor Dr.Jayanthi, whose sincerety, openness to inspiration,
and whose capability to rise to the test, are traits worthy ofemulative attempt. I have gained many a life
lesson from her, on topics ranging from credibility to enthusiasm, punctuality to objective criticism –
lessons which I am still trying to satisfactorily imbibe, and am indebted to humanity in my execution.
Much inspiration came in subtle forms, through many a cordial interaction, with my peers, my lab-
mates, my teachers, my close friends, and totally unknown friendly people. A lot of appreciation is due
to my wonderful teachers at IIIT-H, stellar enrapturing performers of a mystic and enviable art. It is but
natural for a glossy-eyed witness such as me to wish to rise, to improve and to excel, when amidst them.
If this thesis ever amounts to anything more than a scientist’s dissertation, it is symptomatic evidence
of the charm of my teachers (school days onward), the faith ofmy well-wishers, the sheer attraction of
”the Work”, and the existential tautology of questions worthy of research in my chosen Field. I here
refrain from naming all the exceptional individuals who have played a role, to any noticeable extent, in
my thought process and my work. I shall, by way of gratitude, avail myself of their continued contact
and inspiration, and be for them an ever-yielding well of friendship and trust.
Subtle memories of thanks unsaid, appreciations withheld,gratitude unshown,
Krishna! bless me that my smile convey all these- ssk
iv
Chapter 1
Introduction
In medical diagnosis, images are a source of in-vivo, painless observations that are visually analyzed.
Complex imaging modalities are deployed in medical diagnosis and planning owing to the clinical value
of visual information. Practioners and clinicians are trained to make decisions based on perceptible cues
visually obtainable from medical images.
Images form the key information source in some medical decisions, the illustrative case taken up
being non-proliferative diabetic retinopathy. In some applications, visual information is the only source
of observations - brain FMRI for instance. It may even be the case that the information sought is per-
ceivable only in visual information - lung nodules in MR images, for example, present strong likelihood
of developing tuberculosis. This chapter introduces the problem of object detection in medical images,
formulates a general image detector, and discusses about retinal images and diabetic retinopathy. The
thesis develops analysis algorithms for color retinal images to perform automated detection of indicative
lesions of diabetic retinopathy.
1.1 Object detection in images
Detection of objects in images is one example of an image understanding task. The object has a
known visual manifestation, which is searched in the image.Manual search becomes a tedious task as
the field of view increases. When accuracy, speed and unbiased detection are the requirements, the task
calls for automation.
The object detection task can be considered as the first high-level abstraction of visual information.
Higher abstraction tasks built upon object detection are object categorization and object identification
[Ponce 06]. The detection task consists of localizing instances of the target object as projected on
images. The challenge lies in constructing a detector that performs to stringent requirements of accuracy
necessitated by the application.
Object detection is helpful in clinical decision-making. The object to detect could be disease-
indicative lesions, hemorrhages, tumors, anatomic structures, or interesting patterns. In the case of
diabetic retinopathy, initial stages of the disease are characterized on the retinal photograph by ’dot’
1

lesions . The extent of affliction is indicated by the count ofthe lesions, and their locality. Object de-
tection can provide quantitative information in each of these situations. The clinical decision-making
process can be augmented by automatically analyzing visualinformation and transforming it into a
presentable and measurable form. The information yielded could be useful in deciding the treatment,
planning surgery, and for tracking progress.
1.1.1 The detection task
Detection in images is a task of finding the locality of a target object in a given image. In order to find
instances of the target, a detector may invoke knowledge of the prototypical appearance of the target.
The prototypes of the target are expressed ascharacteristic patterns, which are points in a measurement
space or “feature-space”. A metric is defined in the feature space to quantify the proximity of candidate
samples to the known prototypes. The value of the metric helps to decide whether an observation is that
of a target or not.
The locality andnumber of occurrence of the characteristic patterns may be directly utilized in
deriving descriptive information aboutthe state of Nature. For instance, in retinal image analysis, the
spatial proximity of exudative lipids to the macula is an indicator of the criticality of non-proliferative
diabetic retinopathy[Das 06]. Accurate localization of characteristic patterns may also be beneficial in
improving precision of treatment and attentive care. Exhaustive localization of every instance of the
target is laborious when performed manually, hence the taskof object detection in medical images is of
significance, and amenable to computer automation.
This chapter gives a general formulation of object detection in images, performance criteria neces-
sitated by medical image analysis, and introduces diabeticretinopathy, the illustrative case taken up for
this thesis. Also presented here is a dichotomy of the popular approaches for detection in the art.
1.1.2 Formulation
Define animage detectoras a detector that localizes a specific target object in the given imageI. Let
I be decomposable into sub-imagesIi in such a manner that in eachIi, the two possible states of Nature
are ‘target present’ (ω1) and ‘target absent’ (ω0).
The general definition of detection is estimation of the current state of Nature, from among a finite
set of possible states. Each prevailing state of Nature establishes a behaviour which may be observable.
Considering the example of weather, defining the states of Nature as one ofrainy, sunny, cloudy,
a meteorologicalobservationis a sample ofmeasurementsgoverned by the prevailing state of Nature,
and detection involves estimating the state of Nature givena meteorological observation.
In terms of the observations, each state of Nature corresponds to a causal factor or distribution of
observation probabilities, and detection involves estimating the source distribution for an observation.
2

If Ω is the state of Nature to be detected, define a hypothesisH0 : Ω = ω0, the null hypothesis, or
the hypothesis which declares target to be absent, andH1 : Ω = ω1 as the alternative hypothesis, which
declares target to be present inIi.
The detector is then regarded as the tupleD = (S,P,Γ) whereS is a set of characteristic patterns
known to be exhibited by the target object,P is a function which partitions inputI into sub-imagesIi,
andΓ = γi is a set of decision tests for eachIi to decide between the two states of Nature. Each test
γi is of the form
γi(Ii) ≷H1
H00 (1.1)
accepting one among the two hypotheses, atIi.
The members of setS are governed by the representation chosen to depict the target object. One
method of providingS is inductive learning, by giving a set of training samplesY , which are sub-images
with the state of Nature labeled as “target present” by a domain expert. In the absence of such training,
data analysis techniques may be used to obtain the characteristic patterns. This is further elaborated in
Section 1.3.
The partition functionP may act such that the partitionsIi are of varying size and overlapping. This
makes it possible to have combinatorial ways of partitioning I, among which those patition functions
which do not fragment the target are of interest.
Thus the detectorD consists of(S,P,Γ), and given an imageI, outputs
Ψ = ψ|γψ(Iψ) > 0 ⊂ i, (1.2)
the indices of the sub-images in which the target object is posited to be present (called thepositives).
Design of a detector involves modeling the training subimagesY , obtaining the optimal partition func-
tion P and establishing the decision testsΓ. These elements are designed such that the detector meets
some optimality criteria, elaborated next.
1.2 Performance characteristics
The performance of detectors is measured by two kinds of errors possible in the detection task:false
alarmsandmisses. The nature of the deployment governs the performance requirement for detectors.
For instance, if deployed in a screening scenario where a decision about the normalcy of the subject
is to be made automatically, the system is expected to filter out normal cases (which are expected to
constitute a majority) and earmark those cases with high probability of being abnormal, for manual
analysis by experts. In this application, the detector is calibrated such that false alarm rate does not
exceed a certain value (typically 1-4 false alarms per image[Abramoff 08] ). If the detector is used in
treatment planning or tracking, and provides visual outputto the clinician, the hit-rate (complement of
miss-rate) is expected to be very high (typically above 80%).
3

The performance of a given detectorD is ascertained by observing its outputΨ for a set of known
images - images where the “truth” is known about the localityof the target objects (denoteΨ∗).
An accurate detector is one whose output closely matchesΨ∗. Comparison ofΨ andΨ∗ involves
two sets defined here. A matchTP is found as the set of one-to-one correspondences betweenΨ and
Ψ∗. TP is the set oftrue positives. The setFP = Ψ − TP are thefalse positives.
The following relation can be stated about the setsΨ∗, TP andFP :
0 ≤ |TP | ≤ |Ψ∗|, or 0 ≤|TP |
|Ψ∗|≤ 1 (1.3)
For a single image1, thesensitivityof the detector is defined ass = |TP ||Ψ∗| . Sensitivity is the power of
the detector to acceptH1 when target is actually present (Ω = ω1), expressed as a percent value. Other
names for sensitivity aretrue positive fraction, detection rate, hit rate2, andrecall.
High sensitivity is achieved even whenH1 is accepted indiscriminately, irrespective ofΩ (i.e.,Ψ ≈
i). It is desirable thatΨ → TP , orFP → ∅.
Over a dataset,s and average|FP | are the two metrics to quantify a detector. Detector design is
hence an unconstrained minimization of(1− s) and|FP |. Since detector design involves identification
of decision testsΓ and the suitable partition functionP , the process in essence is a minimization of
functionals.
In practical applications however, requirements are set onthe tolerable number of false alarms (τ ),
in which case detector design is a constrained optimizationof s subject to|FP | ≤ τ (the classical
Neyman-Pearson task).
1.2.1 Detector design outline
The design of the image detector requires specification of the components below:
• S the set of characteristic patterns. S consists of appearance rules and sample feature vectors
characterizing the target. The rules are captured in implicit form (embedded in the detector logic)
or explicit form (rule-based knowledge system). In the typical situation, samples are created of
subimages with target (independent ofΨ∗ the evaluation set), called the training set.
• P the partition function . P is specified considering the variations in scale of the inputimage,
and the size of the target.
• Γ the set of tests. Γ is designed for each variant of the characteristic patterns.
• Ψ∗ the evaluation set.
1For a dataset ofn images, sensitivity over the datasets = P
n
i=1|TP |i/
P
n
i=1|Ψ∗|i
2The quantity1 − s is called the miss rate
4

1.2.2 Assumptions
The formulation above transforms the problem of detection into one of decision, and poses detector
design as an optimization of some objectives. But the solution depends on the correctness ofS. The
detector has a fundamental dependence onS, and so good representative patterns are assumed to be
made available to the detector.
The performance of the detector also relies on adequate coverage of the search space by the partition
functionP . Scale normalization of the input image should also be accounted for in the logic ofP .
The evaluation setΨ∗ should be dependable and the set size statistically significant, since the detector
is evaluated based on it.
1.3 Solution strategies
The formulation in Section 1.1.2 highlighted the key components of the image detector. This section
relates some prominent solutions in the literature to computational methods of realizing the described
components.
The state of Art in general image detection can be categorized into two approaches:learning-based,
andunsupervised data analysis-based. While the former approach transforms the optimization above
into optimization of equivalent criteria, the latter exercises greater emphasis on domain and application
knowledge in order to perform the task.
1.3.1 Learning-based approach
Target detection can be posed as a classification between ‘Target’ and ‘Non-target’, using training
samples describing the target only. The problem is pertinent to outlier detection, and the taxonomy of
[Hodge 04] names it as single-class classification or outlier detection ofType-3. Detection is viewed as
single-class classification since, for a given representation of S, ‘non-target’ is not rigorously defined
and may encompass any number of classes based on the representation ofS.
Several techniques [C.Papageorgiou 98] [Viola 01] [Dalal 05] solve the single-class problem through
binary classification, considering a carefully selected, normalized sample set of the target instances and
a “clutter” set populated by random selection of numerous partitions from several images known to not
contain any instance of the target. The boot-strapping training method was used by [kay Sung 98], to
accumulate negative training samples (the false alarms in training images devoid of the target), itera-
tively modifying the decision surface until satisfactory discrimination is achieved over a disjoint test set
of images.
The optimization criterion in the formulation above is transformed by the type of classifier chosen.
For instance, a Fisher discriminant classifier [Duda 00]maximizesinter-class distance while minimizing
intra-class scatter. The SVM classifier [Burges 98]maximizesthe margin of separation between the
5
optimal hyperplane and the labeled samples. A feed-forwardneural network classifier performs a least-
squares minimization of training residuals. A classifier when applied to the detection problem, finds the
set of decision testsΓ which best separate the training samples as target and non-target.
It can be stated thatthe correctness of the binary classifier decision surface ensures low false positive
rate (|FP |/|Ψ|) and low miss rate(1 − s)
Let y = g(x) be the obtained decision hyperplane equation corresponding to the separating boundary
of the two classesω1 andω0, with x the multivariate random variable corresponding to the feature
measurements.g is obtained by the process of classifier design based on labeled training samples. Let
g(x) be the true decision hyperplane (assuming that it exists).
The decision test provided by this hyperplaneg is: if y > 0 declarex to be inω1, else declare to be
in ω0.
Givenx∗ the observations at subimagesΨ∗ of the ground truth, andl∗ their labels, with elements of
l∗ ∈ 1,−1, Considerx∗p, x∗
n, such thatx∗p ∪ x
∗n = x
∗ and
g(x* ) =
1 if x∗ ∈ x
∗p
−1 if x∗ ∈ x
∗n
Then, a particular evaluation samplexi ∈ x∗ with label li is classified wrongly byg if
g(xi)g(xi) < 0 , or li.g(xi) < 0 (1.4)
If ω1 corresponds to the state of Nature accepting the alternative hypothesis (target present), then
|FP | = |xi ∈ x∗n ; g(xi) > 0|, and|TP | = |xi ∈ x
∗p ; g(xi) > 0|
A correct classifierg tends to the hyperplaneg as good training samples are provided. This means
thatg separatesx∗p andx∗n. A correct classifier thus yields maximum|TP |, the number of true-positives,
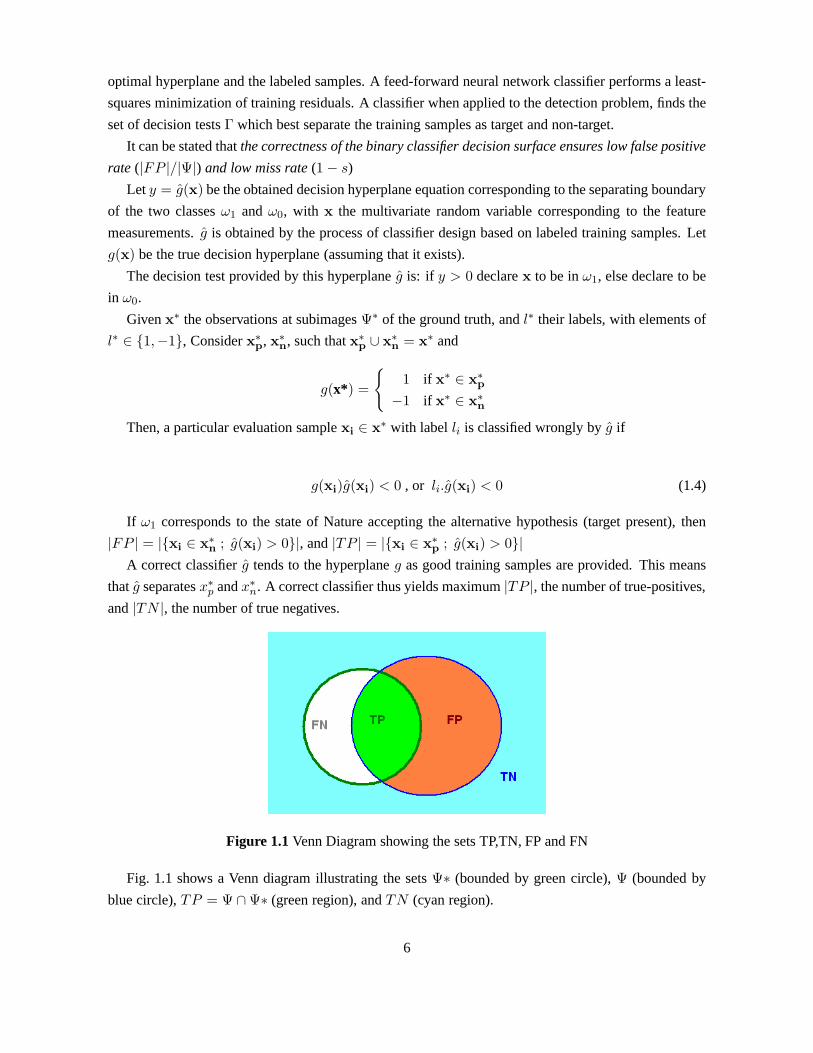
and|TN |, the number of true negatives.
Figure 1.1Venn Diagram showing the sets TP,TN, FP and FN
Fig. 1.1 shows a Venn diagram illustrating the setsΨ∗ (bounded by green circle),Ψ (bounded by
blue circle),TP = Ψ ∩ Ψ∗ (green region), andTN (cyan region).
6

The classifier is capable of manipulatingΨ (blue circle) in order to achieve maximum|TP | and
maximum|TN |. SinceTN is disjoint ofΨ∗, from the Venn diagram it can be seen that maximizing
|TN | results in minimizing|FP |.
Hence for a fixed evaluation set of size|Ψ|, a correct classifier maximizess = |TP |/|Ψ| and mini-
mizes|FP |.
The essential theme of the learning-based approach may be summarized as statistical inference :
select a system thatbestmodels the target, based upon statistical evidence provided in the form of
labeled samples. Unlike this approach, the following paradigm does not directly perform an explicit
optimization, and relies more on domain knowledge, heuristics, assumptions and constraints.
1.3.2 Unsupervised data analysis-based approach
The data analysis driven approach consists of techniques such as normalized template matching, den-
sity estimation methods (including maximum aposteriori techniques such as random-field modeling),
thresholding and clustering. Feature detectors such as edge detectors [D.Marr 80] [Canny 86], blob de-
tectors, corner detectors [Harris 88], boundary and primalsketches [Asada 86] [Brady 85] [Haralick 83]
were the earliest to use this approach.
Initial work on object detection used template matching [M.Betke 95] [A.Yuille 92], applying nor-
malized correlation techniques and deformable templates to perform tasks such as detection of faces,
pedestrians, cars and road signs. In the case of retinal images, unsupervised techniques have been used
to detect various anatomical structures such as the vasculature [Garg 07] [Frangi 98], macula, optic
disk [Singh 08] , vessel junctions [Ram 09], bright and dark lesions [Sinthanayothin 02] [Huang 05]
[Bhalerao 08].
This approach relies on the factors, assumptions and model considered by the algorithm developer.
The problem is generally harder than the learning-based approach. The template or the model provides a
representation of the object, and is hence expected to be versatile as well as discriminative. Techniques
under this approach include significant amount of prior information and domain knowledge, constraints,
heuristics and assumptions. The learning based approachesyielded better results, partly because they
were developed later, but mainly because it relies less on assumptions over the input and enjoys greater
flexibility in representation.
This approach is suitable when samples are not straightforward to get or operate on (especially with
reference to the partition functionP ). It is also useful where the object is simple, variations are less,
and learning is counter-productive or superfluous.
7

(a) Pedestrian detection (b) Car detection
Figure 1.2 Sample outputs of pedestrian detection and car detection. Images courtesy ofC.Papageorgiou, MIT 2000
8

Figure 1.3A schematic sagittal section of the human eye, with schematic enlargement of the retina. Im-age courtesy ofWebvision: The organization of the retina and visual system, Helga Kolb, Eduardo Fer-nandez and Ralph Nelson, John Morgan Eye center, Universityof Utah. http://webvision.med.utah.edu
1.4 Focus of the thesis
This thesis aims to demonstrate each of the above two approaches by applying them for the detection
of specific lesions indicative of diabetic retinopathy in color images of the retina.
A learning-driven approach is designed for the detection ofmicroaneurysms. A multispace clus-
tering based approach is discussed for the segmentation of retinal exudates. The designed systems and
algorithms are a step towards achieving automated screening as a support tool for clinicians and medical
practitioners. Further, insights from the state of art and the systems developed are presented in the hope
of streamlining and accelerating further work in automatedobject detection in images.
1.4.1 Retinal Images
The human eye is structurally organized similar to a camera.Light that passes through the iris is
focused onto the retina through a lens. Retina is the sensorymembrane that lines most of the large
posterior chamber of the vertebrate eye. The visual information is encoded in the retina, and transmitted
to the brain through the optic nerve.
The human eye has a circular opening called the pupil throughwhich light enters the eye and reaches
the retina (see Fig. 1.3). Retinal imaging systems use this opening to capture the image of the retina.
The diameter of the pupil adjusts itself so as to let an optimum amount of light enter the eye. However,
the pupil can be dilated using drugs, in order to obtain a large diameter irrespective of the amount of
light entering the eye. Often, in order to facilitate betterillumination of the retina, the patients eyes are
dilated before capturing the images.
9

As can be seen in Fig. 1.3, retina has the shape of an inner surface of a hemishpere. Because of this,
it is not possible to capture the entire retina in a single image. Different parts are imaged by adjusting
the camera into different positions. Typically, dependingon the field of view of the camera, a number
of images are obtained so that the part of the retina that is ofinterest is captured in at least one image.
1.4.2 Diabetic retinopathy
Diabetic retinopathy is an ocular manifestation of diabetes, and diabetics are at a risk of loss of
eyesight due to diabetic retinopathy. Upto 80% of patients with diabetes tend to develop DR over
a 15 year period. Worldwide, DR is a leading cause of blindness among working populations. DR
is also the most frequent microvascular complication of diabetes. The eye is one of the first places
where microvascular damage becomes apparent. Though diabetes is still incurable, treatments exist for
DR, using laser surgery and glucose control routines. But early detection is key to ensure successful
treatment.
For this disease, and consequently for this thesis, the retina is the most important part of the eye.
Diabetes being a blood-related phenomenon, causes vascular changes, which can often be detected
visually by examining the retina, since the retina is well-irrigated by blood vessels.
The vascular changes in diabetic retinopathy produces lesions, which hinder the working of the
photoreceptive neurons lining the retina. Specific spatialregions exist in the retina, like the fovea,
containing high concentration of photosensitive cells. Diabetic retinopathy leads to risk of vision loss if
vascular changes occur near such regions.
DR presence can be detected by examining the retina for its characteristic features. One of the first
unequivocal signs of the presence of DR is the appearance of microaneurysms.
MA appear due to local weakening of the vessel walls of the capillaries, causing them to swell. In
some cases the MA will burst causing hemorrhages. As the disease and damage to the vasculature
progresses, larger hemorrhages will appear. In addition toleaking blood, the vessels will also leak lipids
and proteins causing small bright dots called exudates to appear. Next a few small regions of the retina
become ischemic (deprived of blood). These ischemic areas are visible on the retina as fluffy whitish
blobs called cotton-wool spots.
As a response to the appearance of ischemic areas in the retina, the eye will start growing new vessels
to supply the retina with more oxygen. These vessels (calledneovascularizations) have a greater risk of
rupturing and causing large hemorrhages than normal vessels.
Treatment of DR is still predominantly based on photo-coagulation, where a strong beam of light
(laser) is applied to certain areas of the retina. The laser can be applied to leaking MAs to prevent further
hemorrhaging. It can also be applied in a grid pattern over a larger part of the retina with the purpose
of reducing the overall need for oxygen and diminishing the load on the damaged microvasculature.
Photocoagulation can significantly reduce the risk of serious vision loss. However visual acuity already
lost usually can not be restored.
10

1.4.3 Analysis for detecting DR
Ophthalmologists can visually examine a patient’s retina using a small portable instrument called an
ophthalmoscope. It consists of a set of lenses and a light source, permitting the ophthalmologist to view
regions of the patient’s retina.
The pupil is narrow, thus it does not allow much light to enterthe eye for illuminating the retina. The
pupil may be dilated by administering eye drops (mydriasis).
An indirect way of examination is by using photographs of theretina captured using fundus cameras.
This decouples the examination process into the disjoint tasks of image acquisition and interpretation.
Further, modern fundus cameras are capable of capturing retinal images without mydriasis.
Digital fundus photography thus opens the possibility of large scale DR screening, where diabetic
patients can be routinely checked for DR. The screening solution would automatically isolate abnormal
cases by applying suitably calibrated detectors of diseaseindicators. Since the number of normal cases
is expected to be greater than the abnormal, the screening process can reduce the work load of ophthal-
mologists, by having them examine only those cases which arehard to categorize as normal. This can
also reduce the treatment costs and help to ensure treatmenteffectiveness amidst scale-up in the number
of patients.
Further, the manual analysis may be augmented by using computer-based tools. For example, an
image analysis system that automatically determines if lesions are present, can reduce the work load
of ophthalmologists, by showing them only those cases whichare abnormal, and directly archiving the
normal cases.
1.5 Contributions
The thesis documents the following contributions:
• Two broad approaches for object detection in images are outlined, illustrated by applying them to
the analysis of retinal images.
• The two developed systems include various novelties in terms of technique, dataset, validation
methodology and interpretation of results.
• The systems are conceptualized as the core of an automated Diabetic Retinopathy screening so-
lution.
1.5.1 Discussion
Medical images are an information source for making clinical decisions. The examples stated in this
chapter pertain to visual information of medical significance. It is to be noted that the sensor capturing
the information is not restricted to the visual spectrum, but the analysis by conventional methods is
11

visual. Humans can understand a scene not only by directly sensing it, but also by viewing a finite
projection (image) of it. Assuming that the analysis occurring in the human visual system is the same
for both inputs, we can conjecture that visual representation through images is apt, convenient and
informative formanualanalysis.
The state of art in automated image understanding tasks indicates that such human-friendly visual
information is challenging to analyze and derive information automatically. For an automatic analysis
system, an image is a lattice of pixel (or voxel) values. The task of deriving higher abstractions from
this representation is an inverse problem, and is generallyill-posed.
However analysis of medical images is not universally so. Medical imaging technologies such as
tomography are capable of obtaining sectional views of objects – views that can not be sensed directly
by the human visual apparatus. Human understanding of such images (as also microscopic images or
images from non-visual spectra) is equally ill-posed. But nevertheless, an X-ray image of a fractured
arm, for instance, conveys diagnostic information to a medical experttrained to analyze X-ray images.
Human analysis of such images (projections of the scene) is built upon semantic understanding and in-
formation available about the causal factors at play in the scene. Such external information is necessary
to better formulate the problem for automated analysis.
1.6 Organization
The issues involved in the design of detectors are discussedin Chapter??, and a framework is
described for detection in images. In Chapter??, existing approaches are discussed for each component
of the framework, and a detector is proposed for a class of lesions calledmicroaneurysmsin retinal
images, and its properties are studied. Chapter?? is devoted to a study of learning methods for modeling
subjectivity. Chapter??contains an evaluation of decision systems for diabetic retinopathy, and presents
inferences and guidelines.
12

Chapter 2
Conclusions
This thesis describes novel methods for automatic analysisof retinal images with the goal of au-
tomated diabetic retinopathy screening. In automated screening a computer system analyzes retinal
images before an ophthalmologist does, and only the images that are suspect for the presence of dia-
betic retinopathy are presented to the ophthalmologist. Toachieve this objective, the thesis develops
methods for detection of diabetic retinopathy-indicativelesions in retinal images.
Chapter 1 formulated detection as a decision between two states “target-present” and “target-absent”.
Observations are made consisting of measurements, and the observations help to make decisions by
comparison with prototypical patterns in the observation space or feature space. A detector hence be-
comes a set of decision functions, where the task of each decision functionδi is a transformation from
the observation space toits decision spaceSi. The observationx is transformed into decision spaceSi,
and the power of decision comes from the existence of numerical ordering inSi.
In theory achieving such ordering helps to formulate the detection problem as an optimization in the
decision space. Such structural restriction as inSi is however not stated for the observation space. As
in the task at hand, for most real world decision problems it is necessary to identify what measurements
qualify to be considered as an observation amenable to statistical analysis and inference. This is the
transport between the semantics of the real world and the observations in the mathematical/ statistical
world.
Science is built up of facts, as a house is built up of stones. But an accumulation of facts is no more
a science than a heap of stones is a house– Henri Poincare.
It is only through empirical studies, experimentation and experience in the domain, that good obser-
vations can be made. Assuming a set of features to be available for the application, a classifier-approach
would try to search for a separating hyperplane in the observation space, projecting upon which an
ordering would arise (the projection maps from the observation space to the decision space).
Chapter 3 considered a different perspective. Classifier design builds a single projection functiong
for a variety of samples. In the case of a multiple-discriminant or perceptron learning there are multiple
13

Figure 2.1An illustrative projection in a Fisher linear discriminant. Image courtesy of Richard O. Duda,Peter E.Hart and David G.Stork, Pattern Classification, Second Edition, Wiley 2001
projections but in the same observation space. By its very formulation statistical modeling is reductive,
necessarily missing part of the complexity of the real worldto give a simplified representation permitting
decision making. There is thus a possibility that a part of the training samples may not conform to their
generative hypothesis. Essentially it can be claimed that Chapter 3 attempted to circumvent this by
consideringfeature sub-spaces, instead of performing the projection in a unified feature space.
The subspaces may be constructed manually, or by applying anautomatic feature selection tech-
nique combined with a clustering algorithm, where each cluster denotes a representative of a possible
expression of the target to be detected. A problem certain toarise in this direction is that the number of
expressions exhibited by the target must be enumerated and annotated, in order to verify the outcome.
But for the detection task the annotation available is only indicative of the target, and the different ex-
pressions of the target, such as “faint, distinct, uneven, off-shape” and so on, are not straight-forward to
obtain, and are subjective. Further this strategy might nothelp to make generalizations.
We thus shifted our focus from the target object to the non-target, in the fashion of the knowledge-
discovery technique known asiterative denoising[Giles 08]. The subspace idea along with the focus on
non-MA culminated in the successive-rejection strategy for MA detection presented in Chapters 2 and
3.
The presented approach exploits the high occurrence probability of clutter structures and derives a
novel successive rejection-based method. A system developed using the proposed approach has been
evaluated on three datasets, and a comparison of performance with other approaches has been presented.
14

To the best of our knowledge, this is the first lesion-level MAdetection method to be evaluated against
an extensive set of images from multiple datasets.
The practical implementation of the system opened up new challenges, foremost was the need to
identify and model various frequently occurring FP structures (among the candidates), other than the
ones we have identified in this work, for better rejection. The modular design of the proposed approach
offers flexibility to include additional rejection stages independently, without affecting the function-
ality of other stages. The performance obtained indicated that a more sensitive candidate selection
component is of need, to get desirable performance, since our experiments show that the candidate se-
lection determines an upper bound on the maximum sensitivity which can be achieved. For instance, the
wavelet-domain template matching approach of [Quellec 08]could replace the morphological approach
we applied, towards this goal.
Some questions that emerge from this work are:
1. Should the training set strive to include the entire gamutof expressions exhibited by the character-
istic patterns (without enumeration)? This would be an effort towards generalization, but would
it penalize the performance of the system by posing greater variability ? What are the ways by
which these opposing objectives can be reconciled?
2. Given a detector, having only its parameters to control, how can it be found if there exists a
parameter value at which the detector performance be satisfactory?
Our results indicate that for the inductive learning approach espoused in this thesis for MA detection,
greater variations in the training set only result in reduced performance. This is evidenced in the gap
between the PDS-1 and CRIAS performance. This is concordantwith the assumption expressed in
Chapter 1, that the set of characteristic patterns be representative and “good”.
The assumption is also endorsed by the “Compactness hypothesis” of training data –In order to
derive, from a training set, a classifier that is valid for new(unseen) objects, the representation should
fulfill the condition thatrepresentations of similar real world objects should have to be similar as well1.
By training with greater intra-class variations, the classifier arises as a model with low statistical
bias, but high variance (a model with an inclination to flexibility/generalizability). Such a model per-
mits greater false alarms leading to reduced performance, especially in medical applications which are
required to have very low false alarms, more so in a screeningscenario.
A classifier trained with fewer intra-class variability could lead to high performance, as seen in PDS-
1, but may lead to a rigid model (low variance, but high bias) with the possibility of having overfitted
the training data.
These issues are traded away in the unsupervised approach detailed in Chapter 4. Here clustering
is performed as a pixel labeling step, with an intended partitioning of the image into specific types
1from the Handbook of pattern recognition and computer vision, CH Chen and PSP Wang (eds)
15

of partitions. Connected components form the potential regions of exudates, and are analyzed further
based on RGB band decorrelation information, to reject someregions. This approach uses two feature
spaces where pixel labeling is performed independently andthe results are merged in a manner driven
by heuristics and a knowledge of the outcomes. The approach is unsupervised and relies on domain
knowledge and assumptions on the expressions exhibited by exudates in CFI.
Future work:
The MA detection algorithm was also evaluated against a dataset collected from L.V.Prasad Eye
Hospital, part of which is called CRIAS (colour retinal image analysis set). The dataset contains CFI
of 288 patients, containing at most 2 images per patient (left and right eye). The dataset also contains
fluorescin angiogram images (FA) of the patients. It is thus possible to attempt automated multimodal
registration of CFI and FA, and study the turnover of MA in thetwo modalities. It is well-known that
MA appear as easily detectable bright spots in the FA. But FAsshow about twice as many MAs as seen
in CFI. This is because the retina is multi-layered, and CFIscapture reflected light from only the first few
layers. MAs located in further layers show up in the FA but notin CFI. By obtaining image registration
between FA and CFI, a number of insights might arise regarding better ways to obtain unequivocal
(“gold-standard”) ground truth, and strategies for developing better MA candidate selection algorithms
for CFI.
Regarding the achievement of desired performance, detection theory only gives an objective for
optimization. The decision capacity of the detector may be ascribed to a likelihood ratio test on the
observations. The detector model is thus data driven, highly dependent on the training data and the
measurements constituting observations for achieving performance. This being the case, the theory di-
rects the algorithm designer to experimentation at variousparameter settings as the only means to verify
the power of the detector. By relooking the formulation of detection, an alternative way to setup the
detector objective function could arise to address this.
The room is but a resource, I hold its lock and key
Now they call it my room, but it is what holds me.
16

Related Publications
1. Keerthi Ram, Gopal Joshi and Jayanthi Sivaswamy,A successive-rejection based approach for
early detection of diabetic retinopathy, IEEE Transactions on Medical Imaging, (submitted
October 2009)
2. Keerthi Ram and Jayanthi Sivaswamy,Multi-space clustering for segmentation of exudates in
retinal color photographs, in Proceedings of the Annual International Conference of the IEEE
Engineering in Medicine and Biology Society (EMBC), September 2009.
17

Bibliography
[Abramoff 08] M.D. Abramoff, M. Niemeijer, M.S. Suttorp-Schulten, M.A. Viergever, S.R. Rus-
sell & B. van Ginneken.Evaluation of a system for automatic detection of diabetic
retinopathy from color fundus photographs in a large population of patients with
diabetes. Diabetes Care, vol. 31, no. 2, pages 193–198, 2008.
[Asada 86] H. Asada & M. Brady.The Curvature Primal Sketch. PAMI, vol. 8, no. 1, pages
2–14, 1986.
[A.Yuille 92] A.Yuille, P.Hallinan & D.Cohen.Feature extraction from faces using deformable
templates. IJCV, vol. 8, no. 2, pages 99–111, 1992.
[Bhalerao 08] A. Bhalerao, A. Patanaik, S. Anand & P. Saravanan. Robust Detection of Mi-
croaneurysms for Sight Threatening Retinopathy Screening. In ICVGIP08, pages
520–527, 2008.
[Brady 85] M Brady, J Ponce, A Yuille & H Asada. Describing surfaces. 1985.
[Burges 98] Christopher J. C. Burges.A tutorial on support vector machines for pattern recog-
nition. Data Mining and Knowledge Discovery, vol. 2, pages 121–167, 1998.
[Canny 86] J. F. Canny.A computational approach to edge detection. IEEE Trans. PAMI.,
vol. 8, pages 679–697, 1986.
[C.Papageorgiou 98] C.Papageorgiou, M.Oren & T.Poggio.A general framework for object detection.
In Proc.ICCV, pages 555–562, 1998.
[Dalal 05] Navneet Dalal & Bill Triggs.Histograms of Oriented Gradients for Human De-
tection. In Proc. CVPR, volume 1, pages 886–893, 2005.
[Das 06] Taraprasad Das & Alka Rani. Diabetic eye diseases, chapter Foundations in
Vitreo-Retinal Disease. 2006.
[D.Marr 80] D.Marr & E.Hildreth. Theory of edge detection. In Proceedings of the Royal
Society of London, B, volume 207, pages 187–217, 1980.
18

[Duda 00] Richard O. Duda, Peter E. Hart & David G. Stork. Pattern classification (2nd
edition). Wiley-Interscience, November 2000.
[Frangi 98] Alejandro F. Frangi, Wiro J. Niessen, Koen L. Vincken & Max A. Viergever.
Multiscale Vessel Enhancement Filtering. Lecture Notes in Computer Science,
vol. 1496, 1998.
[Garg 07] S Garg, J Sivaswamy & S Chandra.Unsupervised Curvature-Based Retinal Vessel
Segmentation. pages 344–347, 2007.
[Giles 08] Kendall E. Giles, Michael W. Trosset, David J. Marchette & Carey E. Priebe.
Iterative denoising. computational statistics, vol. 23, no. 4, pages 497–517, 2008.
[Haralick 83] R Haralick, L Watson & T Laffey.The Topographic Primal Sketch. volume 2,
1983.
[Harris 88] C. Harris & M. Stephens.A combined corner and edge detector. In Proc. 4th
Alvey Vision Conference, pages 147–151, 1988.
[Hodge 04] Victoria Hodge & Jim Austin.A Survey of Outlier Detection Methodologies. Artif.
Intell. Rev., vol. 22, no. 2, pages 85–126, 2004.
[Huang 05] Ke Huang & Michelle Yan.A local adaptive algorithm for microaneurysms de-
tection in digital fundus images. In Proc. CVBIA, pages 103–113, 2005.
[kay Sung 98] Kah kay Sung & Tomaso Poggio.Example-based learning for view-based human
face detection. IEEE Trans. PAMI, vol. 20, pages 39–51, 1998.
[M.Betke 95] M.Betke & N.Markis. Fast object recognition in noisy images using simulated
annealing. In Proc. ICCV, pages 523–20, 1995.
[Ponce 06] Jean Ponce, Martial Herbert, Cordelia Schmid & Andrew Zisserman, eds. To-
wards category-level object recognition. LNCS, 2006.
[Quellec 08] G. Quellec, M. Lamard, P.M. Josselin, G. Cazuguel, B. Cochener & C. Roux.
Optimal Wavelet Transform for the Detection of Microaneurysms in Retina Pho-
tographs. IEEE Trans. Medical Imaging, vol. 27, no. 9, pages 1230–1241,
September 2008.
[Ram 09] Keerthi Ram, Yogesh Babu & Jayanthi Sivaswamy.Curvature orientation his-
tograms for detection and matching of vascular landmarks inretinal images. In
Proc. SPIE. Medical Imaging, 2009.
[Singh 08] Jeetinder Singh & Jayanthi Sivaswamy.Appearance-based object detection in
colour retinal images. In Proc. ICIP, 2008.
19

[Sinthanayothin 02] C. Sinthanayothin, J. F. Boyce, T. H. Williamson, H. L. Cook, E. Mensah, S. Lal
& D. Usher.Automated detection of diabetic retinopathy on digital fundus images.
Diabetic Med., vol. 19, no. 2, pages 105–112, 2002.
[Viola 01] Paul Viola & Michael Jones.Robust Real-time Object Detection. IJCV, 2001.
20