
Detection Methods in Ion Chromatography -...
88
461 7 Detection Methods in Ion Chromatography Detection methods applied in ion chromatography are divided into electrochemi- cal and spectrometric methods. Conductometric and amperometric detection are electrochemical methods, while the spectrometric methods include UV/Vis, fluorescence, and refractive index detection. In addition, there are various appli- cation forms of these detection methods; these are described in detail below. In most cases, the choice of a suitable detection mode depends on the sepa- ration method and the corresponding eluants. If detection is to be carried out by direct measurement of a physical property of the solute ion (e. g., UV absorp- tion), the solute ion must differ substantially in this property from eluant ions which are present in much higher concentration. However, eluant and solute ions often exhibit similar properties, so direct detection is only feasible where selective detection of a limited number of solute ions is desirable. A much broader range of applications employ detection methods that measure changes in a certain physical property of the eluant (e. g., conductance) that are caused by the elution of the solute ion. As a prerequisite, the values of this property for eluant and solute ions must differ. Most of the detection methods applied in ion chromatography are based on this technique. In the following discussion, a further subdivision into direct and indirect methods is made. Di- rect detection methods are those, in which eluant ions exhibit a much smaller value than solute ions for the property to be measured. On the other hand, detection methods are called indirect, if eluant ions exhibit a much higher value for the property to be measured than do solute ions. 7.1 Electrochemical Detection Methods 7.1.1 Conductivity Detection As a universal method for the detection of ionic species, conductometric detec- tion has the highest significance in ion chromatography. The fundamental theo- retical principles of this detection method are summarized in the following. Handbook of Ion Chromatography, Third, Completely Revised and Enlarged Edition. Joachim Weiss Copyright © 2004 WILEY-VCH Verlag GmbH & Co. KGaA, Weinheim ISBN: 3-527-28701-9
Transcript of Detection Methods in Ion Chromatography -...
461
7Detection Methods in Ion Chromatography
Detection methods applied in ion chromatography are divided into electrochemi-cal and spectrometric methods. Conductometric and amperometric detection areelectrochemical methods, while the spectrometric methods include UV/Vis,fluorescence, and refractive index detection. In addition, there are various appli-cation forms of these detection methods; these are described in detail below.
In most cases, the choice of a suitable detection mode depends on the sepa-ration method and the corresponding eluants. If detection is to be carried outby direct measurement of a physical property of the solute ion (e.g., UV absorp-tion), the solute ion must differ substantially in this property from eluant ionswhich are present in much higher concentration. However, eluant and soluteions often exhibit similar properties, so direct detection is only feasible whereselective detection of a limited number of solute ions is desirable.
A much broader range of applications employ detection methods that measurechanges in a certain physical property of the eluant (e.g., conductance) that arecaused by the elution of the solute ion. As a prerequisite, the values of thisproperty for eluant and solute ions must differ. Most of the detection methodsapplied in ion chromatography are based on this technique. In the followingdiscussion, a further subdivision into direct and indirect methods is made. Di-rect detection methods are those, in which eluant ions exhibit a much smallervalue than solute ions for the property to be measured. On the other hand,detection methods are called indirect, if eluant ions exhibit a much higher valuefor the property to be measured than do solute ions.
7.1Electrochemical Detection Methods
7.1.1Conductivity Detection
As a universal method for the detection of ionic species, conductometric detec-tion has the highest significance in ion chromatography. The fundamental theo-retical principles of this detection method are summarized in the following.
Handbook of Ion Chromatography, Third, Completely Revised and Enlarged Edition. Joachim WeissCopyright © 2004 WILEY-VCH Verlag GmbH & Co. KGaA, WeinheimISBN: 3-527-28701-9

462 7 Detection Methods in Ion Chromatography
7.1.1.1 Theoretical Principles
Electric conductivity of electrolyte solutions [1]The electric resistance of an electrolyte solution is described by Ohm’s law
(160)
R ResistanceU VoltageI Current strength
Because the resistance depends on the type of conductor, the resistivity W isdefined as a material-specific quantity as follows:
(161)
A Cross section of conductorl Length of conductor
The electric conductivity χ with unit S cm�1 represents the reciprocal of the res-istivity.
(162)
The electric conductivity of electrolytes is strongly dependent on concentration.To compare the conducting power of different electrolyte solutions, the electricconductivity is divided by the equivalent concentration, cev, yielding the equiva-lent conductance, Λ (S cm2 val�1):
(163)
When two electrodes immersed in an electrolyte solution are connected to apower supply, an electric field of strength E is created between them. In thisfield, a directed mass transport occurs. Anions drift to the positive pole whilecations drift to the negative pole. Because the ion velocity, v, is strictly pro-portional to the electric field strength, the mobility of ions, u (cm2 V�1 s�1), isan independent characteristic:
(164)

7.1 Electrochemical Detection Methods 463
In a strong electrolyte, cations and anions are present in the solution in theconcentration c+ and c� , respectively. The following applies:
(165)
When the electrolyte is in an electric field, the number of cations and anionspassing the given cross-section A of the electrolyte within the time t is given byNA · c+ · v+ · A · t and NA · c� · v� · A · t, respectively. Because each ion carriesan electric charge, the directed motion is associated with a charge transport. Theratio of the sum of charges and time represents the electric current strength, I:
I = I+ + I� (166)
I = e · N · c+ · v+ · A + e · N · c� · v� · A (167)
N Loschmidt numbere Elemental charge
Using the Faraday constant, F = N · e, and taking into account the ion mobilityaccording to Eq. (164), one obtains:
I = F · c · A · E (u+ + u�) (168)
Because:
(169)
one obtains with Eq. (168) the electric conductivity for the solution of a strongelectrolyte:
χ = c · F (u+ + u�) (170)
Correspondingly, for a polyvalent electrolyte
χ = c · z · F (u+ + u�) (171)
where z is the number of charges. In case of incomplete dissociation, the degreeof dissociation also has to be taken into account:
χ = � · c · z · F (u+ + u�) (172)
Thus, the electric conductivity increases• with increasing ion concentration,• with increasing charge numbers of the ions, and• with increasing ion mobility.

464 7 Detection Methods in Ion Chromatography
With Equations (163) and (171) one obtains:
(173)
According to Kohlrausch, the quantities F · u+ and F · u� are the equivalentionic conductances Λ+ and Λ� for anions and cations, respectively. Thus, theconductivity is a summation:
Λ = Λ+ + Λ� (174)
The equivalent conductance of strong electrolytes always decreases continuouslywith increasing concentration; with decreasing electrolyte concentration it ap-proaches a material-specific limiting value, the conductivity at infinite dilution,Λ�. This behavior may be attributed to the decrease in ion mobility with increas-ing concentration. At increasing electrolyte concentration, the ions draw so nearto one another that they affect each other electrostatically. On time average, Cou-lomb interaction increases with the shortening distance between ions. This in-terionic interaction is further enhanced at high electrolyte concentrations be-cause the dielectric constant of the solvent is decreased by the electrolyte. Thiselectrostatic interaction may even cause solvated ions to form ion pairs whichdo not contribute to the conductivity [2].
Kohlrausch observed the following empirical relation describing the concen-trational dependence of the conductivity of strong electrolytes:
(175)
(Kohlrausch square root law)
Here k depends on the charge number of the ion. Plotting Λ versus �c yields astraight line, the slope of which depends on the electrochemical valency of theelectrolyte. Equation (175) only applies to low concentrations (c � 10�2 mol/L).
An increasing electric conductivity is usually observed with increasing tem-perature, as the viscosity of the solution decreases exponentially with rising tem-perature.
Conductivity measurements only define the sum of the equivalent conduc-tances of the ions; no information about their individual values can be derived.However, it is known that the equivalent conductances of ions may differ signifi-cantly. According to Kohlrausch’s law of independent ion drift, all ions moveindependently of each other in an infinitely diluted solution. Because the equiva-

7.1 Electrochemical Detection Methods 465
lent conductances of ions differ, they contribute differently to the current trans-port. The contribution of an ionic species, i, to the total current is called thetransport number, ti:
(176)
With Equations (166) and (167) it applies:
I+ = F · c · A · E · u+ (177)
The result of Eq. (168) is the contribution to the current that is apportioned tothe cations. It is denoted as cation transport number, t+:
(178)
Similarly, it applies for the anion transport number, t�:
(179)
The equivalent conductances of anions and cations are typically between35 S cm2 val�1 and 80 S cm2 val�1 (see Table 7-1). The hydronium ion with350 S cm2 val�1 and the hydroxide ion with 198 S cm2 val�1 (25 °C) are the onlyexceptions. Because these values are that high only in aqueous solution, it hasto be assumed that there is a special mechanism for the transport of H+- andOH� ions that is correlated with the water structure. Hydrogen bonds betweenassociated water molecules allow the exchange of hydronium- and hydroxideions over a long chain of water molecules with no actual migration of hydratedions. The high equivalent conductances of H+ and OH� are especially usefulin the suppressor reaction to convert the salts under investigation into higherconductive species while the eluant is converted into a less conductive form (seeSections 3.6 and 4.3).

466 7 Detection Methods in Ion Chromatography
Table 7-1. Equivalent conductances of some selected anions and cations.
Anions Λ� Cations Λ+
[S cm2 val�1] [S cm2 val�1]
OH� 198 H+ 350F� 54 Li+ 39Cl� 76 Na+ 50Br� 78 NH4
+ 73I� 77 K+ 74NO2
� 72 Mg2+ 53NO3
� 71 Ca2+ 60HPO4
2� 57 Sr2+ 59SO4
2� 80 Ba2+ 64Benzoate 32 CH3NH3
+ 58Phthalate 38 N(CH3CH2)4
+ 33
Interionic interactionsFor dilute electrolyte solutions, Lewis and Randall observed that the mean ac-tivity coefficient of a strong electrolyte does not depend on the kind of ion, butonly on the concentration and charge numbers of all ions present in solution.Thus, the individual properties of the ions are not decisive for interionic interac-tions in dilute electrolyte solutions. These observations paved the way for theintroduction of the concept of ionic strength, I:
(180)
This is a very functional quantity, as the mean activity coefficient of an electrolytemay easily be described with it. Lewis discovered the following empirical re-lation:
(181)
f± Mean activity coefficient
When log f± is plotted versus �I, a straight line is obtained, with a slope thatonly depends on the charge numbers of ions present in the electrolyte.
According to the theory of Debye and Hückel, it is assumed that the mutualinfluence of ions present in the crystal lattice of the solid electrolyte is not fullyabolished in electrolyte solution. Accordingly, owing to electrostatic attractiveforces, each ion in solution is surrounded by ions of opposite charge. Althoughthese ions are subjected to thermal motion, in time average a positive ion, forexample, will form the central ion of an oppositely charged ion cloud. Each ionin this ion cloud interacts with the central ion. The total charge of the ion cloudequals that of the central ion because of the electroneutrality condition.

7.1 Electrochemical Detection Methods 467
Following Debye and Hückel, the distribution of ions can be calculated via theBoltzmann energy distribution. The application of this law is based on the con-cept that the ion cloud represents a space charge, which is most dense in thevicinity of the central ion and decreases with increasing distance from the centralion. A number of simplifying assumptions concerning the state of ions aremade:
• The electrolyte is fully dissociated.• Only electrostatic forces acting between ions are responsible for in-
terionic interactions.• The electrostatic interaction energy is small compared to the thermal
energy.• The ions are regarded as point charges with an electric field of spherical
symmetry and, thus, are non-polarizable.• The dielectric constant of the electrolyte solution is equal to that of the
pure solvent.
With increasing electrolyte concentration, these conditions become more andmore inadequate:
• Strong electrolytes form ion pairs at high concentration.• Apart from electrostatic interactions, ion-molecule interactions also occur
at high electrolyte concentrations; such interactions affect the solvationstate of the ions and the solvent structure.
• The electrostatic interaction energy becomes so high at high electrolyteconcentration, that ions no longer execute an unhindered thermal motion.
• With increasing electrolyte concentration, ions may polarize each other dueto close encounters.
• Interactions of ions with the solvent change the dielectric constant of thesolvent.
According to Lewis, the constant A in Eq. (181) had to be determined empiri-cally. On the other hand, with the aid of the Debye-Hückel theory, it can bebased on physical quantities and, thus, may be calculated. The theoretically de-rived dependence
(182)
allows the following conclusions:• At finite ionic strength log f always has a negative value; that is, the activity
coefficient is �1 in the validity range of the equation.• The logarithm of the activity coefficient decreases from its limiting value
log f = 0 (for I = 0) with the square root of the ionic strength.• Ions with high charge numbers deviate more strongly from the ideal be-
havior than do the ions with small charge numbers.• The activity coefficient is strongly affected by the temperature and the di-
electric constant.

468 7 Detection Methods in Ion Chromatography
Equation (182) only represents a limiting law owing to the reduced validity of theprerequisites on which the Debye-Hückel theory is based. Thus, Eq. (182) is appli-cable to monovalent 1-1 electrolytes in aqueous solution up to a maximum ionicstrength of 10�2 mol/L.
Also, with the Debye-Hückel theory the effect of the ion cloud on ion mobilitycan be quantified.
When a central ion moves within an electric field, the ion cloud surroundingthe ion is permanently renewed. This requires a certain amount of time called therelaxation time. Therefore, as illustrated in Fig. 7-1, the charge density around thecentral ion is no longer symmetrical, but is lower in front of the central ion thanbehind it. This dissymmetry in charge distribution leads to an electrostatic deceler-ation of the central ion, which reduces the mobility of the ion.
Fig. 7-1. Schematic representation of a central ionwith its ion cloud: a) without an external electric field,b) with an external electric field.
The ion cloud, with the solvation shells of its ions, moves in a direction op-posite to the central ion. Therefore, the central ion does not move relative to aresting medium but rather against a solvent flow. The resulting reduction in themobility is called the electrophoretic effect. Both effects become more importantwith increasing electrolyte concentration and result in a decrease of the equiva-lent conductance.
According to Onsager the quantitative analysis yields the following equationfor the conductivity of a 1-1 electrolyte:
(183)

7.1 Electrochemical Detection Methods 469
The lower the dielectric constant, ε, of the solvent, the stronger the interionicinteractions and thus, the stronger the relaxation and electrophoretic effects. Forthe latter, solvent viscosity also plays a decisive role. When both the relaxationand the electrophoretic constants are known, the conductivity coefficient is ob-tained:
(184)
A� Relaxation constantB Electrophoretic constant
7.1.1.2 Application Modes of Conductivity DetectionWhen passing the separator column effluent into the conductivity cell withoutapplying a suppressor system, the electric conductance χ of a solution, accordingto Fritz et al. [3], is given by:
(185)
Λ+, Λ� Equivalent conductances of cations and anionsc Concentrationα Dissociation constant of the eluantK Cell constant
When the cell constant and the equivalent conductances of eluant anions andcations are known, Eq. (185) makes it possible to calculate the conductivities ofeluants that are typical for this kind of detection method. To determine the cellconstant, the conductivity of a potassium chloride solution with a defined con-centration is usually measured, as the equivalent conductances of potassium andchloride ions are known to be 74 S cm2 val�1 and 76 S cm2 val�1, respectively(see Table 7-1).
When the eluant of the concentration cE contains cations E+ and anions E�,the background conductivity, χE, may be calculated via Eq. (185) as follows:
(186)
When the concentration of solute ions passing the detector is denoted as cS andtheir degree of dissociation as αS, the eluant concentration in the measuring cellduring the elution of solute ions is given by (cE � cS · αS). Hence, in thisinstance, the measured conductivity is caused by eluant and solute ions as wellas by the eluant counter ions that are required to maintain electroneutrality. In

470 7 Detection Methods in Ion Chromatography
anion exchange, solute counter ions do not have to be taken into account, be-cause they are not retained at the anion exchanger. The conductivity resultingfrom the elution of a solute ion is given by:
(187)
The change in conductivity associated with the elution of a solute ion is:
(188)
In principle, Eq. (188) applies to all ion chromatographic methods. It revealsthat the detector signal not only depends on the solute ion concentration, butalso on the equivalent conductances of eluant cations and eluant- and soluteanions, as well as on their degree of dissociation. The degree of eluant- andsolute ion dissociation is determined by the pH value of the mobile phase.
Interestingly, the degree of eluant dissociation significantly affects the detectorsignal. The amount that sensitivity increases with decreasing degree of eluantdissociation is derived from Eq. (188). This can be confirmed by the work ofFritz and Gjerde [4], who obtained a much higher sensitivity with pure boric acideluant than with sodium benzoate of comparable elution strength.
According to the above definition, direct detection is feasible when using care-fully selected eluants such as phthalate [5] or benzoate [6], which exhibit a lowequivalent conductance (see Table 7-1). Using such eluants results in a conduc-tivity increase when solute ions pass the conductivity cell.
Alternatively, a strongly conducting eluant may be used. In this case, elutionof the solute ions is associated with a negative conductivity change. This indirectdetection method is applied to the separation of anions with a potassium hydrox-ide eluant [7]. A corresponding chromatogram is displayed in Fig. 7-2. This in-direct detection method is also utilized in the analysis of mono- and di-valentcations, which are eluted by dilute nitric acid or nitric acid/ethylenediamine mix-tures.
Upon application of a suppressor system, the observed sensitivity enhance-ment is caused by two processes. On one hand, the eluant is converted into alower conductive form in the suppressor system which, according to Eq. (188),results in a sensitivity increase. A further enhancement is obtained by convertingthe solute ions into their corresponding acids or bases. In anion analysis, theassociated conductivity change, according to Eq. (189), is to be attributed mainlyto the presence of strongly conductive hydronium ions:

7.1 Electrochemical Detection Methods 471
(189)
Finally, it should be pointed out that chemical suppression in form of pro-tonation reactions is also applicable to zwitterionic eluants [8, 9].
Fig. 7-2. Separation of various inorganic anions withindirect conductometric detection. � Separatorcolumn: TSK Gel 620 SA; eluant: 2 mmol/L KOH;flow rate: 1 mL/min; injection volume: 100 µL;solute concentrations: 5 mg/L each of fluoride (1),chloride (2), nitrite (3), bromide (4), and nitrate (5);(taken from [7]).
Comparison of Suppressed and Non-Suppressed Conductivity DetectionTowards the end of the 1970s, the growing use of ion chromatography inspiredan argument about necessity of using a suppressor system for sensitive andselective detection of ions via conductivity detection. At this point, an attemptis made to transform the partially very emotional discussion back to a moreempirical one.
Without doubt, both application forms of conductivity detection have a num-ber of things in common, while at the same time they bear significant differ-ences. The things in common include the trivial fact that with both applicationforms the electric conductivity of the analytes is measured. On the other hand,the most obvious difference is that one method uses a suppressor system ofwhatever kind and the other one does not. There are other distinctions whichare less obvious but nonetheless very significant. Two of them are described herein detail: sensitivity and dynamic range. The term sensitivity elicits by far themost misunderstanding in the discussion about the two application forms ofconductivity detection. The lack of systematic experimental studies about thissubject was corrected by Small [10] with a series of computer simulations thatdealt with the relative sensitivity of each application form as used in the chroma-tographic analysis of sodium and potassium. By intention, Small chose the analy-sis of cations for his studies because of the great degree of overlap in the twomethods as commonly practiced. Both methods use a low-capacity cation ex-changer as a stationary phase and a dilute mineral acid such as hydrochloric or

472 7 Detection Methods in Ion Chromatography
nitric acid as a mobile phase. Although stationary phases and eluants havechanged over the years, the principle difference between the methods is thesame up to the present day. For his hypothetical experiments, Small kept con-stant the volume of the stationary phase, the ion-exchange capacity of the sepa-rator column, the selectivity coefficients for sodium and potassium relative tothe hydronium ion, and the injection volume. With these values and the knownacid concentration in the mobile phase, it is possible to calculate the elutionvolumes of sodium and potassium. To further simplify the calculation of theelution profiles, the chromatographic peaks are assumed to be symmetrical, sothat they can be described by a Gaussian curve. One can further assume thatthe membrane-based suppressor system exhibits a very small dead volume and,therefore, subtracts negligibly from the efficiency of the separator column, whichis estimated to be 3,000 theoretical plates.
In calculating conductivities, Kohlrausch’s law of independent ion mobilitiesis assumed to be applicable, so conductivities may be calculated by summing upthe equivalent conductances of the separate anions and cations in the system.In the non-suppressed mode, the solutes are revealed by the decrements in con-ductivity that they cause when the hydronium ions are replaced by the less con-ductive sodium and potassium ions:
∆LNa = 1000 cNa (ΛNa � ΛH) (190)
L ConductivitycNa Sodium ion concentration at any point in the sodium band
For practical reasons, the polarity of the signal is reversed, so that the conduc-tivity values decrease in the positive direction of the ordinate.
In the suppressed mode, the solutes appear as bands of sodium and potas-sium hydroxides in essentially de-ionized water. The positive deflection in con-ductivity caused by the sodium band, for example, is calculated according toEq. (191):
∆LNa = 1000 cNa (ΛNa + ΛOH) (191)
In a hypothetical suppressed mode, one could in principle assume the extremelylow conductivity of pure water, but a real system is more fairly represented bychoosing a value of about 2 µS/cm, because inevitable impurities in the eluantand any slight leakage from the suppressor system have to be taken into account.
Last but not least, the contribution of noise is important. The most significantsource of noise is the imperfect control of the temperature of the column efflu-ent reaching the conductivity cell. Even with excellent temperature control atolerance of ±0.005 °C has to be assumed. Taking the temperature coefficient ofconductivity of about 2%/ °C into account, the uncertainty in conductivity is±0.01%. The intrinsic noise of the detector is estimated to be 0.01 µS/cm.
The main purpose of this hypothetical experiment is to examine the detect-ability of sodium and potassium with the two application forms of conductivitydetection. If the acid concentration in the eluant is 5 mmol/L, the background

7.1 Electrochemical Detection Methods 473
conductivity in non-suppressed conductivity detection is roughly 2,100 µS/cmwith a noise level of approximately 0.2 µS/cm due to temperature variations. Forthe suppressed mode, because of the much lower background conductivity, thenoise that is relevant is the intrinsic noise of 0.01 µS/cm. Thus, the detectabilityof the two solute ions essentially depends on the solute ion concentration. At asolute ion concentration of 10 mg/L, the application forms do not differ muchwith respect to the detectability. However, as the solute ion concentration is low-ered to 1 mg/L, the problem of noise clearly begins to affect the accuracy ofmeasurement in the non-suppressed mode. When the solute ion concentrationis further lowered to 0.1 mg/L, the signals can hardly be evaluated in the non-suppressed mode (Fig. 7-3A), while baseline noise in the suppressed mode doesnot significantly influence the evaluation of the sodium and potassium peaks(Fig. 7-3B).
Fig. 7-3. Simulated comparison of the detectability of sodium and potassiumwith the two application forms of conductometric detection at a solute ionconcentration of 0.1 mg/L. � (A) non-suppressed conductivity detection, (B)suppressed conductivity detection. Chromatographic conditions: see text; (takenfrom [10]).
The large difference in noise between the two application forms is of coursecaused by the extreme difference in background conductivity. It is clear, there-fore, that lowering the acid concentration in the eluant will lower the backgroundconductivity and hence the noise in the non-suppressed mode, but the ion-ex-change capacity of the stationary phase also has to be lowered proportionallyin order to obtain comparable separations. This measure, in turn, involves a

474 7 Detection Methods in Ion Chromatography
compromise, because lowering the eluant strength and the resin capacity im-pairs the system’s ability to resist column overloading. In contrast, the sup-pressed system, with a tenfold greater resin capacity, has a tenfold advantageover the non-suppressed system in overload capacity. This will be reflected in agreater dynamic range for the suppressed method.
The ability to handle a wide range of analyte ions is one of the ways in whichanalytical techniques are evaluated. In this regard, the simulated comparisondescribed above impressively demonstrates the superiority of suppressed con-ductivity detection. It also shows that the dynamic range of a method does notonly depend on the construction of the conductivity detector and cell but alsoon the type of stationary phase and eluant.
Moreover, the calculation above reveals the pitfall of using an overly restrictivedefinition of sensitivity. If only the peak heights (or peak areas) that result fromthe two application forms of conductivity detection are compared, it is apparentthat the responses in the non-suppressed mode are in fact somewhat greaterthan in the suppressed mode. When noise is considered alongside response, asit properly should be, then one must conclude that eluant suppression leads tosuperior sensitivity.
7.1.2Amperometric Detection
Amperometric detection is generally used for the analysis of solutes with pKvalues above 7, which, owing to their low dissociation, can hardly be detected orare not at all detected by suppressed conductivity.
Conventional amperometric detectors employ a three-electrode detector cellconsisting of a working electrode, a reference electrode, and a counter electrode.The electrochemical reaction at the working electrode is either an oxidation ora reduction. The required potential is applied to the working electrode. TheAg/AgCl reference electrode represents an electrode of the second kind. In thistype of electrode, a second solid phase in the form of a sparingly soluble saltcontributes to the electrode reaction, in addition to the element and the electro-lyte solution. Thus, the activity of the potential-determining cation depends onthe activity of the anion involved in the formation of the sparingly soluble salt,via the solubility product. The Ag/AgCl electrode is utilized as a reference elec-trode because it is characterized by a good potential constancy at current flow.The purpose of the counter electrode, which is usually made of glassy carbon, isto maintain the potential. Furthermore, it inhibits a current flow at the referenceelectrode that could destroy it. When an electroactive species passes the detectorcell it is partly oxidized or reduced. This reaction results in an anodic or cathodiccurrent that is proportional to the concentration of the species over a certainrange, and that may be represented as a chromatographic signal.

7.1 Electrochemical Detection Methods 475
Such detectors are employed for analyzing a wealth of inorganic and organicions in the µg/L range. This includes environmetally relevant anions such assulfide and cyanide [11, 12], as well as arsenic(III) [13], halide ions, oxyhalides[14], nitrite [14], thiosulfate [14], hydrazine, and phenols. A survey of electro-chemically active compounds and the working electrodes and potentials is givenin Table 7-2.
Table 7-2. Electroactive compounds and the required working electrodesand potentials.
Compound Working electrode Working potential [V]
HS�, CN� Ag 0Br�, I�, SCN�, S2O3
2� Ag 0.2SO3
2� Pt 0.7OCl� Pt 0.2AsO2
� Pt 0.85N2H4 Pt 0.5NO2
� CPa 1.1ClO2
� CP 1.1S2O3
2� CP 1.1Phenols GCb 1.2
a) Carbon Pasteb) Glassy Carbon
7.1.2.1 Fundamental Principles of VoltammetryInformation about suitable working potentials for the amperometric detectionof electroactive species is obtained in voltammetric experiments. The term “vol-tammetry” refers to the investigation of current-voltage curves in dependence onthe electrode reactions, and the concentrations, and the exploitation of thesedependences for analytical chemistry. Among the different types of voltammetry,information from the hydrodynamic and pulsed voltammetry can be best appliedto amperometry. In both cases, the analyte ions are dissolved in a supportingelectrolyte that has several functions:
• Lowering the resistance of the solution ensures that the voltage dropi · RL is kept low. This is the case for electrolyte concentrations of0.1 mol/L.
• Preventing depolarisators (anions or cations) which pick up or emit elec-trons during their reduction or oxidation from reaching the electrode bymigration due to the potential gradient. Therefore, the concentration of thesupporting electrolyte should exceed that of the depolarisators by a factorof 50 to 100.
The chlorides, chlorates, and perchlorates of alkali- and alkaline-earth metals,alkali hydroxides and carbonates as well as quaternary ammonium compoundsare utilized as supporting electrolytes.

476 7 Detection Methods in Ion Chromatography
In general, the following reaction occurs in an amperometric detection:
(192)
A transfers n electrons to the working electrode and is oxidized to B. The relationbetween the concentration of oxidized and reduced species and the applied po-tential is described by the Nernst equation:
(193)
E Working potential[A], [B] Equilibrium concentrations of both species at the electrode surfaceE0 Standard potential, at which the concentrations of A and B are equal. (Because
chromatography is carried out at low concentrations, concentrations may be usedinstead of activities in Eq. (193) in good approximation.)
The working potential must be selected so that A is fully oxidized to B, in orderto yield as high a current as possible. Therefore, according to Eq. (193), theworking potential, E, must always be higher than the standard potential, E0.
A voltammogram of the oxidation of A is recorded by means of hydrodynamicvoltammetry. This is done by pumping the substance dissolved in the supportingelectrolyte through a flow cell, which contains the working electrode. The poten-tial applied to the electrodes is continuously raised while the current flow isregistered. Figure 7-4 shows the sigmoidal curve, which is characteristic for sub-stance A. The curve may be interpreted in terms of the concentration of speciesA at the electrode surface (Fig. 7-5). Only a small current flows, denoted as re-sidual current, until potential EA is reached. This is caused by the charging ofthe double layer at the electrode surface and the reaction of impurities in thesolution at the electrode. The concentration of A at the electrode surface is equalto that in the bulk solution. At potential EA, the concentration ratio B to A in-creases until at the standard potential, E0; the concentrations of A and B at theelectrode surface are the same. However, a few micrometers away from the elec-trode surface, the concentration of A remains constant. The distance betweenthe electrode and the point at which the concentration is equal to that in thebulk solution is known as the thickness δ of the diffusion layer. Because of theconcentration gradient, the transport of A to the electrode surface occurs onlyby diffusion within this distance. When the potential is increased in the directionof EB, the current strength reaches a maximum at EB and remains nearly con-stant because A is immediately oxidized to B after it has diffused to the electrodesurface. Thus, the current strength is limited by the speed of diffusion becausethe transport process is the rate-determining step. The resulting current is calledthe diffusion current. According to Eq. (194), this diffusion current is pro-portional to the concentration of A in the bulk solution.

7.1 Electrochemical Detection Methods 477
(194)
F Faraday constantA Electrode surfaceD Diffusion coefficient of A
Fig. 7-4. Voltammogram of the oxidationof species A.
Fig. 7-5. Dependence of soluteconcentration, c, on thedistance to the electrodesurface at various workingpotentials.
Pulsed amperometry in a three-electrode cell is carried out in a non-flowingsolution, in which solute ions are dissolved in the supporting electrolyte. Apulsed potential is applied and increased stepwise after each pulse. The resultingcurrent strength is measured at each step. The voltammogram does not differfrom that shown in Fig. 7-4. Immediately after a pulse in the diffusion-controlledplateau region the measured current strength is very high, because the mol-ecules A close to the electrode are immediately oxidized. Molecules that arefurther away from the electrode reach the electrode surface only by diffusionand are then oxidized. As a result, a drop in the current strength is observed(Fig. 7-6).

478 7 Detection Methods in Ion Chromatography
Fig. 7-6. Drop of the total current,the Faraday current, and the chargingcurrent after applying a pulse in thediffusion-controlled plateau region.
Two kinds of current are generated during the oxidation of A to B: the chargingcurrent and the Faraday current. The charging current results from the chargingof the interface between the electrode and the bulk solution, which acts as acondensator. The Faraday current represents the electron transfer in the oxi-dation of A to B. As illustrated in Fig. 7-6, the drop in the charging currentfollows an exponential time law. The drop in the Faraday current over time isdescribed by the equation of Cotrell:
(195)
t Time
Although the current strength is a function of t�1/2, a direct proportionality tothe solute ion concentration exists. The sum of both currents is measured as thetotal current. Because the charging current is much larger than the Faradaycurrent, measurement of the total current is delayed by more than 40 ms afterapplication of the pulse. During this time, the ratio of Faraday current to charg-ing current is enhanced as the latter drops much faster with time.
7.1.2.2 AmperometryWhile the working potential required for the desired electrochemical reactionmay be determined with voltammetric experiments, amperometry is used as adetection method in ion chromatography. A distinction is made between pulsedamperometry and amperometry with constant working potential.
Amperometry with Constant Working PotentialThis kind of amperometry is the most widely used electrochemical detectionmethod in liquid chromatography. A constant DC potential is continuously ap-plied to the electrodes of the detector cell. The theory of amperometry withconstant working potential does not differ from the theory of hydrodynamicvoltammetry, even though the applied potential remains constant.

7.1 Electrochemical Detection Methods 479
The working potential is chosen to be in the diffusion-controlled plateau re-gion for the analyte ion. When several ions with different standard potentialsare to be detected in the same run, the working potential must be high enoughto cover the plateau regions of all ions to be analyzed. The amperometric detec-tion with constant working potential is routinely applied to the species listed inTable 7-2. Figure 7-7 shows the application of this detection method to the analy-sis of iodide in a highly concentrated sodium chloride solution. To eliminate theinterfering effects of the chloride matrix, the iodide oxidation is carried out at aplatinum working electrode and not, as usually done, at a silver working elec-trode. The required sensitivity for this application is obtained by conditioningthe electrode for one hour with a saturated potassium iodide solution.
Fig. 7-7. Analysis of iodide in a concentrated NaCl solution. � Separatorcolumn: IonPac AS7; eluant: 0.2 mol/L HNO3; flow rate: 1.5 mL/min;detection: DC amperometry at a platinum working electrode; oxidationpotential: +0.8 V; injection: 50 µL of a 10-fold diluted saturated NaClsolution with 24 µg/L iodide.
Environmentally relevant anions such as sulfide and cyanide are detected ona silver working electrode under strongly alkaline conditions (see Fig. 3-86 inSection 3.7.2). The carbon paste electrode is used for detecting nitrite and chlo-rite under acidic conditions and at neutral pH. Nitrite and chlorite can also beoxidized at a glassy carbon electrode, but the resulting sensitivity is significantlylower because the surface is less electrochemically active.
Conductivity detection and DC amperometry can be used simultaneously. Ina non-suppressed system the conductivity cell effluent is directed to the ampero-metric cell; in a suppressed system the positioning of the amperometric celldepends on the electrode material. The carbon paste electrode, for example, ispositioned between the suppressor and the conductivity cell, so that electroactiveanions can be detected together with standard anions [14]. An example of appli-cations involving a carbon paste electrode is shown in Fig. 7-8. The separationof nitrite, thiosulfate, and iodide is performed in an acidic medium with a

480 7 Detection Methods in Ion Chromatography
phthalic acid eluant. The optimal working potential is +1.1 V and the detectionlimits for the anions shown in this chromatogram are in the lowest µg/L range(based on an injection volume of 100 µL).
Fig. 7-8. Amperometric detection of nitrite, detection: DC amperometry on a carbon pastethiosulfate, and iodide on a carbon paste working electrode; oxidation potential: +1.1 V;electrode. � Separator column: Supersep injection volume: 100 µL; soluteAnion; eluant: 3.3 mmol/L phthalic acid � concentrations: 10 µg/L each of nitrite (1),acetonitrile (90:10 v/v), pH 4.5 with Tris; thiosulfate (2), and iodide (3); (taken from [14]).
Pulsed Amperometry (PAD)Amperometric detection of electroactive species requires that reaction productsfrom the oxidation or reduction of solutes do not precipitate at the electrodesurface. The surface characteristics of electrodes will change if contaminated,thus leading to an enhanced baseline drift, increased background noise, and aconstantly changing response. This behavior is particularly pronounced in theamperometric detection of carbohydrates.
Pulsed amperometric detection, on the other hand, utilizes a rapidly repeatingsequence of three different working potentials, E1, E2, and E3, which are appliedfor the times t1, t2, and t3 to the gold working electrode. In contrast to conven-tional amperometry, the resulting current is only registered in short time inter-vals. By applying additional potentials (more positive and more negative), oxidiz-able and reducible species may be removed from the electrode surface. Theadvantage of this technique is illustrated in Fig. 7-9, which is a comparison of thetwo amperometric detection methods, taking the chromatographic separation ofsugars in chocolate milk as an example.

7.1 Electrochemical Detection Methods 481
Fig. 7-9. Separation of monosaccharides in achocolate milk on a latexed anion exchanger:a) with pulsed amperometric detection at agold working electrode, b) with conventionalamperometric detection applying a constantworking potential. Analytes: (1) glucose, (2)fructose, (3) lactose, and (4) sucrose.
In their original publication Johnson et al. [15] described the use of a platinumworking electrode. Although satisfactory results were achieved with this elec-trode material, reduction of oxygen is likely to happen at the oxidation potentialof �0.4 V, which was used at the time. For this reason, gold was chosen as analternative electrode material. The required working potentials and the pulsesequence are determined by means of cyclic voltammetry. As an example,Fig. 7-10 shows the cyclic voltammogram of glucose on a gold working electrode[16]. The scattered line illustrates the scan for 0.1 mol/L sodium hydroxide,which serves as a supporting electrolyte. From this scan, the irreversible oxi-dation of gold starting at 0.25 V can be read. The cathodic peak at 0.1 V rep-resents the reduction of the oxidic gold surface to the pure metal. When glucoseis added to that solution, oxidation starts at �0.5 V on the positive branch of thecurve (straight line). Until �0.15 V the current remains constant and increasesthereafter to a peak at 0.26 V. The sequel of the curve shows a change from acathodic to an anodic current, which goes along with the reduction of gold oxide.This means that the oxidation of glucose is hindered by the formation of goldoxide. With the beginning of the gold oxide reduction, the oxidation of glucosemolecules that diffused to the electrode during the oxidic covering recom-mences. Comparing cyclic voltammograms of glucose with those of other sac-charides shows that the only difference is the height of the anodic peak at 0 V.
According to Johnson et al. [18] the reaction mechanism of the oxidation ofcarbohydrates on a gold working electrode under alkaline conditions is a sequen-tial process. For example, Fig. 7-11 illustrates the reactions involved in the oxi-dation of glucose. In a first and extremely fast step, the C1-aldehyde group is

482 7 Detection Methods in Ion Chromatography
Fig. 7-10. Cyclic voltammogramof glucose (c = 166 mg/L) on agold working electrode. (Scatteredline: supporting electrolyte,0.1 mol/L NaOH; sweep rate: 200mV/s; taken from [17]).
oxidized to form a gluconate anion. The second reaction step, the oxidation ofthe C6-alcohol group, is also fast, although it is slower than the preceding one.The subsequent decarboxylation occurs with the formation of electroinactive for-mate and the corresponding dicarboxylate anion. The degree of decarboxylationdepends on the amount of time the carbohydrate is in contact with the electrodesurface which is, in turn, a function of the type and concentration of the support-ing electrolyte.
Fig. 7-11. Reaction mechanism of the electrode under alkaline conditions; (takenoxidation of glucose on a gold working from [18]).

7.1 Electrochemical Detection Methods 483
The pulse sequence with three different potentials usually applied for the de-tection of carbohydrates is shown in Fig. 7-12A. However, the cleaning potentialE2 being applied for 200 ms leads to an electrode recession that enlarges thecellvolume as shown in Fig. 7-13. This, in turn, lowers the linear speed of the liquidthrough the detector cell which consequently results in a decrease of the re-sponse factor for a given analyte concentration.
Fig. 7-12. Potentialsequence at a gold workingelectrode for carbohydratedetection. � (A) standardsequence with threedifferent potentials, (B)sequence with fourdifferent potentials. Thedetector signal is thecharge (measured inCoulomb) that results fromintegrating the oxidationcurrent between 0.2 sand 0.4 s.
Fig. 7-13. Schematicrepresentation of the electrodeblock of an amperometric cell. �
(A) new cell with a leveled goldworking electrode, (B) used cellwith a larger cell volume due torecession of the working electrode.

484 7 Detection Methods in Ion Chromatography
Electrode recession can be minimized by avoiding a strongly positive potential,although the removal of the top layer is a prerequisite for a clean, catalyticallyactive electrode surface. Just recently, Johnson et al. [19] were able to show thatthe oxidation products of glucose can also be removed from the electrode surfaceby applying a strongly negative potential. Based on this work, Rocklin et al. [20]developed a sequence with four different potentials for the detection of carbo-hydrates (see Fig. 7-12B) that resulted in a constant response factor and betterlong-term stability. All the potentials and the pulse sequence were optimized fora maximal signal-to-noise ratio.
Every potential marked in Fig. 7-12B has a different meaning. At the potentialE1 the current resulting from the oxidation of the carbohydrate is integrated. Itcan be revealed from cyclovoltammetric experiments that the maximal currentyield for sugars is achieved at oxidation potentials between 0.1 V and 0.2 V. Be-cause real-world samples often contain amines, which are also oxidized at poten-tials �0.15 V, the oxidation potential E1 was set to 0.1 V, so that amines will notinterfere with carbohydrate detection. There is no optimal value for the inte-gration time. In general, higher response factors are observed with increasingintegration times; however, noise is not affected at all. Thus, an improved signal-to-noise ratio is obtained with increasing integration time. Integration time can-not be increased indefinitely, because the whole pulse sequence has to be limitedin time in order to reproducibly evaluate highly efficient peaks with a chromato-graphy data system. In the end, an integration time of about 200 ms has proved tobe suitable. Similar considerations have to be taken into account for the delaytime to adjust the potential, at which the integration of the oxidation current canbegin. A long delay time lowers noise and does not significantly affect the signal.Normally, the delay time is also recommended to be 200 ms. When integratinghighly efficient peaks with a respectively high data acquisition rate, the delaytime can be slightly shortened without a significant increase in noise.
In the above mentioned pulse sequence the cleaning potential, E2, is stronglynegative. The optimal potential for removing adsorbed oxidation products is�1.5 V. However, noise is a problem, because it increases with increasing nega-tive potential. If the sample to be analyzed contains amino acids or small pep-tides, they can adsorb on the electrode surface after leaving the separator col-umn. This leads to lower response factors for subsequently eluting carbohydrates[21]. With repeatedly injected fetuin hydrolysates it could be shown that matrixcomponents can only be removed effectively at a potential of �2 V. This poten-tial is applied for 10 ms. If the samples do not contain components that foul thesurface of the working electrode, the potential E2 can be increased to �1.5 Vwithout a noticeable increase in noise.
The potential E3 (+0.6 V) activates the electrode surface. It is assumed thatthe catalytically active sites are created via the formation and subsequent re-duction of gold oxide [22]. When investigating the dependence of the response

7.1 Electrochemical Detection Methods 485
factor as a function of E3, it is observed that the response factor remains con-stant between +0.4 V and +0.9 V. The suitable value for E3 was defined as aresult of a long-term study. When glucose and sucrose are injected repeatedly ata potential of +0.4 V, constant response factors are observed for both sugars overa period of ten days. Afterwards, the response factors rapidly decrease withoutelectrode recession. Apparently, the formation rate for catalytically active sites isnot sufficient at this potential. Only at a potential of +0.6 V do the responsefactors remain constant over a period of more than two weeks. If this valueis further increased beyond +0.6 V, significant electrode recession is observed.Electrode recession at a potential of +0.6 V is avoided as much as possible bylowering E3 to �0.1 V immediately after the adjustment at +0.6 V. In this way,a catalytically active electrode surface is maintained without electrode recession.
With the potential E4 at �0.1 V the oxide that is formed at positive potentialis reduced again. The value of �0.1 V is not further lowered in order to mostlyavoid the reduction of oxygen present in the samples. Oxygen reduction is re-sponsible for the negative peak, which appears at approximately 14 minutes onCarboPac PA1 when analyzing monosaccharides (see Section 3.10.1.1). Becausethe reduction of gold oxide is very fast, timing for this pulse is not critical. Ithas been set so that the time for the whole pulse sequence is 0.5 s.
The detection limits for carbohydrates are in the fmol range with either oneof the two pulse sequences; the linear range, depending on the sugar, is two tothree orders of magnitude. Concentrations above 1 nmol should be calibratedwith several points applying a quadratic curve fitting. Diluting the sample intothe workable range is an alternative.
Pulsed amperometry not only allows the detection of carbohydrates (see Sec-tion 3.10); it also enables the detection of alcohols and aldehydes. Short-chainprimary, secondary, and tertiary alcohols can be separated on an ion-exclusionphase with a perchloric acid eluant (see Section 5.8). Although conventionalHPLC methods exist for the analysis of primary alcohols, the advantage of anion chromatographic separation lies in the ability to simultaneously analyze sec-ondary and tertiary alcohols. Detection of alcohols is carried out on a platinumworking electrode. It is assumed that the resulting anodic current is generatedvia oxidation of hydrogen atoms, which are formed by heterogeneous dehydro-genation of the adsorbed organic molecules [23]. The organic residue remainsadsorbed at the electrode surface and hinders the adsorption of other moleculesfrom the bulk solution. Working potentials and pulse sequences can be derivedfrom the cyclic voltammograms obtained by Johnson et al. [24]. At the potentialE1 (+0.3 V), alcohols are oxidized anodically by means of surface-catalyzed de-hydrogenation; the electrode surface must be free of platinum oxide. The oxi-dation products that are strongly adsorbed at the electrode surface are oxidizedpresumably to carbon dioxide at the potential E2 (+1.3 V) with simultaneous

486 7 Detection Methods in Ion Chromatography
formation of platinum oxide. The reduction of platinum oxide occurs at thepotential E3 (�+0.6 V). At concentrations �1 mmol/L the anodic current re-sulting from the oxidation reaction is proportional to the solute concentration.
In the past, the ion chromatographic analysis of short-chain aliphatic alde-hydes was carried out after oxidation to the corresponding carboxylic acid. Incontrast, pulsed amperometry allows the simultaneous determination of short-chain aldehydes and formic acid, which can be interfered by methanol and otheralcohols. Again, good separations are obtained with ion-exclusion phases in thepotassium form. The underlying retention mechanism is a combination of ad-sorption and weak interactions between the oxygen-containing functional groupsof the solutes and the potassium counter ions of the sulfonate groups at thestationary phase.
The amperometric oxidation of aldehydes is also carried out on a platinumworking electrode under acidic conditions. Figure 7-14 shows the cyclicvoltammogram of formaldehyde, which does not differ much from the one offormic acid. Adsorption of formaldehyde occurs at negative potential; oxidationto carbon dioxide and water occurs at increased potential. Formation of platinumoxide starts at a potential of +0.7 V, which interrupts the further oxidation ofsolutes. The oxidation of solutes sets in again at potentials �1 V. After reversingthe direction of the potential, a change from a cathodic to an anodic current isobserved at 0.2 V. The resumption of solute oxidation is attributed to the begin-ning reduction of platinum oxide and, consequently, the activation of the elec-trode surface. The cyclic voltammogram of propionaldehyde differs significantlyfrom those of other smaller aldehydes. Although propionaldehyde is also oxi-dized on a platinum working electrode, the retention mechanism is most probablydifferent than it is for smaller aldehydes. To find out the optimal oxidation poten-tials for detecting formaldehyde, formic acid, acetaldehyde, and propionaldehyde
Fig. 7-14. Cyclic voltammogram offormaldehyde (c = 0.02 mol/L) on a platinumworking electrode. � Scattered line: 0.05 mol/LH2SO4 + 0.05 mol/L K2SO4 as supportingelectrolyte; sweep rate: 200 mV/s.

7.1 Electrochemical Detection Methods 487
the resulting peak heights are plotted versus the oxidation potential E1 (Fig. 7-15). Considering the lowest possible background current, the optimal oxidationpotential is +0.2 V.
Fig. 7-15. Peak heightas a function of theoxidation potential E1for formic acid(100 mg/L), formal-dehyde (100 mg/L),acetaldehyde(300 mg/L), andpropionaldehyde(300 mg/L); continuousline: backgroundcurrent.
Integrated AmperometryIntegrated amperometry is a variant of pulsed amperometry. It is predominantlyused for the detection of amino acids, amines, and organic sulfur compounds.Their oxidation on metal electrodes is catalyzed by metal oxides. When inte-grated amperometry is employed, baseline disturbances caused by pH gradients,solvent gradients, ionic strength variations, and metal oxide formation are mini-mized. In pulsed amperometry, the resulting current from the oxidation reactionis measured at fixed oxidation potential after the application of the pulse andthe decline of the charging current. In integrated amperometry, the potential E1is not kept constant, but alternated between a high and a low value. Thus, analyteand metal oxidation occur simultaneously at the high potential. However, themetal oxide formed at this potential is immediately afterwards reduced again atthe lower potential. Because the oxidation of the electrode surface is a reversibleprocess, while the oxidation of analytes is not, the resulting signal is mainlycharacterized by the contribution of the analyte oxidation. When integrating thecurrent yield during this cycle, the net signal for the respective analyte is ob-tained. Positive and negative cleaning potentials are part of the pulse sequencefollowing the integration step. A schematic example of such a sequence is illus-trated in Fig. 7-16.
The advantage of integrated amperometry lies in the coulometric compen-sation of the charges resulting from the formation and subsequent reduction ofthe metal oxide. Thus, baseline drifts and baseline disturbances caused by small

488 7 Detection Methods in Ion Chromatography
Fig. 7-16. Example of a pulse sequence in integrated amperometryof amines on a gold working electrode.
variations in the mobile phase composition are eliminated. Moreover, the wholesystem is less sensitive to variations in pH, which influences the potentials forthe formation and reduction of the metal oxide. The potential at which the metalelectrode surface is oxidized decreases with increasing pH.
LaCourse and Owens [25] showed the superiority of integrated amperometryover conventional pulsed amperometric detection in their work on organic sulfurcompounds under reversed-phase conditions. Pulsed amperometry allows directdetection of thio-redox systems (�SH/�S�S�), provided they carry a pair offree electrons at the sulfur atom. As an illustration, the chromatogram in Fig. 7-17displays the separation of lipoic acid, which carries a disulfide bridge as a struc-tural element.
By means of pulsed amperometry, this compound can be directly oxidized with-out prior conversion into the dihydrolipoic acid. The sensitivity of this methodis in the lower pmol range for such compounds.
For the detection of sulfur-containing antibiotics such as cephapirin and am-picillin Dasenbrock et al. [26] developed multicyclic pulse sequences, which re-sult in higher sensitivity and selectivity. In this type of pulse sequence, the poten-tial is cycled between high and low potentials during the integration period (see

7.1 Electrochemical Detection Methods 489
Fig. 7-17. Analysis of lipoic acid utilizing pulsed amperometricdetection. � Separator column: CarboPac PA1; eluant: 0.1 mol/L NaOH +0.5 mol/L NaOAc; flow rate: 1 mL/min; detection: pulsed amperometryon a gold working electrode; injection volume: 50 µL; soluteconcentration: 40 mg/L.
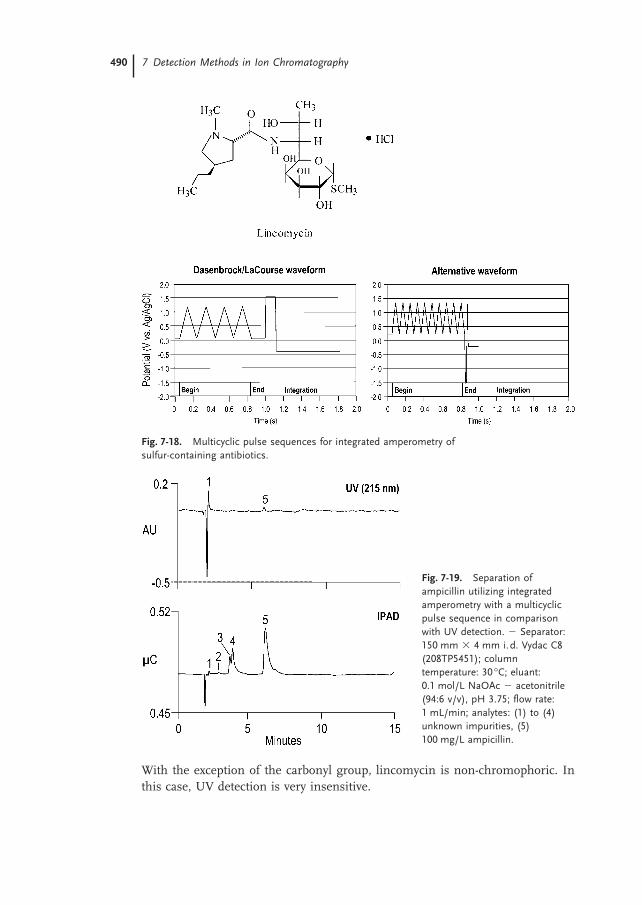
Fig. 7-18, left illustration) leading to an improved signal-to-noise ratio. Theoreti-cally, the signal-to-noise ratio increases with n1/2 for n cycles. However, in prac-tice this value is slightly lower because the frequency of the cycle is so high thatonly a limited number of analyte molecules can adsorb on the electrode surfacebetween the particular cycles. The pulse sequence developed by Dasenbrock et al.was modified by Hanko and Rohrer [27] who increased the number of cyclesfrom four to ten to achieve a more stable response (see Fig. 7-18, right illus-tration). For example, Fig. 7-19 shows the separation of ampicillin on a Vydacseparator utilizing integrated amperometry with this modified pulse sequence,in comparison with UV detection at 215 nm.
Although a slightly higher sensitivity is achieved with UV detection at 254 nm,integrated amperometry is five times more sensitive than UV detection at opti-mized wavelength.
A much larger sensitivity difference between these two detection methods isobtained for lincomycin (see Fig. 7-20).
490 7 Detection Methods in Ion Chromatography
Fig. 7-18. Multicyclic pulse sequences for integrated amperometry ofsulfur-containing antibiotics.
Fig. 7-19. Separation ofampicillin utilizing integratedamperometry with a multicyclicpulse sequence in comparisonwith UV detection. � Separator:150 mm � 4 mm i.d. Vydac C8(208TP5451); columntemperature: 30 °C; eluant:0.1 mol/L NaOAc � acetonitrile(94:6 v/v), pH 3.75; flow rate:1 mL/min; analytes: (1) to (4)unknown impurities, (5)100 mg/L ampicillin.
With the exception of the carbonyl group, lincomycin is non-chromophoric. Inthis case, UV detection is very insensitive.

7.1 Electrochemical Detection Methods 491
Fig. 7-20. Separation of lincomycinutilizing integrated amperometry witha multicyclic pulse sequence incomparison to UV detection. �
Separtor column: 150 mm � 4 mmi.d. Vydac C8 (208TP5451); columntemperature: 30°C; eluant: 0.1 mol/LNaOAc � acetonitrile (91:9 v/v), pH3.75; flow rate: 1 mL/min; peaks: (1)� (3), (5) unknown impurities, (4)10 mg/L lincomycin.
In cation analysis, integrated amperometry is predominantly used for de-tecting primary, secondary, and tertiary amines, which can be oxidized on a goldworking electrode at high pH. While low-molecular weight alkylamines can alsobe detected sensitively and selectively by suppressed conductivity, the sensitivityof conductivity detection for alkanolamines decreases rapidly from monoalkanol-amines to trialkanolamines. On the other hand, alkanolamines can also be de-tected by UV detection at 215 nm, where a sensitivity increase is observed in thesame order. In the past, conductivity and UV detectors were used in series tocompensate for these sensitivity differences. In integrated amperometry, largesensitivity differences are not observed, so this detection method is an excellentalternative to conductivity and UV detection. The only problem is the fact thatthe separation of amines via cation exchange requires an eluant with low pH,which is not compatible with the criterion for amperometric detection (pH �
11) mentioned above. To solve this problem, the effluent of the separator columnis directed through a CSRS self-regenerating suppressor operated in the recyclemode (see Section 4.3.4) prior to entering the amperometric cell. The reactionsoccurring in such a suppressor are illustrated in Fig. 7-21. Using the hydroxideions generated at the cathode, the acid eluant is converted to water, the salt tothe respective hydroxide, and the alkanolammonium ions to the free amine. Inthis way, pH is raised to a value of 13, which is sufficient for amperometricdetection. Figure 7-22 shows the optimal pulse sequence for ethanolamines andthe chromatogram of a corresponding standard. The chromatogram was ob-tained with a mixture of lithium sulfate and sulfuric acid on IonPac CS10. Detec-tion limits for ethanolamines with integrated amperometry are between 10µg/L and 50 µg/L.

492 7 Detection Methods in Ion Chromatography
Fig. 7-21. Ion-exchange reactions inside a CSRS as preparation forintegrated amperometry of amines.
Fig. 7-22. Pulse sequence forintegrated amperometry ofethanolamines and their separationon a latexed cation exchanger. �
Separator: IonPac CS10; eluant:2.5 mmol/L H2SO4 + 100 mmol/LLi2SO4; flow rate: 1 mL/min;detection: integrated amperometryon a gold working electrode;suppressor system: CSRS, recyclemode; injection volume: 25 µL;solute concentrations: 1.7 mg/Lmonoethanolamine (1), 2.8 mg/Ldiethanolamine (2), and 5.6 mg/Ltriethanolamine (3).

7.1 Electrochemical Detection Methods 493
Under similar chromatographic conditions, but with a modified pulse se-quence, primary alkylamines can be analyzed. An IonPac CS14 weak acid cationexchanger served as a stationary phase for the separation shown in Fig. 7-23,which was obtained with a mixture of sodium sulfate and sulfuric acid. A smallamount of acetonitrile was added to this mixture in order to improve the peakform. To shorten the analysis time of the strongly retained butylamine, the sol-vent content is increased stepwise from 5% (v/v) to 40% (v/v) after eight mi-nutes. However, the detection limits (100 µg/L to 1000 µg/L) are somewhathigher relative to the alkanolamines.
Fig. 7-23. Pulse sequence for integratedamperometry of primary alkylamines andtheir separation on a weak acid cationexchanger. � Separator column: IonPacCS14; eluant: 2.5 mmol/L H2SO4 +100 mol/L Na2SO4 � acetonitrile(5% (v/v) to 40% (v/v) after 8 min); flowrate: 1 mL/min; detection: integratedamperometry on a gold working electrode;suppressor system: CSRS, recycle mode;injection volume: 25 µL; soluteconcentrations: 2.6 mg/L methylamine (1),9.1 mg/L ethylamine (2), 0.3 mg/Lpropylamine (3), and 51 mg/Lbutylamine (4).
Integrated amperometry is also a welcomed alternative to derivatization tech-niques for the detection of amino acids. Using this method, first described in1983 by Johnson et al. [28], amino acids are anodically oxidized in an alkalinemedium. Johnson et al. used a platinum working electrode; the use of a goldelectrode in connection with the separation of hydrolyzed ribonuclease A on apellicular anion exchanger was first reported by Frankenberger et al. [29] in 1992.The measured amino acid composition showed good agreement with previouslypublished data. The maximal current yield in the oxidation of the amino groupon a gold working electrode, however, occurs at a potential which is high enoughfor the oxidation of the gold surface itself. The current resulting from this pro-cess contributes to noise and to a certain baseline instability. Johnson et al.solved this problem with the introduction of integrated amperometry [30], withamplifies the signal from the amine oxidation and suppresses the signal fromthe gold oxidation.
494 7 Detection Methods in Ion Chromatography
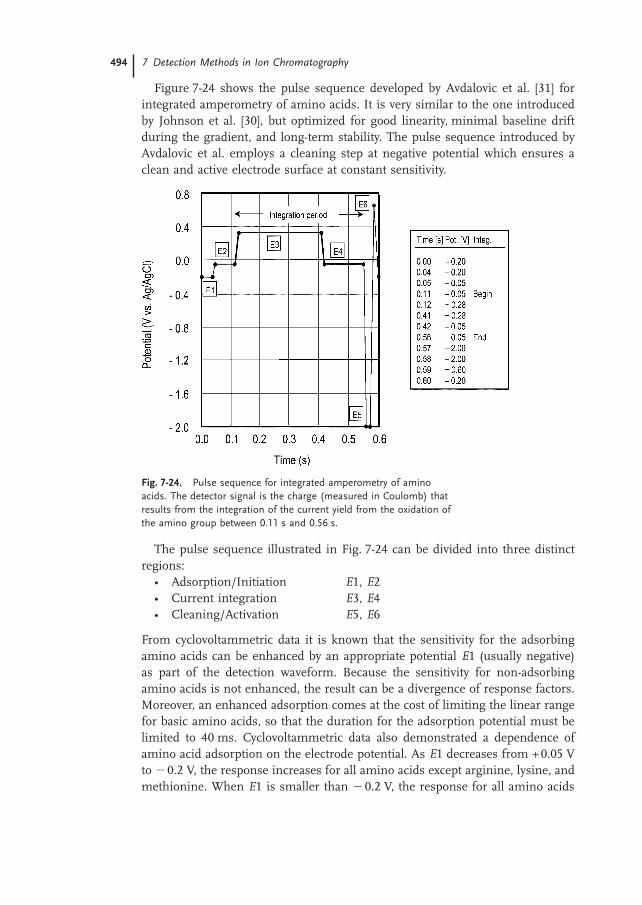
Figure 7-24 shows the pulse sequence developed by Avdalovic et al. [31] forintegrated amperometry of amino acids. It is very similar to the one introducedby Johnson et al. [30], but optimized for good linearity, minimal baseline driftduring the gradient, and long-term stability. The pulse sequence introduced byAvdalovic et al. employs a cleaning step at negative potential which ensures aclean and active electrode surface at constant sensitivity.
Fig. 7-24. Pulse sequence for integrated amperometry of aminoacids. The detector signal is the charge (measured in Coulomb) thatresults from the integration of the current yield from the oxidation ofthe amino group between 0.11 s and 0.56 s.
The pulse sequence illustrated in Fig. 7-24 can be divided into three distinctregions:
• Adsorption/Initiation E1, E2• Current integration E3, E4• Cleaning/Activation E5, E6
From cyclovoltammetric data it is known that the sensitivity for the adsorbingamino acids can be enhanced by an appropriate potential E1 (usually negative)as part of the detection waveform. Because the sensitivity for non-adsorbingamino acids is not enhanced, the result can be a divergence of response factors.Moreover, an enhanced adsorption comes at the cost of limiting the linear rangefor basic amino acids, so that the duration for the adsorption potential must belimited to 40 ms. Cyclovoltammetric data also demonstrated a dependence ofamino acid adsorption on the electrode potential. As E1 decreases from +0.05 Vto �0.2 V, the response increases for all amino acids except arginine, lysine, andmethionine. When E1 is smaller than �0.2 V, the response for all amino acids

7.1 Electrochemical Detection Methods 495
decreases. The response for sulfur-containing amino acids such as methionineand cysteine is largely independent of E1 until �0.8 V, reflecting a strong chemi-sorption of sulfur species at the gold electrode. Basic amino acids such as argi-nine and lysine maintain significant adsorption even at potentials lower than�0.6 V, because they are less anionic (at the pH of the mobile phase) and therate of their adsorption is less sensitive to changes in the net negative charge onthe electrode. The purpose of the delay step E2 is to provide a potential at whichintegration of the current can begin. When increasing the potential from �0.2 Vto �0.05 V, a charging current results that almost completely decays during thepulse duration of 60 ms. This short delay time greatly reduces the magnitude ofthe chromatographic baseline displacement caused by the acetate gradient.
At the beginning of the integration period, the potential E3 is swept to a valuethat is positive enough to oxidize amino acids and form a surface oxide. Anexamination of the cyclic voltammogram for glycine reveals that a value greaterthan +0.20 V is necessary. In general, the response for amino acids increaseswith increasing positive potential to a maximum signal at about +0.30 V. Atpotentials higher than +0.30 V, the analyte signal for most amino acids de-creases. The optimum value for E3 is +0.28 V. After holding at E3 to increasethe total charge from the oxidized amino acids, the potential (E4) is returned toits initial value of �0.05 V, so that charge from the gold oxide reduction willcancel charge from the gold oxidation. Because the reduction of gold oxide oc-curs more rapidly than oxidation, the duration of E4 is shorter than that of E3,therefore allowing a greater proportion of the integration period to be used tomeasure the analyte signal while still achieving adequate background correction.The optimized value for the total integration time is �450 ms; 290 ms is spentat E3, and only 140 ms is spent integrating at E4. The integration asymmetry ofthe waveform maximizes the analyte response without any effect on noise.
The cleaning and activation potentials E5 and E6 originate from the new quad-ruple-potential waveform, which was recently introduced for the detection carbo-hydrates with improved long-term reproducibility [20]. This approach utilizes acathodic cleaning of the electrode at �2 V (E5) and activation of the catalyticsurface via transient oxide formation at +0.6 V. The potential is then returnedto the initial value of �0.2 V for the purpose of reducing the gold oxide.
As can be seen from the chromatogram of an amino acid standard in Fig.3-200 (see Section 3.11), sensitivity for the various amino acids differs signifi-cantly when using integrated amperometry. High sensitivity is obtained for am-ino acids such as arginine and lysine that elute very early as sharp signals; like-wise for aromatic amino acids, which also elute with relatively small peak widthdue to the focusing power of the acetate gradient. Although the peak areas ofacidic amino acids such as glutamate and aspartate are smaller than those ofother amino acids, detection limits below 1 pmol are obtained. In general, detec-tion limits for the various amino acids vary between several hundred fmol and4 pmol (for leucine). With very few exceptions, almost all standard amino acidsexhibit a linear response in the concentration range of 1-100 pmol.

496 7 Detection Methods in Ion Chromatography
With the development of the pulsed amperometric detector (PAD) [32] a newdetector cell was also designed. It is schematically shown in Fig. 7-25. To facili-tate the replacement of the working electrode, the detector cell consists of twoblocks separated by a spacer. One part houses the reference electrode and thecapillary connections, the other houses the working electrode. This second cellblock may be replaced as a whole. Two stainless steel connectors at the inlet andoutlet boreholes serve as a counter electrode.
Fig. 7-25. Schematic representation of thedetector cell for pulsed amperometry.
The choice of the working electrode suitable for a given application is deter-mined by the following factors:
• Potential limit for the working electrode in the eluant• Possibility of oxidation of the working electrode by formation of complexes
with the solute• Kinetics of the electrochemical reaction• Background noise.
Potential LimitThe applied potential is limited in the negative range by the value at which thesupporting electrolyte or the solvent is reduced. The limiting factor in the posi-tive potential range is the value at which the solvent, the working electrode itself,or the supporting electrolyte is oxidized. The potential limits for gold-, silver-,platinum-, and glassy carbon working electrodes in acidic and alkaline solutionare listed in Table 7-3.
The potential limits are particularly dependent on the eluant pH. In principle,more negative potentials may be applied in alkaline solution than in acidic solu-tion and, conversely, in acidic solution more positive potentials may be selected

7.1 Electrochemical Detection Methods 497
than in alkaline solution. For oxidation reactions at high positive potentials,glassy carbon- and platinum electrodes are suited; reduction reactions at verynegative potentials can be performed at glassy carbon-, silver-, and gold elec-trodes.
Table 7-3. Potential limits in acidic and alkaline eluants(reference electrode: Ag/AgCl).
Working electrode Eluant [0.1 mol/L] Potential range [V]
Gold (Au) KOH �1.25 .... 0.75HClO4 �0.35 .... 1.10
Silver (Ag) KOH �1.20 .... 0.10HClO4 �0.55 .... 0.40
Platinum (Pt) KOH �0.90 .... 0.65HClO4 �0.20 .... 1.30
Glassy Carbon (GC) KOH �1.50 .... 0.60HClO4 �0.80 .... 1.30
Possibility of Complex FormationAt positive potentials, metals such as silver and gold may form complexes withsuitable anions in the analyte solution. This may be a disadvantage because itlowers the positive potential limit. For the analysis of complex-forming anionssuch as sulfide and cyanide, on the other hand, this is advantageous.
KineticsIf the reaction from A to B is reversible according to Eq. (192), the concentrationratio of A to B at the electrode surface is in the equilibrium state, as describedby the Nernst equation (193). As a prerequisite for this, the electron transferbetween the electrode and the solute ions must be kinetically favored. Therefore,a certain species may be oxidized or reduced with different speed at variouselectrode materials. If an electrode material is chosen at which the electrochemi-cal reaction is very slow, an acceleration of the reaction is only possible by raisingthe working potential.
The deviations from the equilibrium Galvani potentials1) and the respective elec-trode potentials are denoted as overvoltage. If the transport of reaction partners toand from the electrode is slower than the passage reaction, it is called concen-tration overvoltage. The cause for the passage overvoltage is a slow passage reaction(i. e., the transfer of species from one side to the other side requires a certainamount of activation energy). If the overvoltage exceeds the permissible potentiallimit for a chosen electrode material, a different material must be selected.
1) The term galvani potential denotes the galvani potential is the galvani potential atpotential difference between two electrically electrochemical equilibrium.conducting phases. The equilibrium

498 7 Detection Methods in Ion Chromatography
Background NoiseThe background noise is typically caused by small fluctuations in the eluant flowrate, vortexing in the detector cell, or small temperature variations. Electrodematerials with slow kinetics naturally produce less background than do fast-kinetic materials because their response times with regard to interferences arealso slower.
7.2Spectrometric Detection Methods
7.2.1UV/Vis Detection
7.2.1.1 Direct UV/Vis DetectionIn contrast to RPLC, UV detection is of little importance in ion chromatography,but is considered a welcome supplement to conductivity detection. It is a disad-vantage of direct UV detection that most inorganic anions do not possess anappropriate chromophore. Thus, they generally absorb at wavelengths below220 nm [33]. This was corroborated by the works of Reeve [34] and Leuenbergeret al. [35], who separated inorganic anions on a chemically bonded cyano- oramino-propyl phase and detected them at a wavelength of 210 nm. Recent workby Williams [36] demonstrated the advantages of simultaneous UV- and conduc-tivity detection in combination with a suppressor system. The absorption wave-length of 195 nm chosen by Williams, however, is only applicable to sampleswith comparatively simple matrices. This method is only of academic interest;in the area of surface water and wastewater analysis, interference is possible ifseveral organic species absorb at 195 nm.
Direct UV detection gained great significance in the determination of nitriteand nitrate [37, 38], as well as bromide and iodide in the presence of high chlo-ride concentrations. The optimal measuring wavelengths for the determinationof those anions are listed in Table 7-4. Figure 7-26 illustrates the superiority ofdirect UV detection over conductivity detection with a nitrite determinationin the presence of a 100-fold chloride excess, even though resolution betweenthese two anions is much higher on modern anion exchangers than on IonPacAS4A(-SC), which was used in this particular example. Determinations of thiskind may be performed in all saline samples such as body fluids, sea water, meatproducts, sausages, etc. It is also worth mentioning that metal-cyano- and metal-chloro complexes [39] can be detected at a wavelength of 215 nm.

7.2 Spectrometric Detection Methods 499
Table 7-4. Optimal UV measuring wavelengths for someselected inorganic anions.
Anion Measuring wavelength [nm]
Bromate 200Bromide 200Chromate 365Iodate 200Iodide 227Metal-chloro complexes 215Metal-cyano complexes 215Nitrate 202Nitrite 211Sulfide 215Thiocyanate 215Thiosulfate 215
Fig. 7-26. Comparison of direct UV detectionand suppressed conductivity detection in thenitrite determination at 100-fold excess ofchloride. � Separator column: IonPac AS4A(-SC);eluant: 1.7 mmol/L NaHCO3 + 1.8 mmol/LNa2CO3; flow rate: 2 mL/min; detection: (A)suppressed conductivity (sensitivity: 10 µS/cm),(B) UV detection at 215 nm (sensitivity: 0.05aufs); injection volume: 50 µL; soluteconcentrations: 100 mg/L chloride and 1 mg/Lnitrite.
7.2.1.2 UV/Vis Detection in Combination with Derivatization TechniquesOne of the most important applications of UV/Vis detection is photometric deter-mination after derivatization of the column effluent. First of all, this includesthe determination of transition metals after reaction with 4-(2-pyridylazo)-resorcinol (PAR).

500 7 Detection Methods in Ion Chromatography
The metal ions are separated on an ion exchanger as oxalate- or PDCA com-plexes (PDCA: pyridine-2,6-dicarboxylic acid). They are then mixed with the PARreagent and form chelate complexes which absorb in the wavelength range be-tween 490 nm and 530 nm. PAR is only stable in presence of an ammonia solu-tion at pH � 9. It reacts with a number of metals [40], although usually onlyMn, Fe(II/III), Co, Ni, Cu, Zn, Cd, Pb, and lanthanides are analyzed with PARas a derivatization reagent. When Zn-EDTA is added to the PAR reagent, theapplication range of this derivatization reaction can be expanded to include alka-line-earth metals [41, 42]. The combination of Zn-EDTA and PAR is frequentlycited in the literature, but the kinetics of this reaction are not yet completelyunderstood. Lucy et al. [43] studied in detail the mechanism of reactions inthe Zn-EDTA-PAR system and contributed a lot to understanding it. Althoughzinc forms a stable complex with PAR (log β2 = 17.1 [44]), the dominating pro-cess in the presence of EDTA is the formation of a Zn-EDTA chelate complex(log Kf = 16.44 [45]):
Zn(PAR)2 + EDTA4� v 2PAR� + Zn(EDTA)2� (196)
When alkaline-earth metal ions, M2+, are added to this system, zinc ions arereleased from the Zn-EDTA and subsequently form the chelate complexZn(PAR)2 with PAR:
2PAR� + M2+ + Zn(EDTA)2� v Zn(PAR)2 + M(EDTA)2� (197)
Although zinc ions form a more stable complex with EDTA than, for example,magnesium ions, the equilibrium of the reaction described in Eq. (197) is clearlyon the right side due to the stability of the Zn(PAR)2 chelate complex. By addingZn-EDTA to the PAR reagent equal response factors for analyte metal ions areobtained. The respective chelate complex can be detected at its absorption maxi-mum of 490 nm, which leads to a slightly higher sensitivity relative to the purePAR reagent. It should be noted that alkaline-earth metals such as magnesiumand calcium that are present in real samples in much higher concentrations caninterfere the analysis of transition metals.
The reagent may be delivered in two ways. Truly pulsation-free delivery isachieved pneumatically by supplying the pressurized reagent to the column ef-fluent through a capillary. Alternatively, a pump with a pulse damper may beemployed. When the reagent is delivered via a manifold, the reaction with thereagent occurs in an appropriately dimensioned reaction coil. This is typicallyfilled with chemically inert plastic beads to reduce band spreading and to opti-mize the mixing process.

7.2 Spectrometric Detection Methods 501
Reagent delivery is improved significantly upon application of a membranereactor. This contains a semipermeable membrane which is permeable to certainreagents. The operation of a membrane reactor requires a pressurized container,from which the reagent solution reaches the membrane reactor pulsation-free.In the membrane reactor, the reagent diffuses into the interior of the membrane,where it mixes with the column effluent. This kind of reagent delivery signifi-cantly reduces the short-term noise in the subsequent photometric detection. Itis particularly noticeable when the reagent being used exhibits a high back-ground absorption at the measuring wavelength. A much smaller reagent vol-ume is delivered when using a membrane reactor, so a significant sensitivityincrease is observed because of the smaller dilution factor. Chromatogramsexemplifying the analysis of transition metals using derivatization with PAR aredepicted in Section 4.5.3.
A post-column derivatization with subsequent photometric detection has alsobeen developed for the determination of aluminum. Using a mixture of am-monium sulfate and sulfuric acid, aluminum is separated as AlSO4
+ ion on acation exchanger. It forms a stable complex with the disodium salt of4,5-dihydroxy-1,3-benzenedisulfonic acid (Tiron) at pH 6.2 which can be detectedat 313 nm.
At this pH value Tiron only reacts with aluminum and iron(III), hence thismethod for aluminum determination is very selective. The only disadvantage isthe comparatively low extinction coefficient, ε = 6000 L/(mol cm), of the resultingcomplex at 310 nm. A corresponding standard chromatogram of the separationof aluminum is illustrated in Fig. 4-59 (see Section 4.5.3).
In the area of cation analysis, the extremely selective method of post-columnderivatization of alkaline-earth metals with Arsenazo I [o-(1,8-dihydroxy-3,6-disulfo-2-naphthylazo)-benzenearsonic acid] is particularly suited for the deter-mination of these elements in presence of high concentrations of alkali metals[46].

502 7 Detection Methods in Ion Chromatography
Characteristic applications include the determination of strontium in sea waterand the determination of magnesium and calcium in ultra-pure brine solutionsused for the electrolysis of alkali metal chlorides. With alkaline-earth metals,Arsenazo I forms red-purple complexes that absorb at a wavelength of 570 nm.Figure 7-27 reveals that the reagent exhibits a high background absorption even atthis wavelength, which suggests that a membrane reactor should be used. Arsena-zo I does not form complexes with alkali metals, thus ensuring the selectivity foralkaline-earth metals that is required for the above-mentioned matrices. Arsena-zo I may also be utilized as a derivatization reagent for the analysis of lanthanides.Figure 7-28 shows an example chromatogram, which was obtained by Wang et al.[47] using a silica-based anion exchanger with 2-methyllactic acid as an eluant.
Fig. 7-27. Absorption spectra ofArsenazo I and its correspondingcalcium complex.
Arsenazo III [Bis-(2-arsono-benzeneazo)-2,7-chromotropic acid] can also be used forthe detection of lanthanides; it has the advantage of lower detection limits than PAR.

7.2 Spectrometric Detection Methods 503
Fig. 7-28. Detection of lanthanides by post-column derivatization with Arsenazo I. �
Separator column: Nucleosil 10 SA; eluant:2-methyllactic acid; gradient: linear, 0.01 mol/Lin 30 min to 0.04 mol/L; detection: photometryat 600 nm after reaction with Arsenazo I;reagent composition: 0.13 mmol/L Arsenazo Iin 3 mol/L NH4OH; solute concentrations:10 mg/L each of Lu3+ (1), Yb3+ (2), Tm3+ (3),Er3+ (4), Ho3+ (5), Dy3+ (6), Tb3+ (7), Gd3+ (8),Eu3+ (9), Sm3+(10), Nd3+ (11), Pr3+ (12), Ce3+
(13), and La3+ (14); (taken from [47]).
Cassidy et al. [48] used this reagent for the determination of lanthanides in tho-rium dioxide/uranium dioxide fuel rods. Arsenazo I and PAR are not suitablefor this analysis, because both have to be used under strongly alkaline con-ditions. However, thorium hydrolyzes at alkaline pH, so that thorium-containingsolutions cannot be injected directly under these conditions. In addition, thehydrolysis product is not soluble in water. Maximum sensitivity is obtained atpH 2.5, but the sensitivity obtained with a purely aqueous solution with theoptimum concentration of c = 0.15 mol/L (pH 4.6) is sufficient. The measuringwavelength is 653 nm. A sample chromatogram was shown in Fig. 4-58 in Sec-tion 4.5.3.
Several derivatization techniques have been developed for trace analysis ofbromate in drinking water (see Section 9.1), because concentrations below 5 µg/Lcannot be determined by suppressed conductivity detection without pre-con-centration [49]. Even at lowest µg/L levels, bromate has been classified by theWorld Health Organization (WHO) and the American Environmental ProtectionAgency (EPA) to be carcinogenic [50]. Lowering the detection limit by enlargingthe injection volume compromises chromatographic efficiency and is, therefore,ruled out. However, sample pre-concentration, a method published by Joyce etal. [51] in 1994, is associated with enormous effort in sample preparation, be-cause the bromate determination is interfered with by high amounts of chloride,

504 7 Detection Methods in Ion Chromatography
sulfate, and carbonate in the sample. Thus, these anions have to be partly re-moved by using appropriate sample preparation cartridges prior to the pre-con-centration step. With hyphenated techniques such as IC-MS via an electrosprayinterface [52] and IC/ICP-MS [53] (see also Section 7.4) detection limits in thesub-µg/L range are possible, but this kind of instrumentation is not at everyone’sdisposal. IC/ICP-MS is highly selective due to mass-selective detection of bro-mate, but even this method is not free of interferences (e.g., tribromoaceticacid).
Regarding selectivity and sensitivity, Weinberg et al. [54] presented an interest-ing alternative by introducing the post-column derivatization of bromate withbromide under acidic conditions to form tribromide, Br3
�, which can be de-tected photometrically at 267 nm. The reaction scheme is described by Eqs. (198)and (199):
BrO3� + 5Br� + 6H+ (198)� 3Br2 + 3H2O
Br2 + Br� (199)� Br3�
In a temperature-depending reaction, bromate reacts with bromide under acidicconditions to form bromine, which further reacts with an excess of bromide toform tribromide. The indirect determination of bromate via the formation oftribromide is fascinating; the extinction coefficient for tribromide ofε = 40,900 L mol�1 cm�1 at λ = 267 nm is quite large. Moreover, this methodcan be used for other oxyhalides such as iodate and chlorite. Because the reactionof bromate to tribromide is nothing more than a decrease in the degree of oxi-dation from +5 to �1/3, the reaction requires a reducing agent that is compat-ible with all other reaction components. A combination of HBr and HNO2 hasproved to be suitable for this reaction. Both acids can be generated in situ byutilizing a membrane suppressor with cation exchange groups. For this, a mix-ture of 0.5 mol/L sodium bromide and 0.29 mol/L sodium nitrite is pumpedthrough the suppressor, which is continuously regenerated with sulfuric acid ofc = 0.75 mol/L. HBr and HNO2 are generated in situ by exchanging sodium ionsfor hydronium ions then pumped via a manifold into a knitted reaction coilwhich is heated to 60 °C. Higher temperatures cannot be applied due to theformation of bubbles. As an example, Fig. 7-29 shows the chromatogram of a1-µg/L bromate standard which was obtained by injecting 500 µL standard solu-tion onto an IonPac AS9-HC separator. As can be seen from this chromatogram,a minimum detection limit of 0.5 µg/L bromate can be achieved without anyproblem when injecting such large volumes.
Recently, Wagner et al. [55] developed another derivatization technique for theanalysis of bromate, which can be directly combined with the American EPAMethod 300.1 [56]. In Part A, Method 300.1 describes the separation of the sevenstandard anions bromide, chloride, fluoride, nitrite, nitrate, phosphate, and sul-fate, and in Part B the separation of bromate, bromide, chloride and chlorite onan IonPac AS9-HC high-capacity anion exchanger. The technique developed by

7.2 Spectrometric Detection Methods 505
Wagner et al. is based on the reaction of bromate with o-dianisidine (ODA) inan acidic solution [57] with subsequent photometry of the reaction product at540 nm.
Fig. 7-29. Trace analysis ofbromate by indirect determinationvia tribromide in form of a post-column derivatization. �
Separator column: IonPac AS9-HC; eluant: 9 mmol/L Na2CO3;flow rate: 1 mL/min; detection:photometry at 267 nm afterderivatization with NaBr/NaNO2;reagent flow rate: 0.5 mL/min;reaction temperature: 60°C;suppressor: ASRS-II;regenerant: 0.75 mol/L H2SO4;injection volume: 500 µL;solute concentration: 1 µg/Lbromate (1).
The respective reagent is prepared as follows:Put 300 mL de-ionized water into a 500-mL volumetric flask and add 40 mL
of freshly distilled 70% nitric acid. 2.5 g potassium bromide (reagent grade) areadded to this solution. 250 mg o-dianisidine are dissolved in 10 mL methanol(HPLC grade), which is then added to the nitric acid KBr solution. Finally, thevolumetric flask is filled up to the meniscus with de-ionized water. The reagentis stable for at least a month when kept at room temperature.
As in the reaction yielding tribromide described above, the reaction coil isheated to 60 °C to speed up the derivatization reaction. The authors determinedthe minimum detection limit for bromate according to EPA standards [58] to be0.5 µg/L. A representative chromatogram is shown in Fig. 7-30. The post-columnderivatization with o-dianisidine is only interfered with by large amounts ofchlorite (�200 mg/L) which also reacts with o-dianisidine and elutes ahead ofbromate. Chlorite interferences are only possible, however, if drinking water isdisinfected with a mixture of chlorine dioxide and ozone.

506 7 Detection Methods in Ion Chromatography
Fig. 7-30. Analysis of a bromate standard via see text; reagent flow rate: 0.7 mL/min;derivatization with o-dianisidine (ODA). � reaction temperature: 60°C; injection volume:Separator column: IonPac AS9-HC; eluant: 220 µL; solute concentration: 0.5 µg/L9 mmol/L Na2CO3; flow rate: 1.3 mL/min; bromate, (A) with electronic smoothingdetection: photometry at 450 nm after (Olympic, 25 points, 5 s and 1 repetition),derivatization with ODA; reagent composition: (B) without electronic smoothing.
A very sensitive and selective derivatization technique for the determination ofiodide and iodate in aqueous samples was described by von Gunten et al. [59] intheir recent publication. After separation on an IonPac AS11 anion exchanger, io-dide is determined photometrically as IBr2
� which is formed in a bromide-contain-ing eluant by adding a basic hypobromite solution with subsequent acidification:
I� + OBr� + Br� + 2H+ (200)� IBr2� + H2O
As with many trihalides, IBr2� is also characterized by a strong UV absorption
(absorption maximum: 253 nm; ε = 57,200 L mol�1 cm�1). The measuring wave-length is 249 nm, because the absorption difference between IBr2
� and I3� is
maximal at this wavelength. The instrumental setup illustrated in Fig. 7-31 isrelatively simple. Acidification of both eluant and derivatization reagent is car-ried out with a membrane suppressor, which is positioned between the reactioncoil and the UV detector cell. The suppressor is continuously regenerated withdilute sulfuric acid.
The formation of the interhalide IBr2� according to Eq. (200) can be expressed
as a series of the following reactions:
I� + OBr� (201)� Br� + OI�
OI� + H+ (202)� HOI
HOI + H+ + Br� (203)� IBr + H2O
IBr + Br� (204)� Br2�

7.2 Spectrometric Detection Methods 507
Fig. 7-31. Instrumental setup for the analysis of iodide or iodate via the determinationof IBr2
� and I3�.
The derivatization reagent consisting of a mixture of 5 µmol/L Br2 and 2 mmol/LNaOH with the active species OBr� and Br� has to be adjusted at alkaline pHto avoid disproportionation of hypobromite to bromide and bromate. Only at lowpH are the equilibria of the reactions in Eqs. (202) and (203) on the right side.Therefore, the basic derivatization reagent has to be acidified after passingthrough the reaction coil.
After its separation on an IonPac AS9(-SC) anion exchanger, iodate is deter-mined photometrically as I3
�, which is formed by adding an iodide solutionwith subsequent acidification:
IO3� + 8I� + 6H+ (205)� 3I3
� + 3H2O
The measuring wavelength of 288 nm is also the absorption maximum of I3�
with ε = 38,200 L mol�1 cm�1 (I3� has a second absorption maximum at 351 nm
with ε = 25,700 L mol�1 cm�1). As can be seen from Fig. 7-31, the suppressorfor eluant acidification is positioned between manifold and reaction coil. Directaddition of acid to the derivatization reagent (250 mmol/L KI) is not possible,because the interhalide would be formed via oxidation with oxygen present insolution. The resulting yellow color would greatly increase background absorp-tion and, consequently, baseline noise.
The formation of the interhalide I3� according Eq. (205) can also be expressed
as a series of the following reactions:
IO3� + 2I� (206)� 3HOI
HOI + I� + H+ (207)� I2 + H2O
I2 + I� (208)� I3
The rate-determining step is the reaction in Eq. (206), which is again fast onlyat low pH. Thus, a suppressor is required for eluant acidification.

508 7 Detection Methods in Ion Chromatography
The reactions of iodide and iodate described by Eqs. (200) and (205) are quanti-tative and not interfered by other inorganic water constituents, even if those arepresent in the lower mg/L range. Using this technique, the minimum detectionlimits are 0.1 µg/L for both compounds. Von Gunten et al. successfully appliedthis technique for iodide speciation in various mineral water samples. Exem-plified with a Swiss mineral water, Figures 7-32 and 7-33 show the analyses ofiodide and iodate, respectively.
Fig. 7-32. Trace analysis of iodide in mineral 0.5 mL/min; suppressor: ASRS-II; regenerant:water via indirect determination of IBr2
� by 0.45 mol/L H2SO4; regenerant flow rate: 3 mL/means of post-column derivatization. � min; injection volume: 500 µL mineral waterSeparator column: IonPac AS11; eluant: (Henniez, Switzerland); solute concentration:60 mmol/L NaBr + 1 mmol/L NaOH; flow rate: 0.4 µg/L iodide (1) besides 10 mg/L chloride,1.5 mL/min; detection: photometry at 249 nm 18 mg/L nitrate, 13 mg/L sulfate, andafter derivatization with 5 µmol/L Br2 + 394 mg/L bicarbonate; (taken from [59]).2 mmol/L NaOH; reagent flow rate:
An extremely selective reagent for chromium(VI) is 1,5-diphenylcarbazidewhich forms an analytically useful inner complex with dichromate under acidicconditions.
In this reaction, diphenylcarbazide is oxidized to diphenylcarbazone, while atthe same time chromium(VI) is reduced to chromium(III), which forms a che-late complex with diphenylcarbazide. Like the metal-PAR complexes, it is red-purple colored and, thus, may be photometrically detected at 520 nm. As already

7.2 Spectrometric Detection Methods 509
Fig. 7-33. Trace analysis of iodate in mineral ASRS-II; regenerant: 0.45 mol/L H2SO4;water via indirect determination of I3
� by regenerant flow rate: 3 mL/min; injectionmeans of post-column derivatization. � volume: 500 µL mineral water (Henniez,Separator column: IonPac AS9(-SC); eluant: Switzerland); solute concentration: 0.9 µg/L40 mmol/L B(OH)3 + 20 mmol/L NaOH; flow iodate (1) besides 10 mg/L chloride, 18 mg/Lrate: 1.5 mL/min; detection: photometry at nitrate, 13 mg/L sulfate, and 394 mg/L288 nm after derivatization with 250 mmol/L bicarbonate; (taken from [59]).KI; reagent flow rate: 0.5 mL/min; suppressor:
mentioned, chromate separation is performed by means of anion exchange chro-matography. The high selectivity of this technique is revealed in Fig. 7-34, whichshows the analysis of chromium(VI) in a flue gas scrubber solution. Despitehigh contents of chloride and sulfate, chromium(VI) can be determined in thissample without any interferences.
Fig. 7-34. Analysis of chromium(VI) in a flue gas scrubber solution. �
Separator column: IonPac CS5; eluant: 2 mmol/L pyridine-2,6-dicarboxylicacid + 2 mmol/L Na2HPO4 + 10 mmol/L NaI + 50 mmol/L NH4OAc; flowrate: 1 mL/min; detection: photometry at 520 nm after reaction with 1,5-DPC;reagent composition: 2 mmol/L 1,5-diphenylcarbazide + 0.5 mol/L H2SO4 �
methanol (90:10 v/v); reagent flow rate: 0.5 mL/min; injection: 50 µL sample(1:10 diluted).
Polyvalent anions such as polyphosphates, polyphosphonates, and seques-tering agents are analyzed by anion exchange chromatography with post-columnderivatization using ferric nitrate in acidic solution as a reagent [60]. The reaction

510 7 Detection Methods in Ion Chromatography
of these compounds with iron(III) causes a bathochromic shift of the back-ground absorbance up to the wavelength range between 310 and 330 nm. Be-cause other inorganic anions such as chloride, sulfate, etc. also cause such ashift under these conditions, the detection of complexing agents via derivatiz-ation with iron(III) is only possible in matrices with relatively low electrolytecontent. Occasionally, the selectivity of the method is not sufficient for the analy-sis of complexing agents in detergents, cleansing agents, and wastewaters re-sulting from their production and use. These matrices partially exhibit very highconcentration differences between complexing agents and electrolytes.
Phosphorus-containing complexing agents, in contrast, can be determinedvery selectively. The method is based on the selective determination of polyphos-phonates developed by Baba et al. [61-63]. It was modified appropriately andsuccessfully applied to the analysis of polyphosphates and polyphosphonates indetergents and cleansing agents by Vaeth et al. [64]. Using nitric acid or peroxodi-sulfate at 105 °C, polyphosphates and polyphosphonates are hydrolyzed to ortho-phosphate, which is then reacted in a second step with a molybdate/vanadatereagent to the known phosphorvanadatomolybdic acid. Its absorption is meas-ured at 410 nm. Polyphosphate hydrolysis is quantitative under these conditions;the degradation of phosphonates reaches about 90% to 100% and, therefore,must be checked for each particular phosphonate under the given instrumentalparameters. In comparison with the derivatization with iron(III), it is simpler toobtain chromatograms with this phosphorus-specific detection for such complexmatrices as detergents, because only phosphorus-containing compounds are de-tected. Quantitative analysis is also quite simple. Calibration may be carried outwith orthophosphate because the peak areas are directly proportional to the phos-phorus content of the compound. In addition, phosphorus-specific detection al-lows the use of KCl/EDTA-mixtures as eluants instead of nitric acid. This resultsin shorter conditioning times for the separator column and rules out a potentialhydrolysis of polyphosphates during the separation.
The derivatization with sodium molybdate can also be utilized for the analysisof water-soluble silicate. Its separation can be achieved with both ion-exchange-and ion-exclusion chromatography. With sodium molybdate, silicate also formsthe yellow heteropolyacid H4[Si(Mo3O10)4] and exhibits an absorption maximumat 410 nm.
7.2.1.3 Indirect UV DetectionUV detection may also be performed indirectly. This method is called indirectphotometric chromatography (IPC). Introduced independently by Small et al.[65] and by Cochrane and Hillman [66] in 1982, a UV-absorbing eluant is utilizedfor the determination of UV-transparent ions. In case of anion analysis, theanion exchanger being used is equilibrated with a UV-active eluant Na+E�. Ac-cording to Fig. 7-35 (A), a constant signal at the detector outlet is observed at aconstant flow rate and an appropriate absorption wavelength. If a sample Na+S�

7.2 Spectrometric Detection Methods 511
is injected, the solute anion S� is retained under suitable chromatographic con-ditions and elutes with a certain retention time. The nearly Gaussian-shapedelution profile is shown in Fig. 7-35 (B). Owing to the principle of electroneutral-ity and the ion-exchange equilibrium, the appearance of S� is accompanied bya change in total absorption, while both the total anion concentration (E� andS�) and the concentration of counter ions (Na+) remain constant. In this way,the concentration of S� is determined indirectly by measuring the decreasingUV absorption of E�.
Fig. 7-35. Principle of the indirect photometric detection.
For the analysis of inorganic anions via indirect UV detection, aromatic car-boxylic acid eluants are normally used, as they are in non-suppressed conduc-tivity detection, because they possess a correspondingly high light absorptivity.Small et al. illustrated this with the separation of various inorganic anions asshown in Fig. 7-36; the separation was performed on a latexed anion exchangerusing a sodium phthalate eluant. The anions shown in Fig. 7-36 exhibit no in-trinsic absorption at the measuring wavelength of 285 nm.
When selecting suitable eluants for indirect photometric detection, the chemi-cal and photometric properties of the eluant ions have to be taken into consider-ation. Knowing the absorption properties of the organic acid and the dependenceof its degree of dissociation on the mobile phase pH is essential for a successfulapplication of this method. These criteria were investigated by Small et al. [65]for a series of eluant ions. Phthalate, o-sulfobenzoate, iodide, and trimesateproved to be particularly suited for inorganic anion analysis (see also Section3.7.3). Figure 7-37 reveals that indirect photometric detection also allows the de-tection of carbonate. Owing to its high pK value this ion cannot be determinedtogether with strong mineral acids via suppressed conductivity detection, unlesshydroxide eluants are used. The hydroxide eluants are converted to water in thesuppressor, so the resulting background conductivity is almost zero.
The precise measurement of eluant ion absorption is also extremely importantin indirect photometric detection. It is known from classical spectrophotometry[67] that the photometric error is only small in an absorbance range between 0.2

512 7 Detection Methods in Ion Chromatography
Fig. 7-36. Indirect photometric detection of various inorganicanions. � Separator column: 250 mm � 4 mm i.d. SAR-40-0.6;eluant: 1 mmol/L sodium phthalate (pH 7 to 8); flow rate: 2 mL/min; detection: UV (285 nm, indirect); injection volume: 20 µL;solute concentrations: 106 mg/L chloride (1), 138 mg/L nitrite (2),400 mg/L bromide (3), 310 mg/L nitrate (4), and 480 mg/Lsulfate (5); (taken from [65]).
Fig. 7-37. Indirect photometric detection of weak and strong inorganicacids. � Separator column: see Fig. 7-36; eluant: 1 mmol/L sodiumphthalate + 1 mmol/L H3BO3 (pH 10); flow rate: 5 mL/min; detection:UV (285 nm, indirect); injection volume: 20 µL; solute concentrations:90 mg/L carbonate (1), 70 mg/L chloride (2), 190 mg/L orthophosphate(3), 250 mg/L azide (4), and 500 mg/L nitrate (5); (taken from [65]).
and 0.8. Therefore, the eluant concentration chosen must have a backgroundabsorption that lies within this range. However, because of the ion-exchangecapacity of the separator column and the required elution power, the eluant ionconcentration must be carefully selected. The background absorption must beadjusted accordingly by choosing a suitable measuring wavelength. Indirectphotometric detection is compatible with separator columns of different ion-exchange capacities and with eluants of high and low concentrations. This detec-tion method may be adapted to the chromatographic conditions.

7.2 Spectrometric Detection Methods 513
The measuring wavelength directly affects detection sensitivity. If the molar ex-tinction coefficient of the eluant ion increases due to changes in the measuringwavelength, the detection sensitivity is enhanced, as the absorbance difference be-comes larger at constant eluant ion concentration. The highest sensitivity is ob-tained in the wavelength region of the absorption maximum of the eluant ion.
The principle of indirect photometric detection can also be applied to ion-pairchromatography provided the counter ion of the ion-pair reagent exhibits therespective absorption properties. For example, N-methyloctylammonium-p-tolu-enesulfonate was utilized as an ion-pair reagent to analyze chloride and sulfate[68] upon application of indirect photometric detection. The corresponding chro-matogram is shown in Fig. 7-38.
Fig. 7-38. Ion-pair chromatographic separation ofchloride and sulfate with indirect photometricdetection. � Separator column: 200 mm �
4.6 mm i.d. Zorbax C8; eluant: 1 mmol/LN-methyloctylammonium-p-toluenesulfonate;flow rate: 1.6 mL/min; injection volume: 20 µL;solute concentrations: 35 mg/L chloride (1)and 96 mg/L sulfate (2); (taken from [68]).
In connection with indirect photometric detection, a signal is observed inanion separations via ion-exchange- and ion-pair chromatography that cannot beattributed to any solute ion [68-70]. This signal, usually referred to as the systempeak, changes its size and position depending on the given chromatographicconditions. It represents a potential interference for solute ions eluting in thisrange. A detailed explanation of this phenomenon is found in Section 3.7.3.
Indirect photometric detection is also utilized for cation determinations. Fig-ure 7-39 illustrates the separation of sodium, ammonium, and potassium witha copper sulfate eluant obtained by Small et al. [65]. Aromatic bases as cationicanalogues to aromatic acids used in anion analysis are inappropriate as eluantsfor this detection method. As monovalent cations, they are already eluted byoxonium ions. Thus, a significant change in absorption is only observed whenthe protonated base cation itself contributes to the ion-exchange process.
In summary, it must be pointed out that indirect photometric detection ischaracterized by a higher sensitivity than non-suppressed conductivity detection,while it is markedly less sensitive than suppressed conductivity detection. Theuse of indirect photometric detection is preferred for the determination of major

514 7 Detection Methods in Ion Chromatography
Fig. 7-39. Indirect photometric detection of sodium, ammonium, andpotassium. � Separator column: Dowex 50; eluant: 5 mmol/L coppersulfate; flow rate: 0.7 mL/min; detection: UV (252 nm; indirect); injectionvolume: 20 µL; solute concentrations: 230 mg/L sodium (1), 180 mg/Lammonium (2), and 391 mg/L potassium (3); (taken from [65]).
components when it is desirable to avoid an extensive dilution of the sample.With direct sample injection, typical detection limits for inorganic anions are inthe medium to high µg/L range.
7.2.2Fluorescence Detection
In ion chromatography, fluorescence detection is mainly utilized in combinationwith post-column derivatization, because inorganic anions and cations, with theexception of the uranyl cation, UO2
2+, do not exhibit any fluorescence. Fluor-escence results from the excitation of molecules via absorption of electromag-netic radiation; it is the emission of fluorescence radiation when the excitedsystem returns to the energetic ground level. The emitted wavelength is charac-teristic to the kind of molecule while the intensity is proportional to concen-tration.
The best known and most widely used fluorescence method was developed byRoth and Hampai [71] for the detection of primary amino acids, and was de-scribed in Section 5.9.2. It is based mainly on the reaction of α-amino acids witho-phthaldialdehyde (OPA) and 2-mercaptoethanol to yield an intensively blue-fluorescing complex. Even at room temperature, the reaction occurs within se-conds. At an excitation wavelength of 340 nm and an emission wavelength of455 nm, this method has a detection limit in the low pmol range. The derivatiza-tion with o-phthaldialdehyde is applicable to all compounds carrying a primaryamino group. This includes the ammonium ion, primary amines, polyamines,and peptides.

7.2 Spectrometric Detection Methods 515
The only drawback of the fluorescence method developed by Roth and Hampaiis the relatively small stability of the N-substituted 1-alkylthioisoindoles that areformed from α-amino acids after reaction with OPA. This severely limits theapplicability of OPA for the pre-column derivatization of primary amines.
Much higher stabilities and partly higher fluorescence yields were obtained byStobough et al. [72]. Naphthaline-2,3-dialdehyde (NDA), which reacts in the pres-ence of cyanide ions with primary amines to N-substituted 1-cyanobenz[ f ]-isoindoles (CBI), was used as a reagent:
The excitation spectrum of these derivatives shows maxima at 246 nm and420 nm; the emission is measured at a wavelength of 490 nm. At an excitationwavelength of 246 nm, detection limits are obtained in the medium to low fmolrange. However, secondary amines can be subjected to the two derivatizationmethods described above only after oxidation.
The phosphorus-specific detection demonstrated in Section 7.2.1.2 using theanalysis of polyphosphates and polyphosphonates is a characteristic example ofa two-step post-column derivatization that is now possible. The analysis of asecondary amine via a two-step derivatization and fluorescence detection is ex-emplified with an herbicide � the glyphosate [N-(methylphosphono)-glycine].
After its separation on a 8-µm cation exchanger (Pickering Laboratories, MountainView, CA, USA) it is oxidized to glycine with hypochlorite at 36 °C and sub-sequently reacted with OPA and N,N-dimethyl-2-mercaptoethylamine-hydrochlo-ride (Thiofluor) to yield a strongly fluorescing isoindole. In comparison with thetraditionally used 2-mercaptoethanol, Thiofluor offers the advantages of beingcompletely inodorous and more stable in solution. The instrumental setup for this

516 7 Detection Methods in Ion Chromatography
post-column derivatization consisting of two reagent pumps, two reaction coils(one has to be heated), and a column oven is schematically depicted in Fig. 7-40. Ifthe backpressure of the analytical column falls below 3.4 MPa, the reagent pumpsare automatically switched off. This safety switch prevents the derivatization re-agent from diffusing back onto the analytical column. As seen in the correspond-ing chromatogram in Fig. 7-41, even the main glyphosate metabolite � aminome-thanesulfonic acid (AMPA) � may be detected in the same run. After AMPA iseluted, the separator column is regenerated with 5 mmol/L KOH for two minutesand then conditioned with the eluant for seven minutes, before the next samplecan be injected. Based on an injection volume of 50 µL, the minimum detectionlimit for glyphosate is 1.8 µg/L. The glyphosate method is linear in the investigatedconcentration range between 0.05 mg/L and 10 mg/L [73]
Fig. 7-40. Schematics of the two-step derivatization for the analysis of glyphosate.
Another derivatization technique for forming fluorophores has been describedby Lee and Fields [74]. They reacted oxidizable inorganic anions such as nitrite,thiosulfate, and iodide with cerium(IV), thereby forming fluorescing cerium(III)according to Eqs. (209), (210), and (211):

7.2 Spectrometric Detection Methods 517
Fig. 7-41. Two-step derivatization of Thiofluor; reagent 1: 100 µL 5% hypochloriteglyphosate with subsequent fluorescence solution per bottle of hypochlorite diluentdetection. � Separator column: 150 mm � (Pickering); reagent 2: 100 mg OPA + 2 g4 mm i.d. glyphosate column (Pickering Thiofluor + 10 mL methanol per bottle of OPALaboratories); column temperature: 55°C; diluent (Pickering); injection volume: 100 µL;eluant: 5 mmol/L potassium phosphate solute concentrations: 2.5 mg/L each of(pH 2); regenerant: 5 mmol/L KOH; flow rate: aminomethanephosphonic acid (1) and0.4 mL/min; detection: fluorescence after glyphosate (2).oxidation with NaOCl and reaction with
HNO2 + 2Ce4+ + H2O (209)� NO3� + 2Ce3+ + 3H+
2S2O32� + 2Ce4+ (210)� S4O6
2� + 2Ce3+
2I� + 2Ce4+ (211)� I2 + 2Ce3+
Cerium(III) may be detected at an excitation wavelength of 247 nm and an emis-sion wavelength of 350 nm. To stabilize the cerium(IV) reagent, it is preparedin 0.5 mol/L sulfuric acid. The addition of sodium bismutate serves to oxidizepossible cerium(III) traces in the reagent, which keep the background fluor-escence as low as possible.
For the reaction of the column effluent with the cerium(IV) reagent, Fields etal. used a solid-bed reactor with a volume of 2.8 mL instead of a simple reactioncoil. This relatively large volume is necessary to ensure the required reactiontime of at least two minutes for the oxidation of nitrite ions with cerium(IV).While the reaction of nitrite ions with cerium(IV) is comparatively slow, themaximum fluorescence yield with iodide is obtained in less than ten seconds.On the other hand, the reaction kinetics with thiosulfate appears to be com-pletely different. As seen in the diagram in Fig. 7-42, this reaction is also charac-terized by a fast rise of the fluorescence yield within a short time and it increaseseven further because the reaction product from Eq. (210), tetrathionate, alsoreacts slowly with cerium(IV).
The choice of the eluant is decisively important for achieving maximum sensi-tivity. According to Fields et al., for the ion-exchange chromatographic separationof the three investigated anions in a single run, potassium hydrogenphthalate or

518 7 Detection Methods in Ion Chromatography
succinic acid may be used as an eluant. Succinic acid exhibits lower backgroundfluorescence. Figure 7-43 shows the chromatogram of a 1.2-nmol standard ofthese three anions, obtained on Vydac 302 IC with a potassium hydrogenphthal-ate eluant. The detection limit obtained with this method is in the low µg/Lrange for all three investigated anions. Even though it does not differ consider-ably from that of direct UV detection, the specificity of this method is signifi-cantly better, especially for samples having a high sodium chloride content.
Fig. 7-42. Time dependencesof the fluorescence yield for thereactions of nitrite, thiosulfate,and iodide with cerium(IV);(taken from [74]).
Fig. 7-43. Analysis of nitrite,thiosulfate, and iodide utilizingfluorescence detection afterderivatization with cerium(IV). �
Separator column: Vydac 302 IC;eluant: 1 mmol/L KHP + 10 mmol/LNa2SO4, pH 5.5 with Na2B4O7; flowrate: 1 mL/min; detection: fluorescenceafter reaction with cerium(IV); injectionvolume: 100 µL; solute concentrations:0.5 mg/L nitrite (1), 1.1 mg/Lthiosulfate (2), and 1.5 mg/Liodide (3); (taken from [74]).
Another important application of the redox system cerium(III)/cerium(IV) isindirect fluorescence chromatography (IFC) of alkali- and alkaline-earth metals.As with indirect photometric detection (IPC), an eluant with a high background

7.2 Spectrometric Detection Methods 519
fluorescence is utilized which is lowered during the solute ion elution. Hence,negative signals are registered for analyte species. While it has been known forsome time that an aqueous cerium(III) solution exhibits fluorescence [75, 76]and, as described above, is used analytically [74], only the works of Danielson etal. [77, 78] confirmed that strongly diluted cerium(III) solutions can also beemployed to elute alkali metals and ammonium. The cerium(III) concentrationrequired for an almost baseline-resolved separation of monovalent cations is only10�5 mol/L. Figure 7-44 shows such a chromatogram, with a total analysis timeof less than eight minutes. Lithium cannot be determined under these chromato-graphic conditions, because it elutes within the system void. The detection limitsobtained for monovalent cations (3 µg/L for sodium and 100 µg/L for cesium)are comparable to the limits of other detection methods such as indirect photo-metric detection and conductivity detection. Again, in samples with complexmatrices, the higher specificity of IFC is advantageous. This also applies to theindirect fluorescence detection of alkaline-earth metals that was described byBächmann et al. [79]. Because a higher cerium(III) concentration is necessary toelute divalent cations, a significantly higher background fluorescence results thatadversely affects baseline quality.
Fig. 7-44. Analysis of monovalent cations with indirect fluorescencedetection. � Separator column: 100 mm � 3.2 mm i.d. ION-210;eluant: 10�5 mol/L cerium(III) sulfate; flow rate: 1 mL/min; detection:indirect fluorescence; injection volume: 20 µL; solute concentrations:0.16 mg/L sodium (1), 0.15 mg/L ammonium (2), 0.21 mg/Lpotassium (3), 0.71 mg/L rubidium (4), and 1.2 mg/L cesium (5);(taken from [77]).
Indirect fluorescence detection also applies to anion analysis [80,81]. Mho andYeung [80] utilized salicylate as fluorescent eluant ions. Owing to their structuralsimilarities to phthalate and benzoate, these ions exhibit good elution properties.Salicylate shows a strong absorption at 325 nm and a fairly efficient emission at420 nm. An HeCd laser with double-beam optics that emits polarized UV lightwith a wavelength of 325 nm at a power of about 7 mW was used as an excitation

520 7 Detection Methods in Ion Chromatography
source. However, with regard to sensitivity, the method does not differ from theabove-described cation analysis technique using cerium(III); i. e., the detectionlimits obtained for inorganic anions such as iodate and chloride correspond tothose of indirect photometric detection and conductivity detection. This can beexplained by the fact that the eluant ion concentration (sodium salicylate) ofabout 2.2·10�4 mol/L necessary to elute solute ions is usually too high. The fullpotential of this analytical method will only be exploited when it becomes pos-sible to manufacture separator columns with extremely low ion-exchange ca-pacities that allow the use of very dilute eluants.
Nimura and Kinoshita [82] developed a derivatization technique for the analysisof fatty acids that is based on 9-anthryldiazomethane (ADAM). The latter is verystable in solution and reacts with fatty acids at room temperature without a catalystto yield strongly fluorescent esters, which can be chromatographed on an ODS phasewith acetonitrile/water mixtures. The derivatization of fatty acid is carried out with a0.1% methanolic solution of 9-anthryldiazomethane, which is prepared via oxi-dation of 9-anthraldehyde-hydrazone following a procedure by Nakaya et al. [83]. Thefluorescence- and excitation spectra of fatty acid-methylanthracene esters exhibitmaxima at 412 nm and 365 nm, respectively. As an example, Fig. 7-45 shows the sep-aration of ADAM derivatives � a mixture of saturated and unsaturated long-chainfatty acids � which can be detected down to the lowest pmol range.
Fig. 7-45. Separation of ADAM derivatives (a) degradation product of the derivatizationof a mixture of long-chain fatty acids. � reagent, (b) not reacted derivatization reagent,Separator column: 250 mm � 4 mm i.d. 30 to 80 ng each of the derivatives (1) C10:0,Lichrosorb RP8 (5-µm); eluant: acetonitrile- (2) C12:0, (3) C18:3, (4) C14:0, (5) C18:2,water (90:10 v/v); flow rate: 1.1 mL/min; (6) C16:0, (7) C18:1, and (8) C18:0 (fatty acidsdetection: fluorescence after derivatization are characterized by two numbers: the first onewith ADAM; excitation wavelength: 365 nm; is the number of C-atoms, the second one isemission wavelength: 412 nm; injection the number of double bonds);volume: 10 µL; solute concentrations: (taken from [82]).

7.3 Other Detection Methods 521
7.3Other Detection Methods
Apart from the detection methods described thus far, refractive index detectionis sometimes mentioned in the literature, although this detection method is veryinsensitive and, above all, unspecific. In contrast to other detection methods,refractive index detection is subject to much fewer restrictions. The refractiveindex of the eluant has no influence, because the measurement is usually carriedout by comparing the refractive index of the column effluent with that of thepure eluant present in the reference cell. Thus, the sensitivity of this detectionmethod solely depends on the detector performance. Commercially available de-tectors are usually designed for the detection of higher concentrations. For theseparation of inorganic anions and their detection via changes in the refractiveindex, organic acids such as phthalic acid [69, 70, 84], salicylic acid [84],p-hydroxybenzoic acid [84], and o-sulfobenzoic acid [84] are utilized as eluants.Figure 7-46 illustrates such a chromatogram. The only advantage of refractiveindex detection is the ability to use comparatively concentrated eluants, whichallow the use of high-capacity ion exchangers.
Fig. 7-46. Refractive index detection of variousinorganic anions. � Separator column: 250 mm �
4.6 mm i.d. Vydac 302 IC; eluant: 6 mmol/L sodiumhydrogenphthalate, pH 4.0; flow rate: 2 mL/min;injection volume: 100 µL; solute concentrations: 2.5 to7.5 mg/L each of chloride (1), nitrite (2), bromide (3),nitrate (4), iodide (5), and sulfate (6); (taken from [85]).
The combination of an ion chromatographic separation with a radioactivitymonitor (type LB505, Berthold, Wildbad, Germany) for the analysis of radio-strontium was described by Stadlbauer et al. [86]. The objective of their studywas the development of a method for the simple separation of the fission prod-ucts Sr-90 and Sr-89 from other radionuclides such as barium (Ba-133) which,

522 7 Detection Methods in Ion Chromatography
like Cs-137, is a companion of Sr-90/Sr-89 and is formed with a similar yield(about 6%) in a nuclear reactor. Stadlbauer et al. separated these ions on a sur-face-sulfonated cation exchanger that was connected to a scintillation detectorcell. Figure 7-47 shows the chromatogram of a Sr-90 standard that was obtainedwith this setup. The peak volume in this chromatogram corresponds to 76.4 Bqof Sr-90. Although online detection of radiostrontium is only feasible at mediumto high activity concentrations, this method provides advantages for process con-trol and self-monitoring of nuclear-medical- and nuclear power plants. The frac-tionated collection of the column effluent makes it possible to obtain Sr-90 inpure form from samples that have a high calcium excess or a complex radioac-tive contamination by various nuclides. It may be determined offline via a meth-ane flow counter.
Fig. 7-47. Analysis of Sr-90 utilizing aradioactivity monitor. � Separator column:IonPac CS2; eluant: 30 mol/L HCl + 2 mmol/Lhistidine hydrochloride; flow rate: 1.5 mL/min;detection: scintillation measurement for Sr-90;injection volume: 50 µL; solute concentration:76.4 Bq Sr-90 with inactive SrCl2 as a carrier.
7.4Hyphenated Techniques
In recent years, the coupling of ion chromatography with element-specific detec-tion methods has increasingly gained importance. Element-specific detection iscarried out with atomic spectrometric techniques including atomic absorptionspectrometry (AAS), atomic emission spectrometry (ICP-OES) as well as thecoupling between ICP and mass spectrometry (ICP-MS).
The coupling of an atomic absorption spectrometer with an ion chromato-graph is relatively straightforward. It only requires a capillary that connects theseparator column outlet with the nebulizer of the AAS instrument [87]. When

7.4 Hyphenated Techniques 523
choosing an eluant for analyte separation, it is important to prevent a high back-ground signal and a quick sooting of the burner by the mobile phase. As earlyas 1980, Woolson and Aharonson [88] utilized this method for the determinationof arsenic(III) and arsenic(V).
7.4.1IC-ICP Coupling
Today, ICP-OES [89] is one of the most important methods for trace metal analy-sis; in combination with mass spectrometry [90] it is even used for ultra-tracemetal analysis. The advantage of coupling those techniques with ion chromato-graphy includes the ability to separate and detect metals with different oxidationstates. The analytical interest in chemical speciation is based on the fact that theoxidation state of an element determines toxicity, environmental behavior, and bio-logical effects. Chromium(VI), for example, is highly toxic even in very smallamounts, whereas chromium(III) compounds are essential for lipid- and carbo-hydrate metabolism. On the other hand, heavy and transition metals often have tobe determined in samples with very complex matrices such as body fluids, in whichthe concentration ratio between transition metals and alkali- and alkaline-earthmetals is usually 1:106 or even greater. Thus, considerable interferences in atomicspectrometric trace metal analysis may result. When modifying the sample to beanalyzed by ion chromatographic techniques, the advantages of both methods arecombined, so that many of these problems are solved. The performance of ICP-OES/ICP-MS is generally better than that of individual methods.
In ICP-OES, the analytical signal is generated via the atomic emission process.If a sample enters the inductively coupled plasma � a strongly ionized gas withtemperatures between 6,000 K and 10,000 K � the solvent evaporates at first.Small particles are left behind, which also evaporate and partly dissociate intoatoms and ions. During relaxation of these atoms and ions to a lower energylevel, every element emits radiation of a characteristic wavelength, while theintensity of this radiation is proportional to the element concentration. ICP-OESspectrometers are offered in two versions. In a so-called simultaneous spec-trometer, a holographic grating splits the polychromatic radiation coming fromthe plasma into distinct wavelengths or emission lines, which are detected byphotomultiplier tubes. Spectral resolution is between 0.1 nm and 0.5 nm. Simul-taneous spectrometers allow the simultaneous analysis of up to 60 elements inthe mid to low µg/L range; reproducible signals are also achieved with transientsamples. Sequential spectrometers are less suitable for coupling with ion chro-matographs because they require a steady-state concentration of sample over atime period of 10 s, which is never the case in chromatography.

524 7 Detection Methods in Ion Chromatography
ICP-OES is not free of interferences. Physical interferences, for example, arecaused by viscous samples or by samples with high amounts of dissolved solidssuch as sea water, brines, or urine, which clog the nebulizer and lead to flow varia-tions. Although interferences of this kind can be minimized by diluting thesample, the sensitivity of the technique suffers depending on the dilution factor.Chemical interferences result from changes in the efficiency of evaporation, atom-ization and ionisation, which are caused by high concentrations of easily ionisedelements such as sodium and potassium. Again, diluting the sample is the onlysolution to the problem, even in light of the negative consequences. Last but notleast, there are spectral interferences in ICP-OES, which result from the overlap-ping of emission lines. Spectral interferences can be mathematically corrected byanalyzing a known concentration of the interfering element and determining theratio of the emission intensity for the element of interest. Even though it is possibleto compensate for all these interferences, coupling with ion chromatography helpsto minimize them and expands the application range of ICP spectrometers.
A characteristic example of the performance of IC/ICP-OES is the speciationof chromium [91, 92]. The common ion chromatographic method is based onthe transformation of chromium(VI) into 1,5-diphenylcarbazone complexes fol-lowing separation on an anion exchanger. Those complexes can be determinedphotometrically at 520 nm (see Section 7.2.1). For the separation of chro-mium(III)/chromium(VI) a mixed-bed ion exchanger is used as a stationaryphase, on which chromium(III) is eluted as a cation and chromium(VI) as ananion. Detection is carried out via post-chromatographic oxidation of chro-mium(III) to chromium(VI) with peroxodisulfate and catalytic amounts of silvernitrate at elevated temperature (see Section 4.5.3). Chromium(VI) can then bedetected directly by measuring its light absorption at 365 nm or, more specifi-cally, by post-column derivatization with 1,5-DPC. Because element-specific de-tection with a simultaneous spectrometer only requires a few seconds, the timeaspect has to be considered with respect to the preceding chromatographic sepa-ration. A very fast separation of chromium(III)/chromium(VI) is obtained on a50 mm � 4 mm i.d. latexed anion exchanger, which is typically used as a guardcolumn. However, its separation power is more than sufficient for separatingthese two species. Oxy metal anions are retained on this stationary phase and,thus, separated from metal cations, which elute as one peak in the system void.In this way it is possible to simultaneously determine metal cations and oxymetal anions. The separation of chromium(III)/chromium(VI) in Fig. 7-48 wasobtained with 0.1 mol/L nitric acid as an eluant. Acidic eluants have proved tobe especially suitable, because the concentration ratio between chromium(III)and chromium(VI) stays constant over several days when the samples to be ana-lyzed are acidified. Thus, dilution is the only sample preparation required whenusing a nitric acid eluant. In addition, the solutes are present in nitric acid aftertheir chromatographic separation, which is of great advantage for the subsequentatomic spectrometric detection. Stannate, vanadate, and molybdate can be sepa-rated and detected under similar chromatographic conditions [93].

7.4 Hyphenated Techniques 525
Fig. 7-48. Separation of chromium(III)/chromium(VI) with element-specific detection. � Separator column: 50 mm � 4 mm i.d. OmniPacPAX-100; eluant: 0.1 mol/L HNO3, pH 2 with NH4OH; flow rate:2 mL/min; detection: ICP-OES (Spectroflame Modula, Spectro, Kleve,Germany); measuring wavelength: 267.716 nm; injection volume: 250 µL;solute concentrations: 0.1 mg/L each of chromium(III) andchromium(VI); (taken from [91]).
Quantitation is carried out based on peak heights or peak areas. The statisticaldata for this method are summarized in Table 7-5. As can be seen from thisdata, reproducibility of quantitation depends on the kind of data evaluation.The minimum detection limits which are calculated for both chromium speciesprove that this method is suitable for determining small amounts of chro-mium(III) and chromium(VI).
Significantly lower detection limits can be achieved with ICP-MS as a detec-tion method. Early results obtained with this hyphenated technique were basedon a concentric nebulization, which led to relatively broad peaks due to bandbroadening inside the nebulizer [94]. Powell et al. [93] applied the method ofdirect injection (DIN, Direct Injection Nebulization) for chromium speciation inenvironmental samples. Using this method, band broadening of the steady-statesignals is reduced to a minimum due to the absence of a nebulizer [95]. Thesample is introduced via an injection valve that is connected to a 10-µL injectionloop. Via a switching valve, the sample is directed into the plasma either througha micro column for chromium(III)/chromium(VI) separation, or through a by-pass loop for determining total chromium. The plasma chamber and switchingvalve are connected with a 1.5 mm i.d. capillary. Powell et al. used a Sciex Elan

526 7 Detection Methods in Ion Chromatography
Table 7-5. Statistical data for the analysis of chromium(III)/chromium(VI) with element-specificdetection.
Cr(III) Cr(VI)
Peak height Peak area Peak height Peak area
Correlation coefficient of the �0.9999 �0.99999 �0.999 �0.99999linear calibrationc = 0.02 � 1 mg/L
Reproducibility [%] 1.2 0.7 1.6 0.7(n = 10; c = 0.1 mg/L)
Rel. standard deviation of �0.1 �0.1retention times [%]Rel. standard deviation of the 0.32 0.26 0.85 0.4linear calibration function [%]
Minimum detection limit [mg/L]*) 0.015 0.012 0.047 0.035
*) Determination was carried out following DIN 32645.
5000 ICP-MS spectrometer with a resolution of 0.8 Da. The sample introductionsystem of this instrument was replaced by the DIN system. Chromium determi-nation was carried out via m/z 52, because Cr52 produces larger signals thanCr53. Quantitative results are obtained by peak area evaluation with an algorithmin the instrument software. With an optimized system, minimum detection lim-its for total chromium, chromium(III), and chromium(VI) are 30, 60, and 180ng/L, respectively. In comparison to the photometric method after derivatizationwith 1,5-DPC, those values are lower by one order of magnitude. The only spec-tral interference for Cr52 in aqueous solution is Ar36O16, which is responsiblefor a slightly increased background signal from a blank solution. In addition,Roehl et al. [96] reported matrix interferences, if the sample to be analyzed con-tains large amounts of carbon, sulfur, and chloride. In this case, Cr52 is inter-fered by Ar40C12 and S36O16, Cr53 by Cl37O16. Powell et al. successfully demon-strated the power of IC/ICP-MS for chromium speciation in industrial wastewat-ers.
Another important example for the benefit of IC/ICP-OES or IC/ICP-MS isthe speciation of arsenic. For this purpose, Urasa et al. [97] coupled an ion chro-matograph to a DCP atomic emission spectrometer2) by connecting the separatorcolumn and nebulizer with a capillary that was slightly modified [98]. A generalproblem of DC plasma detection is the relatively poor sensitivity, which is attri-buted to both the inadequate nebulization efficiency and the dilution of thesample during the chromatographic process. In comparison with direct DCP-AES, the dilution effect alone accounts for a reduction in signal intensity by 50%to 75%. Urasa et al. compensated for this by injecting large sample volumes
2) DCP: Direct Current Plasma

7.4 Hyphenated Techniques 527
(up to 1000 µL). Alternatively, they investigated the applicability of concentratorcolumns for improving the sensitivity. It turned out that 10 µg/L arsenic(V) maybe correctly determined by concentrating a sample volume of 100 mL. This rep-resents a significant improvement over direct DCP-AES, which is less sensitiveby two orders of magnitude.
Heitkemper et al. [99] applied element-specific detection for the simultaneousdetermination of arsenic(III)/arsenic(V) in food additives. The separation shownin Fig. 7-49 was obtained on a latexed anion exchanger with a NaOH eluant.
Fig. 7-49. Separation of arsenic(III)/arsenic(V)with element-specific detection. � Separatorcolumn: IonPac AS4A (-SC); eluant: 40 mmol/LNaOH; flow rate: 1 mL/min; suppressor:AMMS-II; regenerant: 12.5 mmol/L H2SO4;detection: ICP-OES; measuring wavelength:193.7 nm; injection volume: 100 µL; soluteconcentrations: 5 mg/L each of arsenic(III) andarsenic(V); (taken from [91]).
Because the human body metabolizes inorganic arsenic by reductive meth-ylation, all the reaction products have to be analyzed. ICP-MS is the only detec-tion method that can achieve the required minimum detection limits for arsenic(low µg/L range) in body fluids. However, in body fluids such as urine with itshigh chloride content, interferences are observed due to the formation of Ar+Cl�,which has a mass-to-charge ratio (m/z 75) equal to that of arsenic. When coup-ling the ICP-MS with a high-capacity anion exchanger, this interference can beeliminated, because chloride is well separated from the arsenic compounds ofinterest. Figure 7-50 shows the analysis of a human urine sample (chromato-gram A) containing a relatively high concentration of 400 µg/L arsenate, whichthe patient incorporated orally by drinking contaminated well water. Despite thehigh chloride concentration, neither overloading effects nor other interferencesare observed. The various arsenic compounds can be separated to baseline onIonPac AS7 with a NaOH/Na2CO3 gradient. Arsenite cannot be detected underthese conditions, because it is oxidized to arsenate in the mobile phase at highpH. Chromatogram B in Fig. 7-50 reveals that after one week the amount of

528 7 Detection Methods in Ion Chromatography
excreted arsenic has decreased to 1/50 of the original value. The minimum detec-tion limits for methylarsonic acid, dimethylarsinic acid, and arsenobetain re-ported in literature are between 2 µg/L and 5 µg/L (based on an injection volumeof 20 µL) [100].
Fig. 7-50. Simultaneous determination of ICP-OES; measuring wavelength: 193.7 nm;various arsenic species in human urine with analytes: (1) arsenobetain, (2) methylarsonicelement-specific detection. � Separator acid, (3) dimethylarsinic acid, (4) chloride, andcolumn: IonPac AS7; eluant: NaOH/Na2CO3 (5) arsenate; (A) after oral incorporation of agradient; flow rate: 1 mL/min; injection contaminated well water, (B) after one week;volume: 100 µL; suppressor: AMMS-II; (taken from [91]).regenerant: 12.5 mmol/L H2SO4; detection:
In this conjunction, the integration of a hydride generator in front of the sampleintroduction system of the ICP-MS described by Roehl et al. [93] and Schlegelet al. [101] should also be mentioned. It increases sensitivity for various arsenic-and selenium compounds by a factor of 2 to 5. It is true that in hydride forma-tion with the subsequent separation of gas and liquid, temperature has to bestrictly controlled for reproducibility reason, but detection is much more specificbecause molecular interferences do not occur. Mattusch and Wennrich [102] alsoseparated anionic, neutral, and cationic arsenic compounds such as arsenite,dimethylarsenic acid, arsenobetain, and arsenocholine on IonPac AS7, but useda very steep nitric acid gradient. Arsenobetain and arsenocholine are retained,above all, by hydrophobic interactions with the stationary phase.

7.4 Hyphenated Techniques 529
IC-ICP can be applied for the speciation of a number of other compounds.An interesting application of DC plasma detection is the method developed byBiggs et al. [103] for the determination of polyphosphates, which were separatedon a neutral PS/DVB-based polymer phase by means of ion-pair chromatogra-phy. The separation of the phosphate oligomers P1 to P12 in neutralized poly-phosphoric acid was carried out with tetraethylammonium nitrate as an ion-pairreagent and by applying a potassium nitrate gradient. In contrast to expectations,the rise of the salt concentration during the gradient run did not cause a baselinedrift nor did it affect the response factor. A representative chromatogram of apolyphosphoric acid sample neutralized with tetraethylammonium hydroxide isshown in Fig. 7-51. The detection limit of this method is 0.2 µg P.
Fig. 7-51. Analysis of polyphosphoric acid upon application of DCplasma detection. � Separator column: 150 mm � 4.1 mm i.d.PRP-1; eluant: (A) 10 mmol/L tetraethylammonium nitrate (pH 9),(B) 10 mmol/L tetraethylammonium nitrate + 0.1 mol/L KNO3 (pH 9);gradient: linear, 1% B to 40% B in 18 min; flow rate:1.2 mL/min; detection: DC plasma; emission wavelength: 214.9 nm;injection: 20 µL of a solution with ca. 60 µg P; external standard:8.24 µg P as orthophosphate; (taken from [103]).

530 7 Detection Methods in Ion Chromatography
7.4.2IC-MS Coupling
The second important hyphenation is the coupling of an ion chromatograph toa mass spectrometer; this combination provides the analyst with information onanalyte structure and molecular weight. While mass-selective detection in gaschromatography became routine years ago, the coupling of a liquid chromato-graph to a mass spectrometer is problematic, because the relatively largeamounts of liquid mobile phase are not compatible with the high vacuum in theion source of a mass spectrometer. To solve these incompatibility problems, vari-ous types of LC-MS interfaces have been developed, which are briefly introducedin the following discussion. The most important characteristic of a LC-MS in-terface is the transfer of analyte molecules from the separator column into thehigh vacuum of a mass spectrometer. This means that an analyte molecule dis-solved in the mobile phase has to make the transition to an analyte moleculeisolated in the gas phase. To achieve high sensitivity, as many analyte moleculesas possible have to be transferred, while the mobile phase constituents have tobe largely removed. The maximum amount of liquid that can be introduced intothe high vacuum of a mass spectrometer without increasing pressure in the ionsource depends solely on the capacity of the vacuum pumps. Because the feedrate of modern turbomolecular pumps is between 0.3 and 0.7 m3/s, the intakeof water is limited to 1.8 µL/min. Conventional separator columns in ion chro-matography are operated at 1 mL/min, so only 0.2% of that amount of liquidcan be directly introduced into the vacuum system. These numbers impressivelydemonstrate the dimension of this incompatibility problem. It can be solved byremoving a large amount of solvent before the analytes enter the high vacuum.Split techniques as well as microbore columns with a small inner diameter of2 mm and low flow rates of 0.25 mL/min also help to significantly decrease theamount of liquid. Combinations of all these measures can also be applied.
An additional problem are the electrolytes that are used for separating ionicspecies on ion exchangers. Such separations cannot be easily performed withoutelectrolytes. Therefore, volatile eluants such as ammonium sulfate have to beused, which can be pumped out of the ion source. A second solution to thisproblem are continuously regenerated suppressor systems (see Section 3.6 and4.3), with which eluants can be desalted prior to entering the MS interface. It istrue that the use of a suppressor system limits the choice of eluant [104]. Mean-while, however, so many ion exchangers for anion- and cation chromatographyare available that anions and cations can be eluted efficiently and with highresolution using NaOH or mineral acids eluants. Because these ion exchangersare usually also solvent compatible, even surface-active anions can be eluted byadding organic solvents to the mobile phase. As early as 1990, Simson et al.[105] successfully employed a micromembrane suppressor for desalting eluants.They placed it between the anion exchanger and the thermospray interface and

7.4 Hyphenated Techniques 531
determined a residual sodium concentration of 13-30 µmol/L when pumpingan eluant concentration of 10�100 mmol/L. Conboy et al. [106] also utilizedsuppressors for their investigations on quaternary ammonium compounds andorganic sulfonates and sulfates, placing them between separator column and in-terface.
Particle-Beam InterfaceMore than 25 years of research in the field of LC-MS has resulted in the develop-ment of a number of different interfaces, some of which are commercially avail-able today. Widely distributed interfaces include particle-beam-, thermospray-and APCI interfaces (APCI, Atmospheric-Pressure Chemical Ionization), whichare briefly described here together with some characteristic applications. In aparticle-beam interface [107, 108], the column effluent is fed either pneumati-cally or by thermospray nebulization into a desolvation chamber. The chamberis close to atmospheric pressure and connected to a jet separator, which sepa-rates the high molecular weight analytes from the low molecular weight elu-ant molecules. The analyte molecules are then transferred as small particles atalmost the speed of sound into a conventional EI/CI ion source, where theydisintegrate in evaporative collisions with a heated target. The released mol-ecules are ionized by electron impact (EI) or chemical ionization (CI). Reviewarticles on this subject were published by Creaser and Stygall [109] and Capiello[110]. The schematic diagram of a particle-beam interface (HP 59980A) is illus-trated in Fig. 7-52.
Fig. 7-52. Schematic diagram of a particle-beam interface (HP 59980A).
Most commercial systems utilize a pneumatic, concentric nebulizer that typicallyconsists of a 100-µm fused-silica capillary, through which the column effluent isdirected. A helium flow (1-3 L/min) circumvents the end of this capillary. Afternebulization, the solvent is evaporated from the droplets in the externally heateddesolvation chamber. Temperature is generally kept at about 50-70 °C. As a resultof the high pumping efficiency in the jet separator, the pressure in the desolv-ation chamber generally is sub-ambient, i. e. between 20 and 30 kPa. The design

532 7 Detection Methods in Ion Chromatography
of the jet separator is based on the development by Winkler et al. [111] (Fig.7-53). By means of two mechanical pumps, the pressure of 25 kPa in the desolv-ation chamber is reduced to 10 kPa in the first pumping region, to 30 Pa in thesecond pumping region, and to 2 · 10�3 Pa in the ion source. The submicronparticles formed during the desolvation process strike the walls of the ion source,which is kept at about 250 °C, and evaporate. The released molecules are ionizedby EI or CI. Other ionization techniques such as FAB (Fast Atom Bombardment)[112] and laser desorption ionization [113] in combination with a particle-beaminterface are also described in the literature. A special feature of the setup illus-trated in Fig. 7-52 is the two sample introduction systems (particle-beaminterface and direct insertion probe) at two opposite sides of the ion source.Upon switching from EI to CI operation mode, a “Plunger assembly” in the ionsource is advanced towards the quadrupole mass analyzer, changing the effectiveionization chamber from an open configuration to a more enclosed one. LC-MS in-vestigations with a particle-beam interface are usually carried out with quadru-pole mass spectrometers. In addition, Finnigan MAT and Micromass also offercommercial solutions based on sectorfield instruments.
Fig. 7-53. Schematicdiagram of a jet separatoraccording to Winkler et al.[111].
The most important characteristic of a particle-beam interface is the possibilityto obtain EI spectra, which can be evaluated according to known rules and com-pared to those of spectra libraries. For obtaining a meaningful spectrum of asubstance, an absolute amount of 10 to 100 ng is required. In 90% of all appli-cations EI ionization is applied; in 20% of the applications EI ionization is com-bined with chemical ionization in the positive ion mode. All other CI appli-cations are carried out in the negative ion mode.
A characteristic example for a successful coupling of an ion chromatographto a mass spectrometer via a particle-beam interface is described by Hsu [114]who analyzed aromatic sulfonic acids in leachates. Hsu used an OmniPac PAX-500 multimode phase in the microbore format to separate the sulfonic acids.The compounds of interest were eluted with a mixture of NaOH and acetonitrile

7.4 Hyphenated Techniques 533
under gradient conditions. This eluant mixture is very well suited for the desalt-ing process via a membrane-based suppressor system. To minimize extra-col-umn band broadening, the suppressor was also used in the microbore format.Prior to assembling the suppressor, the membranes were cleaned with organicsolvents to remove potential organic contaminants resulting from the manufac-turing process. Membrane-based suppressor systems exhibit a limited pressurestability of 0.7 MPa, which is a disadvantage. However, the pressure stability issufficient enough to withstand the backpressure of a particle-beam interface. Asan example, Fig. 7-54 shows the chromatogram of a leachate extract utilizing UVdetection at 254 nm (A) and PBMS in the EI mode (B). Sample preparation wascarried out following the method by Kim [115]. In the first step, the leachate islyophilized to remove water and volatile organic compounds. The residuum isdissolved in methanol. Then acetone is slowly added to this solution to precipi-tate inorganic salts. The supernatant solution is then filtrated and concentratedwith a rotary evaporator. The methanolic extract can be injected directly. As canbe revealed from Fig. 7-54, three significant peaks could be detected in such anextract. In good agreement with an earlier publication [115], the mass spectra ofthese compounds are identical and correspond to p-chlorobenzenesulfonic acid(PCBSA) and its o- and m-isomers.
Fig. 7-54. Separation of a leachateextract on a multimode phase utilizingUV detection (A) and particle-beammass spectrometry (B) in the EI mode.� Separator column: OmniPac PAX-500 (250 mm � 2 mm i.d.); flow rate:0.25 mL/min; eluant: NaOH �
acetonitrile; gradient: linear, 9 mmol/LNaOH�ACN (90:10 v/v) to 50 mmol/LNaOH�ACN (80:20 v/v) in 8 min, thento 80 mmol/L NaOH�ACN (73:27 v/v)in 5 min, then to 120 mmol/LNaOH�ACN (60:40 v/v) in 5 min;detection: (a) UV (254 nm), (b) PBMS,EI mode; injection volume: 5 µL; (takenfrom [114]).
The corresponding mass spectrum of the main peak is shown in Fig. 7-55 (top)and compared to that of a respective standard (bottom). In both cases, the back-ground signal has been subtracted. Smaller signals such as m/z 104 and m/z186 correspond to p-xylenesulfonic acid, m/z 94 and m/z 158 to benzenesulfonicacid, which are both present as impurities. Although the application of a particle-beam interface is limited to analytes with a significant vapour pressure in the

534 7 Detection Methods in Ion Chromatography
Fig. 7-55. Comparison of the mass spectra of p-chlorobenzenesulfonic acidin a standard (a) and a leachate extract (b) utilizing PBMS in the EI mode(taken from [114]).
ion source, it is still significant in relation to other LC-MS interfaces. The majorreason for that is the ability to generate EI mass spectra online. Another limi-tation in the applicability of PBMS is the fact that it can only be applied tomolecules �1000 Da. The lack of sensitivity in the lower ng range can be com-pensated, for example, by pre-concentration techniques [116], which are essentialfor a more widespread distribution in environmental analysis.
Thermospray InterfaceIn the technique known as “thermospray” [108, 117, 118] volatile electrolytesdissolved in the eluant are nebulized out of a heated vaporizer tube. As a resultof heating, the liquid is nebulized and partially vaporized. The capillary is heatedunder controlled conditions to avoid complete evaporation of the liquid in thecapillary. Unvaporized solvent and sample are carried into the ion source asmicro droplets or particles in a supersonic jet of vapour. By applying efficientpumping directly at the ion source, up to 2 mL/min of aqueous solvents can beintroduced into the MS vacuum system. The ionization of volatile analytes takesplace by means of ion-molecule reactions in the gas phase; non-volatile samplesmay be ionized by direct ion evaporation processes from highly charged droplets

7.4 Hyphenated Techniques 535
or particles. The CI reagent gas can be made either in a conventional way usingenergetic electrons from a filament or discharge electrode, or in a process calledthermospray ionization, where the volatile buffer dissolved in the eluant is in-volved. Figure 7-56 shows the schematic diagram of a thermospray interface withan electrically heated capillary, in which the column effluent is nebulized andpartially evaporated, forming an ultrasonic jet of vapour containing a mist offine droplets or particles. As the droplets travel at high velocity through theheated ion source, they continue to vaporize due to the rapid heat input fromthe surrounding hot vapour. A portion of the vapour and ions produced in theion source escapes into the vacuum system of the mass spectrometer throughthe entrance cone, and the remainder of the excessive vapour is pumped awayby a mechanical vacuum pump. The heart of the thermospray interface is theelectrically heated stainless steel tube that has an internal diameter of 0.1 to0.15 mm. The vapour produced by vaporizing 1 mL/min of solvent is about onehundred times the amount that can be accommodated by a typical mass spec-trometer equipped for chemical ionization. The thermospray ion source allowshigh mass flows to be vaporized by using a very tight ion chamber similar tothat used in chemical ionization but with a mechanical vacuum pump (about300 L/min) attached directly to the source chamber through a port opposite thevaporizer. The source block is strongly heated; temperature is monitored with asensor. The vaporizer tip is surrounded by a separately heated block that allowsthe region cooled by the rapid adiabatic expansion to be properly heated withoutoverheating the portions of the ion source further downstream. Thoriated irid-ium filaments are used instead of tungsten or rhenium filaments to achieve asatisfactory operating life under conditions of high pressures of water and sol-vent vapours. But even with thoriated iridium filaments, it is difficult to maintainsatisfactory emission at high flows of water; the discharge electrode overcomesthat problem.
A characteristic feature of thermospray ionization is the presence of am-monium acetate or another volatile electrolyte that contributes to the ionizationprocess. For a predominant number of compounds the mass spectra obtainedwith thermospray can be interpreted based on the knowledge about ion-moleculereactions observed in the CI mode. The major differences are that the pressurein a thermospray source may be somewhat higher (typically 2-20 Torr) comparedwith typical CI and the gas throughput is very much higher. In conventionalCI, the gas flows involved are typically in the range of 1-20 mL/min, while inthermospray, the vapour flow is in the range of 0.5�2 L/min. In a conventionalCI source, ionization is initiated by high-energy electrons. If water vapour isused as the CI reagent gas, the initial process is:
H2O + e� � H2O+ + 2e� (212)
The water molecular ions react on virtually every collision to produce the hydro-nium ion by the proton transfer reaction:

536 7 Detection Methods in Ion Chromatography
Fig. 7-56. Schematic design ofa thermospray interface.
H2O+ + H2O � H3O+ + OH (213)
The hydronium ion does not react further with water except to form clusters bythe reaction:
H3O+ + 2H2O � H3O+(H2O) + H2O (214)
Clustering may continue by a similar set of reactions:
H3O+(H2O)n + 2H2O � H3O+(H2O)n+1 + H2O (215)
with n = 0, 1, 2, …
The distribution of hydrated hydronium ions observed in the CI mass spectrum isdetermined by the equilibrium constants for the reactions described with Eq. (215)and the temperature and pressure in the ion source. Hydronium ions do not reactfurther with water vapour, but if samples with higher proton affinity than water arepresent, they will react according to proton transfer reactions such as:
H3O+ + M � MH+ + H2O (216)
Polar samples of lower proton affinity may react by displacing a water moleculefrom a cluster, for example:
H3O+(H2O) + M � H3O+(M) + H2O (217)
Samples that are both less basic and less polar than water will not react and conse-quently will not be detected in the positive-ion CI spectrum when water is the re-agent. One solution to this kind of problem is to employ negative ions. In the nega-

7.4 Hyphenated Techniques 537
tive-ion mode, hydroxide ions can be produced that react with molecules moreacidic than water vapour to form the deprotonated anion. If an electron beam ordischarge is used to produce the initiate ionization, an excess of thermal electronsis also formed in the high pressure source. These may attach to molecules of highelectron affinity to form M� ions. Thus, both (M�H)�- and M� ions may be ob-served in the CI spectrum, depending on the relative acidity and electron affinityof the sample. If the sample has low electron affinity and is less acidic and lesspolar than water vapour, it will not be detected in the negative-ion mode.
In most respects, the thermospray ion source behaves as a conventional CIsource. The only major difference is the relatively high gas flow involved inthermospray at conventional liquid chromatography flow rates. When an elec-tron-emitting filament or discharge is used to initiate ionization, the processesoccurring in the thermospray ion source appear to be identical to those occurringin a conventional CI source. In chemical ionization, fragment ions may be ob-served in addition to the usual protonated and deprotonated molecular ions. Theonly fragments observed are those that are unreactive with the gas in the ionsource. The extent of fragmentation is determined by the internal energy of theions at formation. More acidic reagents and higher temperatures tend to inducemore fragmentation in the positive-ion mode, while less acidic reagents tend toproduce more fragmentation in the negative-ion mode. In addition, a thermallylabile molecule may fragment prior to ionization, with the fragments then beingionized, for example, by proton transfer. It is often difficult to determine whetherfragmentation or ionization occurred first under CI conditions because the prod-ucts are very often the same.
HPLC methods based on standard bore columns can be combined with ther-mospray without any modifications. Thermospray works best at LC flow ratesbetween 0.5 and 1.5 mL/min. Flow rates outside that range are also possible butcompromise sensitivity. Volatile salts and compounds such as ammonium ace-tate, ammonium formate, ammonium alkylsulfonates, trifluoroacetic acid, andtetrabutylammonium hydroxide are suitable as mobile phases. Phosphates andalkali salts in the mobile phase should be avoided in any case.
Biochemistry has many uses for LC-MS. While biochemical macromoleculessuch as nucleosides and nucleotides [119], peptides and proteins [120�122] arealready investigated by LC-MS quite extensively, very little has been publishedabout sugar oligomers. This might be due to the incompatibility of NaOH orNaOH/NaOAc mobile phases used for separating carbohydrates by anion ex-change chromatography with online mass-selective detection. The publication bySimpson et al. [105] cited above can be regarded as a breakthrough on this issue.Simpson et al. managed to desalt NaOH/NaOAc eluants with a membrane sup-pressor prior to entering the thermospray interface. Simpson et al. investigatedmono- and di-amino sugars for the first time in this way. However, the smallnumber of protonated dimeric molecular ions in the corresponding mass spectraindicates thermal degradation in the thermospray interface. Niessen et al. [123]

538 7 Detection Methods in Ion Chromatography
attributed this thermal degradation of sugar oligomers to the presence of am-monium acetate in the eluant; this causes a thermally induced ammonolysisof oligosaccharides into their monomers. If sodium acetate is used instead ofammonium acetate, intact sodium-containing molecular ions are obtained formaltodextrins in the positive-ion mode after desalting with two membrane sup-pressors in series. Niessen et al. [123, 124] applied this system to the analysis ofoligosaccharides after enzymatic degradation of plant cell wall polysaccharidesusing a Finnigan MAT TSQ-70 tandem mass spectrometer. Because the mem-brane suppressor used for desalting has a limited pressure stability of about0.7 MPa, and because the thermospray interface requires a solvent pressure ofabout 4 MPa, a so-called booster pump was installed between the suppressorand the thermospray interface. The booster pump solves the pressure incompati-bility by increasing the flow rate to the more favourable 2 mL/min. In the mani-fold, 1 mL/min of a dilute aqueous sodium acetate solution was added to achieveionization. The ion-exchange capacity of two membrane suppressors in seriesis sufficient to exchange sodium ions up to a maximum concentration ofc = 0.4 mol/L for hydronium ions. This represents a kind of limitation as theelution of higher oligosaccharides requires sodium acetate concentrations up to0.5 mol/L. Thus, when rinsing the separator column with higher sodium acetateconcentrations, the separator column and interface have to be disconnected.
In gradient elution with sodium acetate, a background signal is observed thatcan be attributed to the formation of sodium acetate cluster ions. They are dis-tributed throughout the spectrum (m/z = 187, 269, 351 and subsequent valuesat 82 amu increments), corresponding to the general formula [(NaOOCCH3)n +Na]+. In general, some contamination of the ion source through the presence oftoo high sodium acetate concentrations in the mobile phase was not found tobe detrimental to sensitivity. During operation, the ion source was kept at 350 °C,which is assumed to reduce the contamination by sodium acetate.
As a result of the presence of sodium acetate cluster ions, in general no peaksare observed in the total-ion-current chromatograms. This means that the actualanalyte signals must be searched for, using the known and/or expected m/zvalues for the oligosaccharides. Because fragmentation does not occur, the oligo-saccharide of interest can be identified by a molecular-mass-related peak in themass chromatogram. The mass spectra of oligosaccharides obtained under theseconditions contain strong peaks due to the sodiated molecule, i. e. [Mr + Na]+ atm/z = Mr + 23. As an example, Fig. 7-57(A) shows the mass spectrum of sucrose.Especially with the smaller oligomers, a signal is also observed at m/z = Mr +45, though in lower abundance, which can be attributed to [Mr � H + 2Na]+.This peak is assumed to result from the competition between hydronium- andsodium ions in the neutralization of the sugar anions in the suppressor. For theoligosaccharides with higher DP values (DP � 4), doubly charged disodium ionsare observed, i. e. [Mr + 2Na]2+ at m/z = (Mr + 46)/2. Triply charged ions are notobserved. Uronic acids were also analyzed by Niessen et al. Their mass spectra

7.4 Hyphenated Techniques 539
contain signals such as [Mr + Na]+ at m/z = Mr + 23, [Mr � H + 2Na]+ at m/z =Mr + 45 as well as a sodiated fragment peak caused by the loss of water fromthe acid, [Mr + Na � H2O] at m/z = Mr + 5. In the mass spectrum of digalactu-ronic acid (Mr = 370), shown in Fig. 7-57(B), these peaks are found at m/z =393, 415, and 375; a peak due to the sodiated disodium salt at m/z = 437 isalso observed.
The expected m/z ratios for sodiated sugar oligomers can be calculated usingthe values in Table 7-6. For example, an oligosaccharide with the composition(Glc)4(Xyl)2(Fuc) is expected to give a peak at m/z = 203 + 3 � 162 + 2 � 132 +146 = 1099, while the expected doubly charged ion is detected at m/z = (1099 +23)/2 = 561.
LC/MS data for α-1,4-glucans up to DP10 based on a reversed-phase separa-tion using a dilute aqueous sodium acetate mobile phase (c = 10�4 mol/L) werealso reported by Niessen et al. [125]. With HPAEC-MS α-1,4-glucans could bedetected up to DP6. For higher oligomers, high sodium acetate concentrationsare required that can no longer be sufficiently removed by the membrane sup-pressor. In the HPAEC-MS analysis of an arabinan digest, α-1,5-arabinose oligo-mers up to DP9 could be detected, while oligomers up to DP15 were readilydetectable by pulsed amperometric detection. The total-ion-current chromato-gram of an MID run of the arabinan digest is shown in Fig. 7-58. As with otheroligosaccharide samples, a dramatic decrease in response is observed at higherDP values. However, the peaks of interest are readily detected by mass spec-trometry. Other homologous series of oligosaccharides such as β-1,4-galactans(up to DP6) and β-1,4-xylans (up to DP15) could also be detected by HPAEC-MS.
With the introduction of CarboPac PA-100 (see Section 3.10), HPAEC-MSanalysis of oligosaccharides could be improved significantly. CarboPac PA-100allows the elution of oligosaccharides at a relatively low sodium acetate concen-tration, so that HPAEC-MS is applicable for sugar oligomers with a higher de-gree of polymerization. With α-1,4-glucans, for example, oligomers up to DP6can be detected with CarboPac PA1, while oligomers up to DP12 are detectedwhen separated on CarboPac PA-100. Thus, the limiting factor for the detectionof higher DP values is the concentration of these oligomers in the sample to beanalyzed. In such samples, oligomers with DP > 10 often contribute less than1% in the weight distribution. In practice, less than 0.2 nmol of DP10 is injected.
The application of the negative-ion mode is also promising, because bettersensitivities are obtained for higher oligosaccharides. Niessen et al. [126] testedthe negative-ion mode for α-1,4-glucose- and arabinogalactose oligomers. Themass spectra obtained under these conditions are surprisingly complex. Forsmaller α-1,4-glucose oligomers up to DP4, primarily three ions are detected:[M � H]� at m/z = Mr � 1, [M + OAc]� at m/z = Mr + 59, and [M + HSO4]�
at m/z = Mr + 97. At DP � 4 the acetate- and hydrogensulfate adducts are mostabundant, whereas for DP5 to DP7 the deprotonated molecule is most abundant,and at DP � 7 the doubly charged ions are most abundant. The most abundant

540 7 Detection Methods in Ion Chromatography
Fig. 7-57. Mass spectra of (A) sucrose and 20 min; flow rate: 1 mL/min; detection:(B) digalacturonic acid with HPAEC-MS. � thermospray MS (Finnigan MAT TSQ-70) inSeparator column: CarboPac PA1; eluant: the positive-ion mode and MID mode, scan0.1 mol/L NaOH � NaOAc; gradient: linear, range m/z = 150 to 1500 in 3 s; injection0.1 mol/L NaOAc to 0.3 mol/L NaOAc in volume: 25 µL; (taken from [123]).
doubly charged peak is due to [M + SO4]2�, and doubly deprotonated ions andacetate- and hydrogensulfate adducts are also observed. In general, the formationof adduct ions is unfavourable to sensitivity, because the ion intensity is spreadover a number of peaks instead of being concentrated in only one peak. How-ever, when summing the peak areas of the most important peaks, it appears thata much better response is achieved in the negative-ion mode than in the positive-ion mode for most DP values, especially for the higher values. Negative-ion

7.4 Hyphenated Techniques 541
Table 7-6. m/z values and m/z increments for sodium-containing oligosaccharides.
Sugar m/z Increment Example(1+) (2+)
Aldopentose 173 132 66 Ribose, xylose, arabinoseDeoxyaldohexose 187 146 73 Rhamnose, fucoseAldohexose 203 162 81 Glucose, mannose, galactoseKetohexose 203 162 81 FructoseHexuronic acids 217, 239 176 88 Glucuronic acid, galacturonic acid4-O-Methyl-hexuronic acids 231, 253 190 95 4-O-Methylglucuronic acid
Fig. 7-58. HPAEC-MS analysis of an arabinan for 5 min, then to 0.1 mol/L NaOH + 0.5 mol/Ldigest. (A) Mass chromatogram of singly NaOAc in 35 min; flow rate: 1 mL/min;charged ions from DP2 (m/z = 305) to DP9 detection: thermospray MS (Finnigan MAT(m/z = 1229) and (B) mass chromatogram of TSQ-70) in the MID mode, m/z = 173, 305,singly and doubly charged ions for DP9 (m/z = 437, 569, and 701 for 23 min, then m/z = 428,626 und 1229). � Separator column: CarboPac 494, 560, 626, 692, 833, 965, 1097, 1229, andPA1; eluant: 0.1 mol/L NaOH�NaOAc; 1361 for 12 min, 5 s per scan; injectiongradient: linear, 0.1 mol/L NaOH isocratically volume: 25 µL; (taken from [124]).

542 7 Detection Methods in Ion Chromatography
detection may be especially helpful in more advanced studies directed at struc-ture elucidation, because deprotonated molecules are more readily fragmentedthan sodiated molecules observed in the positive-ion mode.
This brings up the interesting topic of the origin of the various ions detected.The observation of deprotonated ions and acetate adducts is not very surprising.As a result of the removal of sodium ions by the suppressor, the solvent enteringthe mass spectrometer is acetic acid with concentrations that follow the sodiumacetate gradient. The observation of hydrogensulfate- and sulfate adducts indi-cates that the sulfuric acid that is used for suppressor regeneration has leakedthrough the membrane. Such a diffusion through the membrane, which onlyoccurs if the suppressor is chemically regenerated with sulfuric acid, signifi-cantly influences ionization conditions in the thermospray source. It might alsoprove to be useful in the negative-ion detection of other compounds.
With the advent of new, more versatile and more robust LC-MS interfacesbased on atmospheric-pressure ionization, the use of thermospray will rapidlydiminish. However, the above-mentioned applications in sugar analysis as wellas a large number of other applications in organic ion analysis such as phenoxy-acetic acids [128], quaternary ammonium pesticides [129, 130], anionic surfac-tants [131, 132], sulfated azo dyes [133, 134], sulfonamides [135], and β-lactamantibiotics [136, 137] have proved the potential of this coupling technique inqualitative and quantitative analysis.
Electrospray InterfaceElectrospray ionization (ESI) is an atmospheric-pressure ionization technique(API). In an electrospray interface, the column effluent is nebulized into anatmospheric-pressure ion source. The nebulization is due to the application ofan electric field that results from a potential difference (up to 5 kV) between thenarrow-bore spray capillary (needle) and a surrounding counter electrode. Thesolvent emerging from that needle breaks into fine threads that subsequentlydisintegrate in small droplets. With progressive solvent evaporation, the ionsinside the droplets, the charge of which is opposite to that of the applied field,migrate to the surface. During this process, the charge density at the surfaceincreases so much that those droplets undergo electrohydrodynamic Raleigh in-stabilities, which results in a number of much smaller droplets with a relativelylarge number of charges. In a very complex process [138] that is not yet com-pletely understood, repetitive Coulombic droplet explosion may take place, lead-ing to ions in the gas phase. The emitted ions are then directed into the quadru-pole mass analyzer by electrostatic lenses. A detailed monography about thissubject was published by Cole [139].
The electric field required to generate aerosol largely depends on the surfacetension of the solvent. If the composition of the column effluent remains con-stant, nebulization is not a problem. However, in the case of gradient elution,where eluant composition and, consequently, surface tension are changing withtime, nebulization can be a problem. A rather elegant solution to this problem

7.4 Hyphenated Techniques 543
is the pneumatically assisted electrospray ionization (“IonSpray”) developed byPerkin-Elmer Sciex, in which a sheath gas assists in the formation of droplets.A schematic diagram of this ionization process is shown in Fig. 7-59.
Fig. 7-59. Schematic diagram of the ionization process in electrospray ionization(“IonSpray”, Perkin-Elmer Sciex).
ESI is especially appropriate for LC flow rates in the lower µL/min range.When a liquid chromatograph utilizing conventional separator columns with4.6 mm internal diameters is coupled to ESI, the column effluent has to be splitwith a ratio of 0.01 prior to entering the interface. Higher flow rates up to500 µL/min are compatible with thermally assisted electrospray [140], whichheats the spray capillary to 150�240 °C. Ultrasonic nebulizers [141] in combi-nation with a sheath gas for drying and focussing are also suited for higherflow rates.
In an interface for chemical ionization at atmospheric pressure (APCI), aero-sol formation occurs in a heated tube with nitrogen as a reagent gas; the solventis completely evaporated in the tube. The gas-vapour mixture is then directedinto the atmospheric-pressure ion source, in which chemical ionization is in-itiated by electrons that are generated at the corona discharge needle. The solventvapour acts as a reagent gas. The charge is transferred to the analyte moleculesby ion-molecule reactions (cluster formation and declustering of ions). Sub-sequently, the ions generated are sampled into the high vacuum of a mass spec-trometer for mass analysis. Figure 7-60 schematically depicts the APCI ioniz-ation process.
Both ionization modes can be operated in the positive- and negative-ion modeto obtain either protonated or deprotonated molecular ions as well as sodium-,potassium-, ammonium-, formate-, or acetate adducts. Because atmospheric-pressure ionization is a “soft” ionization technique (i. e. molecular ions are pre-dominantly formed and fragmentation is very rare) the mass spectra of singlecomponents do not exhibit many signals. Under suitable MS conditions (voltage

544 7 Detection Methods in Ion Chromatography
Fig. 7-60. Schematic diagram of the ionization process in APCI(“Heated Nebulizer”, Perkin-Elmer Sciex) [141].
increase at the electrostatic lenses) or in tandem mass spectrometry, fragmen-tations can be induced for a more detailed structural elucidation. Such fragmen-tations, however, differ from those observed in electron impact ionization (EI).Because spectral libraries for API-MS do not exist at present, the ability to iden-tify unknowns is rather limited.
Although ESI-MS/MS was originally developed for the analysis of high molec-ular weight organic compounds, it can also be applied to the analysis of stronglypolar and ionic compounds. Charles et al. [143] applied this technique for thefirst time to the trace analysis of bromate in water at sub-µg/L levels. The ionchromatographic separation was carried out on an IonPac AG9-SC guard col-umn. The optimal flow rate for ESI-MS/MS detection of 50 µL/min was obtainedby a 1:20 split utilizing a T-piece of very low dead volume. However, the tra-ditional carbonate/bicarbonate eluant for this column is not compatible withESI-MS/MS detection, because bicarbonate forms a non-volatile residue duringthe evaporation process. This residue would precipitate around the entrancecone and eventually block it. Also, sensitivity is compromised when using acarbonate/bicarbonate eluant compared with pure de-ionized water. One of thetwo ways to reduce the electrolyte content in the column effluent prior to en-tering the electrospray interface is the use of a suppressor system. Alternatively,an electrolyte has to be selected that is compatible with ESI and capable of elut-ing bromate. For example, ammonium sulfate can be used; it elutes bromate ata concentration of c = 27.5 mg/L. If the ammonium sulfate solution is preparedwith 90% (v/v) methanol instead of pure de-ionized water, nebulization andsubsequent evaporation is supported which, in turn, increases sensitivity by a

7.4 Hyphenated Techniques 545
factor of 10. Because the stationary phase used for the separation is solvent-compatible, such an eluant can be used without any problem. In the course ofsample preparation, anions that have a negative influence on separation or detec-tion have to be removed. These anions include bicarbonate, sulfate, and chloride.The negative effect of bicarbonate on ESI-MS/MS detection was mentionedabove. However, it can easily be removed by using a SPE cartridge filled with acation exchanger in the hydrogen form (OnGuard-H, Dionex Corporation). As aresult of this cation exchange process, carbon dioxide is formed due to thesample acidification. The carbon dioxide can be removed by sparging the samplewith helium. Sulfate at concentrations c � 20 mg/L also interferes with theanalysis. If sulfate is present in the sample at higher concentrations, SPE car-tridges such as OnGuard-Ba (cation exchanger in the barium form) are used forprecipitating sulfate. Higher concentrations of chloride are precipitated with thecation exchanger in the silver form (OnGuard-Ag).
In the mass spectrum, bromate is detected at m/z = 127 and 129, whichreflects the natural occurence of the two evenly distributed bromine isotopes79Br and 81Br. After fragmentation of both ions in the second quadrupole (Q2),the product ions can be analyzed in the third quadrupole (Q3). In the course offragmentation, bromate can loose one, two, or three oxygen atoms to yieldBrO2
�, BrO�, and Br�, respectively, as the products. Due to the isotope distri-bution, six transitions generally result that can be registrated in the multiple-reaction-monitoring mode (MRM): 127/111, 127/95, 127/79, 129/113, 129/97,and 129/81. Because a high background signal is observed after the elution ofbromate, which is attributed to the formation of HSO4
� (m/z = 97), only thefirst four transitions are selected to obtain a perfectly resolved chromatographicsignal such as that of a 1-µg/L bromate standard in Fig. 7-61. With this tech-nique, Charles et al. calculated a minimum detection limit for bromate of0.1 µg/L; the standard deviation for n = 7 is 1.9% at this concentration level.
Fig. 7-61. Chromatogram of a 1-µg/L bromatestandard with ESI-MS/MS detection. � Separatorcolumn: IonPac AG9-SC; eluant: 27.5 mg/Lammonium sulfate � methanol (10:90 v/v); flowrate: 1 mL/min; detection: ESI-MS/MS in thenegative MRM mode (127/111, 127/95, 127/79,and 129/113); sample volume: 5 mL; sample:1 µg/L bromate standard in de-ionized water;(taken from [143]).

546 7 Detection Methods in Ion Chromatography
In a recently published paper, Charles and Pepin [144] extended the ESI-MS/MS technique developed for trace analysis of bromate to the analysis of otheroxyhalides such as chlorite, chlorate, and iodate that can occur when drinkingwater is ozonated (see Section 9-1). Because chlorine also occurs in two isotopicforms, oxychlorides are detected in the negative-ion mode at two different m/zvalues: m/z = 67 and 69 for ClO2
�, and m/z = 83 and 85 for ClO3�. Iodate is
detected at m/z = 175. The fragmentation of these ions also results from thesuccessive loss of oxygen atoms. The eluant mixture consisting of ammoniumsulfate and methanol developed for the analysis of bromate cannot be used forthe analysis of oxyhalides, because it is contaminated with chlorate. For thisreason, the authors used ammonium nitrate as an eluting agent. Because theaffinity of nitrate towards the stationary phase is lower than that of sulfate, itsconcentration has to be increased accordingly. Optimal separations between io-date and chlorite, the elution order of which is reversed due to the high methanolcontent in the mobile phase [145], are obtained with 65 mg/L ammonium nitratein the mobile phase. As an example, Fig. 7-62 shows the chromatogram of adrinking water sample, in which 1.95 µg/L chlorate could be detected. Detectionwas carried out following the transitions 35ClO3
�/35ClO2� (83/67) and 37ClO3
�/37ClO2
� (85/69). With this technique, the minimum detection limits for iodate,chlorite, and chlorate are 0.5, 1.0, and 0.05 µg/L, respectively.
Fig. 7-62. Trace analysis of chlorate indrinking water with ESI�MS/MSdetection. � Separator column: IonPacAG9-SC; eluant: 65 mg/L ammoniumnitrate � methanol (10:90 v/v); flow rate:1 mL/min; detection: ESI�MS/MS in thenegative MRM mode (83/67, 85/69);sample volume: 5 mL; sample: drinkingwater with 1.95 µg/L chlorate as well as11.9 mg/L chloride, 6.7 mg/L nitrate,19.3 mg/L sulfate, 129.4 mg/Lbicarbonate, 13.7 mg/L sodium, 3.7 mg/Lpotassium, 9.4 mg/L magnesium, and25.8 mg/L calcium; (taken from [144]).
Finally, the IC-MS method that Mohsin [146] developed for the analysis oforganophosphorous and organosulfur compounds in an insecticide such asmonomethylphosphate, monomethylsulfate, and dimethylphosphate should bereviewed. All three compounds were separated on an IonPac AS11 anion ex-changer using a NaOH/methanol mixture as an eluant. Mohsin desalted theeluant with an Alltech 1000HP suppressor, which contains two packed bed sup-pressor columns. One of the suppressor columns is used for suppression, whilethe other one is electrochemically regenerated at the same time. The suppressoreffluent is split 99:1 and mixed with acetonitrile/water (90:10 v/v) containing0.5% ammonium hydroxide. Detection is carried out in the negative-ion mode.

7.4 Hyphenated Techniques 547
Ammonium hydroxide increases the pH of the mobile phase entering the elec-trospray interface and, thus, supports negative ion formation. The two com-pounds monomethylphosphate and monomethylsulfate, identified in the insecti-cide by electrospray MS, exhibit the same mass-to-charge ratio of m/z = 111, butdiffer in their mass spectra due to differences in the fragmentation and isotopedistribution of the [M-H]� ions.
At present, electrospray interfacing is the most widely used technique for in-troducing liquid into a mass spectrometer. In addition, electrospray ionizationis a very efficient ionization technique that significantly extended the analyticalpotential of mass spectrometry. Today, both electrospray ionization and chemicalionization at atmospheric pressure (APCI) are standard methods in LC-MS. Al-though the majority of current publications deals with the characterization ofbiologically relevant macromolecules, the few examples introduced above under-line the significance of electrospray interfaces for the sensitive detection andstructural elucidation of ionic compounds. The dominating role of electrosprayis attributed, above all, to its ease-of-use, high sensitivity, reliability, and robust-ness. The future will show whether new interface techniques will supersedeelectrospray in its current dominant role for LC-MS.