Detection and Isolation of Batch-to-Batch Parametric Drift...
13
Detection and Isolation of Batch-to-Batch Parametric Drift in Crystallization Using In-Batch and Post-Batch Measurements Joseph Sang-Il Kwon, † Michael Nayhouse, † and Panagiotis D. Christofides* ,†,‡ † Department of Chemical and Biomolecular Engineering, University of California, Los Angeles, California 90095, United States ‡ Department of Electrical Engineering, University of California, Los Angeles, California 90095, United States ABSTRACT: In this work, we focus on the development of a parametric drift detection and isolation (PDDI) method for the handling of batch-to-batch parametric drifts in a batch crystallization process used to produce hen egg-white (HEW) lysozyme crystals. We consider that the batch crystallization process is controlled by an in-batch model predictive control (MPC) system and is subject to batch-to-batch parametric drifts in the solubility, growth rates, continuous-phase mass and energy balance parameters, and nucleation rate. The proposed PDDI scheme consists of two parts: preparatory stage before batch-to-batch operation and post-batch stage during batch-to-batch operation. The goal of the preparatory stage is to compute the threshold values and signatures for each parametric drift using simulations and batch process common cause variance described by noise. During batch-to-batch operation, the proposed PDDI system monitors closed-loop process residuals, which are computed by taking the difference between the time profiles of the states obtained through in-batch and postbatch measurements from the time profiles of the states obtained from the drift-free simulation with noise. While the measurements of the protein solute concentration and the temperature in the crystallizer are available in real-time, post-batch measurements are usually available for the quality of the crystal products (e.g., number of crystals, average crystal size and shape) and this key characteristic is taken into account in the PDDI method. We then compare the residuals with signatures obtained in the preparatory stage for each parametric drift for isolation of a parametric drift. The PDDI system estimates the magnitude of the parametric drift and updates the parameters of the batch process model used in the in-batch MPC system to compute a set of jacket temperatures for the production of crystals with a desired shape distribution in the next batch. The performance of the MPC with the proposed PDDI scheme is demonstrated by applying it to a multiscale simulation of a batch crystallization process with parametric drifts in the solubility and crystal growth rates. The closed-loop system simulations demonstrate that crystals with a crystal shape distribution that is closer to a desired set-point value are produced under a parametric-drift handling scheme that integrates the in-batch MPC with the proposed PDDI system compared to those under the MPC with the nominal process model. ■ INTRODUCTION Modeling and control of batch crystallization is of significant interest to the pharmaceutical industry, because the bioavail- ability of drugs is highly dependent on the size and shape distributions of their active pharmaceutical ingredients. Within this context, the dominant dynamic behavior of the evolution of key crystallization variables is modeled through a process model, which is used to compute a set of manipulated inputs that drives the average crystal shape to a desired setpoint at the end of the batch. However, because of unknown batch-to-batch parametric drifts, the process model employed for in-batch control and estimation purposes may significantly deviate from the actual process behavior. For example, a small batch-to-batch change in the pH level or impurity concentration in the feedstock container may significantly alter the quality (e.g., size and shape) of the crystal products. Model-free control schemes, such as a proportional− integral−derivative (PID) control scheme, are not able to handle constraints on the inputs, outputs, and the rate of change of inputs while computing optimal jacket temperature values. Therefore, the necessity of incorporating the constraints to account for the physical limitations on the manipulated inputs and operating conditions makes model-based control strategy (e.g., refs 1−4) the method of choice for crystal size distribution control. More specifically, the model predictive control (MPC) scheme was employed in refs 5−8 in order to control the crystal size and shape distributions, along with the consideration of the crystal growth and nucleation processes in both batch and mixed suspension mixed product removal (MSMPR) processes, based on a reduced-order model. With the ultimate goal of better understanding of the effect of variation in the process model parameters on the size and shape distributions of crystals produced by batch crystallization processes, this work considers the estimation of kinetic parameters when there exist batch-to-batch parametric drifts in multiple sources. A commonly used method to estimate process model parameters is the method of least-squares, 9,10 where its application to a crystallization process can be found in, for example, ref 11. In addition, the Bayesian approach has been applied to many chemical engineering problems, because of its capability to predict the occurrence of a parametric drift in the next batch run by taking into account historical batch process data. 12−15 Lastly, considering the repetitive nature of operation of a batch process, the general idea of the run-to-run (R2R) control scheme has been applied to address batch-to- Received: January 30, 2015 Revised: April 9, 2015 Accepted: May 4, 2015 Published: May 4, 2015 Article pubs.acs.org/IECR © 2015 American Chemical Society 5514 DOI: 10.1021/acs.iecr.5b00422 Ind. Eng. Chem. Res. 2015, 54, 5514−5526
Transcript of Detection and Isolation of Batch-to-Batch Parametric Drift...
Detection and Isolation of Batch-to-Batch Parametric Drift inCrystallization Using In-Batch and Post-Batch MeasurementsJoseph Sang-Il Kwon,† Michael Nayhouse,† and Panagiotis D. Christofides*,†,‡
†Department of Chemical and Biomolecular Engineering, University of California, Los Angeles, California 90095, United States‡Department of Electrical Engineering, University of California, Los Angeles, California 90095, United States
ABSTRACT: In this work, we focus on the development of a parametric drift detection and isolation (PDDI) method for thehandling of batch-to-batch parametric drifts in a batch crystallization process used to produce hen egg-white (HEW) lysozymecrystals. We consider that the batch crystallization process is controlled by an in-batch model predictive control (MPC) systemand is subject to batch-to-batch parametric drifts in the solubility, growth rates, continuous-phase mass and energy balanceparameters, and nucleation rate. The proposed PDDI scheme consists of two parts: preparatory stage before batch-to-batchoperation and post-batch stage during batch-to-batch operation. The goal of the preparatory stage is to compute the thresholdvalues and signatures for each parametric drift using simulations and batch process common cause variance described by noise.During batch-to-batch operation, the proposed PDDI system monitors closed-loop process residuals, which are computed bytaking the difference between the time profiles of the states obtained through in-batch and postbatch measurements from thetime profiles of the states obtained from the drift-free simulation with noise. While the measurements of the protein soluteconcentration and the temperature in the crystallizer are available in real-time, post-batch measurements are usually available forthe quality of the crystal products (e.g., number of crystals, average crystal size and shape) and this key characteristic is taken intoaccount in the PDDI method. We then compare the residuals with signatures obtained in the preparatory stage for eachparametric drift for isolation of a parametric drift. The PDDI system estimates the magnitude of the parametric drift and updatesthe parameters of the batch process model used in the in-batch MPC system to compute a set of jacket temperatures for theproduction of crystals with a desired shape distribution in the next batch. The performance of the MPC with the proposed PDDIscheme is demonstrated by applying it to a multiscale simulation of a batch crystallization process with parametric drifts in thesolubility and crystal growth rates. The closed-loop system simulations demonstrate that crystals with a crystal shape distributionthat is closer to a desired set-point value are produced under a parametric-drift handling scheme that integrates the in-batch MPCwith the proposed PDDI system compared to those under the MPC with the nominal process model.
■ INTRODUCTION
Modeling and control of batch crystallization is of significantinterest to the pharmaceutical industry, because the bioavail-ability of drugs is highly dependent on the size and shapedistributions of their active pharmaceutical ingredients. Withinthis context, the dominant dynamic behavior of the evolution ofkey crystallization variables is modeled through a processmodel, which is used to compute a set of manipulated inputsthat drives the average crystal shape to a desired setpoint at theend of the batch. However, because of unknown batch-to-batchparametric drifts, the process model employed for in-batchcontrol and estimation purposes may significantly deviate fromthe actual process behavior. For example, a small batch-to-batchchange in the pH level or impurity concentration in thefeedstock container may significantly alter the quality (e.g., sizeand shape) of the crystal products.Model-free control schemes, such as a proportional−
integral−derivative (PID) control scheme, are not able tohandle constraints on the inputs, outputs, and the rate ofchange of inputs while computing optimal jacket temperaturevalues. Therefore, the necessity of incorporating the constraintsto account for the physical limitations on the manipulatedinputs and operating conditions makes model-based controlstrategy (e.g., refs 1−4) the method of choice for crystal sizedistribution control. More specifically, the model predictive
control (MPC) scheme was employed in refs 5−8 in order tocontrol the crystal size and shape distributions, along with theconsideration of the crystal growth and nucleation processes inboth batch and mixed suspension mixed product removal(MSMPR) processes, based on a reduced-order model.With the ultimate goal of better understanding of the effect
of variation in the process model parameters on the size andshape distributions of crystals produced by batch crystallizationprocesses, this work considers the estimation of kineticparameters when there exist batch-to-batch parametric driftsin multiple sources. A commonly used method to estimateprocess model parameters is the method of least-squares,9,10
where its application to a crystallization process can be foundin, for example, ref 11. In addition, the Bayesian approach hasbeen applied to many chemical engineering problems, becauseof its capability to predict the occurrence of a parametric drift inthe next batch run by taking into account historical batchprocess data.12−15 Lastly, considering the repetitive nature ofoperation of a batch process, the general idea of the run-to-run(R2R) control scheme has been applied to address batch-to-
Received: January 30, 2015Revised: April 9, 2015Accepted: May 4, 2015Published: May 4, 2015
Article
pubs.acs.org/IECR
© 2015 American Chemical Society 5514 DOI: 10.1021/acs.iecr.5b00422Ind. Eng. Chem. Res. 2015, 54, 5514−5526
batch parametric drifts in a variety of batch processes.16−20 Inparticular, when there is a noticeable trend in the batch-to-batch parametric drift, utilizing post-batch measurements overmultiple batch runs through a moving horizon estimation(MHE) scheme guarantees the improved control performancefrom batch to batch.21
In the context of continuously improving batch processmonitoring and control schemes, the design of systems capableof timely detection and isolation of batch-to-batch parametricdrift and efficient handling of such drift has received growingattention. Generally, parametric drift detection and isolation(PDDI) methods can be divided into two categories: model-based and data-based.Specifically, model-based PDDI schemes rely on mathemat-
ical models of the process developed from first-principles thatcan be solved in real time. With an accurate process model, thedata generated from the batch process model are comparedwith process measurements to calculate residuals that will beused for the detection and isolation of a specific parametric driftin a manner similar to model-based fault detection andisolation.22−24 On the other hand, data-based PDDI methodsmake use of process measurements in order to perform PDDI.Analyzing historical batch process data allows the constructionof data-based thresholds for the residuals, which can be used todistinguish between normal and abnormal process opera-tion.25−27 A common characteristic of the aforementionedworks on both model-based and data-based PDDI methods isthat they only consider synchronously sampled measurements(e.g., real-time measurements in continuous processes), andthey do not account for measurements that arrive asynchro-nously (e.g., post-batch measurements in batch processes).Motivated by these considerations, the goal of this work is todevelop a PDDI scheme for a batch protein crystallizationprocess where the protein solute concentration and thetemperature in the crystallizer are available in real time (i.e.,in-batch) at each sampling time, while only post-batchmeasurements are available for the number of crystals, averagecrystal size, and average crystal shape. This is due to the natureof the measurement techniques, because the measurements ofcrystal quality (such as the crystal size and shape distributions)are difficult to obtain in real time with high accuracy,28,29 whilereal-time measurements of the solute concentration and of thetemperature are usually available in the crystallizer.30,31
In a previous work of our group (cf. ref 21), we developed aR2R model parameter estimation scheme based on MHEconcepts. This method brought together R2R control andoptimization-based parameter estimation schemes. Providedthat a nonlinear trend exists in the batch-to-batch parametricdrift and it can be approximately modeled by an explicitfunction, it becomes possible to perform PDDI utilizing post-batch measurements from multiple batches, following a movinghorizon approach. The purpose of the present work is tofurther refine the approach proposed in ref 21 by relaxing therequirement of the process measurements over multiple batchruns and developing the use of the proposed PDDI scheme forthe detection and isolation of the parametric drift. Thus, itbecomes easier to precisely calculate the magnitude of theprocess drift, because we determine the parameter(s) in whichthe parametric drift is located. First, a PDDI scheme isproposed for the purpose of the detection and isolation ofparametric drifts introduced to a batch crystallization process.Then, a parametric drift-tolerant control scheme (PDTC) isproposed that uses the PDDI scheme to improve the model of
the in-batch model predictive controller (MPC) to achieve theproduction of crystals with a desired shape distribution.The manuscript is organized as follows: we initially describe a
batch crystallization model used for our case study. Then, wedevelop the PDDI and in-batch MPC schemes in order todetect, isolate, and handle batch-to-batch parametric drifts. Thisis followed by the section of closed- loop simulation results,where the control and estimation performances of the proposedschemes to various batch-to-batch parametric drifts in theprocess model parameters are presented. For demonstrationpurposes, we consider two cases: parametric drifts in thegrowth rates and solubility curve. Lastly, the closed-loopperformance of the PDTC with MPC is compared with that ofthe MPC based on the nominal batch process model.
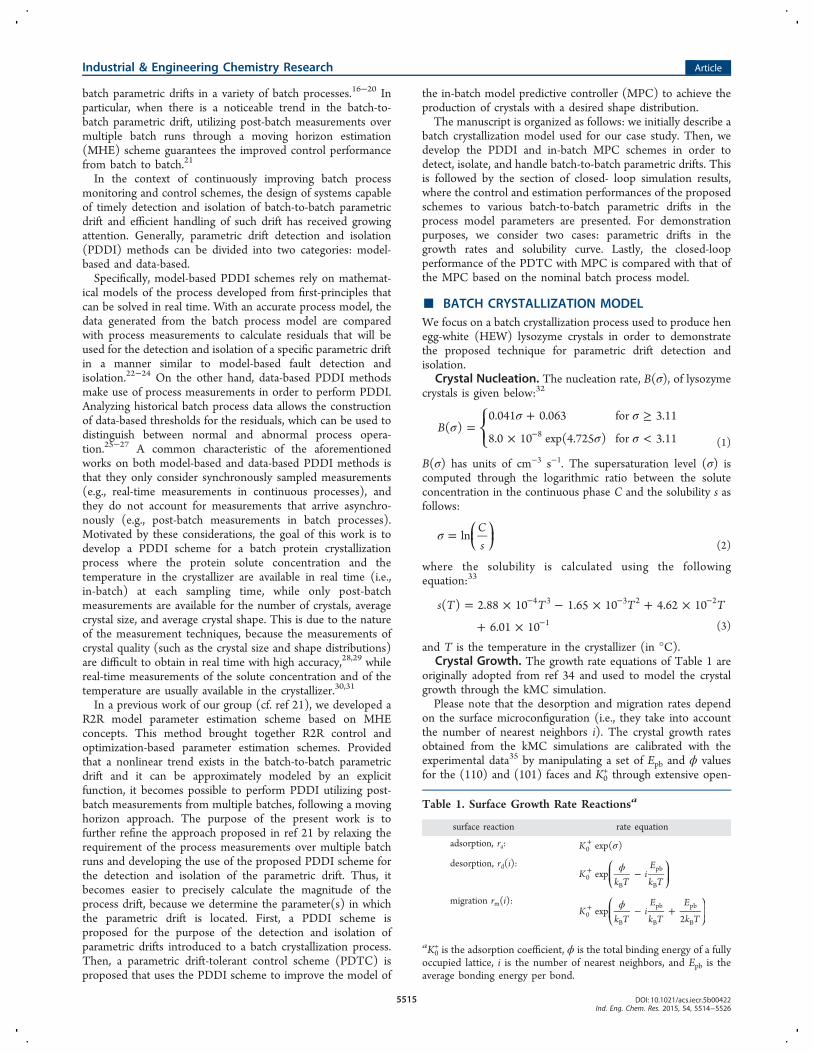
■ BATCH CRYSTALLIZATION MODELWe focus on a batch crystallization process used to produce henegg-white (HEW) lysozyme crystals in order to demonstratethe proposed technique for parametric drift detection andisolation.
Crystal Nucleation. The nucleation rate, B(σ), of lysozymecrystals is given below:32
σσ σ
σ σ=
+ ≥× <−⎪
⎪⎧⎨⎩
B( )0.041 0.063 for 3.11
8.0 10 exp(4.725 ) for 3.118(1)
B(σ) has units of cm−3 s−1. The supersaturation level (σ) iscomputed through the logarithmic ratio between the soluteconcentration in the continuous phase C and the solubility s asfollows:
σ = ⎜ ⎟⎛⎝
⎞⎠
Cs
ln(2)
where the solubility is calculated using the followingequation:33
= × − × + ×+ ×
− − −
−s T T T T( ) 2.88 10 1.65 10 4.62 10
6.01 10
4 3 3 2 2
1 (3)
and T is the temperature in the crystallizer (in °C).Crystal Growth. The growth rate equations of Table 1 are
originally adopted from ref 34 and used to model the crystalgrowth through the kMC simulation.Please note that the desorption and migration rates depend
on the surface microconfiguration (i.e., they take into accountthe number of nearest neighbors i). The crystal growth ratesobtained from the kMC simulations are calibrated with theexperimental data35 by manipulating a set of Epb and ϕ valuesfor the (110) and (101) faces and K0
+ through extensive open-
Table 1. Surface Growth Rate Reactionsa
surface reaction rate equation
adsorption, ra: σ+K exp( )0
desorption, rd(i): ϕ −+ ⎛⎝⎜
⎞⎠⎟K
k TiE
k Texp0
B
pb
B
migration rm(i): ϕ − ++ ⎛⎝⎜
⎞⎠⎟K
k TiE
k T
E
k Texp
20B
pb
B
pb
B
aK0+ is the adsorption coefficient, ϕ is the total binding energy of a fully
occupied lattice, i is the number of nearest neighbors, and Epb is theaverage bonding energy per bond.
Industrial & Engineering Chemistry Research Article
DOI: 10.1021/acs.iecr.5b00422Ind. Eng. Chem. Res. 2015, 54, 5514−5526
5515
loop kMC simulations. The parameters used for the kMCsimulation are listed in Table 2. The reader may refer to ref 36for more details regarding the execution of the kMC simulation.
Mass and Energy Balance Equations. The followingmass and energy balance equations37 are employed in this workto compute the evolution of the solute concentration andtemperature in the crystallizer with time:
ρ= − =C
t V
V
tC
dd
d
d, (0) 48 mg/cmc
batch
crystal 3
(4)
ρρ ρ
= −Δ
− −
= °
Tt
H
C V
V
tUAC V
T T
T
dd
d
d( ),
(0) 17 C
p pj
c c
batch
crystal c c
batch
(5)
where Vcrystal is the total volume of crystals in the crystallizerand Tj is the jacket temperature (i.e., manipulated input). Theprocess parameter values are shown in Table 3.
The enthalpy of crystallization is taken from ref 38, and thespecific heat capacity of the solution is assumed to be identicalto that of water, since the amount of the protein solute in thesolution is small, in comparison to that of water.While it would be difficult to capture in the crystallizer
model, in which the control action is applied to, the entire plantphysical realization, the model employed here accounts for asignificant part of the complexity of a crystallization process,including its multiscale character.Population Balance Equation. The evolution of the
crystal volume distribution for the batch crystallization processwith nucleation and crystal growth is described by the followingpopulation balance equation (PBE):39
σ δ∂∂
+ ∂∂
=n V tt
G V n V tV
B V( , ) ( ( , ) ( , ))
( )vol(6)
where n(V, t) is the number of crystals of volume V at time t,δ(·) is the dirac delta function, and Gvol(V, σ) is the volumetriccrystal growth rate which will be formulated with more detailsin the following section. Equation 6 states that crystals arenucleated with an infinitesimal size. The dirac function in thepopulation balance equation capturing the effect of nucleation
rate will be stated as a boundary condition and used to simulatethe nucleation process.
Moment Models. By applying the method of moments tothe PBE of eq 6, a moments model that describes the zero andfirst moments of the crystal volume distribution in the batchcrystallizer can be derived using standard techniques and hasthe following form:37
=Mt
Bd
d0
(7)
=Mt
G Mdd
1vol 0 (8)
where Mj(t) = ∫ 0∞Vjn(V, t) dV is the jth moment for j = 0, 1,
and Gvol is formulated as follows:
= ⟨ ⟩⟨ ⟩ + ⟨ ⟩G G h h G h2vol 110 110 101 101 1102
(9)
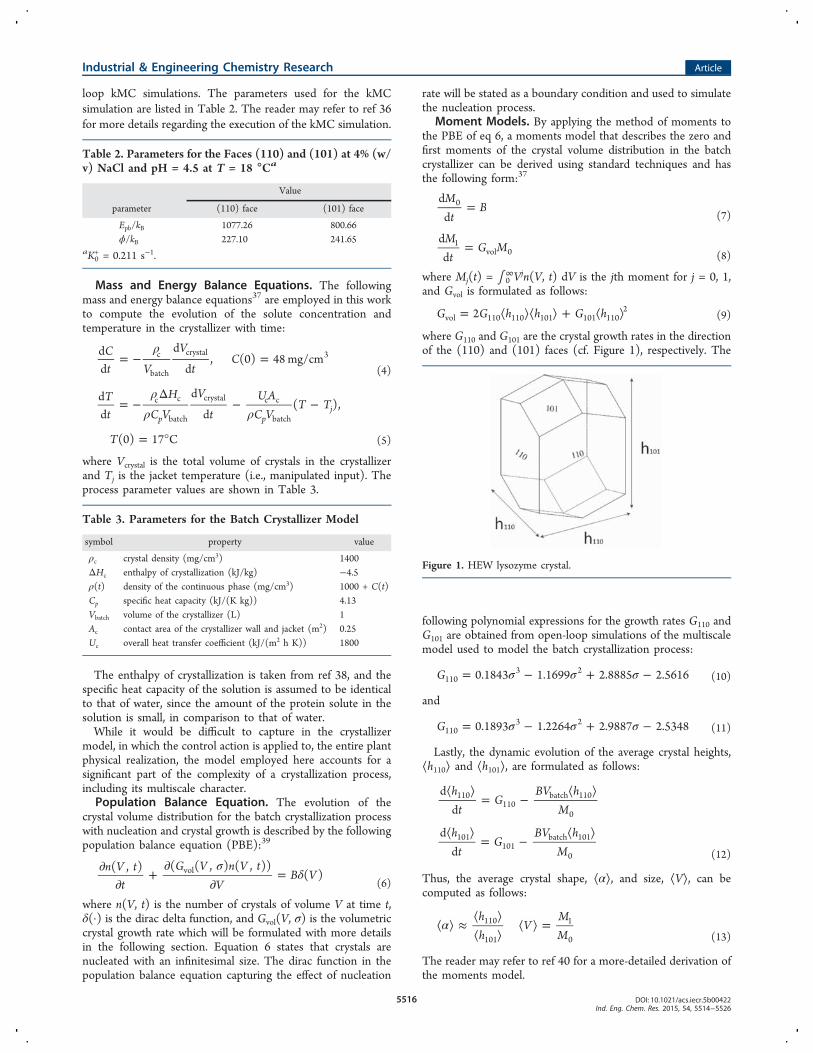
where G110 and G101 are the crystal growth rates in the directionof the (110) and (101) faces (cf. Figure 1), respectively. The
following polynomial expressions for the growth rates G110 andG101 are obtained from open-loop simulations of the multiscalemodel used to model the batch crystallization process:
σ σ σ= − + −G 0.1843 1.1699 2.8885 2.56161103 2
(10)
and
σ σ σ= − + −G 0.1893 1.2264 2.9887 2.53481103 2
(11)
Lastly, the dynamic evolution of the average crystal heights,⟨h110⟩ and ⟨h101⟩, are formulated as follows:
⟨ ⟩ = − ⟨ ⟩
⟨ ⟩ = − ⟨ ⟩
ht
GBV h
M
ht
GBV h
M
dd
dd
110110
batch 110
0
101101
batch 101
0 (12)
Thus, the average crystal shape, ⟨α⟩, and size, ⟨V⟩, can becomputed as follows:
α⟨ ⟩ ≈ ⟨ ⟩⟨ ⟩
⟨ ⟩ =hh
VMM
110
101
1
0 (13)
The reader may refer to ref 40 for a more-detailed derivation ofthe moments model.
Table 2. Parameters for the Faces (110) and (101) at 4% (w/v) NaCl and pH = 4.5 at T = 18 °Ca
Value
parameter (110) face (101) face
Epb/kB 1077.26 800.66ϕ/kB 227.10 241.65
aK0+ = 0.211 s−1.
Table 3. Parameters for the Batch Crystallizer Model
symbol property value
ρc crystal density (mg/cm3) 1400ΔHc enthalpy of crystallization (kJ/kg) −4.5ρ(t) density of the continuous phase (mg/cm3) 1000 + C(t)Cp specific heat capacity (kJ/(K kg)) 4.13Vbatch volume of the crystallizer (L) 1Ac contact area of the crystallizer wall and jacket (m2) 0.25Uc overall heat transfer coefficient (kJ/(m2 h K)) 1800
Figure 1. HEW lysozyme crystal.
Industrial & Engineering Chemistry Research Article
DOI: 10.1021/acs.iecr.5b00422Ind. Eng. Chem. Res. 2015, 54, 5514−5526
5516
■ PARAMETRIC DRIFT DETECTION AND ISOLATIONSYSTEM DESIGN
In-Batch MPC. We initially design an in-batch modelpredictive controller (MPC) for the drift-free batch crystal-lization process used for the production of HEW lysozymecrystals. First, the dominant dynamic behavior of the evolutionof the crystal shape distribution in the batch crystallizationprocess is modeled through the process model (cf. eqs 1−13),which is used to compute a set of optimal jacket temperaturesthat minimizes the squared deviation of the average crystalshape from a target value over the entire prediction horizon.We note that the term “optimal” is used for constrainedoptimization as well, in reference to a solution that optimizesthe cost functions while satisfying the constraints. There areconstraints imposed on the rate of change of the jackettemperature and on the magnitude of the temperature in thecrystallizer. The resulting optimization problem for theproposed in-batch MPC is formulated as follows:
∑ α α⟨ ⟩ −=
tmin ( ( ) )T T i
p
i, ...,
1set
2
j j p,1 , (14a)
−s.t. eqs 1 13 (14b)
° ≤ ≤ °−
Δ≤ °+T
T T4 C 25 C 2 C/minj i j i, 1 ,
(14c)
= + Δt t ii (14d)
where p is the length of the prediction horizon (p = 10), Δ thesampling time (Δ = 40 s), and Tj,i the jacket temperature at theith prediction step ti. The in situ measurements of C and T areavailable at every sampling instant. Then, the optimizationproblem of eqs 14 is solved to compute a set of optimal jackettemperatures, (Tj,1, ..., Tj,10), and the first value, Tj,1, is appliedto the crystallizer until the next sampling instant. Note that,since we impose explicit constraints on the magnitude of thecrystallizer temperature, there is no need to impose explicitconstraints of the magnitude of the jacket temperature (i.e.,manipulated input), because it is implicitly constrained by thecrystallizer temperature constraint. The simulations werecarried out on the Hoffman2 cluster at UCLA and theoptimization problems were solved using the open sourceinterior point optimizer, IPOPT.Parametric Drift Detection and Isolation. We consider
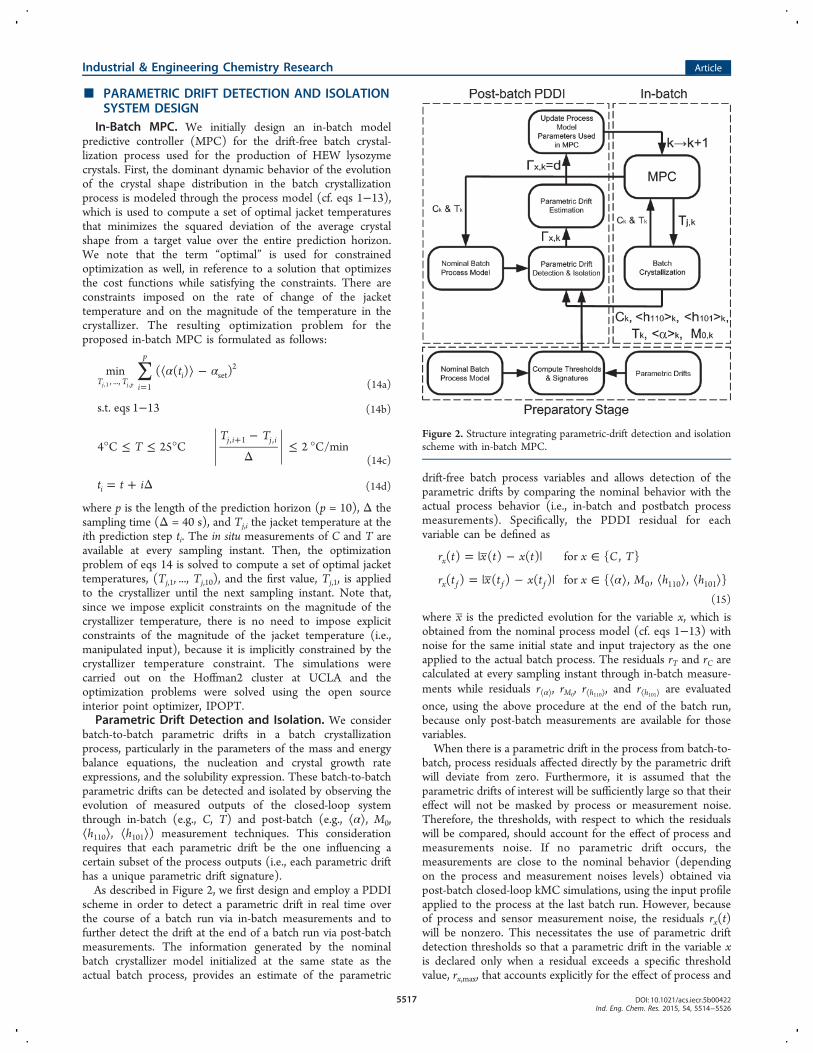
batch-to-batch parametric drifts in a batch crystallizationprocess, particularly in the parameters of the mass and energybalance equations, the nucleation and crystal growth rateexpressions, and the solubility expression. These batch-to-batchparametric drifts can be detected and isolated by observing theevolution of measured outputs of the closed-loop systemthrough in-batch (e.g., C, T) and post-batch (e.g., ⟨α⟩, M0,⟨h110⟩, ⟨h101⟩) measurement techniques. This considerationrequires that each parametric drift be the one influencing acertain subset of the process outputs (i.e., each parametric drifthas a unique parametric drift signature).As described in Figure 2, we first design and employ a PDDI
scheme in order to detect a parametric drift in real time overthe course of a batch run via in-batch measurements and tofurther detect the drift at the end of a batch run via post-batchmeasurements. The information generated by the nominalbatch crystallizer model initialized at the same state as theactual batch process, provides an estimate of the parametric
drift-free batch process variables and allows detection of theparametric drifts by comparing the nominal behavior with theactual process behavior (i.e., in-batch and postbatch processmeasurements). Specifically, the PDDI residual for eachvariable can be defined as
α= | − | ∈= | − | ∈ ⟨ ⟩ ⟨ ⟩ ⟨ ⟩
r t x t x t x C T
r t x t x t x M h h
( ) ( ) ( ) for { , }
( ) ( ) ( ) for { , , , }
x
x f f f 0 110 101
(15)
where x is the predicted evolution for the variable x, which isobtained from the nominal process model (cf. eqs 1−13) withnoise for the same initial state and input trajectory as the oneapplied to the actual batch process. The residuals rT and rC arecalculated at every sampling instant through in-batch measure-ments while residuals r⟨α⟩, rM0
, r⟨h110⟩, and r⟨h101⟩ are evaluatedonce, using the above procedure at the end of the batch run,because only post-batch measurements are available for thosevariables.When there is a parametric drift in the process from batch-to-
batch, process residuals affected directly by the parametric driftwill deviate from zero. Furthermore, it is assumed that theparametric drifts of interest will be sufficiently large so that theireffect will not be masked by process or measurement noise.Therefore, the thresholds, with respect to which the residualswill be compared, should account for the effect of process andmeasurements noise. If no parametric drift occurs, themeasurements are close to the nominal behavior (dependingon the process and measurement noises levels) obtained viapost-batch closed-loop kMC simulations, using the input profileapplied to the process at the last batch run. However, becauseof process and sensor measurement noise, the residuals rx(t)will be nonzero. This necessitates the use of parametric driftdetection thresholds so that a parametric drift in the variable xis declared only when a residual exceeds a specific thresholdvalue, rx,max, that accounts explicitly for the effect of process and
Figure 2. Structure integrating parametric-drift detection and isolationscheme with in-batch MPC.
Industrial & Engineering Chemistry Research Article
DOI: 10.1021/acs.iecr.5b00422Ind. Eng. Chem. Res. 2015, 54, 5514−5526
5517
measurement noise. Below, we describe the PDDI scheme indetail.Specifically, the proposed PDDI scheme consists of two
parts: preparatory stage before batch-to-batch operation andpost-batch stage during batch-to-batch operation. Before batch-to-batch operations, the goal of the preparatory stage is tocompute the threshold values and signatures for eachparametric drift and it is described as follows:(1) In the preparatory stage, we simulate batch runs under
the MPC with the nominal process model. The noise (commoncause variance), which is obtained from historical data andsensor information, is added to the process model used tosimulate the batch crystallization process but not added to thebatch process model used in the MPC. Then, these runs areused along with the same type of simulations for batch runsunder MPC but without noise to compute residuals andcalculate the threshold value for each variable x (rx,max), basedon the maximum deviation (absolute values) of the timeprofiles of the residuals with and without noise from zero(difference of the time profiles of the variables of these twodistinct sets of simulations), respectively.(2) We also calculate signatures for each drift in the
preparatory stage. We simulate batch runs under MPC with thenominal process model. Again, the noise is added to the processmodel used to simulate batch crystallization, but it is not addedto the process model used in the MPC. Furthermore, we add aparametric drift in each of the five variables separately (i.e,therefore we need at least as many separate simulations as thenumber of drifts considered). We then compute the residualsfor each variable by calculating the difference between the timeprofiles of the states obtained using this simulation withparametric drifts and the time profiles of the variables obtainedfrom the simulation, where it has noise but no drift in theprocess model. The residual of C and T that exceeds itsthreshold first is recorded, and the signature of this specific driftis calculated.Note that if two or more parametric drifts are defined by the
same signature, isolation between them is not possible on thebasis of the parametric drift signature (i.e., no isolation). Thisproblem will be addressed via another set of simulationsdiscussed below. The post-batch stage of the proposed PDDIscheme during batch-to-batch operation is described as follows:(1) At the end of each batch run, we compute the residuals
by calculating the difference between the time profiles of thestates obtained through in-batch and post-batch measurementsfrom the time profiles of the states obtained from the drift-freesimulation with noise using the input trajectory applied to theprocess during the last batch. Then, we compare these residuals(calculated post-batch) with signatures obtained in thepreparatory stage for each parametric drift.(2) After we narrow down the overall set of drift candidates
to a few parametric drift candidates, we run optimizationproblems with the remaining drift candidates to matchsimulated drift behavior with the in-batch experimental outputpost-batch measurements in order to isolate the parametric driftand to estimate the magnitude of the parametric drift. Details ofthis step are given below in the Parametric Drift Estimationsection.(3) The parameters of the batch process model used in the
MPC for the next batch then is updated to account for thepresence of drift.Precise isolation of the parametric drift, such as the one
attained by the proposed PDDI scheme, would allow for the
design of a model predictive controller that will directly handlethe parametric drift in its formulation by updating its modelbefore each batch. As a result, the PDDI scheme can enhancethe controller performance by minimizing the production ofcrystals with undesired characteristics attributed to theparametric drift.Also, it is important to point out the difference of the
proposed PDDI scheme with the MHE formulation employedin ref 13 for computing parameter updates for the model usedin the MPC in the next batch run. If the detection and isolationof the parametric drift is possible, then the model parametersthat are being updated are only the ones that are being directlyaffected by the drift; as a result, the accuracy of the model usedin the MPC in the next batch is superior to that of the modelthat uses a generic update for a larger set of its parameters.
Parametric Drift Estimation. After a parametric drift hasbeen detected and isolated, the PDDI system will estimate themagni- tude of the parametric drift (i.e., how much the batchprocess is perturbed from a nominal batch behavior). If two ormore parametric drifts are defined by the same signature,isolation between them is not possible on the basis of theparametric drift signature and, thus, we must find one drift thatbetter matches the in-batch and the post-batch measurementsby running the following optimization problem with candidateswhich have been narrowed down from the set of all possibledrift candidates.Specifically, a least-squares optimization problem is solved to
estimate the magnitude of the particular parametric drift (oneat a time) utilizing the in-batch and post-batch measurements(e.g., C, T, ⟨α⟩, M0, ⟨h110⟩, ⟨h101⟩) and the control inputs (e.g.,Tj) applied in the last batch run. In the optimization problem ofeqs 16 below, parametric drifts associated with the nucleationrate, the crystal growth rate in the direction of the (110) and(101) faces, the parameters of the solubility equation, and theparameters of the mass and energy balance equations are takeninto account by multiplying the correction parameters γnu, γ110,γ101, γs, γC, and γT to the nominal expressions, respectively.Furthermore, the objective function (cf. eq 16a) consists of asum of squared errors between the predicted average crystal
size and shape, α⟨ ⟩ t( )f and ⟨ ⟩ V t( )f , and the measured ones,⟨α⟩measured and ⟨V⟩measured. The resulting optimization isformulated as follows:
α α⟨ ⟩ − ⟨ ⟩ + ⟨ ⟩ − ⟨ ⟩ αΓw t w V t Vmin ( ( ) ) ( ( ) )f V fmeasured
2measured
2
(16a)
−s.t. eqs 1 14 (16b)
γ σ γ σ = =s t s t B B( ) ( ), ( ) ( )s nu (16c)
γ γ = =G t G t G t G t( ) ( ), ( ) ( )110 110 110 101 101 101 (16d)
γ γ = =T t T t C t C t( ) ( ), ( ) ( )T C (16e)
γ γ γ γ γ γΓ = [ , , , , , ]T C110 101 nu s (16f)
Assuming we have already isolated a parametric drift, we canuse only one correction factor (cf. PDDI with γx) and leave theother entries equal to one. For example, if a parametric drift inthe solubility equation has been isolated, the correctionparameters in Γ become γ110 = γ101 = γT = γC = γnu = 1 andγs = d, where d is the magnitude of the parametric drift for thesolubility equation. Therefore, solving the optimization
Industrial & Engineering Chemistry Research Article
DOI: 10.1021/acs.iecr.5b00422Ind. Eng. Chem. Res. 2015, 54, 5514−5526
5518
problem of eqs 16 is reduced to finding the value of themagnitude d. If two or more parametric drifts are defined by thesame signature, we have to run them one by one, as describedabove, until we find one that better matches the in-batch andpost-batch measurements. Once the parametric drift is isolatedand its magnitude d is estimated, the PDDI system will send theparametric drift information to the in-batch MPC to update itsmodel, which will be used for the computation of the optimaljacket temperature in the next batch run. This control scheme isessentially a PDTC. A schematic representation of the PDTCscheme is shown in Figure 2.Using the PDTC scheme, the parameters in the process
model used in the MPC in the next batch are updated based onthe parametric drift detection and isolation via the proposedPDDI scheme. The parametric drifts in the growth rates andthe solubility curve are used for demonstration purposes. Theproposed scheme can be applied to handle parametric drifts inthe other parameters as well. However, the performance of theproposed PDDI scheme is dependent on the specificcrystallization system, and in some cases, the parametric driftmay be such that it is not possible to achieve good parametricdrift detection and isolation.While the decision variables in the optimization problems of
eqs 14 (MPC) and 16 (post-batch parameter estimation) arefinite, because of the sample-and-hold implementation of thecontrol actions (jacket temperature) to the crystallizer and theestimation of a finite number of parameter values, respectively,the dynamics of the crystallizer taken into account in the MPCmodel are continuous, and, therefore, they are modeled bydifferential equations. Of course, these differential equations areintegrated numerically with a much smaller time step than thesampling time during the solution of the MPC optimizationproblem at each sampling time that leads to the calculation ofthe control actions.More specifically, the optimization problem of eq 14 was
solved to local optimality using the open-source interior pointoptimizer, IPOPT, and the optimization problem of eq 16 wasalso solved to local optimality using the Matlab functionfmincon at the end of the batch process. Although a negligibleamount of time is needed for the former problem to be solved(well-within the sampling time limits), ∼5−10 s are needed forthe latter.
■ APPLICATION OF MPC WITH PDDI TO BATCHPROTEIN CRYSTALLIZATION
Process and Measurement Noise. Measurement andprocess noise is added to the process model used to simulatethe batch crystallization process. Specifically, measurementnoise is introduced to the C(t) and T (t) measurements asfollows:
= + = +C t C t w t T t T t w t( ) ( ) ( ), ( ) ( ) ( )C T (17)
where C(t) and T(t) are the average solute concentration in thecontinuous phase and the crystallizer temperature, wC(t) andwT(t) are both Gaussian white noise with zero mean and astandard deviation of 2% of C(t) and T(t), respectively.Furthermore, the process noise is introduced to the nucleationand growth rates in the direction of the (110) and (101) facesas follows:
σ σ σ= += +
= +
B B w
G t G t w t
G t G t w t
( ) ( ) ( ),
( ) ( ) ( ),
( ) ( ) ( )
B
G
G
110 110
101 110
110
110 (18)
where B(σ), G110(t), and G101(t) are the nominal nucleationrate and the growth rates in the direction of the (110) and(101) faces, wB(σ), wG110(t), and wG101(t) are also Gaussian whitenoise variables with zero mean and a standard deviation of 2%of B(σ), G110(t), and G101(t), respectively.
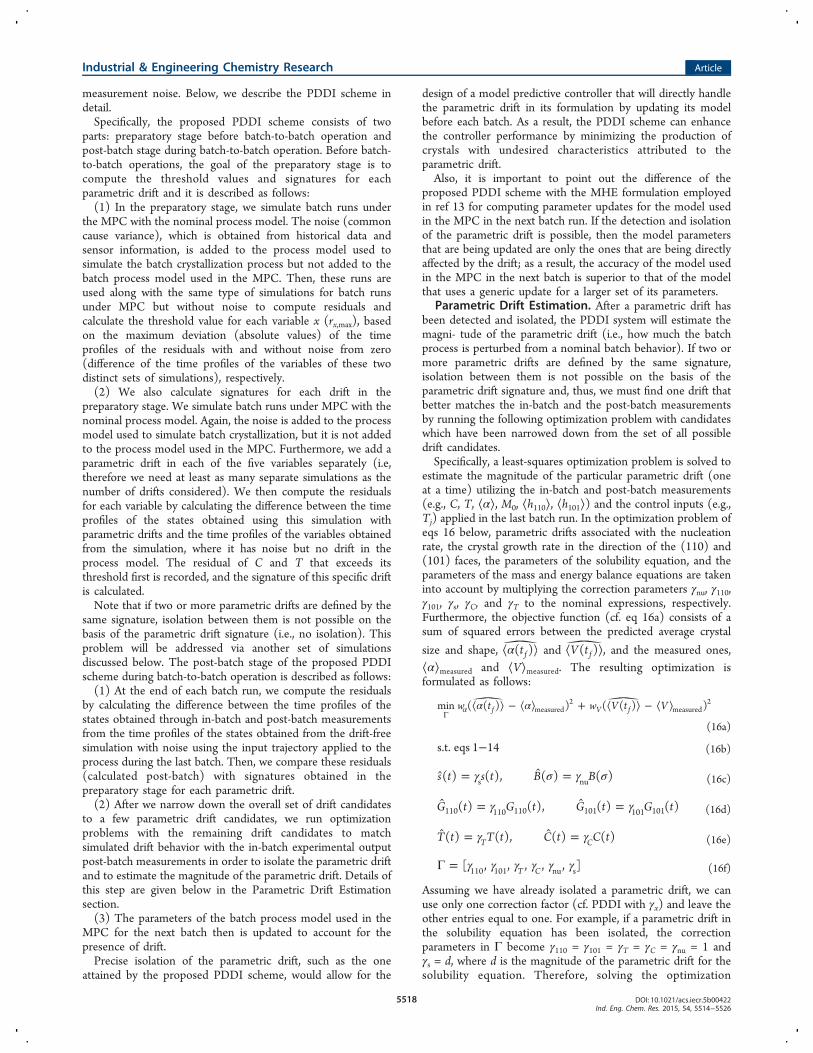
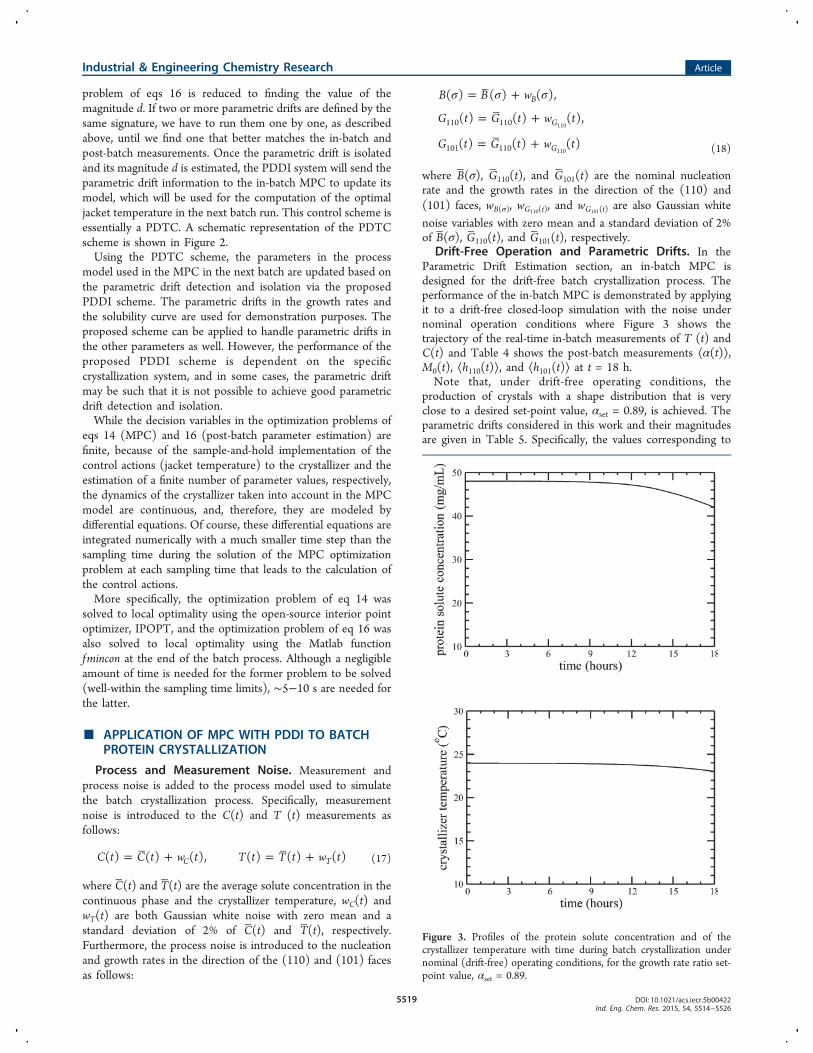
Drift-Free Operation and Parametric Drifts. In theParametric Drift Estimation section, an in-batch MPC isdesigned for the drift-free batch crystallization process. Theperformance of the in-batch MPC is demonstrated by applyingit to a drift-free closed-loop simulation with the noise undernominal operation conditions where Figure 3 shows thetrajectory of the real-time in-batch measurements of T (t) andC(t) and Table 4 shows the post-batch measurements ⟨α(t)⟩,M0(t), ⟨h110(t)⟩, and ⟨h101(t)⟩ at t = 18 h.Note that, under drift-free operating conditions, the
production of crystals with a shape distribution that is veryclose to a desired set-point value, αset = 0.89, is achieved. Theparametric drifts considered in this work and their magnitudesare given in Table 5. Specifically, the values corresponding to
Figure 3. Profiles of the protein solute concentration and of thecrystallizer temperature with time during batch crystallization undernominal (drift-free) operating conditions, for the growth rate ratio set-point value, αset = 0.89.
Industrial & Engineering Chemistry Research Article
DOI: 10.1021/acs.iecr.5b00422Ind. Eng. Chem. Res. 2015, 54, 5514−5526
5519
the percentage change presented in Table 5 for each variableare multiplied to the expressions for B, G110, G101, and S,respectively (e.g., multiply eq 10 by 0.7 to model the parametricdrift described in Table 5 for G110).Preparatory Stage of PDDI. In the preparatory stage, we
simulate batch runs using the process model with the noiseunder the MPC with the nominal process model. These runsthen are used along with the same type of simulations for batchruns but without noise to get the threshold values that aremainly attributed to the effect of the noise in the processmodel. Specifically, the maximum value of each variablethroughout the batch run is chosen as the threshold value foreach variable (rx,max), and they are presented as follows:
== °==
= = μ
α⟨ ⟩
⟨ ⟩ ⟨ ⟩
r
r
r
r
r r
1.4 mg/cm
1.1 C
0.021
64 000
10 m
C
T
M
h h
,max3
,max
,max
,max
,max ,max
0
110 101 (19)
and signatures for each parametric drift are also determinedbased on these threshold values. First, in-batch measurementsare used for detection and isolation of parametric drifts at theend of the batch. Specifically, a parametric drift is detected ifrx(tx) > rx,max for x ∈ {C, T} where tx is the first time rx exceedsthe threshold value rx,max. Depending on which residual exceedsits threshold first between C and T, the process signature for aparametric drift in the variable x, Wx,in = [WC;WT], is built asfollows:
> → =t t W W[ ; ] [1; 0]C T C T (20a)
< → =t t W W[ ; ] [0; 1]C T C T (20b)
where, as a result, the possible candidates for parametric driftscan be divided into two subgroups based on their in-batchprocess signatures, Wx,in, as follows:
= = == = =
W W W
W W W
[1; 0]
[0; 1]
C S N
T G G
,in ,in ,in
,in ,in ,in110 101 (21)
If tC = tT, it indicates that the in-batch measurements are notable to be used for the isolation of parametric drifts. The post-batch measurements (e.g., ⟨α⟩, M0, ⟨h110⟩, ⟨h101⟩) then are usedto compute the post-batch signature for a parametric drift in thevariable x, Wx,post = [W⟨α⟩, WM0
, W⟨h110⟩ W⟨h101⟩], as describedbelow:
> → =r r W 1x x x,max (22a)
≤ → =r r W 0x x x,max (22b)
for x ∈ {⟨α⟩,M0,⟨h110⟩,⟨h101⟩}. Note that which one exceeds itsthreshold value first does not matter, because all residualsexceed their thresholds at t = 18 h. For example, if we simulatea batch run with a parametric drift in the solubility curve andobserve that rx > rx,max for ⟨α⟩, ⟨h110⟩, and ⟨h101⟩ only, we obtainthe post-batch process signature for the parametric drift in thesolubility curve, WS,post = [1;0;1;1]. In this work, however, allresiduals will eventually exceed their thresholds and thus allsignatures are identical as follows:
= = = == =
W W W W WW [1;1;1;1]
C S N T G
G
,post ,post ,post ,post ,post
,post
110
101 (23)
Therefore, it is not possible to further isolate parametric driftsbased on the post-batch measurements (i.e., the post-batchmeasurements do not give any information for isolation ofparametric drifts). Instead, once we have narrowed down totwo subgroups using the in-batch measurements (cf. eq 21), wewill run simulation for the remaining drift candidates one byone to find the one that better matches the in-batch and post-batch measurements.
Post-Batch Stage of PDDI. In the post-batch stage of theproposed PDDI, we compute the residuals by calculating thedifference between the time profiles of the states obtainedthrough in-batch and post-batch measurements from the timeprofiles of the states obtained from the drift-free simulationwith noise used in the preparatory stage above. We thencompare the residuals with signatures obtained in thepreparatory stage for each parametric drift. An optimizationproblem then is solved to isolate the parametric drift and toestimate the magnitude of the parametric drift. Then, the batchprocess model used in the MPC for the next batch is updated.
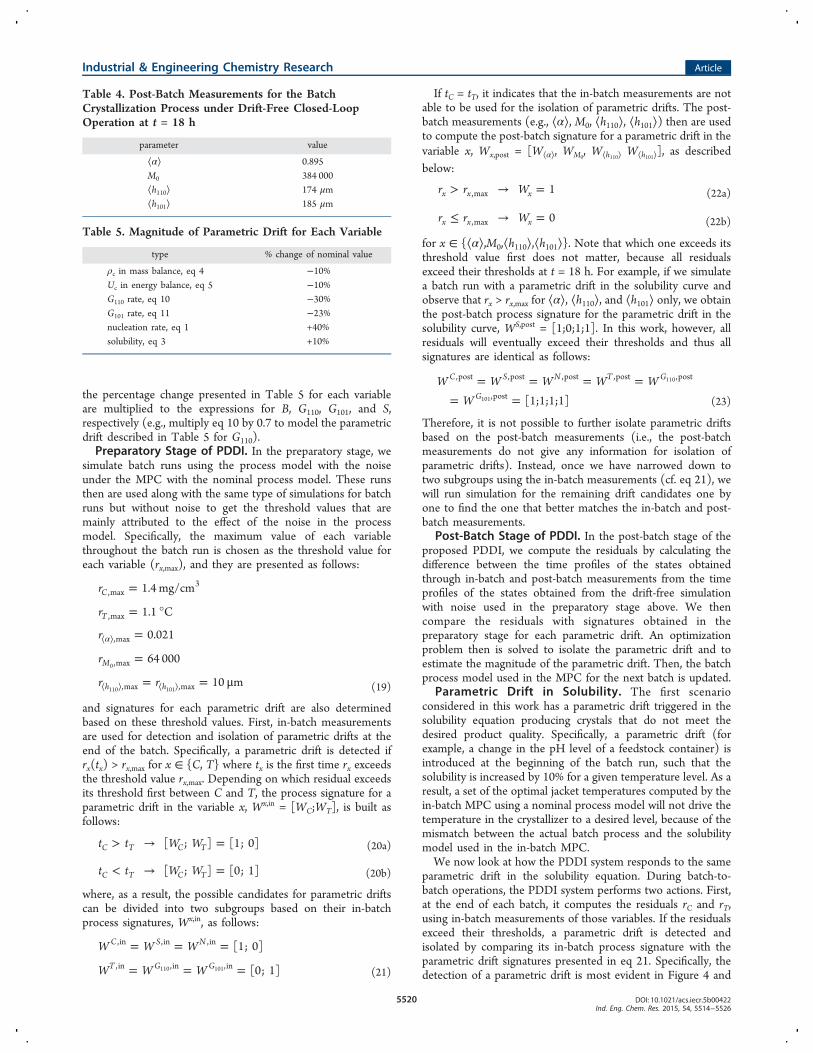
Parametric Drift in Solubility. The first scenarioconsidered in this work has a parametric drift triggered in thesolubility equation producing crystals that do not meet thedesired product quality. Specifically, a parametric drift (forexample, a change in the pH level of a feedstock container) isintroduced at the beginning of the batch run, such that thesolubility is increased by 10% for a given temperature level. As aresult, a set of the optimal jacket temperatures computed by thein-batch MPC using a nominal process model will not drive thetemperature in the crystallizer to a desired level, because of themismatch between the actual batch process and the solubilitymodel used in the in-batch MPC.We now look at how the PDDI system responds to the same
parametric drift in the solubility equation. During batch-to-batch operations, the PDDI system performs two actions. First,at the end of each batch, it computes the residuals rC and rT,using in-batch measurements of those variables. If the residualsexceed their thresholds, a parametric drift is detected andisolated by comparing its in-batch process signature with theparametric drift signatures presented in eq 21. Specifically, thedetection of a parametric drift is most evident in Figure 4 and
Table 4. Post-Batch Measurements for the BatchCrystallization Process under Drift-Free Closed-LoopOperation at t = 18 h
parameter value
⟨α⟩ 0.895M0 384 000⟨h110⟩ 174 μm⟨h101⟩ 185 μm
Table 5. Magnitude of Parametric Drift for Each Variable
type % change of nominal value
ρc in mass balance, eq 4 −10%Uc in energy balance, eq 5 −10%G110 rate, eq 10 −30%G101 rate, eq 11 −23%nucleation rate, eq 1 +40%solubility, eq 3 +10%
Industrial & Engineering Chemistry Research Article
DOI: 10.1021/acs.iecr.5b00422Ind. Eng. Chem. Res. 2015, 54, 5514−5526
5520
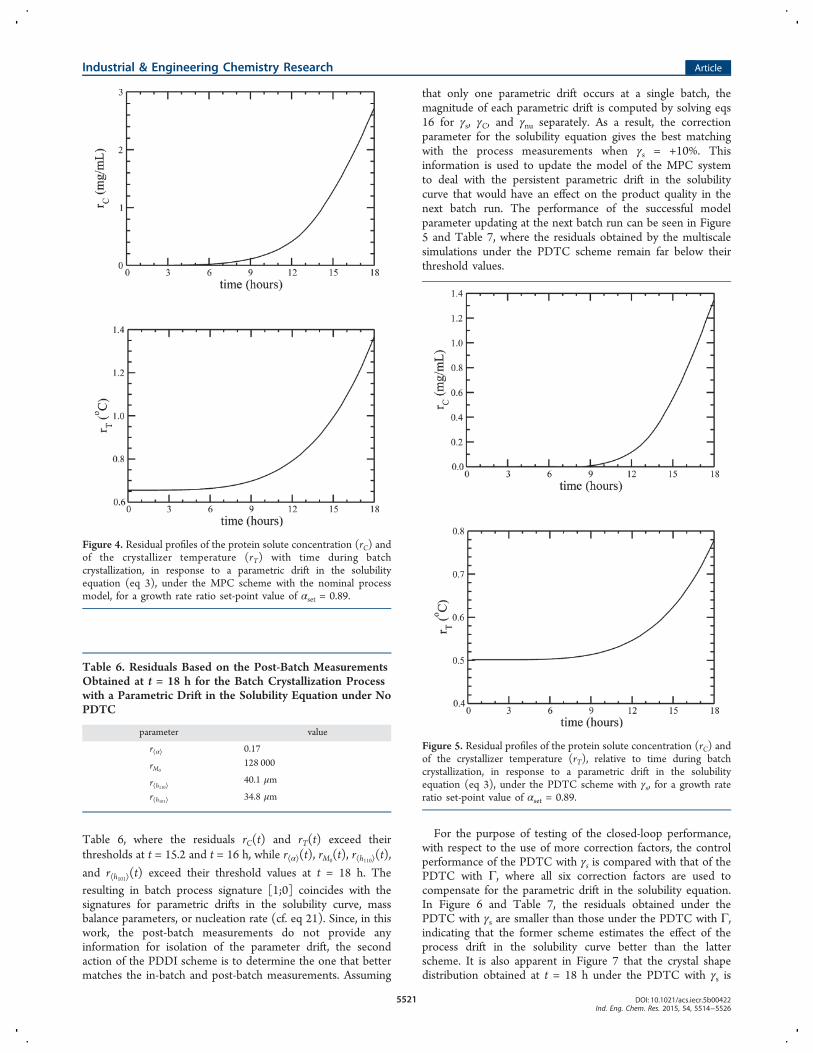
Table 6, where the residuals rC(t) and rT(t) exceed theirthresholds at t = 15.2 and t = 16 h, while r⟨α⟩(t), rM0
(t), r⟨h110⟩(t),
and r⟨h101⟩(t) exceed their threshold values at t = 18 h. Theresulting in batch process signature [1;0] coincides with thesignatures for parametric drifts in the solubility curve, massbalance parameters, or nucleation rate (cf. eq 21). Since, in thiswork, the post-batch measurements do not provide anyinformation for isolation of the parameter drift, the secondaction of the PDDI scheme is to determine the one that bettermatches the in-batch and post-batch measurements. Assuming
that only one parametric drift occurs at a single batch, themagnitude of each parametric drift is computed by solving eqs16 for γs, γC, and γnu separately. As a result, the correctionparameter for the solubility equation gives the best matchingwith the process measurements when γs = +10%. Thisinformation is used to update the model of the MPC systemto deal with the persistent parametric drift in the solubilitycurve that would have an effect on the product quality in thenext batch run. The performance of the successful modelparameter updating at the next batch run can be seen in Figure5 and Table 7, where the residuals obtained by the multiscalesimulations under the PDTC scheme remain far below theirthreshold values.
For the purpose of testing of the closed-loop performance,with respect to the use of more correction factors, the controlperformance of the PDTC with γs is compared with that of thePDTC with Γ, where all six correction factors are used tocompensate for the parametric drift in the solubility equation.In Figure 6 and Table 7, the residuals obtained under thePDTC with γs are smaller than those under the PDTC with Γ,indicating that the former scheme estimates the effect of theprocess drift in the solubility curve better than the latterscheme. It is also apparent in Figure 7 that the crystal shapedistribution obtained at t = 18 h under the PDTC with γs is
Figure 4. Residual profiles of the protein solute concentration (rC) andof the crystallizer temperature (rT) with time during batchcrystallization, in response to a parametric drift in the solubilityequation (eq 3), under the MPC scheme with the nominal processmodel, for a growth rate ratio set-point value of αset = 0.89.
Table 6. Residuals Based on the Post-Batch MeasurementsObtained at t = 18 h for the Batch Crystallization Processwith a Parametric Drift in the Solubility Equation under NoPDTC
parameter value
r⟨α⟩ 0.17
rM0128 000
r⟨h110⟩40.1 μm
r⟨h101⟩ 34.8 μm
Figure 5. Residual profiles of the protein solute concentration (rC) andof the crystallizer temperature (rT), relative to time during batchcrystallization, in response to a parametric drift in the solubilityequation (eq 3), under the PDTC scheme with γs, for a growth rateratio set-point value of αset = 0.89.
Industrial & Engineering Chemistry Research Article
DOI: 10.1021/acs.iecr.5b00422Ind. Eng. Chem. Res. 2015, 54, 5514−5526
5521
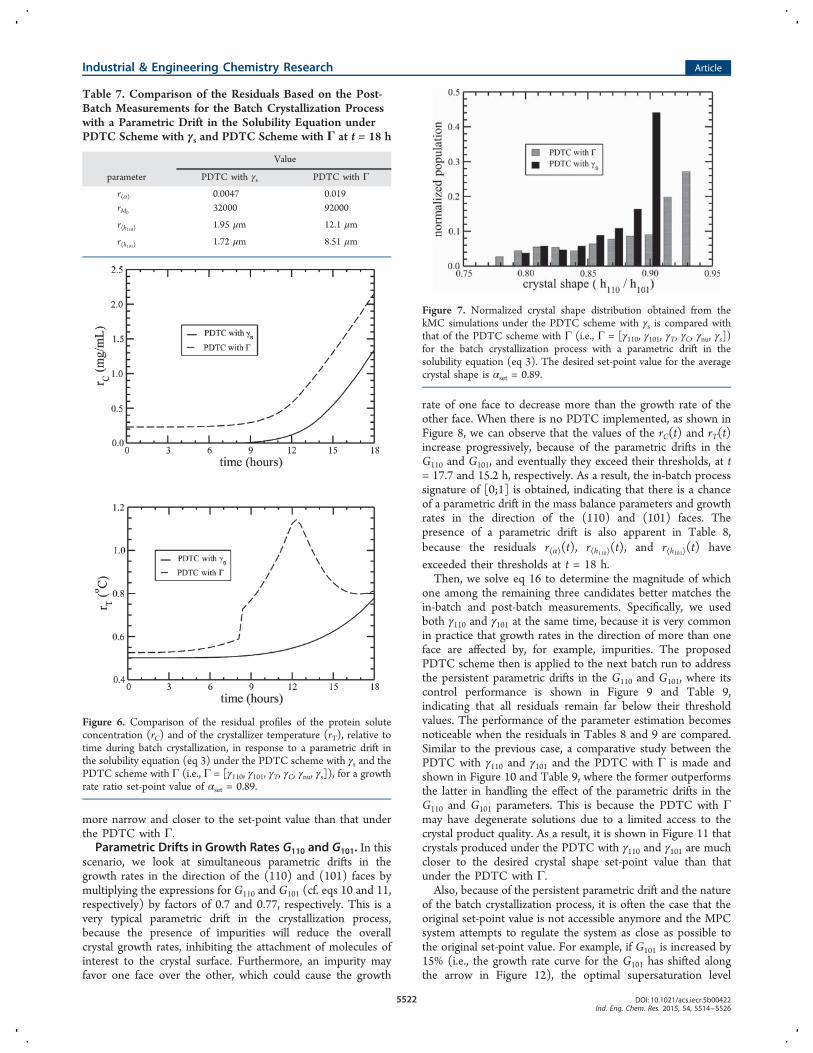
more narrow and closer to the set-point value than that underthe PDTC with Γ.Parametric Drifts in Growth Rates G110 and G101. In this
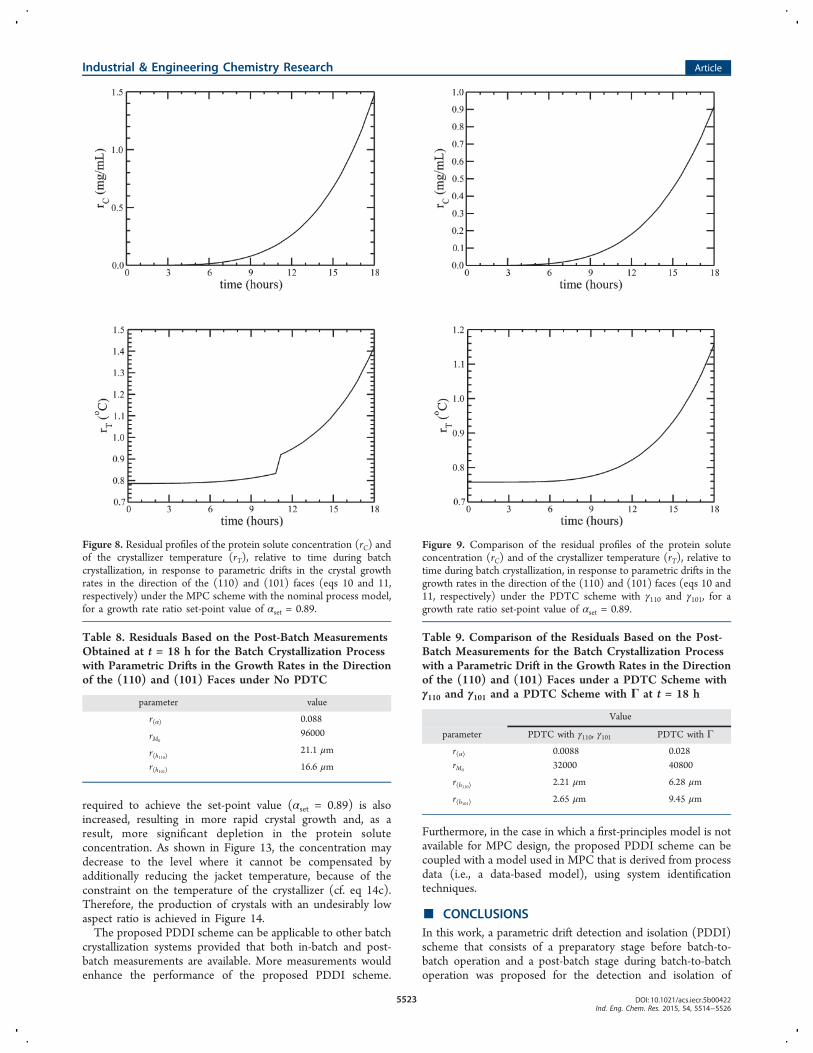
scenario, we look at simultaneous parametric drifts in thegrowth rates in the direction of the (110) and (101) faces bymultiplying the expressions for G110 and G101 (cf. eqs 10 and 11,respectively) by factors of 0.7 and 0.77, respectively. This is avery typical parametric drift in the crystallization process,because the presence of impurities will reduce the overallcrystal growth rates, inhibiting the attachment of molecules ofinterest to the crystal surface. Furthermore, an impurity mayfavor one face over the other, which could cause the growth
rate of one face to decrease more than the growth rate of theother face. When there is no PDTC implemented, as shown inFigure 8, we can observe that the values of the rC(t) and rT(t)increase progressively, because of the parametric drifts in theG110 and G101, and eventually they exceed their thresholds, at t= 17.7 and 15.2 h, respectively. As a result, the in-batch processsignature of [0;1] is obtained, indicating that there is a chanceof a parametric drift in the mass balance parameters and growthrates in the direction of the (110) and (101) faces. Thepresence of a parametric drift is also apparent in Table 8,because the residuals r⟨α⟩(t), r⟨h110⟩(t), and r⟨h101⟩(t) haveexceeded their thresholds at t = 18 h.Then, we solve eq 16 to determine the magnitude of which
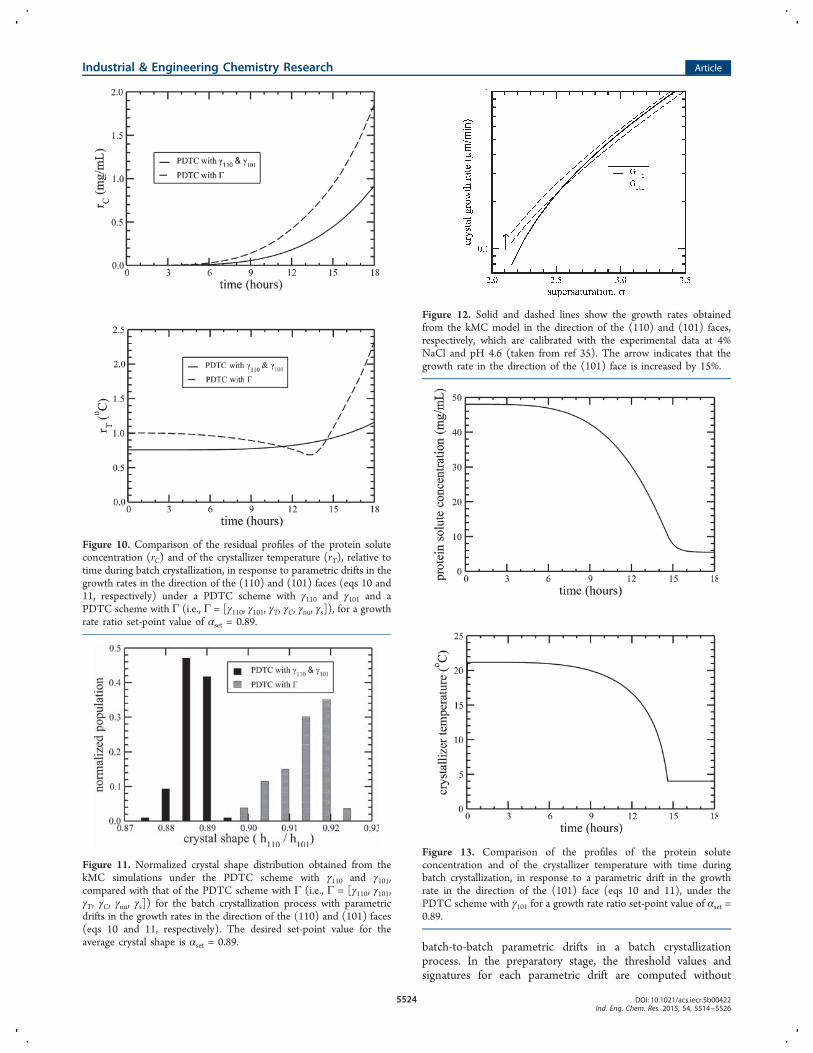
one among the remaining three candidates better matches thein-batch and post-batch measurements. Specifically, we usedboth γ110 and γ101 at the same time, because it is very commonin practice that growth rates in the direction of more than oneface are affected by, for example, impurities. The proposedPDTC scheme then is applied to the next batch run to addressthe persistent parametric drifts in the G110 and G101, where itscontrol performance is shown in Figure 9 and Table 9,indicating that all residuals remain far below their thresholdvalues. The performance of the parameter estimation becomesnoticeable when the residuals in Tables 8 and 9 are compared.Similar to the previous case, a comparative study between thePDTC with γ110 and γ101 and the PDTC with Γ is made andshown in Figure 10 and Table 9, where the former outperformsthe latter in handling the effect of the parametric drifts in theG110 and G101 parameters. This is because the PDTC with Γmay have degenerate solutions due to a limited access to thecrystal product quality. As a result, it is shown in Figure 11 thatcrystals produced under the PDTC with γ110 and γ101 are muchcloser to the desired crystal shape set-point value than thatunder the PDTC with Γ.Also, because of the persistent parametric drift and the nature
of the batch crystallization process, it is often the case that theoriginal set-point value is not accessible anymore and the MPCsystem attempts to regulate the system as close as possible tothe original set-point value. For example, if G101 is increased by15% (i.e., the growth rate curve for the G101 has shifted alongthe arrow in Figure 12), the optimal supersaturation level
Table 7. Comparison of the Residuals Based on the Post-Batch Measurements for the Batch Crystallization Processwith a Parametric Drift in the Solubility Equation underPDTC Scheme with γs and PDTC Scheme with Γ at t = 18 h
Value
parameter PDTC with γs PDTC with Γ
r⟨α⟩ 0.0047 0.019rM0
32000 92000
r⟨h110⟩ 1.95 μm 12.1 μm
r⟨h101⟩ 1.72 μm 8.51 μm
Figure 6. Comparison of the residual profiles of the protein soluteconcentration (rC) and of the crystallizer temperature (rT), relative totime during batch crystallization, in response to a parametric drift inthe solubility equation (eq 3) under the PDTC scheme with γs and thePDTC scheme with Γ (i.e., Γ = [γ110, γ101, γT, γC, γnu, γs]), for a growthrate ratio set-point value of αset = 0.89.
Figure 7. Normalized crystal shape distribution obtained from thekMC simulations under the PDTC scheme with γs is compared withthat of the PDTC scheme with Γ (i.e., Γ = [γ110, γ101, γT, γC, γnu, γs])for the batch crystallization process with a parametric drift in thesolubility equation (eq 3). The desired set-point value for the averagecrystal shape is αset = 0.89.
Industrial & Engineering Chemistry Research Article
DOI: 10.1021/acs.iecr.5b00422Ind. Eng. Chem. Res. 2015, 54, 5514−5526
5522
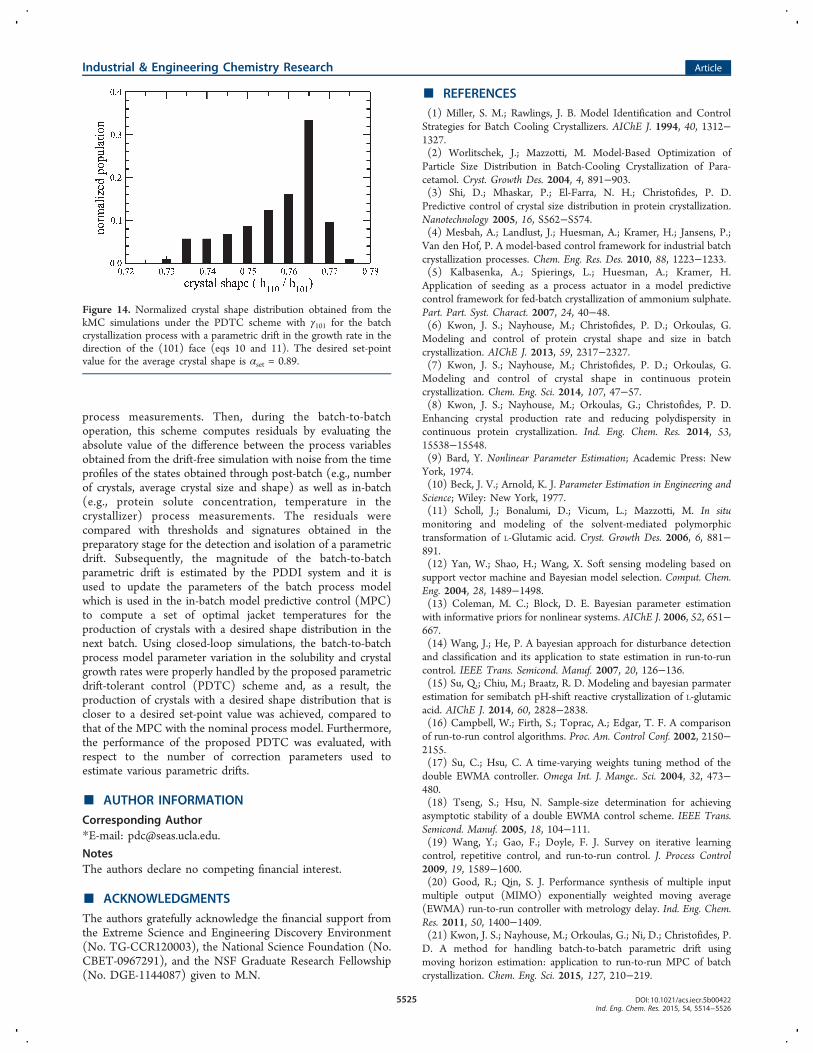
required to achieve the set-point value (αset = 0.89) is alsoincreased, resulting in more rapid crystal growth and, as aresult, more significant depletion in the protein soluteconcentration. As shown in Figure 13, the concentration maydecrease to the level where it cannot be compensated byadditionally reducing the jacket temperature, because of theconstraint on the temperature of the crystallizer (cf. eq 14c).Therefore, the production of crystals with an undesirably lowaspect ratio is achieved in Figure 14.The proposed PDDI scheme can be applicable to other batch
crystallization systems provided that both in-batch and post-batch measurements are available. More measurements wouldenhance the performance of the proposed PDDI scheme.
Furthermore, in the case in which a first-principles model is notavailable for MPC design, the proposed PDDI scheme can becoupled with a model used in MPC that is derived from processdata (i.e., a data-based model), using system identificationtechniques.
■ CONCLUSIONSIn this work, a parametric drift detection and isolation (PDDI)scheme that consists of a preparatory stage before batch-to-batch operation and a post-batch stage during batch-to-batchoperation was proposed for the detection and isolation of
Figure 8. Residual profiles of the protein solute concentration (rC) andof the crystallizer temperature (rT), relative to time during batchcrystallization, in response to parametric drifts in the crystal growthrates in the direction of the (110) and (101) faces (eqs 10 and 11,respectively) under the MPC scheme with the nominal process model,for a growth rate ratio set-point value of αset = 0.89.
Table 8. Residuals Based on the Post-Batch MeasurementsObtained at t = 18 h for the Batch Crystallization Processwith Parametric Drifts in the Growth Rates in the Directionof the (110) and (101) Faces under No PDTC
parameter value
r⟨α⟩ 0.088
rM096000
r⟨h110⟩21.1 μm
r⟨h101⟩ 16.6 μm
Figure 9. Comparison of the residual profiles of the protein soluteconcentration (rC) and of the crystallizer temperature (rT), relative totime during batch crystallization, in response to parametric drifts in thegrowth rates in the direction of the (110) and (101) faces (eqs 10 and11, respectively) under the PDTC scheme with γ110 and γ101, for agrowth rate ratio set-point value of αset = 0.89.
Table 9. Comparison of the Residuals Based on the Post-Batch Measurements for the Batch Crystallization Processwith a Parametric Drift in the Growth Rates in the Directionof the (110) and (101) Faces under a PDTC Scheme withγ110 and γ101 and a PDTC Scheme with Γ at t = 18 h
Value
parameter PDTC with γ110, γ101 PDTC with Γ
r⟨α⟩ 0.0088 0.028rM0
32000 40800
r⟨h110⟩ 2.21 μm 6.28 μm
r⟨h101⟩ 2.65 μm 9.45 μm
Industrial & Engineering Chemistry Research Article
DOI: 10.1021/acs.iecr.5b00422Ind. Eng. Chem. Res. 2015, 54, 5514−5526
5523
batch-to-batch parametric drifts in a batch crystallizationprocess. In the preparatory stage, the threshold values andsignatures for each parametric drift are computed without
Figure 10. Comparison of the residual profiles of the protein soluteconcentration (rC) and of the crystallizer temperature (rT), relative totime during batch crystallization, in response to parametric drifts in thegrowth rates in the direction of the (110) and (101) faces (eqs 10 and11, respectively) under a PDTC scheme with γ110 and γ101 and aPDTC scheme with Γ (i.e., Γ = [γ110, γ101, γT, γC, γnu, γs]), for a growthrate ratio set-point value of αset = 0.89.
Figure 11. Normalized crystal shape distribution obtained from thekMC simulations under the PDTC scheme with γ110 and γ101,compared with that of the PDTC scheme with Γ (i.e., Γ = [γ110, γ101,γT, γC, γnu, γs]) for the batch crystallization process with parametricdrifts in the growth rates in the direction of the (110) and (101) faces(eqs 10 and 11, respectively). The desired set-point value for theaverage crystal shape is αset = 0.89.
Figure 12. Solid and dashed lines show the growth rates obtainedfrom the kMC model in the direction of the (110) and (101) faces,respectively, which are calibrated with the experimental data at 4%NaCl and pH 4.6 (taken from ref 35). The arrow indicates that thegrowth rate in the direction of the (101) face is increased by 15%.
Figure 13. Comparison of the profiles of the protein soluteconcentration and of the crystallizer temperature with time duringbatch crystallization, in response to a parametric drift in the growthrate in the direction of the (101) face (eqs 10 and 11), under thePDTC scheme with γ101 for a growth rate ratio set-point value of αset =0.89.
Industrial & Engineering Chemistry Research Article
DOI: 10.1021/acs.iecr.5b00422Ind. Eng. Chem. Res. 2015, 54, 5514−5526
5524
process measurements. Then, during the batch-to-batchoperation, this scheme computes residuals by evaluating theabsolute value of the difference between the process variablesobtained from the drift-free simulation with noise from the timeprofiles of the states obtained through post-batch (e.g., numberof crystals, average crystal size and shape) as well as in-batch(e.g., protein solute concentration, temperature in thecrystallizer) process measurements. The residuals werecompared with thresholds and signatures obtained in thepreparatory stage for the detection and isolation of a parametricdrift. Subsequently, the magnitude of the batch-to-batchparametric drift is estimated by the PDDI system and it isused to update the parameters of the batch process modelwhich is used in the in-batch model predictive control (MPC)to compute a set of optimal jacket temperatures for theproduction of crystals with a desired shape distribution in thenext batch. Using closed-loop simulations, the batch-to-batchprocess model parameter variation in the solubility and crystalgrowth rates were properly handled by the proposed parametricdrift-tolerant control (PDTC) scheme and, as a result, theproduction of crystals with a desired shape distribution that iscloser to a desired set-point value was achieved, compared tothat of the MPC with the nominal process model. Furthermore,the performance of the proposed PDTC was evaluated, withrespect to the number of correction parameters used toestimate various parametric drifts.
■ AUTHOR INFORMATION
Corresponding Author*E-mail: [email protected].
NotesThe authors declare no competing financial interest.
■ ACKNOWLEDGMENTS
The authors gratefully acknowledge the financial support fromthe Extreme Science and Engineering Discovery Environment(No. TG-CCR120003), the National Science Foundation (No.CBET-0967291), and the NSF Graduate Research Fellowship(No. DGE-1144087) given to M.N.
■ REFERENCES(1) Miller, S. M.; Rawlings, J. B. Model Identification and ControlStrategies for Batch Cooling Crystallizers. AIChE J. 1994, 40, 1312−1327.(2) Worlitschek, J.; Mazzotti, M. Model-Based Optimization ofParticle Size Distribution in Batch-Cooling Crystallization of Para-cetamol. Cryst. Growth Des. 2004, 4, 891−903.(3) Shi, D.; Mhaskar, P.; El-Farra, N. H.; Christofides, P. D.Predictive control of crystal size distribution in protein crystallization.Nanotechnology 2005, 16, S562−S574.(4) Mesbah, A.; Landlust, J.; Huesman, A.; Kramer, H.; Jansens, P.;Van den Hof, P. A model-based control framework for industrial batchcrystallization processes. Chem. Eng. Res. Des. 2010, 88, 1223−1233.(5) Kalbasenka, A.; Spierings, L.; Huesman, A.; Kramer, H.Application of seeding as a process actuator in a model predictivecontrol framework for fed-batch crystallization of ammonium sulphate.Part. Part. Syst. Charact. 2007, 24, 40−48.(6) Kwon, J. S.; Nayhouse, M.; Christofides, P. D.; Orkoulas, G.Modeling and control of protein crystal shape and size in batchcrystallization. AIChE J. 2013, 59, 2317−2327.(7) Kwon, J. S.; Nayhouse, M.; Christofides, P. D.; Orkoulas, G.Modeling and control of crystal shape in continuous proteincrystallization. Chem. Eng. Sci. 2014, 107, 47−57.(8) Kwon, J. S.; Nayhouse, M.; Orkoulas, G.; Christofides, P. D.Enhancing crystal production rate and reducing polydispersity incontinuous protein crystallization. Ind. Eng. Chem. Res. 2014, 53,15538−15548.(9) Bard, Y. Nonlinear Parameter Estimation; Academic Press: NewYork, 1974.(10) Beck, J. V.; Arnold, K. J. Parameter Estimation in Engineering andScience; Wiley: New York, 1977.(11) Scholl, J.; Bonalumi, D.; Vicum, L.; Mazzotti, M. In situmonitoring and modeling of the solvent-mediated polymorphictransformation of L-Glutamic acid. Cryst. Growth Des. 2006, 6, 881−891.(12) Yan, W.; Shao, H.; Wang, X. Soft sensing modeling based onsupport vector machine and Bayesian model selection. Comput. Chem.Eng. 2004, 28, 1489−1498.(13) Coleman, M. C.; Block, D. E. Bayesian parameter estimationwith informative priors for nonlinear systems. AIChE J. 2006, 52, 651−667.(14) Wang, J.; He, P. A bayesian approach for disturbance detectionand classification and its application to state estimation in run-to-runcontrol. IEEE Trans. Semicond. Manuf. 2007, 20, 126−136.(15) Su, Q.; Chiu, M.; Braatz, R. D. Modeling and bayesian parmaterestimation for semibatch pH-shift reactive crystallization of L-glutamicacid. AIChE J. 2014, 60, 2828−2838.(16) Campbell, W.; Firth, S.; Toprac, A.; Edgar, T. F. A comparisonof run-to-run control algorithms. Proc. Am. Control Conf. 2002, 2150−2155.(17) Su, C.; Hsu, C. A time-varying weights tuning method of thedouble EWMA controller. Omega Int. J. Mange.. Sci. 2004, 32, 473−480.(18) Tseng, S.; Hsu, N. Sample-size determination for achievingasymptotic stability of a double EWMA control scheme. IEEE Trans.Semicond. Manuf. 2005, 18, 104−111.(19) Wang, Y.; Gao, F.; Doyle, F. J. Survey on iterative learningcontrol, repetitive control, and run-to-run control. J. Process Control2009, 19, 1589−1600.(20) Good, R.; Qin, S. J. Performance synthesis of multiple inputmultiple output (MIMO) exponentially weighted moving average(EWMA) run-to-run controller with metrology delay. Ind. Eng. Chem.Res. 2011, 50, 1400−1409.(21) Kwon, J. S.; Nayhouse, M.; Orkoulas, G.; Ni, D.; Christofides, P.D. A method for handling batch-to-batch parametric drift usingmoving horizon estimation: application to run-to-run MPC of batchcrystallization. Chem. Eng. Sci. 2015, 127, 210−219.
Figure 14. Normalized crystal shape distribution obtained from thekMC simulations under the PDTC scheme with γ101 for the batchcrystallization process with a parametric drift in the growth rate in thedirection of the (101) face (eqs 10 and 11). The desired set-pointvalue for the average crystal shape is αset = 0.89.
Industrial & Engineering Chemistry Research Article
DOI: 10.1021/acs.iecr.5b00422Ind. Eng. Chem. Res. 2015, 54, 5514−5526
5525
(22) De Persis, C.; Isidori, A. A geometric approach to nonlinear faultdetection and isolation. IEEE Trans. Autom. Control 2001, 46, 853−865.(23) Mhaskar, P.; Gani, N. H.; El-Farra, A.; Christofides, P. D.; Davis,J. F. Integrated fault-detection and fault-tolerant control of processsystems. AIChE J. 2006, 52, 2129−2148.(24) Mhaskar, P.; McFall, C.; Gani, A.; Christofides, P. D.; Davis, J. F.Isolation and handling of actuator faults in nonlinear systems.Automatica 2008, 44, 53−62.(25) Aradhye, H. B.; Bakshi, B. R.; Davis, J. F.; Shalt, S. C. Clusteringin wavelet domain: A multiresolution ART network-based diagnosticapproach. AIChE J. 2004, 50, 2455−2466.(26) Zhang, X. D.; Parisini, T.; Polycarpou, M. M. Adaptive fault-tolerant control of nonlinear uncertain systems: an information-baseddiagnostic approach. IEEE Trans. Autom. Control 2004, 49, 1259−1274.(27) Ohran, B.; Munoz de la Pena, D.; Christofides, P. D.; Davis, J. F.Enhancing data-based fault isolation through nonlinear control. AIChEJ. 2008, 53, 2734−2741.(28) Barrett, P.; Glennon, B. Characterizing the metastable zonewidth and solubility curve using lasentec FBRM and PVM. Chem. Eng.Res. Des. 2002, 80, 799−805.(29) Kougoulos, E.; Jones, A.; Jennings, K.; Wood-Kaczmar, M. Useof focused beam reflectance measurement (FBRM) and process videoimaging (PVI) in a modified mixed suspension mixed product removal(MSMPR) cooling crystallizer. J. Cryst. Growth 2005, 273, 529−534.(30) Dunuwila, D. D.; Carroll, L. B.; Berglund, K. A. An investigationof the applicability of attenuated total-reflection infrared-spectroscopyfor measurement of solubility and supersaturation of aqueous citricacid solutions. J. Cryst. Growth 1994, 137, 561−588.(31) Togkalidou, T.; Fujiwara, M.; Patel, S.; Braatz, R. Soluteconcentration prediction using chemometrics and ATR-FTIR spec-troscopy. J. Cryst. Growth 2001, 231, 534−543.(32) Galkin, O.; Vekilov, P. G. Nulceation of protein crystals: Criticalnuclei, phase behavior, and control pathways. J. Cryst. Growth 2001,232, 63−76.(33) Cacioppo, E.; Pusey, M. L. The solubility of the tetragonal formof hen-egg-white lysozyme from pH 4.0 to 5.4. J. Cryst. Growth 1991,114, 286−292.(34) Durbin, S. D.; Feher, G. Simulation of lysozyme crystal growthby the Monte Carlo method. J. Cryst. Growth 1991, 110, 41−51.(35) Durbin, S. D.; Feher, G. Crystal growth studies of lysozyme as amodel for protein crystallization. J. Cryst. Growth 1986, 76, 583−592.(36) Nayhouse, M.; Kwon, J. S.; Christofides, P. D.; Orkoulas, G.Crystal Shape Modeling and Control in Protein Crystal Growth.Chem. Eng. Sci. 2013, 87, 216−223.(37) Randolph, A.; Larson, M. Theory of Particulate Processes: Analysisand Techniques of Continuous Crystallization; Academic Press: NewYork, 1988.(38) Schall, C.; Arnold, E.; Wiencek, J. Enthalpy of crystallization ofhen egg-white lysozyme. J. Cryst. Growth 1996, 165, 293−298.(39) Hulburt, H. M.; Katz, S. Some problems in particle technology.A statistical mechanical formulation. Chem. Eng. Sci. 1964, 19, 555−574.(40) Kwon, J. S.; Nayhouse, M.; Orkoulas, G.; Christofides, P. D.Crystal shape and size control using a plug flow crystallizationconfiguration. Chem. Eng. Sci. 2014, 119, 30−39.
Industrial & Engineering Chemistry Research Article
DOI: 10.1021/acs.iecr.5b00422Ind. Eng. Chem. Res. 2015, 54, 5514−5526
5526