STROKE. Stroke Classification Risk Factors Signs and Symptoms Management –Prehospital –In-hospital.

sensors
Article
Detection and Classification of Stroke Gaits by Deep NeuralNetworks Employing Inertial Measurement Units
Fu-Cheng Wang 1,* , Szu-Fu Chen 2,3, Chin-Hsien Lin 4 , Chih-Jen Shih 1, Ang-Chieh Lin 2, Wei Yuan 1,You-Chi Li 1 and Tien-Yun Kuo 1
Citation: Wang, F.-C.; Chen, S.-F.;
Lin, C.-H.; Shih, C.-J.; Lin, A.-C.;
Yuan, W.; Li, Y.-C.; Kuo, T.-Y.
Detection and Classification of Stroke
Gaits by Deep Neural Networks
Employing Inertial Measurement
Units. Sensors 2021, 21, 1864.
https://doi.org/10.3390/s21051864
Academic Editors: Sheng-Joue Young,
Shoou-Jinn Chang, Stephen D. Prior
and Liang-Wen Ji
Received: 21 January 2021
Accepted: 3 March 2021
Published: 7 March 2021
Publisher’s Note: MDPI stays neutral
with regard to jurisdictional claims in
published maps and institutional affil-
iations.
Copyright: © 2021 by the authors.
Licensee MDPI, Basel, Switzerland.
This article is an open access article
distributed under the terms and
conditions of the Creative Commons
Attribution (CC BY) license (https://
creativecommons.org/licenses/by/
4.0/).
1 Department of Mechanical Engineering, National Taiwan University, Taipei 106, Taiwan;[email protected] (C.-J.S.); [email protected] (W.Y.); [email protected] (Y.-C.L.);[email protected] (T.-Y.K.)
2 Department of Physical Medicine and Rehabilitation, Cheng Hsin General Hospital, Taipei 112, Taiwan;[email protected] (S.-F.C.); [email protected] (A.-C.L.)
3 Department of Physiology and Biophysics, National Defense Medical Center, Taipei 114, Taiwan4 Department of Neurology, National Taiwan University Hospital, Taipei 100, Taiwan; [email protected]* Correspondence: [email protected]
Abstract: This paper develops Deep Neural Network (DNN) models that can recognize strokegaits. Stroke patients usually suffer from partial disability and develop abnormal gaits that can varywidely and need targeted treatments. Evaluation of gait patterns is crucial for clinical experts tomake decisions about the medication and rehabilitation strategies for the stroke patients. However,the evaluation is often subjective, and different clinicians might have different diagnoses of strokegait patterns. In addition, some patients may present with mixed neurological gaits. Therefore,we apply artificial intelligence techniques to detect stroke gaits and to classify abnormal gait patterns.First, we collect clinical gait data from eight stroke patients and seven healthy subjects. We then applythese data to develop DNN models that can detect stroke gaits. Finally, we classify four common gaitabnormalities seen in stroke patients. The developed models achieve an average accuracy of 99.35%in detecting the stroke gaits and an average accuracy of 97.31% in classifying the gait abnormality.Based on the results, the developed DNN models could help therapists or physicians to diagnosedifferent abnormal gaits and to apply suitable rehabilitation strategies for stroke patients.
Keywords: gait recognition; deep learning; neural network; stroke gait; IMU (inertial measurement unit)
1. Introduction
Stroke is a common medical emergency with a high mortality rate, ranking secondamong the leading causes of death in the last 15 years [1]. However, the patients whoare fortunate enough to survive stroke events usually suffer from partial disability andinconvenience in their daily lives. Therefore, post-stroke patients usually require long-termhealthcare and rehabilitation. At present, stroke costs are about 34 billion US dollars peryear in the USA [2]. On average, each stroke patient spends about 60,000 US dollars peryear, with 30% of those costs expended on rehabilitation and medical care [3]. The purposeof rehabilitation is to help these patients recover their ability for independent living,particularly walking on their own.
Hemiplegia is one of the most common impairments after stroke and contributessignificantly to walking impairments [4]. The hemiplegic gait patterns include decreasedknee flexion and ankle dorsiflexion during swing [5]. Approximately two thirds of strokesurvivors with initial paralysis of the leg can eventually walk with or without assistance [6].However, many individuals still exhibit considerable gait impairments and cannot achievethe walking dexterity that enable them to perform all their daily activities. Stroke survivorsnormally develop abnormal gaits, such as longer swing phases and decreased stancephases on the paretic side. Because different and diverse gait problems are encountered in
Sensors 2021, 21, 1864. https://doi.org/10.3390/s21051864 https://www.mdpi.com/journal/sensors

Sensors 2021, 21, 1864 2 of 18
stroke survivors, it is important to determine each individual’s gait abnormalities duringthe golden time window of rehabilitation to develop appropriate training strategies andimprove patients’ functional outcomes.
Unfortunately, most of the gait training programs have been based mainly on clinicalassessments, which may be influenced by subjective decisions and therapists’ experiences.For this reason, many researchers have attempted to identify the walking pattern inobjective manners. For example, Zhao et al. [7] proposed the rule-based algorithms toidentify several gait events. Wang et al. [8] developed algorithms to detect three gait eventsin real time. Knutsson and Richards [9] used electromyogram signals to identify three typesof abnormal muscle activation patterns in post-stroke patients. Wong et al. [10] appliedload sensors to analyze the foot contact pattern when evaluating walking ability in patientswith hemiplegic stroke. Some studies have also applied machine learning techniquesto develop gait classification models. For instance, Wahid et al. [11] measured spatial-temporal gait signals for feature extraction and proposed a classification model to diagnoseParkinson disease (PD); their model achieved an accuracy of 92.6% after normalizinggait data using a multiple regression approach. Daliri [12], who analyzed gait signalsderived from ground reaction forces, applied support vector machines to diagnose subjectswith PD and achieved an accuracy of 91.2%. Similarly, Dolatabadi et al. [13] applied twomachine learning methods and discriminated normal and pathological gait patterns withan accuracy of more than 90%. Li [14] used the dynamic time warping algorithm, sampleentropy method, and empirical mode decomposition-based stability index to analyze thesymmetry, regularity, and stability of post-stroke hemiparetic gaits. They then applied thek-nearest-neighbor classifier to distinguish stroke gaits and achieved an area-under-the-curve value of 0.94. However, no research has yet been conducted on the classificationof stroke gait patterns. Therefore, the aim of this paper is to develop models that canrecognize stroke gaits.
The gait abnormalities in post-stroke patients vary, and each needs specific rehabili-tation strategies. For example, the following are four common gait abnormalities seen inpost-stroke patients:
(1) The drop-foot gait [15–17]: Patients develop a drop foot gait because their weaknessor paralysis limits their ability to raise the front part of the foot, so that their toes aredragged when walking. This abnormal gait can slow walking speed and increasedrisk of falls.
(2) The circumduction gait [18–23]: This gait is also known as the neurological or hemi-plegia gait. The knee and hip movements are insufficient to allow the foot to clear theground, so the patients adopt an abnormal walking pattern by taking the leg awayfrom the body and swinging the leg forward in a semicircular fashion when walking.
(3) The hip hiking gait [18,24,25]: This gait is defined as a frontal plane elevation ofthe ipsilateral side of the pelvis to achieve foot clearance. Both hip hiking andcircumduction are secondary gait deviations used to achieve ground clearance duringthe paretic swing phase.
(4) The back knee gait [26–29]: This gait is also known as genu recurvatum, which isdefined as full extension or hyperextension of the knee in the stance phase [27]. Genurecurvatum can lead to functional mobility limitations and early degenerative changesof knee joint due to progressive knee hyperextension [28].
The abnormal gaits in post-stroke patients not only increase energy consumptionbut they also reduce walking efficiency, causing difficulties in ambulation and increasingthe risk of falling. The abnormal gaits can also place extra pressure on the joints, causedamage to joints or ligaments, and even affect the patient’s mental state and quality of life.Hence, evaluation and identification of gait abnormalities are important for developingappropriate training strategies for rehabilitation. In current clinical practice, gait patterndiagnosis mainly relies on the experience of clinicians or physical therapists to make judg-ments, and there is no objective diagnostic standard. Different clinicians or therapists mighthave different diagnoses of stroke gait patterns. In addition, some patients may present

Sensors 2021, 21, 1864 3 of 18
with mixed neurological gaits, for example, hemiplegic gait combined with foot inversiongait due to increased muscle tone or some patients may combine with drop foot becauseof receiving over-dose botulinum toxin treatment for legs spasticity. Therefore, many re-searchers have attempted to identify gait events [7,8] and gait abnormalities [9,10]. Machinelearning techniques are also applied to improve the identification performance [11–14].However, no research has yet been conducted on the classification of stroke gaits. Hence,in this paper we apply deep learning technologies to detect and classify stroke gaits asan aid to diagnosis and for application of appropriate rehabilitation methods for strokepatients. In this study, the stroke gait patterns were diagnosed by two physical therapistswho were more than 15 years qualified, with at least 10 years of daily experience workingwith patients with stroke. Then we apply the clinical data to develop Deep Neural Network(DNN) models to assist physical therapists or physicians for more optimizing the diagnosisof different stroke gaits, especially for those with mixed neurological gait problems.
The paper is arranged as follows: Section 2 introduces the experiments for the collec-tion of gait data. We applied inertial measurement units (IMUs) to acquire the gait infor-mation. Section 3 develops a deep-learning model for recognizing stroke gaits. Section 4describes the model training processes and validation. We also test the developed modelsby applying a public dataset. Based on the results, we discuss the performance, limitation,and future development of the developed model in Section 5. Finally, we draw conclusionsin Section 6.
2. Collection and Processing
This section describes the experiments conducted to collect gait data. We invitedstroke patients and healthy subjects to conduct walking tests. Their gaits were measuredand applied to develop a DNN model that can identify and classify the stroke gaits.
First, we recruited eight post-stroke patients; their data are illustrated in Table 1.The following criteria were applied when selecting the test subjects: (1) the BrunnstromStage (BS) [30] on the lower extremity was stage 3–5; (2) the Functional AmbulationCategory (FAC) [31] was stage 3–5; (3) the Mini-Mental State Examination (MMSE) [32]score was higher than 24; (4) subjects could walk ten meters indoors with or withoutaid devices, and (5) subjects could stand up on their own using a handrail and aids.Second, we also recruited seven healthy subjects as the normal reference group; their dataare illustrated in Table 2. All test subjects signed informed consent forms approved bythe Human Subject Research Ethics Committee of Institutional Review Board (IRB) [33],as shown in Appendix A.
Table 1. Basic data of the stroke subjects.
Stroke Subject
Subject Gender Age Height(cm)
Weight(kg)
PareticSide
MMSE(Score)
BS(Stage)
FAC(Stage)
P1 Male 51 174 66 Right 30 3 6P2 Male 48 168 61 Right 28 3 6P3 Female 61 161 56 Right 29 4 6P4 Male 53 162 75 Left 29 3 6P5 Male 52 173 81 Right 27 3 6P6 Male 72 168 75 Left 29 5 6P7 Male 64 158 61 Left 30 5 6P8 Female 69 156 90 Right 30 4 6

Sensors 2021, 21, 1864 4 of 18
Table 2. Basic data of the healthy subjects.
Healthy Subject
Subject Gender Age Height (cm) Weight (kg)
H1 Male 24 185 85H2 Male 24 178 70H3 Male 25 170 63H4 Male 25 164 70H5 Male 24 172 75H6 Male 26 172 76H7 Male 23 166 62
Wearable sensor technologies have been frequently applied to gait analyses. For ex-ample, Diaz et al. [34] surveyed the applications of wearable sensor technologies in an-alyzing the gait, balance, and range of motion research. Nguyen et al. [35] applied anIMU-based system to develop deep convolutional neural network models for distinguishsubjects with foot structural abnormalities. In this paper, we applied the APDM OPALsystem [36] to acquire the gait information. The OPAL system contains wearable IMUswith a sampling rate of 128 Hz and a resolution of 17.5 bits. Each IMU has a size of about44 mm × 40 mm × 14 mm and weighs less than 25 gm. Two IMUs were attached to thesubjects’ shanks, as shown in Figure 1. Each IMU consists of a 3-axis accelerometer, a 3-axisgyroscope, and a 3-axis magnetometer. The maximum measurement ranges of the ac-celerometer, the gyroscope, and the magnetometer are ±200 g, ±200 deg/s, and ±8 Gauss,respectively. This IMU device can detect a subject’s kinematic data with a highest samplingrate of 128 Hz. In the experiment, all subjects were required to complete walking tests attheir most comfortable pace.
Sensors 2021, 21, x FOR PEER REVIEW 4 of 18
Table 2. Basic data of the healthy subjects.
Healthy Subject Subject Gender Age Height (cm) Weight (kg)
H1 Male 24 185 85 H2 Male 24 178 70 H3 Male 25 170 63 H4 Male 25 164 70 H5 Male 24 172 75 H6 Male 26 172 76 H7 Male 23 166 62
Wearable sensor technologies have been frequently applied to gait analyses. For exam-ple, Diaz et al. [34] surveyed the applications of wearable sensor technologies in analyzing the gait, balance, and range of motion research. Nguyen et al. [35] applied an IMU-based system to develop deep convolutional neural network models for distinguish subjects with foot structural abnormalities. In this paper, we applied the APDM OPAL system [36] to ac-quire the gait information. The OPAL system contains wearable IMUs with a sampling rate of 128 Hz and a resolution of 17.5 bits. Each IMU has a size of about 44mm 40mm 14mm× × and weighs less than 25 gm. Two IMUs were attached to the sub-jects’ shanks, as shown in Figure 1. Each IMU consists of a 3-axis accelerometer, a 3-axis gyroscope, and a 3-axis magnetometer. The maximum measurement ranges of the accel-erometer, the gyroscope, and the magnetometer are 200 g± , 200 deg/s± , and 8 Gauss± , respectively. This IMU device can detect a subject’s kinematic data with a highest sam-pling rate of 128 Hz. In the experiment, all subjects were required to complete walking tests at their most comfortable pace.
Figure 1. Gait measurements by two inertial measurement units (IMUs).
We applied the angular velocity of the shank on the sagittal plane [37], which is the mediolateral axis (y-axis) in Figure 1, to develop the DNN model. For example, the angu-lar velocities yω of patient P8 are shown in Figure 2a,b, where L and R represents the left leg and the right leg, respectively. Each gait cycle contains the following three important gait events [38]: (1) Mid-swing: when the angular velocity achieves its maximum in the gait cycle; (2) Heel strike: when the heel touches the ground, where the angular velocity has the first negative trough after the mid-swing; (3) Toe off: when the toes leave the ground. Be-cause these gait events can be evaluated by the angular velocities [37], we can mark the mid-swing points of each gait and divided the measured data into individual gait cycles, as shown in Figure 2c,d. Note that we split the gait cycles by the mid-swing in that labelling the mid-swing is much easier and more direct than labelling the heel-strike [8]. The model development will be similar if the gait cycles are partitioned by the heel-strike or the toe-off. We then normalized the gait data by dividing it into one hundred points for each gait
Figure 1. Gait measurements by two inertial measurement units (IMUs).
We applied the angular velocity of the shank on the sagittal plane [37], which is themediolateral axis (y-axis) in Figure 1, to develop the DNN model. For example, the angularvelocities ωy of patient P8 are shown in Figure 2a,b, where L and R represents the left legand the right leg, respectively. Each gait cycle contains the following three important gaitevents [38]: (1) Mid-swing: when the angular velocity achieves its maximum in the gaitcycle; (2) Heel strike: when the heel touches the ground, where the angular velocity hasthe first negative trough after the mid-swing; (3) Toe off: when the toes leave the ground.Because these gait events can be evaluated by the angular velocities [37], we can markthe mid-swing points of each gait and divided the measured data into individual gaitcycles, as shown in Figure 2c,d. Note that we split the gait cycles by the mid-swing in thatlabelling the mid-swing is much easier and more direct than labelling the heel-strike [8].The model development will be similar if the gait cycles are partitioned by the heel-strikeor the toe-off. We then normalized the gait data by dividing it into one hundred points for

Sensors 2021, 21, 1864 5 of 18
each gait cycle; this was done because each subject had a different walking speed and thedata length for each gait cycle was not the same.
Sensors 2021, 21, x FOR PEER REVIEW 5 of 18
cycle; this was done because each subject had a different walking speed and the data length for each gait cycle was not the same.
(a) (b)
(c) (d)
Figure 2. The angular velocities and gait patterns of a stroke subject P8. (a) angular velocity of the left leg; (b) angular velocity of the right (paretic) leg; (c) gait cycles of the left leg; (d) gait cycles of the right (paretic) leg.
By contrast, we illustrate the angular velocities yω of the healthy subject H7 in Fig-ure 3, where the healthy subject’s gaits tend to be smoother than the stroke patient’s gaits shown in Figure 2. We further compare the gait cycles of other stroke patients and healthy subjects, as shown in Appendix B, and find that the stroke subjects’ gaits have significantly more trembles and vibration, especially on the paretic side. Hence, it is not difficult to distinguish the stroke gaits from the healthy gaits [10,13,14]. Nevertheless, the classifica-tion of abnormal stroke gaits is challenging because each patient might develop various combination of gait abnormalities which simultaneously affect the gait patterns. There-fore, we propose a DNN model structure for detecting and classifying the stroke gaits.
We labelled the gait data from the stroke patients and the healthy subjects as the stroke gait (SG) and the normal gait (NG), respectively. The stroke gaits were further clas-sified as the stroke gait with a drop foot (SGwDF), the stroke gait with circumduction (SGwC), the stroke gait with hip hiking (SGwHH), and the stroke gait with back knee (SGwBK), according to the therapists’ diagnoses. Because the patients might or might not have had these abnormal gaits, we set four labels to build a multi-label classification model, as shown in Table 3. For example, patient P5 had all four gait abnormalities on the right leg, while patient P6 had both the drop foot gait and the back knee gait on the left leg. Conversely, Patient P7 had only the hip hiking gait on the left leg. We applied the gait data from Table 3 to establish a gait dataset with 4037 gaits, including 2037 stroke gaits and 2000 normal gaits, as illustrated in Appendix C.
Figure 2. The angular velocities and gait patterns of a stroke subject P8. (a) angular velocity of the left leg; (b) angularvelocity of the right (paretic) leg; (c) gait cycles of the left leg; (d) gait cycles of the right (paretic) leg.
By contrast, we illustrate the angular velocities ωy of the healthy subject H7 in Figure 3,where the healthy subject’s gaits tend to be smoother than the stroke patient’s gaits shownin Figure 2. We further compare the gait cycles of other stroke patients and healthy subjects,as shown in Appendix B, and find that the stroke subjects’ gaits have significantly moretrembles and vibration, especially on the paretic side. Hence, it is not difficult to distinguishthe stroke gaits from the healthy gaits [10,13,14]. Nevertheless, the classification of abnor-mal stroke gaits is challenging because each patient might develop various combination ofgait abnormalities which simultaneously affect the gait patterns. Therefore, we propose aDNN model structure for detecting and classifying the stroke gaits.
We labelled the gait data from the stroke patients and the healthy subjects as the strokegait (SG) and the normal gait (NG), respectively. The stroke gaits were further classifiedas the stroke gait with a drop foot (SGwDF), the stroke gait with circumduction (SGwC),the stroke gait with hip hiking (SGwHH), and the stroke gait with back knee (SGwBK),according to the therapists’ diagnoses. Because the patients might or might not have hadthese abnormal gaits, we set four labels to build a multi-label classification model, as shownin Table 3. For example, patient P5 had all four gait abnormalities on the right leg, whilepatient P6 had both the drop foot gait and the back knee gait on the left leg. Conversely,

Sensors 2021, 21, 1864 6 of 18
Patient P7 had only the hip hiking gait on the left leg. We applied the gait data from Table 3to establish a gait dataset with 4037 gaits, including 2037 stroke gaits and 2000 normal gaits,as illustrated in Appendix C.
Sensors 2021, 21, x FOR PEER REVIEW 6 of 18
(a) (b)
(c) (d)
Figure 3. The angular velocities and gait patterns of a healthy subject H7. (a) Angular velocity of the left leg; (b) angular velocity of the right leg; (c) gait cycles of the left leg; (d) gait cycles of the right leg.
Table 3. The labelled data.
Subject Number of Gaits NG SG SGwDF SGwC SGwHH SGwBK
P1 left 50 0 1 0 0 0 0
right 39 0 1 0 0 1 1
P2 left 68 0 1 0 0 0 0
right 52 0 1 1 0 1 0
P3 left 92 0 1 0 0 0 0
right 76 0 1 0 1 0 0
P4 left 187 0 1 0 1 1 1
right 190 0 1 0 0 0 0
P5 left 169 0 1 0 0 0 0
right 158 0 1 1 1 1 1
P6 left 158 0 1 1 0 0 1
right 171 0 1 0 0 0 0
P7 left 139 0 1 0 0 1 0
right 158 0 1 0 0 0 0
P8 left 155 0 1 0 0 0 0
right 175 0 1 1 0 1 0
Healthy Subjects left 1000 1 0 0 0 0 0
right 1000 1 0 0 0 0 0
Figure 3. The angular velocities and gait patterns of a healthy subject H7. (a) Angular velocity of the left leg; (b) angularvelocity of the right leg; (c) gait cycles of the left leg; (d) gait cycles of the right leg.
Table 3. The labelled data.
Subject Number of Gaits NG SG SGwDF SGwC SGwHH SGwBK
P1 left 50 0 1 0 0 0 0right 39 0 1 0 0 1 1
P2 left 68 0 1 0 0 0 0right 52 0 1 1 0 1 0
P3 left 92 0 1 0 0 0 0right 76 0 1 0 1 0 0
P4 left 187 0 1 0 1 1 1right 190 0 1 0 0 0 0
P5 left 169 0 1 0 0 0 0right 158 0 1 1 1 1 1
P6 left 158 0 1 1 0 0 1right 171 0 1 0 0 0 0
P7 left 139 0 1 0 0 1 0right 158 0 1 0 0 0 0
P8 left 155 0 1 0 0 0 0right 175 0 1 1 0 1 0
Healthy Subjects left 1000 1 0 0 0 0 0right 1000 1 0 0 0 0 0
Sensors 2021, 21, 1864 7 of 18
3. Deep Neural Network Model
This section develops a DNN model to recognize stroke gaits. We applied the mea-sured gait data to develop a DNN model that can identify and classify the stroke gaits.
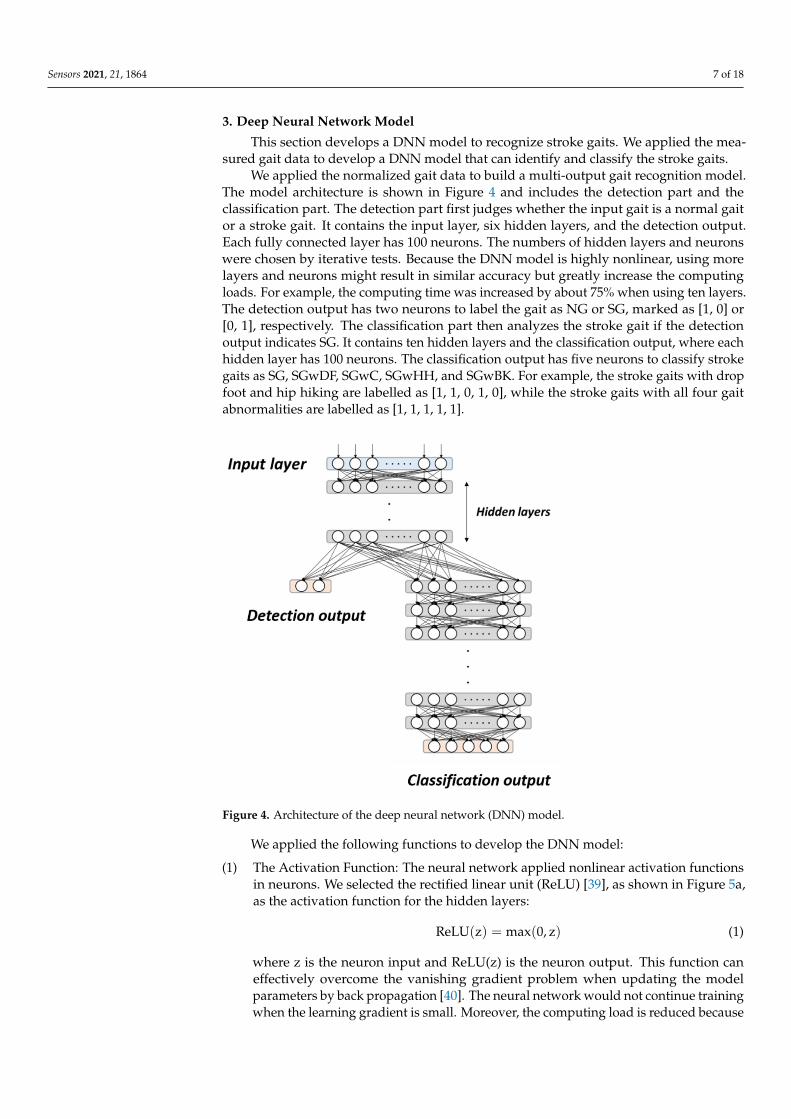
We applied the normalized gait data to build a multi-output gait recognition model.The model architecture is shown in Figure 4 and includes the detection part and theclassification part. The detection part first judges whether the input gait is a normal gaitor a stroke gait. It contains the input layer, six hidden layers, and the detection output.Each fully connected layer has 100 neurons. The numbers of hidden layers and neuronswere chosen by iterative tests. Because the DNN model is highly nonlinear, using morelayers and neurons might result in similar accuracy but greatly increase the computingloads. For example, the computing time was increased by about 75% when using ten layers.The detection output has two neurons to label the gait as NG or SG, marked as [1, 0] or[0, 1], respectively. The classification part then analyzes the stroke gait if the detectionoutput indicates SG. It contains ten hidden layers and the classification output, where eachhidden layer has 100 neurons. The classification output has five neurons to classify strokegaits as SG, SGwDF, SGwC, SGwHH, and SGwBK. For example, the stroke gaits with dropfoot and hip hiking are labelled as [1, 1, 0, 1, 0], while the stroke gaits with all four gaitabnormalities are labelled as [1, 1, 1, 1, 1].
Sensors 2021, 21, x FOR PEER REVIEW 7 of 18
right 1000 1 0 0 0 0 0
3. Deep Neural Network Model This section develops a DNN model to recognize stroke gaits. We applied the meas-
ured gait data to develop a DNN model that can identify and classify the stroke gaits. We applied the normalized gait data to build a multi-output gait recognition model.
The model architecture is shown in Figure 4 and includes the detection part and the clas-sification part. The detection part first judges whether the input gait is a normal gait or a stroke gait. It contains the input layer, six hidden layers, and the detection output. Each fully connected layer has 100 neurons. The numbers of hidden layers and neurons were chosen by iterative tests. Because the DNN model is highly nonlinear, using more layers and neurons might result in similar accuracy but greatly increase the computing loads. For example, the computing time was increased by about 75% when using ten layers. The detection output has two neurons to label the gait as NG or SG, marked as [1, 0] or [0, 1], respectively. The classification part then analyzes the stroke gait if the detection output indicates SG. It contains ten hidden layers and the classification output, where each hid-den layer has 100 neurons. The classification output has five neurons to classify stroke gaits as SG, SGwDF, SGwC, SGwHH, and SGwBK. For example, the stroke gaits with drop foot and hip hiking are labelled as [1, 1, 0, 1, 0], while the stroke gaits with all four gait abnormalities are labelled as [1, 1, 1, 1, 1].
Figure 4. Architecture of the deep neural network (DNN) model.
We applied the following functions to develop the DNN model: (1) The Activation Function: The neural network applied nonlinear activation functions
in neurons. We selected the rectified linear unit (ReLU) [39], as shown in Figure 5a, as the activation function for the hidden layers:
=ReLU(z) max(0,z) (1)
where z is the neuron input and ReLU(z) is the neuron output. This function can effectively overcome the vanishing gradient problem when updating the model pa-rameters by back propagation [40]. The neural network would not continue training when the learning gradient is small. Moreover, the computing load is reduced be-cause the function judges whether the input is greater than 0. That is, the ReLU
Figure 4. Architecture of the deep neural network (DNN) model.
We applied the following functions to develop the DNN model:
(1) The Activation Function: The neural network applied nonlinear activation functionsin neurons. We selected the rectified linear unit (ReLU) [39], as shown in Figure 5a,as the activation function for the hidden layers:
ReLU(z) = max(0, z) (1)
where z is the neuron input and ReLU(z) is the neuron output. This function caneffectively overcome the vanishing gradient problem when updating the modelparameters by back propagation [40]. The neural network would not continue trainingwhen the learning gradient is small. Moreover, the computing load is reduced because

Sensors 2021, 21, 1864 8 of 18
the function judges whether the input is greater than 0. That is, the ReLU function isa complete transfer for positive gradients with a derivative of 1. If the input z < 0,then ReLU(z) = 0 and this neuron is directly deleted, thereby achieving a reduction inneurons and allowing rapid convergence.
Sensors 2021, 21, x FOR PEER REVIEW 8 of 18
0<z , then ReLU(z) = 0 and this neuron is directly deleted, thereby achieving a re-duction in neurons and allowing rapid convergence. Conversely, we selected the following sigmoid function [41] as the activation func-tion of the output layers:
( ) 11 ze
zσ −+=
(2)
where z is the neuron input and (z)σ is the neuron output. The sigmoid function converts a scalar number to [0, 1], as shown in Figure 5b. If (z)σ is greater than a threshold of 0.5, it is considered to belong to the labelled category. The sigmoid func-tion is the optimized fitting function of the binary classification problem, where its output corresponds to the loss function mentioned in the next section. Because the probability of each label is independent, the sigmoid function is usually used as the activation function of the output layer for multi-label classification.
(a) (b)
Figure 5. The activation functions. (a) the rectified linear unit (ReLU) function; (b) the sigmoid function.
(2) The Loss Function: The loss function is applied to evaluate how well the algorithms interpret the given data. This function evaluates the loss of the model and updates the weights to reduce the loss on the next evaluation. We applied the following cross-entropy [42] as the loss function:
( )1
1 log( ) (1 ) log(1 )=
= − ⋅ + − ⋅ −n
i i i ii
ˆ ˆ ˆC y,y y y y yn
(3)
where iy is the distribution of the true output and iy is the distribution of the pre-dicted output. Cross entropy can measure and quantify the similarity between iy and iy . In addition, it can help to avoid learning rate decreases in the gradient de-scent [43] by simultaneously applying the cross-entropy as the loss function and the sigmoid function as the activation function to the output layer.
(3) The Optimizer: We selected Adam [44] as the optimizer of the DNN model. Adam is an adaptive learning rate optimization algorithm designed specifically for training DNNs, because it combines the advantages of Adagrad [45] and RMSprop [46] by calculating the gradients and updating the weights [43].
4. Model Training and Validation This section introduces the model training process and model validation. We applied
the k-fold cross-validation test [47] to evaluate the performance of the model. In this pa-per, we set k = 4 by dividing all classes of gait data into four parts (Fold 1, Fold 2, Fold 3,
Figure 5. The activation functions. (a) the rectified linear unit (ReLU) function; (b) the sigmoid function.
Conversely, we selected the following sigmoid function [41] as the activation functionof the output layers:
σ(z) =1
1 + e−z (2)
where z is the neuron input and σ(z) is the neuron output. The sigmoid functionconverts a scalar number to [0, 1], as shown in Figure 5b. If σ(z) is greater thana threshold of 0.5, it is considered to belong to the labelled category. The sigmoidfunction is the optimized fitting function of the binary classification problem, whereits output corresponds to the loss function mentioned in the next section. Because theprobability of each label is independent, the sigmoid function is usually used as theactivation function of the output layer for multi-label classification.
(2) The Loss Function: The loss function is applied to evaluate how well the algorithmsinterpret the given data. This function evaluates the loss of the model and updatesthe weights to reduce the loss on the next evaluation. We applied the followingcross-entropy [42] as the loss function:
C(y, y) = − 1n
n
∑i=1
yi · log(yi) + (1 − yi)·log(1 − yi) (3)
where yi is the distribution of the true output and yi is the distribution of the predictedoutput. Cross entropy can measure and quantify the similarity between yi and yi.In addition, it can help to avoid learning rate decreases in the gradient descent [43]by simultaneously applying the cross-entropy as the loss function and the sigmoidfunction as the activation function to the output layer.
(3) The Optimizer: We selected Adam [44] as the optimizer of the DNN model. Adam isan adaptive learning rate optimization algorithm designed specifically for trainingDNNs, because it combines the advantages of Adagrad [45] and RMSprop [46] bycalculating the gradients and updating the weights [43].
4. Model Training and Validation
This section introduces the model training process and model validation. We appliedthe k-fold cross-validation test [47] to evaluate the performance of the model. In thispaper, we set k = 4 by dividing all classes of gait data into four parts (Fold 1, Fold 2,Fold 3, and Fold 4), and we then arranged them randomly for training and validating.

Sensors 2021, 21, 1864 9 of 18
Each training took three of the four folds as a training dataset and used the remainingfold as validation. Figure 6 shows the training and validating flow chart, where the 4-foldcross-validation was repeated four times.
Sensors 2021, 21, x FOR PEER REVIEW 9 of 18
paper, we set k = 4 by dividing all classes of gait data into four parts (Fold 1, Fold 2, Fold 3, and Fold 4), and we then arranged them randomly for training and validating. Each training took three of the four folds as a training dataset and used the remaining fold as validation. Figure 6 shows the training and validating flow chart, where the 4-fold cross-validation was repeated four times.
Figure 6. The model training and validating procedures.
In the training process, 500 samples were selected for each model training (batch size = 500) to update the weights. The training data passed through the layers of the model with present parameters and the ReLU function. Then, the obtained evaluation output was compared with the ground truth label by clinical experts to calculate the correspond-ing model loss by the loss function and to update model parameters by back propagation. This training process was repeated sixty times (Epochs = 60), where the model parameters were optimized and the model loss was minimized by repeated training. The phenomena of overfitting and excessive time in the training process were avoided by adding Dropout [48], with a dropout rate of 0.2, to each fully connected layer in the classification part of the model. This gave each neuron a probability of 20% of being deleted. Finally, the re-maining fold was inputted to the trained models to verify the correction of these models in the validation process.
The correction of a model is frequently quantitatively indicated by the confusion ma-trix, as illustrated in Table 4. Based on Table 4, the following indicators are frequently applied to evaluate the quality of model training [49]:
TP+TNTP+FP+FN+TN
Accuracy = (4)
TPTP+FP
Precision = (5)
TPTP+FN
Recall = (6)
2× ×− =+
Precision RecallF1 scorePrecision Recall
(7)
where Accuracy is the most intuitive indicator, although it might be invalid in some cases [49]. In this paper, we apply Accuracy and F1-score to demonstrate the quality of the de-veloped DNN model.
Figure 6. The model training and validating procedures.
In the training process, 500 samples were selected for each model training (batchsize = 500) to update the weights. The training data passed through the layers of the modelwith present parameters and the ReLU function. Then, the obtained evaluation output wascompared with the ground truth label by clinical experts to calculate the correspondingmodel loss by the loss function and to update model parameters by back propagation.This training process was repeated sixty times (Epochs = 60), where the model parameterswere optimized and the model loss was minimized by repeated training. The phenomena ofoverfitting and excessive time in the training process were avoided by adding Dropout [48],with a dropout rate of 0.2, to each fully connected layer in the classification part of themodel. This gave each neuron a probability of 20% of being deleted. Finally, the remainingfold was inputted to the trained models to verify the correction of these models in thevalidation process.
The correction of a model is frequently quantitatively indicated by the confusionmatrix, as illustrated in Table 4. Based on Table 4, the following indicators are frequentlyapplied to evaluate the quality of model training [49]:
Accuracy =TP + TN
TP + FP + FN + TN(4)
Precision =TP
TP + FP(5)
Recall =TP
TP + FN(6)
F1 − score =2 × Precision × Recall
Precision + Recall(7)
where Accuracy is the most intuitive indicator, although it might be invalid in somecases [49]. In this paper, we apply Accuracy and F1-score to demonstrate the quality of thedeveloped DNN model.

Sensors 2021, 21, 1864 10 of 18
Table 4. The confusion matrix.
ActualPositive Negative
PredictedPositive TP FP
Negative FN TNTP: True Positive; FP: False Positive; FN: False Negative; TN: True Negative.
The confusion matrix of the detection layer is shown in Table 5, where model i appliedall gait data except Fold i for training and used the gait data of Fold i for validation.The results show that the model can successfully identify the stroke gaits with only fewerrors on the FP and FN terms. The confusion matrix of the classification layer is shown inTable 6, where P and N represent positive and negative, respectively. We independentlylist the output neurons and observe that some errors occur in classifying the four gaitabnormalities: drop foot, circumduction, hip hiking, and back knee gaits. The overall testresults are shown in Table 7. The detection layer achieves an average accuracy of 99.35%and an average F1-score of 0.9935 in detecting the stroke gaits, while the classification layerachieves an average accuracy of 97.31% and an average F1-score of 0.9662 in classifying theabnormal stroke gaits.
Table 5. Confusion matrix of the DNN models for stroke detection.
Predicted
Actual Normal Gait Stroke Gait
Positive Negative Positive Negative
Model 1 validation by Fold 1 Positive 496 3 497 5Negative 4 497 3 495
Model 2 validation by Fold 2 Positive 495 2 500 8Negative 5 498 0 492
Model 3 validation by Fold 3 Positive 498 2 497 2Negative 2 498 3 498
Model 4 validation by Fold 4 Positive 496 3 497 3Negative 4 497 3 497
Table 6. Confusion matrix of the DNN models for the classification of stroke gaits.
Predicted
Actual Stroke Gait Drop Foot Circumduction Hip Hiking Back Knee
P N P N P N P N P N
Model 1 P 497 5 77 5 77 0 154 10 105 8N 0 0 2 418 20 405 17 321 21 368
Model 2 P 500 8 96 7 98 11 178 14 112 5N 0 0 4 401 0 399 4 312 20 371
Model 3 P 497 2 101 4 113 2 197 5 131 8N 0 0 6 388 4 380 10 287 1 359
Model 4 P 497 3 89 7 98 9 168 13 123 4N 0 0 4 400 4 489 5 314 19 354
Table 7. Validation results of the DNN models.
Detection Classification
Accuracy F1-Score Accuracy F1-Score
Model 1 0.9925 0.9925 0.9649 0.9539Model 2 0.9925 0.9925 0.9717 0.9642Model 3 0.9955 0.9955 0.9831 0.9802Model 4 0.9935 0.9935 0.9728 0.9663
Average 0.9935 0.9935 0.9731 0.9662
Gait is a symmetrical and rhythmic periodic motion that can be disrupted by stroke.Abnormal stroke gaits can decrease the efficiency of walking; therefore, the identification of

Sensors 2021, 21, 1864 11 of 18
gait abnormalities and the development of appropriate training strategies for rehabilitationare very important. From Table 7, the developed DNN models are deemed effective indetecting and classifying stroke gaits. However, the classification model is not as good asthe detection model. One possible reason is that the number of stroke gaits in the datasetis insufficient; hence, the number of samples for SGwDF, SGwC, SGwHH, and SGwBK isnot representative. That is, the accuracy of the classification can be further improved byadding additional abnormal gaits. In the future, we can collect more abnormal gait data tofurther improve the efficiency of the model.
We also applied the public dataset Physical Activity Monitoring Data Set (PAMAP2) [50],available in the UCI machine learning repository [51], to evaluate the developed model.This dataset consists of nine healthy subjects (one female and eight males) who wore IMUdevices and conducted 12 different activity tests, including standing, sitting, and walking.We applied the angular velocity of the shank in the walking activities as the input datato the four DNN models. Because there is no public dataset for stroke gaits, we invitedtwo stroke patients to conduct experiments and measured their gaits to test the developedmodels. The data of these two stroke subjects are illustrated in Appendix D and theirgait data is illustrated in Appendix C. The testing results are shown in Table 8, where theaverage accuracy is 99.34% and the average F1-score is 0.9939. That is, the developed DNNmodel is effective in detecting gaits from data in public domains.
Table 8. Gait detection using the data set Physical Activity Monitoring Data Set (PAMAP2) and twoextra stroke patients.
Predicted
Actual PAMAP2 Test Sv1 and Sv2
P N Accuracy F1-Score P N Accuracy F1-Score
Model 1 P 1005 0 1 1 219 0 0.9909 0.9909N 0 0 2 0
Model 2 P 1004 0 0.9990 0.9995 219 0 0.9909 0.9909N 1 0 2 0
Model 3 P 1005 0 1 1 217 0 0.9819 0.9841N 0 0 4 0
Model 4 P 1003 0 0.9980 0.9990 218 0 0.9864 0.9864N 2 0 3 0
5. Discussion
This study develops DNN models to recognize four common stroke gaits, includingthose with a drop foot, circumduction gait, those with hip hiking, and the stroke gait withback knee. Stroke patients usually suffer from partial disability and develop abnormal gaitsthat can vary significantly and need targeted rehabilitation strategies. Therefore, evaluationof gait patterns is crucial for clinical experts to make decisions on the medication and reha-bilitation methods for the stroke patients. In current clinical practice, gait pattern diagnosismainly relies on the experience of clinicians or physical therapists to make judgments,and there is no objective diagnostic standard. Different clinicians or therapists might havedifferent diagnosis of stroke gait patterns. In addition, some patients may present withmixed neurological gaits. Therefore, many researchers have attempted to develop objectivemeans for identifying gait events and gait abnormalities [7–10]. Some studies appliedmachine learning techniques to improve the identification performance [11–14]. However,no research has yet been conducted on the classification of stroke gaits. Hence, in thispaper, we applied deep learning technologies to detect and classify stroke gaits as an aid todiagnosis and for application of appropriate rehabilitation methods for stroke patients.
In this study, we collected clinical gait data from eight stroke patients and sevenhealthy subjects. Their gait patterns were diagnosed by two physical therapists whowere more than 15 years qualified, with at least 10 years of daily experience workingwith patients with stroke. Then, we apply the clinical data to develop DNN models todetect stroke gaits and to classify four common gait abnormalities seen in stroke patients.

Sensors 2021, 21, 1864 12 of 18
The developed models were shown to achieve high accuracies in detecting the stroke gaitsand classifying the gait abnormality. Therefore, our DNN model could assist physicaltherapists or physicians for more optimizing the diagnosis of different stroke gaits andmaking decisions about the medication and rehabilitation strategies for the stroke patients.The limitation of this study is the number of enrolled patients is relatively small. A futurelarge-scale study enrolling more patients with stroke is needed to validate the effectivenessof our established DNN structure.
6. Conclusions
This paper has developed DNN models that can detect stroke gaits and classify gaitabnormalities. First, we collected clinical gait data from eight stroke patients and sevenhealthy subjects. The stroke gaits were further analyzed to indicate four common abnormalgaits in the stroke patients: the drop foot gait, the circumduction gait, the hip hiking gait,and the back knee gait. We applied IMUs to collect gait information from the stroke patientsand healthy subjects. The obtained gait data were then analyzed to establish an expertdataset and to develop DNN models for recognizing the stroke gaits. The results showedthat the developed DNN models achieved an average accuracy of 99.35% for detecting thestroke gaits and an average accuracy of 97.31% for classifying the gait abnormality. We alsoapplied the PAMAP2 public dataset to the DNN models and achieved an average accuracyof 99.92% and an average F1-score of 0.9996. The effectiveness of the DNN structurecould be further verified by recruiting more subjects. In the future, the proposed DNNmodel could help therapists to identify abnormal gaits and to apply suitable rehabilitationmethods. The model can be further expanded in the future to identify more types ofabnormal gaits, such as the Trendelenburg gait and the scissor gait, associated with otherneurologic or musculoskeletal disorders.
Author Contributions: Conceptualization, F.-C.W., S.-F.C., C.-H.L.; methodology, F.-C.W., S.-F.C.,C.-H.L. and A.-C.L.; software, C.-J.S., W.Y., Y.-C.L. and T.-Y.K.; validation, F.-C.W.; formal analysis,F.-C.W., C.-J.S., W.Y., Y.-C.L. and T.-Y.K.; investigation, F.-C.W., C.-J.S., W.Y., Y.-C.L. and T.-Y.K.;resources, F.-C.W., S.-F.C., C.-H.L. and A.-C.L.; data curation, S.-F.C., C.-H.L., A.-C.L., C.-J.S. andT.-Y.K.; writing—original draft preparation, F.-C.W., S.-F.C., C.-H.L.; C.-J.S., W.Y., Y.-C.L. and T.-Y.K.;writing—review and editing, F.-C.W., S.-F.C. and C.-H.L.; visualization, F.-C.W., C.-J.S., W.Y., Y.-C.L. and T.-Y.K.; supervision, F.-C.W.; project administration, F.-C.W.; funding acquisition, F.-C.W.All authors have read and agreed to the published version of the manuscript.
Funding: This research was funded by the Joint Project between Industrial Technology ResearchInstitute of Taiwan and National Taiwan University under Grands 104-MSL01 and 105-MSL01.This research was also financially supported in part by the Ministry of Science and Technology ofTaiwan (Grands MOST 107-2634-F-002-018, MOST 108-2634-F-002-016-, MOST 109-2634-F-002-027-)and National Taiwan University, Center for Artificial Intelligence & Advanced Robotics.
Institutional Review Board Statement: The studies were approved by the Human Subject ResearchEthics Committee of Institutional Review Board with the number of 201510EM011.
Informed Consent Statement: Informed consent was obtained from all subjects involved in the study.
Data Availability Statement: The dataset of gaits applied in this paper is available at http://140.112.14.7/~sic/PaperMaterial/Dataset.zip. (accessed on 1 March 2021) The public dataset PAMAP2is available at: http://archive.ics.uci.edu/ml/datasets/PAMAP2+Physical+Activity+Monitoring.(accessed on 1 March 2021).
Acknowledgments: This work was financially supported in part by the Joint Project between In-dustrial Technology Research Institute of Taiwan and National Taiwan University under Grands104-MSL01 and 105-MSL01. This research was also financially supported in part by the Ministry ofScience and Technology of Taiwan (Grands MOST 107-2634-F-002-018, MOST 108-2634-F-002-016-,MOST 109-2634-F-002-027-) and National Taiwan University, Center for Artificial Intelligence &Advanced Robotics.

Sensors 2021, 21, 1864 13 of 18
Conflicts of Interest: The authors declare no conflict of interest. The funders had no role in the designof the study; in the collection, analyses, or interpretation of data; in the writing of the manuscript, orin the decision to publish the results.
Appendix A
The studies were approved by the Human Subject Research Ethics Committee of theInstitutional Review Board (IRB), available at: http://140.112.14.7/~sic/PaperMaterial/IRB_renew.pdf. (accessed on 1 March 2021).
Appendix B
The gait cycles of the stroke patients P1~P7 and the healthy subjects H1~H6.
Sensors 2021, 21, x FOR PEER REVIEW 15 of 20
(a) (b)
(c) (d)
(e) (f)
Figure A1. Cont.

Sensors 2021, 21, 1864 14 of 18Sensors 2021, 21, x FOR PEER REVIEW 16 of 20
(g) (h)
(i) (j)
(k) (l)
(m) (n)
Figure A1. The gait patterns of stroke subjects. (a) left gait cycles of P1; (b) right gait cycles of P1; (c) left gait cycles of P2;
(d) right gait cycles of P2; (e) left gait cycles of P3; (f) right gait cycles of P3; (g) left gait cycles of P4; (h) right gait cycles of
P4; (i) left gait cycles of P5; (j) right gait cycles of P5; (k) left gait cycles of P6; (l) right gait cycles of P6; (m) left gait cycles
of P7; (n) right gait cycles of P7.
Figure A1. The gait patterns of stroke subjects. (a) left gait cycles of P1; (b) right gait cycles of P1; (c) left gait cycles of P2;(d) right gait cycles of P2; (e) left gait cycles of P3; (f) right gait cycles of P3; (g) left gait cycles of P4; (h) right gait cycles ofP4; (i) left gait cycles of P5; (j) right gait cycles of P5; (k) left gait cycles of P6; (l) right gait cycles of P6; (m) left gait cycles ofP7; (n) right gait cycles of P7.

Sensors 2021, 21, 1864 15 of 18Sensors 2021, 21, x FOR PEER REVIEW 17 of 20
(a) (b)
(c) (d)
(e) (f)
(g) (h)
Figure A2. Cont.

Sensors 2021, 21, 1864 16 of 18Sensors 2021, 21, x FOR PEER REVIEW 16 of 18
(g) (h)
(i) (j)
(k) (l)
Figure A2. The gait patterns of healthy subjects. (a) left gait cycles of H1; (b) right gait cycles of H1; (c) left gait cycles of H2; (d) right gait cycles of H2; (e) left gait cycles of H3; (f) right gait cycles of H3; (g) left gait cycles of H4; (h) right gait cycles of H4; (i) left gait cycles of H5; (j) right gait cycles of H5; (k) left gait cycles of H6; (l) right gait cycles of H6.
Appendix C The dataset of gaits in this paper is available at: http://140.112.14.7/~sic/PaperMaterial/Da-
taset.zip. (accessed on 1 March 2020)
Appendix D The data of two stroke subjects for model verification.
Table A1. Basic data of the two stroke subjects for model verification.
Stroke Subject
Subject Gender Age Height (cm)
Weight (kg)
Paretic Side
MMSE (Score)
BS (Stage)
FAC (Stage)
Sv1 Male 41 171 70 left 30 4 6 Sv2 Female 50 155 52 left 30 3 6
Figure A2. The gait patterns of healthy subjects. (a) left gait cycles of H1; (b) right gait cycles of H1; (c) left gait cycles of H2;(d) right gait cycles of H2; (e) left gait cycles of H3; (f) right gait cycles of H3; (g) left gait cycles of H4; (h) right gait cycles ofH4; (i) left gait cycles of H5; (j) right gait cycles of H5; (k) left gait cycles of H6; (l) right gait cycles of H6.
Appendix C
The dataset of gaits in this paper is available at: http://140.112.14.7/~sic/PaperMaterial/Dataset.zip. (accessed on 1 March 2020).
Appendix D
The data of two stroke subjects for model verification.
Sensors 2021, 21, 1864 17 of 18
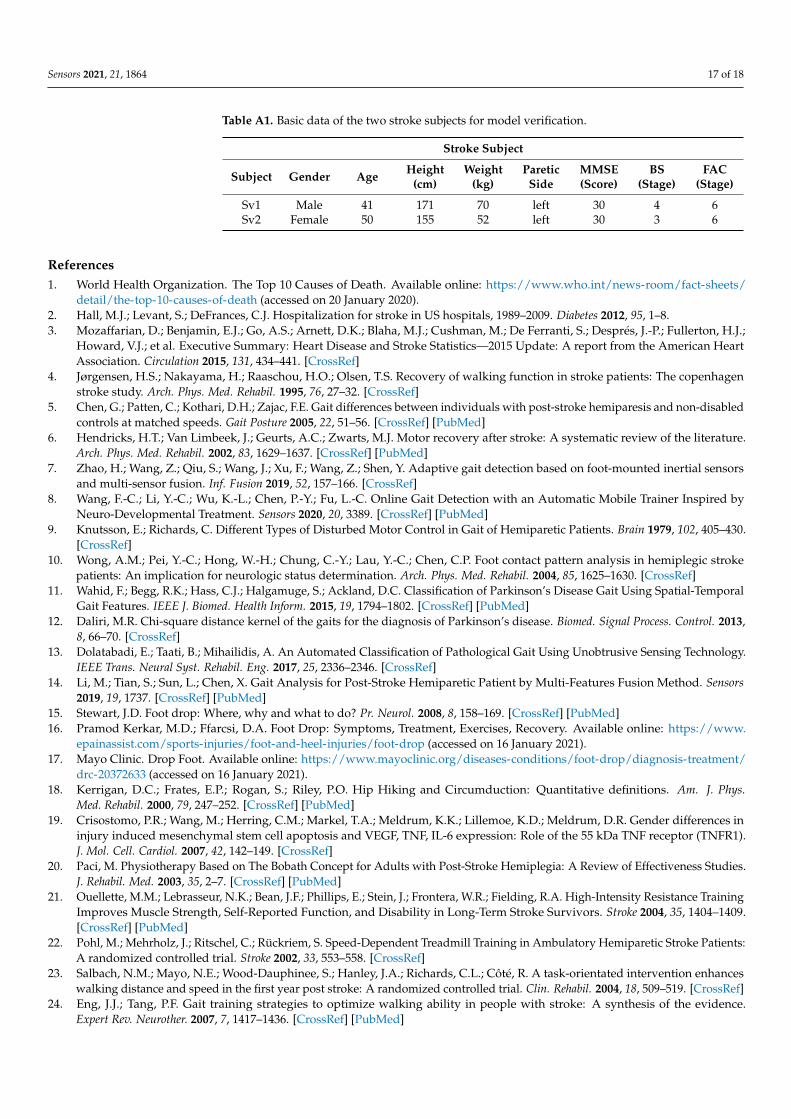
Table A1. Basic data of the two stroke subjects for model verification.
Stroke Subject
Subject Gender Age Height(cm)
Weight(kg)
PareticSide
MMSE(Score)
BS(Stage)
FAC(Stage)
Sv1 Male 41 171 70 left 30 4 6Sv2 Female 50 155 52 left 30 3 6
References1. World Health Organization. The Top 10 Causes of Death. Available online: https://www.who.int/news-room/fact-sheets/
detail/the-top-10-causes-of-death (accessed on 20 January 2020).2. Hall, M.J.; Levant, S.; DeFrances, C.J. Hospitalization for stroke in US hospitals, 1989–2009. Diabetes 2012, 95, 1–8.3. Mozaffarian, D.; Benjamin, E.J.; Go, A.S.; Arnett, D.K.; Blaha, M.J.; Cushman, M.; De Ferranti, S.; Després, J.-P.; Fullerton, H.J.;
Howard, V.J.; et al. Executive Summary: Heart Disease and Stroke Statistics—2015 Update: A report from the American HeartAssociation. Circulation 2015, 131, 434–441. [CrossRef]
4. Jørgensen, H.S.; Nakayama, H.; Raaschou, H.O.; Olsen, T.S. Recovery of walking function in stroke patients: The copenhagenstroke study. Arch. Phys. Med. Rehabil. 1995, 76, 27–32. [CrossRef]
5. Chen, G.; Patten, C.; Kothari, D.H.; Zajac, F.E. Gait differences between individuals with post-stroke hemiparesis and non-disabledcontrols at matched speeds. Gait Posture 2005, 22, 51–56. [CrossRef] [PubMed]
6. Hendricks, H.T.; Van Limbeek, J.; Geurts, A.C.; Zwarts, M.J. Motor recovery after stroke: A systematic review of the literature.Arch. Phys. Med. Rehabil. 2002, 83, 1629–1637. [CrossRef] [PubMed]
7. Zhao, H.; Wang, Z.; Qiu, S.; Wang, J.; Xu, F.; Wang, Z.; Shen, Y. Adaptive gait detection based on foot-mounted inertial sensorsand multi-sensor fusion. Inf. Fusion 2019, 52, 157–166. [CrossRef]
8. Wang, F.-C.; Li, Y.-C.; Wu, K.-L.; Chen, P.-Y.; Fu, L.-C. Online Gait Detection with an Automatic Mobile Trainer Inspired byNeuro-Developmental Treatment. Sensors 2020, 20, 3389. [CrossRef] [PubMed]
9. Knutsson, E.; Richards, C. Different Types of Disturbed Motor Control in Gait of Hemiparetic Patients. Brain 1979, 102, 405–430.[CrossRef]
10. Wong, A.M.; Pei, Y.-C.; Hong, W.-H.; Chung, C.-Y.; Lau, Y.-C.; Chen, C.P. Foot contact pattern analysis in hemiplegic strokepatients: An implication for neurologic status determination. Arch. Phys. Med. Rehabil. 2004, 85, 1625–1630. [CrossRef]
11. Wahid, F.; Begg, R.K.; Hass, C.J.; Halgamuge, S.; Ackland, D.C. Classification of Parkinson’s Disease Gait Using Spatial-TemporalGait Features. IEEE J. Biomed. Health Inform. 2015, 19, 1794–1802. [CrossRef] [PubMed]
12. Daliri, M.R. Chi-square distance kernel of the gaits for the diagnosis of Parkinson’s disease. Biomed. Signal Process. Control. 2013,8, 66–70. [CrossRef]
13. Dolatabadi, E.; Taati, B.; Mihailidis, A. An Automated Classification of Pathological Gait Using Unobtrusive Sensing Technology.IEEE Trans. Neural Syst. Rehabil. Eng. 2017, 25, 2336–2346. [CrossRef]
14. Li, M.; Tian, S.; Sun, L.; Chen, X. Gait Analysis for Post-Stroke Hemiparetic Patient by Multi-Features Fusion Method. Sensors2019, 19, 1737. [CrossRef] [PubMed]
15. Stewart, J.D. Foot drop: Where, why and what to do? Pr. Neurol. 2008, 8, 158–169. [CrossRef] [PubMed]16. Pramod Kerkar, M.D.; Ffarcsi, D.A. Foot Drop: Symptoms, Treatment, Exercises, Recovery. Available online: https://www.
epainassist.com/sports-injuries/foot-and-heel-injuries/foot-drop (accessed on 16 January 2021).17. Mayo Clinic. Drop Foot. Available online: https://www.mayoclinic.org/diseases-conditions/foot-drop/diagnosis-treatment/
drc-20372633 (accessed on 16 January 2021).18. Kerrigan, D.C.; Frates, E.P.; Rogan, S.; Riley, P.O. Hip Hiking and Circumduction: Quantitative definitions. Am. J. Phys.
Med. Rehabil. 2000, 79, 247–252. [CrossRef] [PubMed]19. Crisostomo, P.R.; Wang, M.; Herring, C.M.; Markel, T.A.; Meldrum, K.K.; Lillemoe, K.D.; Meldrum, D.R. Gender differences in
injury induced mesenchymal stem cell apoptosis and VEGF, TNF, IL-6 expression: Role of the 55 kDa TNF receptor (TNFR1).J. Mol. Cell. Cardiol. 2007, 42, 142–149. [CrossRef]
20. Paci, M. Physiotherapy Based on The Bobath Concept for Adults with Post-Stroke Hemiplegia: A Review of Effectiveness Studies.J. Rehabil. Med. 2003, 35, 2–7. [CrossRef] [PubMed]
21. Ouellette, M.M.; Lebrasseur, N.K.; Bean, J.F.; Phillips, E.; Stein, J.; Frontera, W.R.; Fielding, R.A. High-Intensity Resistance TrainingImproves Muscle Strength, Self-Reported Function, and Disability in Long-Term Stroke Survivors. Stroke 2004, 35, 1404–1409.[CrossRef] [PubMed]
22. Pohl, M.; Mehrholz, J.; Ritschel, C.; Rückriem, S. Speed-Dependent Treadmill Training in Ambulatory Hemiparetic Stroke Patients:A randomized controlled trial. Stroke 2002, 33, 553–558. [CrossRef]
23. Salbach, N.M.; Mayo, N.E.; Wood-Dauphinee, S.; Hanley, J.A.; Richards, C.L.; Côté, R. A task-orientated intervention enhanceswalking distance and speed in the first year post stroke: A randomized controlled trial. Clin. Rehabil. 2004, 18, 509–519. [CrossRef]
24. Eng, J.J.; Tang, P.F. Gait training strategies to optimize walking ability in people with stroke: A synthesis of the evidence.Expert Rev. Neurother. 2007, 7, 1417–1436. [CrossRef] [PubMed]

Sensors 2021, 21, 1864 18 of 18
25. Stanhope, V.A.; Knarr, B.A.; Reisman, D.S.; Higginson, J.S. Frontal plane compensatory strategies associated with self-selectedwalking speed in individuals post-stroke. Clin. Biomech. 2014, 29, 518–522. [CrossRef] [PubMed]
26. Morris, M.E.; Matyas, T.A.; Bach, T.M.; Goldie, P.A. Electrogoniometric feedback: Its effect on genu recurvatum in stroke.Arch. Phys. Med. Rehabil. 1992, 73, 1147–1154. [PubMed]
27. Bleyenheuft, C.; Hanson, P.; Deltombe, T. Treatment of genu recurvatum in hemiparetic adult patients: A systematic literaturereview. Ann. Phys. Rehabil. Med. 2010, 53, 189–199. [CrossRef] [PubMed]
28. Cooper, A.; Alghamdi, G.A.; Alghamdi, M.A.; Altowaijri, A.; Richardson, S. The relationship of lower limb muscle strength andknee joint hyperextension during the stance phase of gait in hemiparetic stroke patients. Physiother. Res. Int. 2012, 17, 150–156.[CrossRef] [PubMed]
29. Loudon, J.K.; Goist, H.L.; Loudon, K.L. Genu Recurvatum Syndrome. J. Orthop. Sports Phys. Ther. 1998, 27, 361–367. [CrossRef][PubMed]
30. Hoffman, H. The Brunnstrom Stages of Stroke Recovery. Saebo. Available online: https://www.saebo.com/the-stages-of-stroke-recovery/ (accessed on 16 January 2021).
31. Holden, M.K.; Gill, K.M.; Magliozzi, M.R. Gait assessment for neurologically impaired patients: Standards for outcome assessment.Phys Ther. 1986, 66, 1530–1539. [CrossRef]
32. Mungas, D. Iii-Office Mental Status Testing: A Practical Guide. Geriatrics 1991, 46, 54–58.33. National Taiwan University Hospital. Clinical Trial Center. Available online: https://www.ntuh.gov.tw/NCTRC/training/
training.aspx (accessed on 16 January 2021).34. Díaz, S.; Stephenson, J.B.; Labrador, M.A. Use of Wearable Sensor Technology in Gait, Balance, and Range of Motion Analysis.
Appl. Sci. 2019, 10, 234. [CrossRef]35. Nguyen, M.D.; Mun, K.R.; Jung, D.; Han, J.; Park, M.; Kim, J.; Kim, J. IMU-based spectrogram approach with deep convolutional
neural networks for gait classification. In Proceedings of the 2020 IEEE International Conference on Consumer Electronics (ICCE),Las Vegas, NV, USA, 4–6 January 2020; pp. 1–6. [CrossRef]
36. Apdm, Inc. Opal User Guide. Available online: https://www.apdm.com/ (accessed on 16 January 2021).37. Aminian, K.; Najafi, B.; Büla, C.; Leyvraz, P.-F.; Robert, P. Spatio-temporal parameters of gait measured by an ambulatory system
using miniature gyroscopes. J. Biomech. 2002, 35, 689–699. [CrossRef]38. EpoMedicine. Physical Examination: Gait. Available online: http://epomedicine.com/clinical-medicine/physical-examination-
gait/ (accessed on 16 January 2021).39. Nair, V.; Hinton, G.E. Rectified linear units improve restricted boltzmann machines. In Proceedings of the 27th International
Conference on Machine Learning (ICML), Haifa, Israel, 21–24 June 2010; pp. 807–814. Available online: https://www.cs.toronto.edu/~fritz/absps/reluICML.pdf (accessed on 16 January 2021).
40. Pascanu, R.; Mikolov, T.; Bengio, Y. Understanding the exploding gradient problem. Comput. Sci. 2012, 1–11. Available online:https://arxiv.org/pdf/1211.5063v1.pdf (accessed on 16 January 2021).
41. Han, J.; Moraga, C. The influence of the sigmoid function parameters on the speed of backpropagation learning. In InternationalWorkshop on Artificial Neural Networks; Springer: Berlin/Heidelberg, Germany, 1995; pp. 195–201. [CrossRef]
42. De Boer, P.-T.; Kroese, D.P.; Mannor, S.; Rubinstein, R.Y. A Tutorial on the Cross-Entropy Method. Ann. Oper. Res. 2005, 134, 19–67.[CrossRef]
43. LeCun, Y.; Bengio, Y.; Hinton, G. Deep learning. Nature 2015, 521, 436–444. [CrossRef]44. Kingma, D.P.; Ba, J. Adam: A Method for Stochastic Optimization. Available online: https://arxiv.org/pdf/1412.6980.pdf
(accessed on 16 January 2021).45. Duchi, J.; Hazan, E.; Singer, Y. Adaptive subgradient methods for online learning and stochastic optimization. J. Mach. Learn. Res.
2011, 12, 2121–2159.46. Hinton, G.; Srivastava, N.; Swersky, K. Neural Networks for Machine Learning. Available online: https://www.cs.toronto.edu/
~tijmen/csc321/slides/lecture_slides_lec6.pdf (accessed on 16 January 2021).47. Kohavi, R. A study of cross-validation and bootstrap for accuracy estimation and model selection. In Proceedings of the 14th
International Joint Conference on Artificial Intelligence (IJCAI), Montreal, QC, Canada, 20–25 August 1995; pp. 1137–1145.48. Srivastava, N.; Hinton, G.; Krizhevsky, A.; Sutskever, I.; Salakhutdinov, R. Dropout: A simple way to prevent neural networks
from overfitting. J. Mach. Learn. Res. 2014, 15, 1929–1958.49. Powers, D.M. Evaluation: From Precision, Recall and F-Measure to ROC, Informedness, Markedness and Correlation. 2011.
Available online: https://arxiv.org/abs/2010.16061 (accessed on 16 January 2021).50. Reiss, A.; Stricker, D. Introducing a new benchmarked dataset for activity monitoring. In Proceedings of the 16th International
Symposium on Wearable Computers 2012, Newcastle, UK, 18–22 June 2012; pp. 108–109.51. UCI Machine Learning Repository. Available online: http://archive.ics.uci.edu/ml/datasets/PAMAP2+Physical+Activity+
Monitoring (accessed on 16 January 2021).