Detecting stable phase structures in eeg signals to classify brain activity amplitude patterns
19
Detecting stable phase structures in EEG signals to classify brain activity amplitude patterns
-
Upload
ehsan-omvi -
Category
Data & Analytics
-
view
25 -
download
0
Transcript of Detecting stable phase structures in eeg signals to classify brain activity amplitude patterns

Detecting stable phase structures in EEG signals to
classify brain activity amplitude patterns

Abstract
• ECoG:• Invasive procedure
• EEG:• Non-invasive procedure
• In this paper, a technique previously used to study spatial-temporalpatterns of brain activity on animal ECoG was adapted for use on EEG

Introduction
• Today there is increasing evidence that brain dynamics is self-organizingand scale-free.
• Several different techniques are currently used to describe brain activityon different scales.
• MSA (multiple spike activity)
• LFP (local field potential)
• ECoG (electrocarticogram)
• EEG (electroencephalogram)
• MEG (megnetoencephalogram)
• FMRI (functional magnetic resonance image)

Cont…….
• Ecog• ECoG recording has been used to study spatial-temporal patterns at the
mesoscopic scale of brain electrical activity that is recorded directly from thecortical surface. It is an invasive procedure, and surgery is necessary to fix orremove the electrode array to or from the brain cortex. This procedure iscommonly used with animals and occasionally with humans who have braindiseases that require surgery or are victims of global paralysis

Cont.
• EEG• EEG recording is a procedure in which electrical activity is recorded from the
surface of the scalp through metal electrodes. This is a completely non-invasive procedure that can be applied repeatedly to patients, normal adults,and children, with virtually no risk or limitation.
• This is a research interest to adapt the techniques of ECoG to EEG to moreeasily detect and classify spatial-temporal patterns of brain activity.
• In this paper, an EEG database is used to employed to analyze the EEG fromexperiments trial by trial and to detect spatial amplitude patterns in EEGactivity.
Cont.
• Spatial-temporal patterns of ECoG signals have been classified with respect to conditioned stimuli
• These patterns are described as stable frames with carrier frequencies in the beta or gamma band that recur at similar rates in the theta or alpha band
• EEG database used to analyze EEG from experiments trial by trial andto detect spatial amplitude patterns in EEG activity
• Subjects had engaged in an object recognition task during the EEGrecordings

• Frames obtained from the EEG recording had similar characteristicsand parameters to frames obtained from ECoG
• The mean level of classification for EEG was comparable to that forECoG, higher than 75%, which shows for the first time that, owing tothe scale-free properties of brain activity, these techniques adaptedfrom ECoG can be employed to extract useful informationnoninvasively from scalp EEG
Cont.

Data selection and pre-processing
• The data used in this work were available from Ingber (1999).
• The data consist of a set of measurements from 64 electrodes placed on a scalp at standard sites.
• The sample rate was 256 Hz and the signal duration was 1 s.
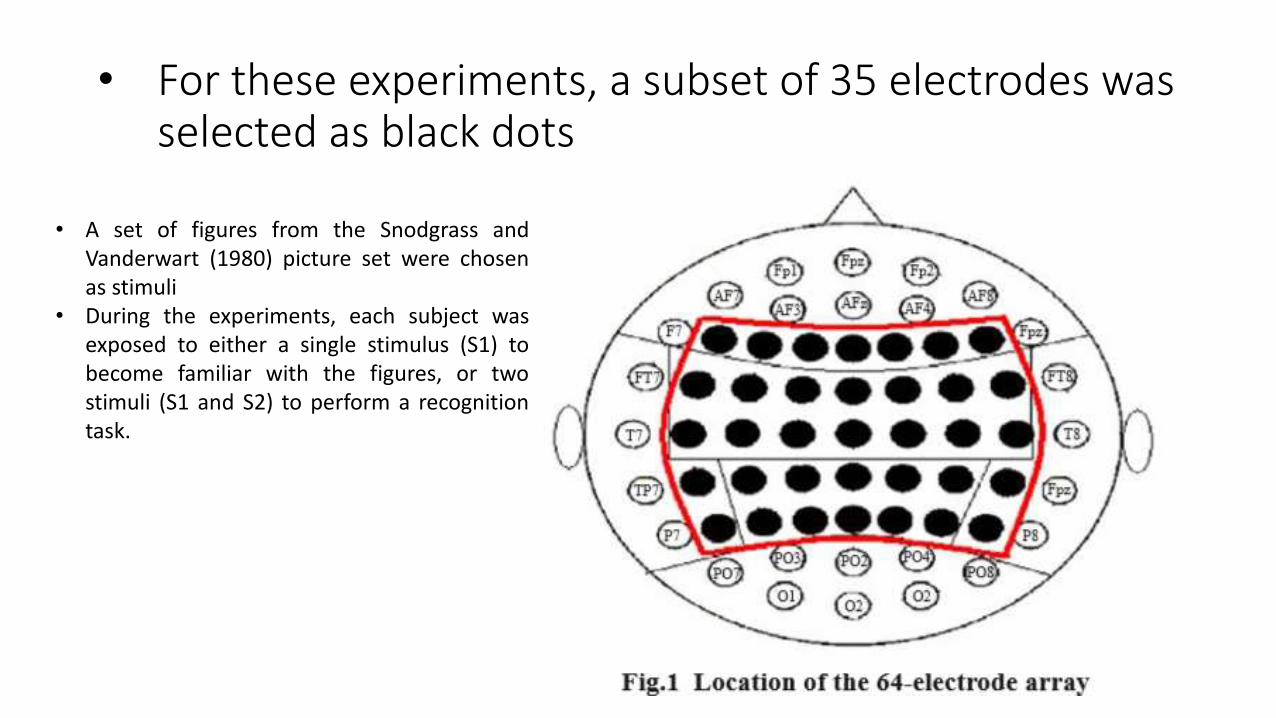
• For these experiments, a subset of 35 electrodes was selected as black dots
• A set of figures from the Snodgrass andVanderwart (1980) picture set were chosenas stimuli
• During the experiments, each subject wasexposed to either a single stimulus (S1) tobecome familiar with the figures, or twostimuli (S1 and S2) to perform a recognitiontask.

Data selection
• A set of figures from the Snodgrass and Van- derwart (1980) picture set were chosen as stimuli.
• During the experiments, each subject was exposed to either a single stimulus (S1) to become familiar with the figures, or two stimuli (S1 and S2) to perform a recognition task.
• In this work, in order to have normal EEG to use for analysis, only recordings from the control subjects were used to carry out the experiments.
• Recordings from each control subject were visually inspected to select an appropriate set of recordings for analysis
• All subjects with fewer than 20 trials per stimulus or more than 3 noisy channels were rejected; a total of 14 subjects were finally selected.
• The raw EEG data were visually inspected, and bad channels were replaced by the mean of the adjacent channels.
• The analytic phase was used to calculate the parameters of instantaneous frequency and instantaneous gradient
• These parameters were used to detect stable frames and estimate the other parameters of frames
• The feature vectors were selected as the root-mean square (rms) values of the analytic amplitude within stable frames on the 35 electrodes
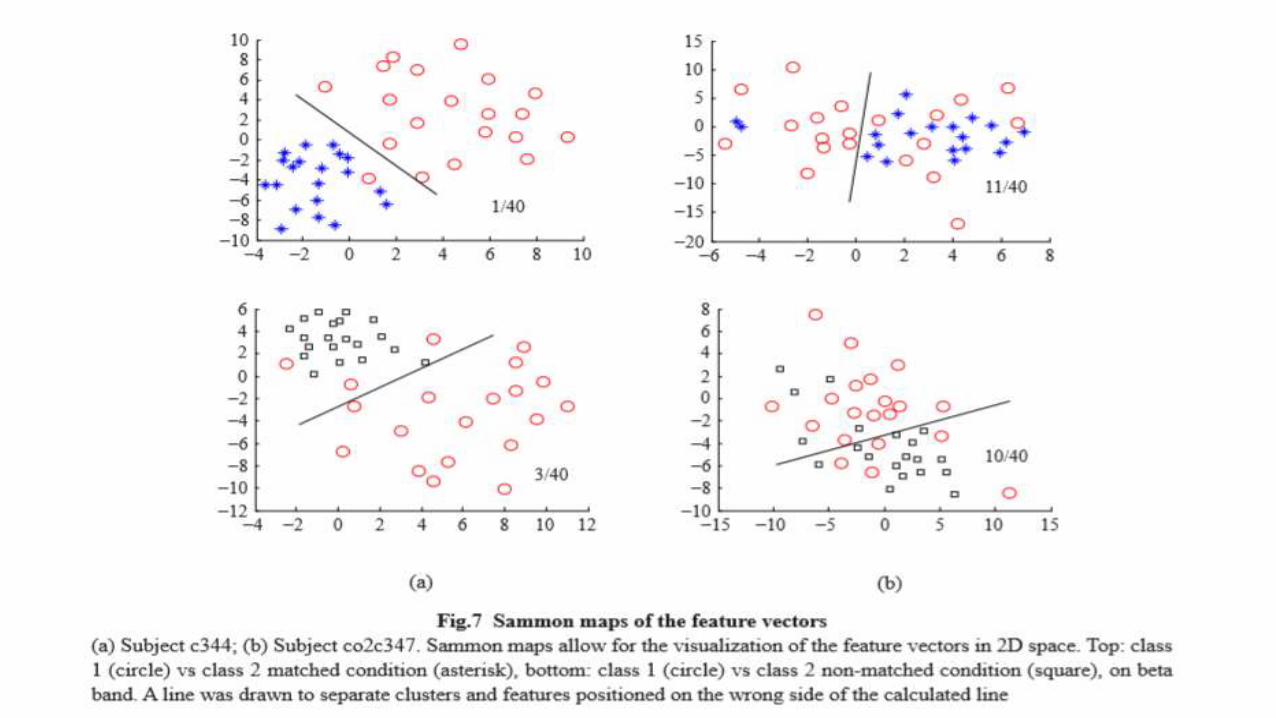
• The 35-dimensional features were then transformed to a 2D feature vector using Sammon maps
AMPLITUDE MODULATION PATTERNS LOCATION

Detecting stable frames
• Cone fitting and spatial-temporal covariance methods have been used in the past to detect frames with similar results
• Thus, using the spatial- temporal covariance method, thresholds for analytic phase covariance (te1) and analytic amplitude covariance (te2) were set

CLASSIFICATION PROCESS
• Two classes were defined to carry out the classification process
• The single-stimulus presentation was defined as class 1
• the two-stimulus presentation as class 2
• Class 2 presentations can be in a matched condition (the firststimulus is identical to the second stimulus) or in a non-matchedcondition (the first stimulus is different from the second stimulus).
• The Sammon map iteratively mapped the location of point
• After mapping, the feature vectors were labeled for graphic displayand classification
• BP networks were used to perform the classification

Results
• The EEG signals were band pass filtered between 0.02 and 50 Hzduring the recording process
• Only the frequencies between 4 and 50 Hz were analyzed
• Frequencies from 12 to 30 Hz (beta band) and 30 to 45 Hz (lowgamma) were used as the temporal band filter settings
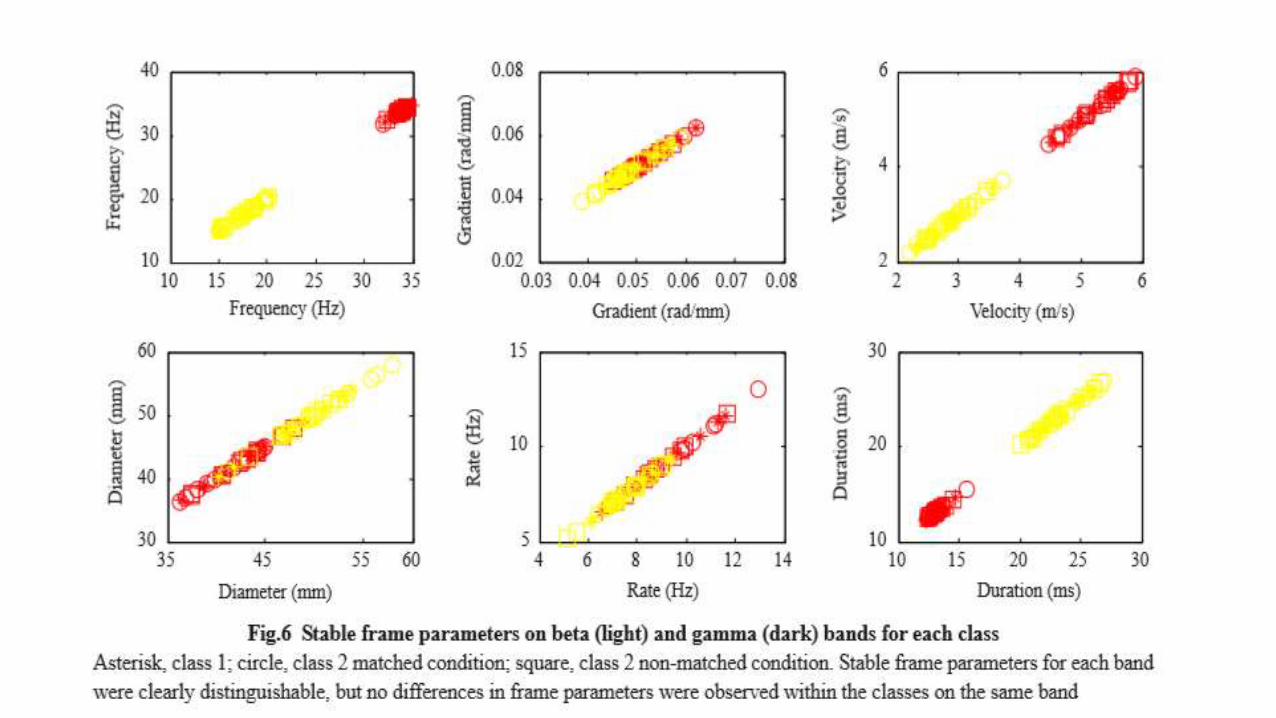
• Stable frame parameters were estimated for each subject and eachclass on the beta and gamma bands

Cont.
• stable frames from the beta band had lower carrier frequencies, velocities, diameters, rates, and a longer duration than stable frames on the gamma band did
• The differences of stable frame parameters between classes were not obvious
• Sammon maps were used to visualize the distribution of the features and to transform the 35 dimensional feature vectors into 2D feature vectors
• Figure below shows the correct classification rate (CC) in percent per subject for a two-layer and a three-layer BP network

Conclusion
• Correct Classification (CC) values were obtained for patterns on the beta and gamma bands. The CC was higher than 62.5% for all subjects (p=0.05 for binary classification), which shows that spatial patterns of beta and gamma activities can also be extracted from the EEG signal using this adapted technique
• Previous studies have shown that phase transitions are different according to the temporal band pass selected.
• Future studies of frequency bands and bandwidth carrying levels of meaningful information should be done.