Detecting display energy hotspots in Android appsspmahaja/papers/wan17stvr.pdf · 2of15 WAN ET AL....
15
Received: 25 September 2015 Revised: 15 March 2017 Accepted: 21 March 2017 DOI: 10.1002/stvr.1635 SPECIAL ISSUE PAPER Detecting display energy hotspots in Android apps Mian Wan Yuchen Jin Ding Li Jiaping Gui Sonal Mahajan William G. J. Halfond Department of Computer Science, University of Southern California, Los Angeles, CA, USA Correspondence William G. J. Halfond, Department of Computer Science, University of Southern California, Los Angeles, California, USA. Email: [email protected] Funding information National Science Foundation, Grant/Award Number: CCF-1321141 and CCF-1619455 Summary The energy consumption of mobile apps has become an important consideration for develop- ers as the underlying mobile devices are constrained by battery capacity. Display represents a significant portion of an app’s energy consumption—up to 60% of an app’s total energy con- sumption. However, developers lack techniques to identify the user interfaces in their apps for which energy needs to be improved. This paper presents a technique for detecting display energy hotspots—user interfaces of a mobile app whose energy consumption is greater than optimal. The technique leverages display power modeling and automated display transformation techniques to detect these hotspots and prioritize them for developers. The evaluation of the technique shows that it can predict display energy consumption to within 14% of the ground truth and accurately rank display energy hotspots. Furthermore, the approach found 398 display energy hotspots in a set of 962 popular Android apps, showing the pervasiveness of this problem. For these detected hotspots, the average power savings that could be realized through better user interface design was 30%. Taken together, these results indicate that the approach represents a potentially impact- ful technique for helping developers to detect energy related problems and reduce the energy consumption of their mobile apps. KEYWORDS display, energy, mobile applications, optimization, power 1 INTRODUCTION In less than six years, mobile apps have gone from zero downloads to over 35 billion downloads [1,2]. Simultaneously, smartphones have achieved a nearly 31% penetration rate [3]. Smartphones and apps have become so popular, in part, because they combine sensors and data access to provide many useful services and a rich user experience. How- ever, the usability of mobile devices is inherently limited by their battery power, and the use of popular features, such as the camera and network, can quickly deplete a device’s limited battery power. Therefore, energy consumption has become an important concern. For the most part, major reductions in energy consumption have come about through a focus on developing better batteries, more efficient hardware, and bet- ter operating system level resource management. However, software engineers have become increasingly aware of the way an app’s imple- mentation can impact its energy consumption [4-7]. This realization has motivated the development of software-level techniques that can identify energy bugs and provide more insights into the energy related behaviors of an application. An important observation is that the display component of a smart- phone consumes a significant portion of the device’s total battery power. This problem has only grown as smartphone display sizes have increased from an average of 2.9 inches in 2007 to 4.8 inches in 2014 [8]. Studies show that display can now consume up to 60% of the total energy expended by a mobile app [9,10]. Traditionally, optimizing dis- play power has been seen as outside of the control of software devel- opers. This is true for LCD screens, for which energy consumption is based on the display’s brightness and is controlled by either the end user or the Operationg System (OS) performing opportunistic dimming of the display. However, most modern smartphones, such as the Sam- sung Galaxy S7, are powered by a new generation of screen technology, the organic light-emitting diode (OLED). For this type of screen, bright- ness is still important [11]; however, the colors that are displayed also become important. Because of the underlying technology, this type of screen consumes less energy when displaying darker colors (eg, black) than lighter ones (eg, white). The use of these screens means there are enormous energy savings to be realized at the software level by opti- mizing the colors and layouts of the user interfaces (UIs) displayed by the smartphone. In fact, prior studies have shown that savings of over 40% can be achieved by this method [6,9,10]. Softw Test Verif Reliab. 2017;27:e1635. wileyonlinelibrary.com/journal/stvr Copyright © 2017 John Wiley & Sons, Ltd. 1 of 15 https://doi.org/10.1002/stvr.1635
Transcript of Detecting display energy hotspots in Android appsspmahaja/papers/wan17stvr.pdf · 2of15 WAN ET AL....

Received: 25 September 2015 Revised: 15 March 2017 Accepted: 21 March 2017
DOI: 10.1002/stvr.1635
S P E C I A L I S S U E P A P E R
Detecting display energy hotspots in Android apps
Mian Wan Yuchen Jin Ding Li Jiaping Gui Sonal Mahajan William G. J. Halfond
Department of Computer Science, University
of Southern California, Los Angeles, CA, USA
Correspondence
William G. J. Halfond, Department of
Computer Science, University of Southern
California, Los Angeles, California, USA.
Email: [email protected]
Funding information
National Science Foundation, Grant/Award
Number: CCF-1321141 and CCF-1619455
Summary
The energy consumption of mobile apps has become an important consideration for develop-
ers as the underlying mobile devices are constrained by battery capacity. Display represents a
significant portion of an app’s energy consumption—up to 60% of an app’s total energy con-
sumption. However, developers lack techniques to identify the user interfaces in their apps for
which energy needs to be improved. This paper presents a technique for detecting display energy
hotspots—user interfaces of a mobile app whose energy consumption is greater than optimal. The
technique leverages display power modeling and automated display transformation techniques to
detect these hotspots and prioritize them for developers. The evaluation of the technique shows
that it can predict display energy consumption to within 14% of the ground truth and accurately
rank display energy hotspots. Furthermore, the approach found 398 display energy hotspots in a
set of 962 popular Android apps, showing the pervasiveness of this problem. For these detected
hotspots, the average power savings that could be realized through better user interface design
was 30%. Taken together, these results indicate that the approach represents a potentially impact-
ful technique for helping developers to detect energy related problems and reduce the energy
consumption of their mobile apps.
KEYWORDS
display, energy, mobile applications, optimization, power
1 INTRODUCTION
In less than six years, mobile apps have gone from zero downloads
to over 35 billion downloads [1,2]. Simultaneously, smartphones have
achieved a nearly 31% penetration rate [3]. Smartphones and apps have
become so popular, in part, because they combine sensors and data
access to provide many useful services and a rich user experience. How-
ever, the usability of mobile devices is inherently limited by their battery
power, and the use of popular features, such as the camera and network,
can quickly deplete a device’s limited battery power. Therefore, energy
consumption has become an important concern. For the most part,
major reductions in energy consumption have come about through a
focus on developing better batteries, more efficient hardware, and bet-
ter operating system level resource management. However, software
engineers have become increasingly aware of the way an app’s imple-
mentation can impact its energy consumption [4-7]. This realization
has motivated the development of software-level techniques that can
identify energy bugs and provide more insights into the energy related
behaviors of an application.
An important observation is that the display component of a smart-
phone consumes a significant portion of the device’s total battery
power. This problem has only grown as smartphone display sizes have
increased from an average of 2.9 inches in 2007 to 4.8 inches in 2014
[8]. Studies show that display can now consume up to 60% of the total
energy expended by a mobile app [9,10]. Traditionally, optimizing dis-
play power has been seen as outside of the control of software devel-
opers. This is true for LCD screens, for which energy consumption is
based on the display’s brightness and is controlled by either the end
user or the Operationg System (OS) performing opportunistic dimming
of the display. However, most modern smartphones, such as the Sam-
sung Galaxy S7, are powered by a new generation of screen technology,
the organic light-emitting diode (OLED). For this type of screen, bright-
ness is still important [11]; however, the colors that are displayed also
become important. Because of the underlying technology, this type of
screen consumes less energy when displaying darker colors (eg, black)
than lighter ones (eg, white). The use of these screens means there are
enormous energy savings to be realized at the software level by opti-
mizing the colors and layouts of the user interfaces (UIs) displayed by
the smartphone. In fact, prior studies have shown that savings of over
40% can be achieved by this method [6,9,10].
Softw Test Verif Reliab. 2017;27:e1635. wileyonlinelibrary.com/journal/stvr Copyright © 2017 John Wiley & Sons, Ltd. 1 of 15https://doi.org/10.1002/stvr.1635
2 of 15 WAN ET AL.
Despite the high impact of focusing on display energy, developers
lack techniques that can help them identify where in their apps such
savings can be realized. For example, the well-known Android bat-
tery monitor only provides device level display energy consumption
and cannot isolate the display energy per app or per UI screen. Other
energy-related techniques have focused on surveys to identify patterns
of energy consumption [5], design refactoring techniques that improve
energy consumption [7,12], programming language level constructs to
make implementation more energy aware [13], energy visualization
techniques [14], or energy prediction techniques [15]. Although help-
ful, the mentioned techniques do not account for display energy nor
are they able to isolate display related energy. Existing work on dis-
play energy has focused on techniques that can transform the colors
in a UI (eg, Nyx [6] and Chameleon [10]). But these techniques do not
guide developers as to where they should be applied, therefore they
must be (1) used automatically for the entire app, which means that
although colors will be transformed automatically into more energy
efficient equivalents, the color transformation may be less aesthetically
pleasing than a developer guided one; or (2) applied based solely on
developers’ intuition as to where they would be most effective, which
means that some energy-inefficient UIs may be missed.
This paper presents a novel approach to assist developers in identi-
fying the UIs of their apps that can be improved with respect to energy
consumption. To do this, the approach combines display energy mod-
eling and color transformation techniques to identify a display energy
hotspot (DEH)—a UI of a mobile app whose energy consumption is
higher than an energy-optimized but functionally equivalent UI. The
approach is fully automated and does not require software developers
to use power monitoring equipment to isolate the display energy, which,
as explained in Section 3, requires extensive infrastructure and tech-
nical expertise. The approach to identify DEHs performs three general
steps. First, the approach traverses the UIs of an app and takes screen-
shots of the app’s UIs when they change in response to different user
actions. Second, for each screenshot, the approach calculates an esti-
mate of how much energy and power could be saved by using a color
optimized version of the screenshot. Finally, the approach ranks the
UIs based on the magnitude of these differences. The approach reports
these results, along with detailed power and energy information, to the
developer, who can target the most impactful UIs for energy-optimizing
transformations.
The paper also presents the results of an empirical evaluation of the
approach on a collection of real-world and popular mobile apps. The
results showed that the approach was able to accurately estimate dis-
play power consumption to within 14% of the measured ground truth
and identify the most impactful DEHs. Furthermore, the results gener-
ated by the approach can be generalized from one hardware platform
to others. The approach was also used to investigate 962 Android mar-
ket apps; the investigation showed that 41% of these apps have DEHs.
Overall, these results indicate that the approach can accurately iden-
tify DEHs and can be useful to assist developers in reducing the display
energy of their mobile applications.
The rest of this paper is organized as follows: Section 2 describes
the approach for detecting DEHs. Section 3 describes how to build the
display power model for a device. The results of the evaluation are in
Section 4. Related work is discussed in Section 5. Finally, the conclu-
sions and contributions are summarized in Section 6.
2 APPROACH
The goal of the approach is to assist developers in identifying UIs that
can be improved with respect to energy consumption. More specifi-
cally, the approach detects DEHs, which are UIs that consume more
display energy than their energy-optimized versions would. To detect
these, the approach automatically scans each UI of a mobile app and
then determines if a more energy efficient version could be designed.
It is important to note that DEHs are not necessarily energy bugs, as
the DEHs may not be caused by a fault in the traditional sense. Instead,
DEHs represent points where code is energy inefficient with respect to
an optimized alternative. After detecting the DEHs, the UIs are ranked
in order of the potential energy improvement that could be realized via
energy optimization and then reported to the developers.
To achieve complete automation and not require developers to have
power monitoring equipment, there are two significant challenges to be
addressed. The first challenge is to determine how much display energy
will be consumed by an app at runtime without physical measurements.
To address this, the insight is that power consumption can be estimated
by a display power model that takes UI screenshots as input. The second
challenge is to determine whether a more energy-efficient version of a
UI exists and to quantify the difference between these two versions. To
address this, the insight is that automated energy-oriented color trans-
formation techniques can be used to recolor the screenshots and then
calculate the difference between the original and the more efficient
version. Based on these two insights, the approach can automatically
detect DEHs without requiring power monitoring equipment.
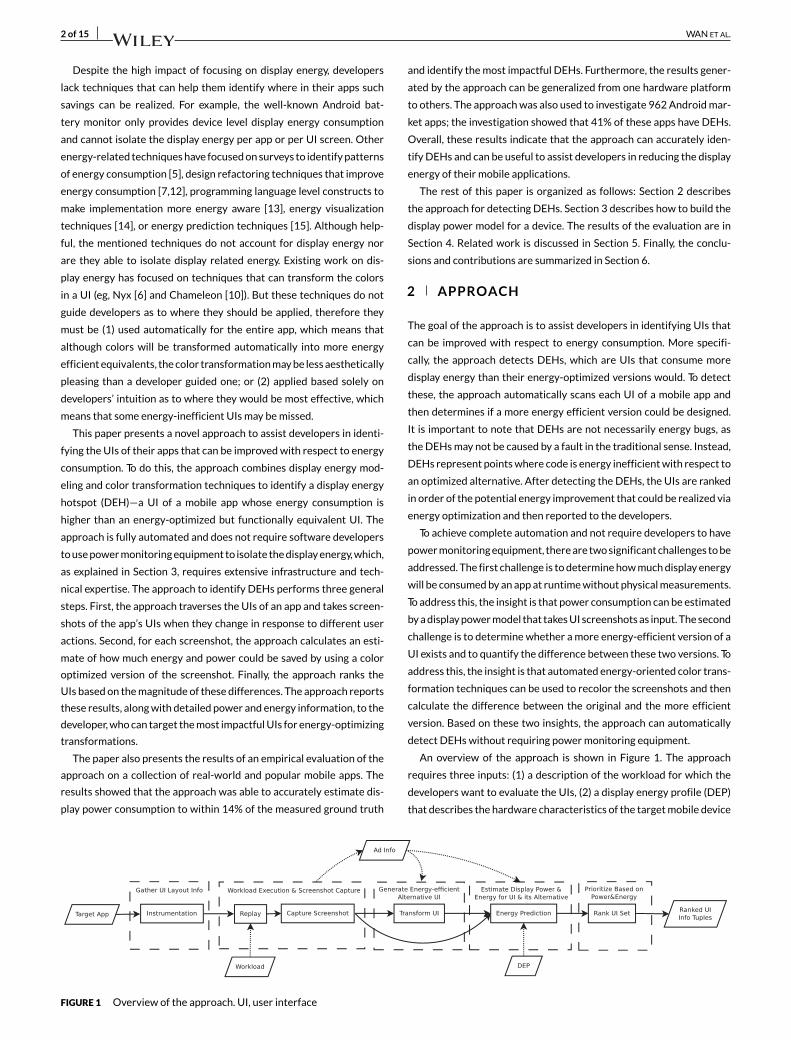
An overview of the approach is shown in Figure 1. The approach
requires three inputs: (1) a description of the workload for which the
developers want to evaluate the UIs, (2) a display energy profile (DEP)
that describes the hardware characteristics of the target mobile device
FIGURE 1 Overview of the approach. UI, user interface
WAN ET AL. 3 of 15
platform, and (3) the mobile app to be analyzed. Using these inputs,
the approach performs the detection in five steps. In the first step, the
approach instruments the apps to record runtime information about
the UI layout. This information is used to identify certain types of com-
ponents, such as ads, that should not be part of the DEH identification.
The second step is to run the app based on the workload description and
capture screenshots of the different UIs displayed. In the third step, the
approach processes these screenshots and generates energy-efficient
versions via a color transformation technique. Next, in the fourth step,
a hardware model based on the DEP is used to predict the display
energy that would be consumed by each of the screenshots and their
energy-optimized versions. Finally, the fifth step compares the energy
consumption of each UI with that of its optimized version and gives
the developers a list of UIs ranked according to the potential energy
impact of transforming each UI. Each of these steps is now explained in
more detail.
2.1 Step 1: gather UI layout information
The goal of the first step is to facilitate the detection of content dis-
played in the app’s UI that should not be considered for the purpose
of detecting DEHs. This type of content is called Excluding Content
(EC) and, broadly, it includes UI elements whose appearance will vary
between executions. Excluding Contents are very common in mobile
apps. For example, mobile ads are present in over 50% of all apps [16].
Since the colors present in an EC should not or cannot be changed by
a developer, yet they could occupy a potentially significant amount of
the screenspace of a UI, they must be identified and removed from the
screenshots to preserve the usefulness of the calculated display energy
for a UI.
The primary challenge in detecting ECs is that they are mostly indis-
tinguishable from static content. For example, there is no visual differ-
ence between an image that is static versus one that is dynamically
loaded, nor is there a difference in terms of the APIs used to display
them. A notable exception is mobile ads, which invoke special APIs to
visually render themselves in the UI. Based on this insight, the approach
instruments the app so that when the workload is executed during step
2, the ads’ size and location are recorded. The process to identify ad
related information is as follows. First, the approach identifies invoca-
tions in the app’s bytecode that call the app’s ad network API. Then,
certain ad related event handlers and callbacks are instrumented. The
exact set of invocations to be instrumented varies by ad network. For
example, for the Google ad network, AdMob, this set would include
onAdLoaded and onReceiveAd, which can be defined by an ad lis-
tener, and loadAd, which is defined in the ad library and can be called
by an Activity. At runtime, the instrumentation records timestamps,
position, and size information about each of the ads displayed. This
information is used to populate a sequence of tuples F, in which each
tuple is of the form ⟨t, a⟩, where t is the time at which the content was
displayed and a represents the location and size of the occupied area.
The approach provides a mechanism by which other types of ECs can
be excluded from the DEH detection as well. Tuples may be manually
added to F. This allows developers to specify image or text areas that
they know to be dynamic and that should be excluded from the energy
and power analysis in step 3.
2.2 Step 2: workload execution and screenshot
capture
The goal of the second step is to convert the workload description into a
set of screenshots that can drive the display energy analysis in the sub-
sequent steps. Strictly speaking, a workload description is not a neces-
sary input to the approach since an automated UI crawler (eg, (PUMA)
[17]) could navigate an app and execute a fixed or random distribu-
tion of actions over the UI elements. However, the use of a workload
description allows the approach to analyze the app using realistic user
behaviors or a particular workload of interest to the developers. For
example, developers could collect execution traces of real users inter-
acting with their app and use this to define a workload for the energy
evaluation.
The inputs to this step are the target app and its workload descrip-
tion. The app A is the Android Package Kit (APK) file that can be exe-
cuted on a mobile device. The workload W is represented as a sequence
of event tuples in which each tuple is of the form ⟨e, t⟩, where e is a rep-
resentation of the event (eg, “OK button pressed”) and t is a timestamp
of when the event occurs relative to the first event (ie, t = 0 for the first
event e1). The approach does not impose a specific format or syntax on
W except that it must be reproducible. In other words, it must be speci-
fied in a way that allows for some mechanism to replay the workload. In
the current implementation of the approach (Section 4.2), the RERAN
tool [18] is used to record and then replay a workload description, so
the exact syntax and format of W is dictated by that tool.
Given W and A, the approach captures screenshots of the differ-
ent UIs displayed on a device’s screen during the execution of W on A.
The general process is as follows. The replay mechanism executes each
event at its specified time. A monitor mechanism executes in the back-
ground of the device and captures a screenshot of the display every
time it changes. This is done by hooking into the refresh and repaint
events of the underlying device. The execution of the workload con-
tinues until all event tuples have been executed. Once the screenshots
have been captured, developers may manually analyze the screenshots
to identify areas (in addition to the EC areas that are automatically
identified) that should be excluded from the DEH identification. The
output of the second step is a sequence of tuples S, in which each tuple
is of the form ⟨s, t⟩, where s is a screenshot and t is the time at which
the screenshot was taken (ie, when the display changed), and F, which
contains the EC information collected via the mechanisms described as
part of step 1 and the areas marked by the developer.
To capture screenshots, the implementation uses a modified version
of an existing tool called Ashot. Ashot periodically captures screen-
shots of the currently displayed UIs. Ashot has a maximum sampling
frequency that is fast enough to catch user speed events (eg, clicks) but
will not sample videos or animations at their full refresh rate. This sam-
pling frequency does not affect the accuracy of the approach; it only
reduces the overall number of screenshots captured. Furthermore, to
reduce storage overhead, Ashot drops consecutive screenshots that
are identical. The use of Ashot did not introduce any observable delay in
the execution of W. Note that a necessary condition of both the replay
and screenshot capture mechanisms is that their use does not alter the
functionality of the app or the UI’s appearance when it is rendered on
the device. Both of these conditions were met by RERAN and Ashot.

4 of 15 WAN ET AL.
2.3 Step 3: generate energy-efficient
alternative UIs
The goal of the third step is to generate an optimized version of each
screenshot tuple in S so that the fourth step can calculate estimates of
the energy consumption for each screenshot and its optimized version.
However, this optimized alternative does not exist, so the approach
must first generate a reasonable approximation of what such an alter-
native would look like. A guiding insight is that prior work has shown
that darker colors on OLED screens are more energy efficient than
lighter colors [9]. To take advantage of this insight, one could invert
the colors of UIs with a white-colored background or systematically
shift colors to make them darker and then use this transformation as
the optimized version. However, these approaches neglect the fact that
both color inversion and linear color shifts do not maintain color differ-
ence, which is the visual relationship that humans perceive when they
look at a colored display [6]. Therefore, although the color-adjusted UIs
would be more energy efficient, they would not represent a reason-
able approximation of optimized UIs as the resulting UIs would not be
aesthetically pleasing.
To address this challenge, the approach leverages a color transfor-
mation technique, Nyx, that was developed in prior work [6,19]. A
key aspect of Nyx is that the color scheme it generates represents
a reasonably aesthetically pleasing new color scheme. Nyx statically
analyzes the structure of the HTML pages of a web application and
generates a color transformation scheme (CTS) that represents a more
energy-efficient color scheme for the web application. Nyx does this
by first creating a color conflict graph (CCG), where each node in the
graph is a color that appears in a web page and each edge represents
the type of visual relationship (eg, “next to”, “enclosing”, or “not touch-
ing”) that any two colors in the CCG have. The edges in the CCG are
weighted by the type of visual relationship, with higher weights given
to edges so that “enclosing” > “next to” > “not touching”. Then, Nyx
solves for a recoloring of the CCG that is energy efficient and also main-
tains, as much as possible, the color distances between colors in the
original page that have a visual relationship. The weighting allows Nyx
to prioritize maintaining certain types of color distances over others.
Empirical studies show that the resulting color schemes can reduce dis-
play power consumption of web apps by over 40%. Additionally, user
studies of the UIs generated by Nyx and other similar color transforma-
tion techniques [6,9,10,20] have shown that the transformed UIs have
high end-user and developer acceptance while only minimally affecting
the resulting UIs’ aesthetics.
The approach adapts the CTS generation process of Nyx. There
are three primary challenges to be addressed to conduct this
adaptation—generation of the CCG, accounting for areas in the
screenshots occupied by EC, and scalability. Nyx generates the CCG by
statically analyzing the server-side code that dynamically generates
web pages. In contrast, the approach only has screenshots available;
therefore, the adapted CCG models the color relationships between
adjacent pixels, which are identified by analyzing each pixel of each
screenshot and identifying its color and the colors of its surrounding
pixels. To handle ECs, the approach only builds a CCG for the pixels of
the screenshot that are not in an area defined in F. Entries in F can be
matched to screenshots by matching the time intervals specified by
the timestamps. Using the screenshot to construct the CCG leads to
the third challenge, scalability. The recoloring of the CCG is an NP-hard
problem with respect to the number of colors. The rendering kits of
mobile devices use antialiasing and color shading to smooth lines and
curves. This means that even a simple image, such as a black circle
over a white background, would be rendered with many additional
colors, such as grays, to smooth out transitions between adjacent col-
ors. Because of these extra colors, the time needed to generate a CTS
would make the approach’s analysis time impractical.
To address this scalability challenge, the approach maps each color
in a screenshot to the closest of the 140 standardized UI colors [21]
and then uses the resulting reduced set of colors to create the CCG.
The approach then converts the color with the largest cluster to black,
which is the most energy-efficient color, and solves the CCG recolor-
ing problem using a simulated-annealing algorithm to find the CTS [6].
Guided by the newly generated CTS, the approach recolors the original
screenshot, except for the areas in F, so that every color in the cluster is
replaced with its corresponding color in the CTS.
This process is repeated for every screenshot tuple ⟨s, t⟩ ∈ S. For
each such s, the approach generates an s′, which is the alternate version
of the screenshot recolored as described above. The output of this step
is a function O that maps each s to its corresponding s′.
Since the approach uses an approximation algorithm, the generated
CTS may not reflect the most optimal recoloring. Instead, the recolored
UI represents a lower bound on the potential savings a color opti-
mization could achieve. Additionally, the use of clustering means the
approach performs its analysis on simpler versions of the screenshots
with fewer colors. This can also introduce inaccuracy into the power
estimation of the color-optimized screenshot. However, unless the
screenshots differ significantly in the amount of antialiasing used, this
inaccuracy is small. To confirm this, the power consumption between a
set of screenshots and the versions of the screenshots using the results
of the clustered colors was compared and the average difference was
found to be below 2%; thus indicating the simplified version was a
reasonable proxy for the full-color version.
2.4 Step 4: display energy prediction
The fourth step of the approach computes the display power and
energy of the screenshots and their energy-efficient alternatives. The
approach does this by analyzing each screenshot obtained in the sec-
ond step and its optimized version generated in the third step with
cost functions that estimate the energy consumption based on the col-
ors used in the screenshot. The inputs to this step are F, populated
in the second step; the screenshot tuples, S, generated by the second
step; O, generated by the third step; and the cost function, C, provided
by the DEP. (The development of the cost function provided by the
DEP is explained in Section 3, and an evaluation of its accuracy is in
Section 4.3.) The outputs of this step are two functions that map each
screenshot tuple in S or O to its power (P) and energy (E).
P(s, t) =∑k∈|s|
C(Rk,Gk,Bk) −∑
a∈F(t)
∑k∈|a|
C(Rk,Gk,Bk), (1)
E(s, ts, te) = P(s) ∗ (te − ts). (2)
WAN ET AL. 5 of 15
The formulas for calculating the output functions are shown in
Equations 1 and 2. Here, s can be replaced with O(s) as needed. To cal-
culate P(s, t) for all ⟨s, t⟩ ∈ S, the approach first sums the power cost
of each pixel in s, which is calculated by the cost function C that takes
the values associated with the red (R), green (G), and blue (B) values of
the pixel’s color. From the calculated power value, the approach sub-
tracts the power values calculated for each of the EC areas contained
in s. As in step 3, the approach identifies the EC areas corresponding to
the screenshots using the timestamp information, represented as F(t)
and then uses C to calculate the power of each pixel in each EC area
a. The sum of the power for all of the EC areas is subtracted from the
screenshot’s overall power value. The value returned by P is in Watts.
Recall that energy is equal to power multiplied by time. Therefore, E
is equal to the power associated with the screenshot (P(s)) multiplied by
the amount of time the screenshot is displayed. The display time is cal-
culated by subtracting the time the screenshot is displayed (ts) from the
time the next screenshot is displayed (te), or in other words, subtracting
the timestamp associated with screenshot si from the timestamp asso-
ciated with screenshot si+1, which would be of the form E(si, ti, ti+1). The
value returned by E is in Joules.
2.5 Step 5: prioritizing the UIs
The goal of the fifth step is to rank the UIs in order of their potential
power and energy reduction. To do this, the approach calculates the
power and energy of each color-transformed screenshot and compares
it to the power and energy of the original screenshot. The inputs to the
fifth step are S, P, E, and O.
DP(s) = P(s) − P(O(s)), (3)
DE(s, ts, te) = E(s, ts, te) − E(O(s), ts, te). (4)
Given these inputs, the approach calculates the power and energy
difference according to the formulas shown in Equations 3 and 4. For
the difference in power (DP), the approach subtracts the power of the
corresponding O(si) from that associated with each si ∈ S. The resulting
number is in Watts and represents the power that could be saved by
using s′
i, the color-optimized version of si. For the difference in energy
(DE), the approach subtracts the energy of the corresponding O(s) from
that associated with each si ∈ S. The resulting numbers is in Joules and
represents the energy that could be saved by using s′
iinstead of si.
The output of the fifth step is two sequences, RP and RE. Each
sequence is comprised of the tuples ⟨s,D⟩where s is the screenshot and
D is either the difference in power (DP) or the difference in energy (DE).
By choosing the metric DP or DE, the developers could choose whether
or not to take the time spent by each screenshot into consideration. The
sequences are ordered by each tuple’s D value from highest to lowest.
This ranking is the output of the approach and represents a prioritiza-
tion of the screenshots that appear during the workload’s execution in
order of their potential power and energy reduction if they were to be
color optimized.
2.6 Discussion of usage scenarios
The output of the approach allows developers to identify the UIs of
their app that could save the most energy with color optimization.
Although the technique provides developers with a CTS, it does not
automatically transform the app to use these colors. Nonetheless, the
color mapping information can be useful. Developers may choose to use
this CTS, build on it as a starting point for graphic designers to create
a new palette, or leverage other automated techniques for identifying
energy efficient and aesthetically pleasing color schemes [20]. To close
the loop and use the new color scheme, developers must modify points
in the code where colors are defined and/or modify the Android UI lay-
out XML file color specifications so that the app uses the new colors in
places where the old colors would have been used.
3 THE DISPLAY ENERGY PROFILE
The DEP provides a pixel-based power cost function for a target mobile
device. The use of the DEP allows the approach to analyze display
power for multiple devices by simply providing different DEP as input. It
is expected that, in the future, a DEP will be developed and provided as
part of a device’s software development kit. However, this is currently
not common in practice, so this section discusses the steps required to
develop a DEP.
At a high level, the DEP provides a cost function that can predict how
much power an OLED screen will consume when displaying a particu-
lar UI. Prior research work has shown that the power consumption of a
pixel in an OLED screen is based on its color [22]. Therefore, the input
to the cost function is the RGB value that defines a pixel’s color. The out-
put of the cost function is the amount of Watts that will be consumed
by the display of the pixel on the target device.
C(R,G,B) = rR + gG + bB + c. (5)
The general form of the cost function is shown in Equation 5. R,G,
and B represent the red, green, and blue components of a pixel’s color,
respectively. The coefficients r, g, b, and c represent empirically deter-
mined constants. The value for each constant varies by mobile device.
Note that the power model does not account for screen brightness. This
is generally controlled by the user or OS, not the software developer.
Furthermore, savings incurred by adjusting brightness would apply uni-
formly across all UIs. Display energy profiles for four mobile devices, a
2.83" 𝜇OLED -32028-P1T display (𝜇OLED ) from 4D Systems, a Sam-
sung Galaxy SII (S2), a Samsung Galaxy Nexus (Nexus), and a Samsung
Galaxy S5 (S5) were constructed. For all of these displays, power con-
sumption was measured using the Monsoon Power Monitor (MPM)
from Monsoon Solutions Inc. [23]. The MPM allows voltage to be held
constant while supplying a current that may be varied from its positive
and negative terminals. The MPM samples the voltage and the current
supplied and outputs the power consumption with a frequency of 5kHz.
This sampling frequency is sufficient for the development of the DEP,
since the average duration of screenshots is in the order of seconds.
Each power model was built by roughly following the process out-
lined by Dong and colleagues [22]. First, the power consumption of
a completely black screen was measured to define a baseline power
usage for an active screen. To determine the parameters for each RGB
component, the power consumption of the screen was measured while
displaying solid-colored pages. The intensity of each color component
was varied while holding the other two components at zero, and data
6 of 15 WAN ET AL.
points for 16 intensities of each component (R, G, and B) were collected.
In total, 48 data points for each device were obtained.
After taking measurements for each color component, the baseline
power usage was subtracted from these measurements to isolate the
power consumption of each R, G, and B component. The relationship
between the power consumption and the RGB value is non-linear due
to a gamma encoding of the screen. Gamma encoding is a digital image
editing process that defines the relationship between pixel values and
the colors’ luminance. It allows for human eyes to correctly perceive the
shades of color of images that are captured digitally and displayed on
monitors. To account for this encoding, the RGB values were raised to
the 2.2 power to decode the image. While the gamma value can vary
between 1.8 to 2.6, 2.2 is the standard image gamma of screens adopted
by industry. After gamma decoding of the RGB values, linear regres-
sion was used to determine the coefficients for Equation 5. The linear
relationship between the RGB values and the power consumption was
very strong. The average R2 value for the four models was 0.99288. The
detailed coefficients for each device can be found in the project web
page [24].
One particular problem with the S2, Nexus, and S5 was that the
measured energy also included the energy consumed by background
processes and other hardware components of the smartphone. To prop-
erly isolate the display energy, two measurements were taken. For the
first, the flex cable that provided power, as well as data and signals,
between the display and the CPU was disconnected. This offered a
baseline measurement of the power consumption of the phone with-
out the display. By disconnecting the cable, the phone still maintains
its background processes instead of suspending them and going into
sleep mode. This baseline value was subtracted from the second mea-
surement, the power of the phone with the display cable attached, to
calculate the display power for each of the colored pages.
4 EVALUATION
This section presents the results of an evaluation of the approach. The
approach was implemented in a tool called dLens, and it was used to
answer the following research questions:
RQ 1: How accurate is the dLens analysis?
RQ 2: How generalizable are the dLens results across devices?
RQ 3: What is the impact of ads on the rankings?
RQ 4: How long does it take to perform the dLens analysis?
RQ 5: What is the potential impact of the dLens analysis?
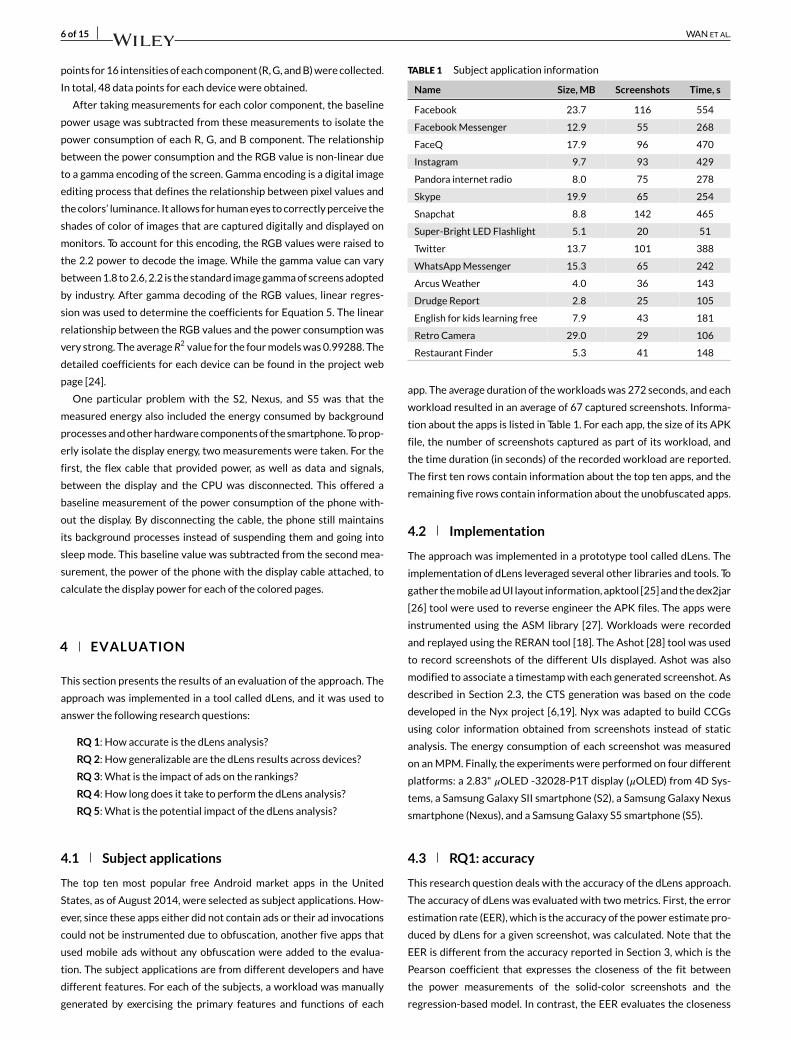
4.1 Subject applications
The top ten most popular free Android market apps in the United
States, as of August 2014, were selected as subject applications. How-
ever, since these apps either did not contain ads or their ad invocations
could not be instrumented due to obfuscation, another five apps that
used mobile ads without any obfuscation were added to the evalua-
tion. The subject applications are from different developers and have
different features. For each of the subjects, a workload was manually
generated by exercising the primary features and functions of each
TABLE 1 Subject application information
Name Size, MB Screenshots Time, s
Facebook 23.7 116 554
Facebook Messenger 12.9 55 268
FaceQ 17.9 96 470
Instagram 9.7 93 429
Pandora internet radio 8.0 75 278
Skype 19.9 65 254
Snapchat 8.8 142 465
Super-Bright LED Flashlight 5.1 20 51
Twitter 13.7 101 388
WhatsApp Messenger 15.3 65 242
Arcus Weather 4.0 36 143
Drudge Report 2.8 25 105
English for kids learning free 7.9 43 181
Retro Camera 29.0 29 106
Restaurant Finder 5.3 41 148
app. The average duration of the workloads was 272 seconds, and each
workload resulted in an average of 67 captured screenshots. Informa-
tion about the apps is listed in Table 1. For each app, the size of its APK
file, the number of screenshots captured as part of its workload, and
the time duration (in seconds) of the recorded workload are reported.
The first ten rows contain information about the top ten apps, and the
remaining five rows contain information about the unobfuscated apps.
4.2 Implementation
The approach was implemented in a prototype tool called dLens. The
implementation of dLens leveraged several other libraries and tools. To
gather the mobile ad UI layout information, apktool [25] and the dex2jar
[26] tool were used to reverse engineer the APK files. The apps were
instrumented using the ASM library [27]. Workloads were recorded
and replayed using the RERAN tool [18]. The Ashot [28] tool was used
to record screenshots of the different UIs displayed. Ashot was also
modified to associate a timestamp with each generated screenshot. As
described in Section 2.3, the CTS generation was based on the code
developed in the Nyx project [6,19]. Nyx was adapted to build CCGs
using color information obtained from screenshots instead of static
analysis. The energy consumption of each screenshot was measured
on an MPM. Finally, the experiments were performed on four different
platforms: a 2.83" 𝜇OLED -32028-P1T display (𝜇OLED) from 4D Sys-
tems, a Samsung Galaxy SII smartphone (S2), a Samsung Galaxy Nexus
smartphone (Nexus), and a Samsung Galaxy S5 smartphone (S5).
4.3 RQ1: accuracy
This research question deals with the accuracy of the dLens approach.
The accuracy of dLens was evaluated with two metrics. First, the error
estimation rate (EER), which is the accuracy of the power estimate pro-
duced by dLens for a given screenshot, was calculated. Note that the
EER is different from the accuracy reported in Section 3, which is the
Pearson coefficient that expresses the closeness of the fit between
the power measurements of the solid-color screenshots and the
regression-based model. In contrast, the EER evaluates the closeness
WAN ET AL. 7 of 15
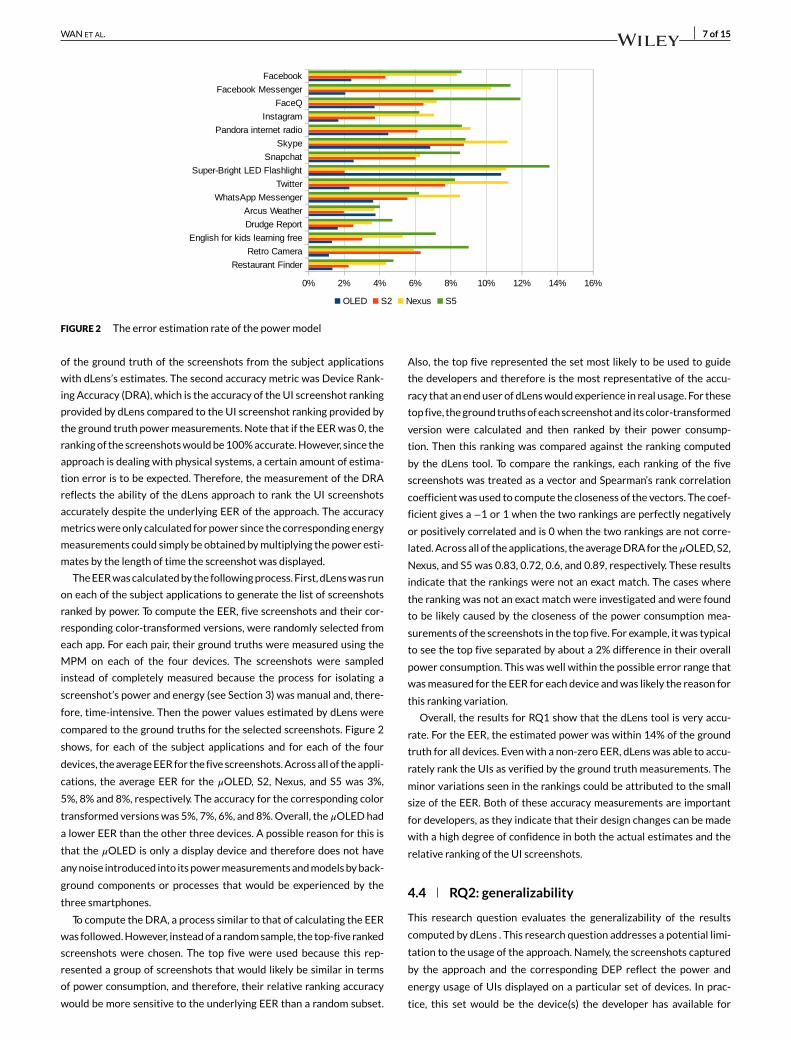
FIGURE 2 The error estimation rate of the power model
of the ground truth of the screenshots from the subject applications
with dLens’s estimates. The second accuracy metric was Device Rank-
ing Accuracy (DRA), which is the accuracy of the UI screenshot ranking
provided by dLens compared to the UI screenshot ranking provided by
the ground truth power measurements. Note that if the EER was 0, the
ranking of the screenshots would be 100% accurate. However, since the
approach is dealing with physical systems, a certain amount of estima-
tion error is to be expected. Therefore, the measurement of the DRA
reflects the ability of the dLens approach to rank the UI screenshots
accurately despite the underlying EER of the approach. The accuracy
metrics were only calculated for power since the corresponding energy
measurements could simply be obtained by multiplying the power esti-
mates by the length of time the screenshot was displayed.
The EER was calculated by the following process. First, dLens was run
on each of the subject applications to generate the list of screenshots
ranked by power. To compute the EER, five screenshots and their cor-
responding color-transformed versions, were randomly selected from
each app. For each pair, their ground truths were measured using the
MPM on each of the four devices. The screenshots were sampled
instead of completely measured because the process for isolating a
screenshot’s power and energy (see Section 3) was manual and, there-
fore, time-intensive. Then the power values estimated by dLens were
compared to the ground truths for the selected screenshots. Figure 2
shows, for each of the subject applications and for each of the four
devices, the average EER for the five screenshots. Across all of the appli-
cations, the average EER for the 𝜇OLED, S2, Nexus, and S5 was 3%,
5%, 8% and 8%, respectively. The accuracy for the corresponding color
transformed versions was 5%, 7%, 6%, and 8%. Overall, the𝜇OLED had
a lower EER than the other three devices. A possible reason for this is
that the 𝜇OLED is only a display device and therefore does not have
any noise introduced into its power measurements and models by back-
ground components or processes that would be experienced by the
three smartphones.
To compute the DRA, a process similar to that of calculating the EER
was followed. However, instead of a random sample, the top-five ranked
screenshots were chosen. The top five were used because this rep-
resented a group of screenshots that would likely be similar in terms
of power consumption, and therefore, their relative ranking accuracy
would be more sensitive to the underlying EER than a random subset.
Also, the top five represented the set most likely to be used to guide
the developers and therefore is the most representative of the accu-
racy that an end user of dLens would experience in real usage. For these
top five, the ground truths of each screenshot and its color-transformed
version were calculated and then ranked by their power consump-
tion. Then this ranking was compared against the ranking computed
by the dLens tool. To compare the rankings, each ranking of the five
screenshots was treated as a vector and Spearman’s rank correlation
coefficient was used to compute the closeness of the vectors. The coef-
ficient gives a −1 or 1 when the two rankings are perfectly negatively
or positively correlated and is 0 when the two rankings are not corre-
lated. Across all of the applications, the average DRA for the𝜇OLED, S2,
Nexus, and S5 was 0.83, 0.72, 0.6, and 0.89, respectively. These results
indicate that the rankings were not an exact match. The cases where
the ranking was not an exact match were investigated and were found
to be likely caused by the closeness of the power consumption mea-
surements of the screenshots in the top five. For example, it was typical
to see the top five separated by about a 2% difference in their overall
power consumption. This was well within the possible error range that
was measured for the EER for each device and was likely the reason for
this ranking variation.
Overall, the results for RQ1 show that the dLens tool is very accu-
rate. For the EER, the estimated power was within 14% of the ground
truth for all devices. Even with a non-zero EER, dLens was able to accu-
rately rank the UIs as verified by the ground truth measurements. The
minor variations seen in the rankings could be attributed to the small
size of the EER. Both of these accuracy measurements are important
for developers, as they indicate that their design changes can be made
with a high degree of confidence in both the actual estimates and the
relative ranking of the UI screenshots.
4.4 RQ2: generalizability
This research question evaluates the generalizability of the results
computed by dLens . This research question addresses a potential limi-
tation to the usage of the approach. Namely, the screenshots captured
by the approach and the corresponding DEP reflect the power and
energy usage of UIs displayed on a particular set of devices. In prac-
tice, this set would be the device(s) the developer has available for
8 of 15 WAN ET AL.
testing purposes. However, other devices are likely to vary in terms
of screen resolution and power consumption characteristics. To better
understand this potential limitation, this research question evaluates
how well the rankings for one device match the rankings that would
be computed for other devices using their own DEP. If the results of
the dLens approach are generalizable across mobile devices, develop-
ers can use the results from their own devices as a proxy for other or
similar devices.
To answer this research question, the similarity of the rankings gen-
erated by dLens for each of the mobile devices was compared. For
this experiment, dLens was run for each device (ie, using its own DEP)
on the set of all screenshots for each app. For each app, its screen-
shot rankings were compared against those computed for the other
devices. To compare the rankings, the Spearman’s rank correlation coef-
ficient, explained in Section 4.3, was used. A pair-wise comparison of
the rankings generated for each of the four devices was performed. The
average Spearman’s correlation coefficient across all apps for each of
the devices is shown in Table 2.
The similarity of the top n entries of each ranking was also investi-
gated, since developers may only check the top entries instead of the
entire list. To do this, the top n of each device’s ranking were treated
as a set and its overlap with that of the other devices was computed.
For each such comparison, the cardinality of the intersection of the two
set’s intersection was computed. This result is shown in Table 3 for n
equal to 5 and 10. The results show a high similarity in the top n of the
rankings. The average overlap between rankings is over 4 for the top 5
and over 9 for the top 10, demonstrating that this similarity applies to
the portion of the ranking most likely to be used by developers.
Overall, the results show that the rankings generated by dLens for
each of the mobile devices were, in fact, highly similar. The implica-
tions of this finding are that the results of running dLens on one device
are similar to those for other devices. More broadly, this indicates that
energy-reducing redesigns undertaken by developers based on results
from one device are likely to also reduce energy on other devices.
TABLE 2 Average Spearman’s correlation coefficient of rankingsbetween devices
Base Device 𝜇OLED S2 Nexus S5
𝜇OLED - 0.9874 0.9849 0.9888
S2 0.9874 - 0.9985 0.9990
Nexus 0.9849 0.9985 - 0.9942
S5 0.9888 0.9990 0.9942 -
TABLE 3 Average common screenshots in top 5 and top 10 betweendevices
Top 5 Top 10
𝜇OLED vs S2 4.33 9.47
𝜇OLED vs Nexus 4.6 9.67
𝜇OLED vs S5 4.47 9.2
S2 vs Nexus 4.47 9.33
S2 vs S5 4.07 9
Nexus vs S5 4.27 9
TABLE 4 The differences between rankings with and withoutexcluding ads
Top 5 Top 10 Rank
overlap overlap correlation
Arcus Weather 4 6 0.8263
Drudge Report 5 9 0.9687
English for kids learning free 3 9 0.9822
Retro Camera 2 7 0.3908
Restaurant Finder 4 8 0.9745
4.5 RQ3: ad impact
This research question evaluates the impact of mobile ads on the rank-
ings reported by the dLens approach. Essentially, it is measuring the
impact on the rankings of the mechanism to exclude advertisements
described in step 1 (Section 2.1). To measure this impact, the dLens
approach was run twice, the first time excluding the ad portions of the
screenshots and the second time including the ad portions. The rank-
ings generated by the two variations of the dLens approach were then
compared. The results of this analysis are shown in Table 4. First, the
rankings of all of the screenshots were compared using the Spearman’s
rank correlation coefficient. This is shown in the table as “Rank Cor-
relation.” The amount of overlap in the top n of the rankings was also
computed by treating the top n screenshots as a set and computing the
cardinality of the intersection of the two rankings. The results of this
comparison are shown in the columns labeled “Top N Overlap” where
N was set to 5 and 10. The results show that for all apps and com-
parisons except for one (top 5 for Drudge Report) ads could affect the
rankings. The magnitude of this impact varied significantly. For Arcus
Weather and Retro Camera, the impact was significantly higher than
for the other apps, such as Drudge Report and Restaurant Finder. The
results differed due to a number of reasons, including the prevalence
of ads and the appearance of the rest of the UI. These results indicate
that although ads account for a small portion of the UI display, for some
apps, they can have a significant impact on the rankings of the DEHs
and thus it is useful to have a mechanism to exclude them from the
DEH calculations.
4.6 RQ4: analysis time
This research question addresses the time needed to analyze an app
using the dLens approach. The overall time needed to run the dLens
approach and the time for three of the steps (instrumentation, power
estimation, and color transformation) was measured. Note that for this
RQ, the time to replay the workload for each app was not included as
this time is under developer control.
The analysis times are shown in Table 5. Only the analysis time for
the S2 DEP was reported because the results were very similar for all
four devices. The time for the color transformation is shown as “TC”
and the time for power estimation is shown as “TE.” For the five apps
with ads, which required instrumentation, the required time is shown
as “TI.” The total time is shown as “All UI”, which also includes time for file
processing, ranking, etc. Since each app varies in terms of the number
of screenshots in its workload, the time measurement was also normal-
ized by dividing the total time by the number of screenshots captured
WAN ET AL. 9 of 15
TABLE 5 Analysis time of the dLens approach
Name TC, s TE, s TI , s All UIs, s Per UI, s
Facebook 1470 7 - 1477 12
Facebook Messenger 997 3 - 1001 18
FaceQ 1145 5 - 1151 12
Instagram 2799 6 - 2806 30
Pandora internet radio 1418 4 - 1423 19
Skype 871 3 - 875 13
Snapchat 1444 8 - 1453 10
Super-Bright LED Flashlight 863 1 - 865 43
Twitter 1316 6 - 1323 13
WhatsApp Messenger 897 3 - 901 13
Arcus Weather 879 2 1 883 25
Drudge Report 1192 2 1 1195 48
English for kids learning free 1377 4 1 1382 32
Retro Camera 1899 3 1 1903 66
Restaurant Finder 1320 3 1 1324 32
Abbreviation: UI, user interface.
in each app’s workload. This value is shown in the column labeled “Per
UI.” All time measurements are shown in seconds.
The average time for dLens to analyze an app was 22 minutes and
ranged from 14 to 46 minutes. Although this amount can be considered
high, it was directly dependent on the overall size of the set of screen-
shots, which ranged from 20 to 142. Therefore, the per screenshot
number, which ranged from 12 to 66 seconds, is informative. For each
screenshot, it was observed that most of the time was taken by the
generation of the CTS. The runtime of the CTS algorithm is expo-
nential with respect to the number of colors present in a screenshot.
The Nyx approach uses an approximation algorithm to solve this
problem. Therefore, this aspect of the approach can be sped up,
if needed, by accepting lower quality approximations. However, this
may have a trade-off in terms of accuracy of the computed results
and rankings.
4.7 RQ5: potential impact
This research question investigated the potential impact of dLens in
two ways. The first was by determining how many market apps con-
tained DEHs, and the second was by computing the amount of energy
savings that could be realized by transforming the apps that contained
DEHs. This analysis was performed on both the subject apps listed in
Table 1 and on a much larger sample of 1082 random Android mar-
ket apps.
Because of the large number of apps, the evaluation process was
fully automated. The execution of the apps and the capture of their
initial home page was automated by using the adb [29] tool from the
Android software development kit. One challenge was to automatically
detect when the initial page of an app was valid (ie, finished loading).
This problem was solved with the heuristic that the screenshot was cap-
tured five seconds after the app started. For almost all of the apps, this
was sufficient time for the initial UI to load and display. To ensure that all
the apps had been executed successfully, all screenshots were manually
checked, and invalid screenshots, such as those representing crashed
apps, were removed. In total, screenshots of 962 apps were valid and
dLens was run on this set.
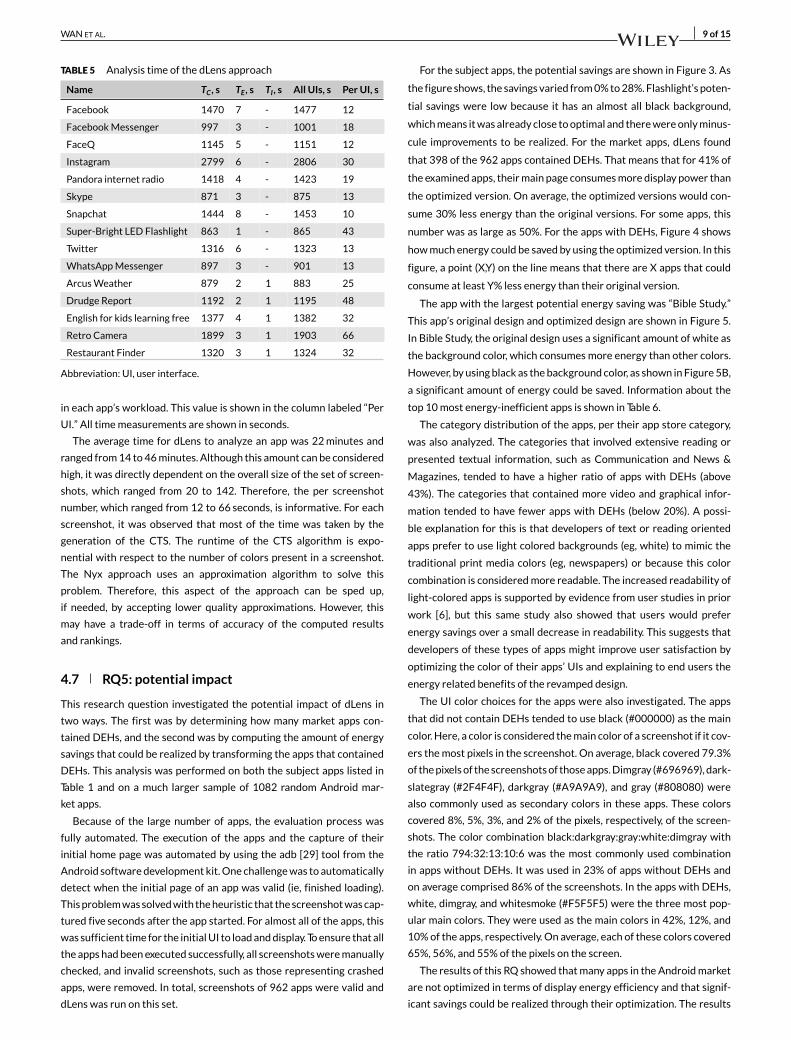
For the subject apps, the potential savings are shown in Figure 3. As
the figure shows, the savings varied from 0% to 28%. Flashlight’s poten-
tial savings were low because it has an almost all black background,
which means it was already close to optimal and there were only minus-
cule improvements to be realized. For the market apps, dLens found
that 398 of the 962 apps contained DEHs. That means that for 41% of
the examined apps, their main page consumes more display power than
the optimized version. On average, the optimized versions would con-
sume 30% less energy than the original versions. For some apps, this
number was as large as 50%. For the apps with DEHs, Figure 4 shows
how much energy could be saved by using the optimized version. In this
figure, a point (X,Y) on the line means that there are X apps that could
consume at least Y% less energy than their original version.
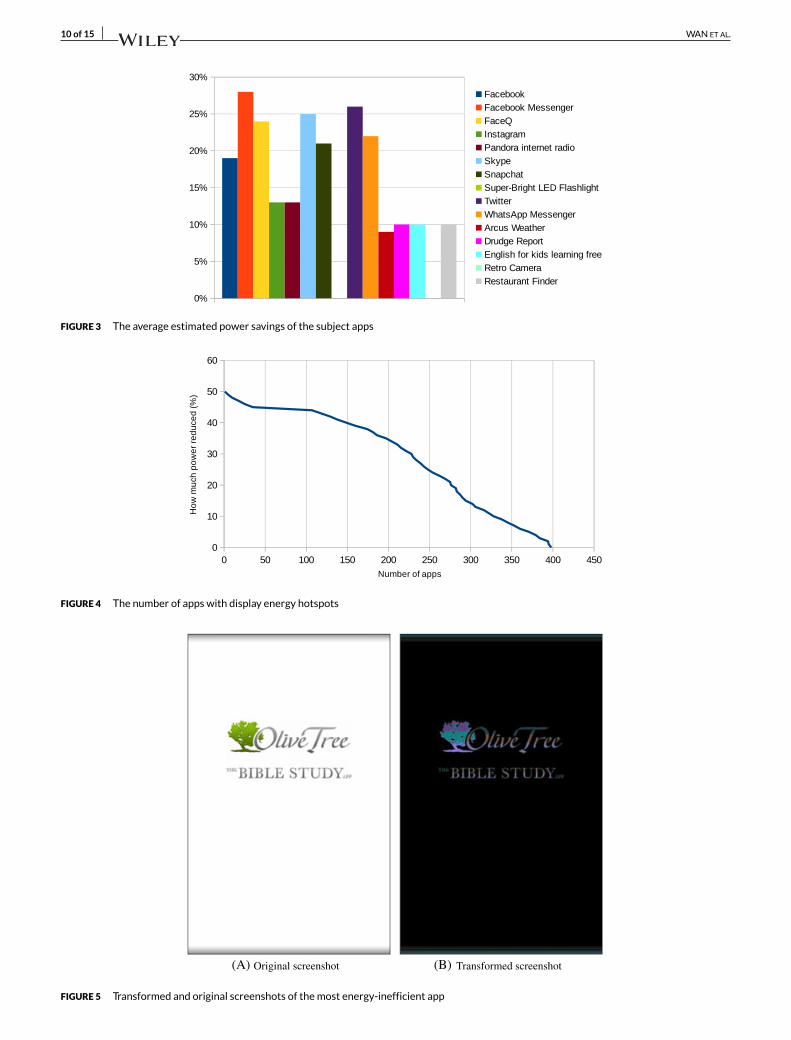
The app with the largest potential energy saving was “Bible Study.”
This app’s original design and optimized design are shown in Figure 5.
In Bible Study, the original design uses a significant amount of white as
the background color, which consumes more energy than other colors.
However, by using black as the background color, as shown in Figure 5B,
a significant amount of energy could be saved. Information about the
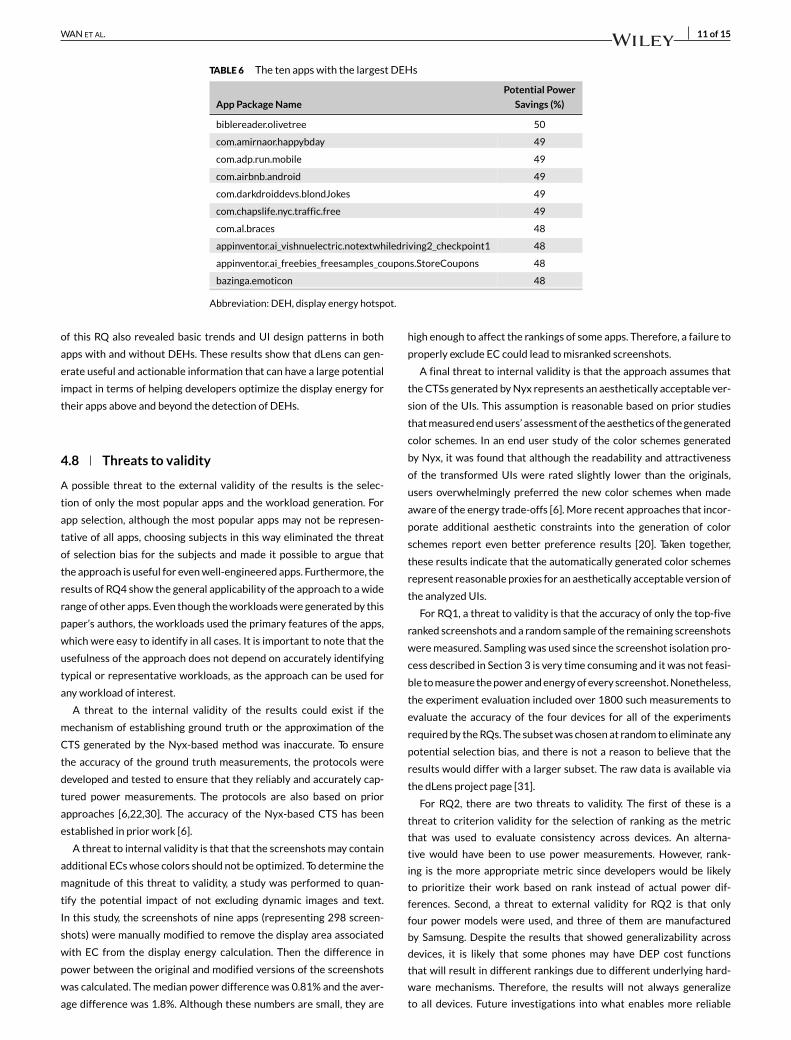
top 10 most energy-inefficient apps is shown in Table 6.
The category distribution of the apps, per their app store category,
was also analyzed. The categories that involved extensive reading or
presented textual information, such as Communication and News &
Magazines, tended to have a higher ratio of apps with DEHs (above
43%). The categories that contained more video and graphical infor-
mation tended to have fewer apps with DEHs (below 20%). A possi-
ble explanation for this is that developers of text or reading oriented
apps prefer to use light colored backgrounds (eg, white) to mimic the
traditional print media colors (eg, newspapers) or because this color
combination is considered more readable. The increased readability of
light-colored apps is supported by evidence from user studies in prior
work [6], but this same study also showed that users would prefer
energy savings over a small decrease in readability. This suggests that
developers of these types of apps might improve user satisfaction by
optimizing the color of their apps’ UIs and explaining to end users the
energy related benefits of the revamped design.
The UI color choices for the apps were also investigated. The apps
that did not contain DEHs tended to use black (#000000) as the main
color. Here, a color is considered the main color of a screenshot if it cov-
ers the most pixels in the screenshot. On average, black covered 79.3%
of the pixels of the screenshots of those apps. Dimgray (#696969), dark-
slategray (#2F4F4F), darkgray (#A9A9A9), and gray (#808080) were
also commonly used as secondary colors in these apps. These colors
covered 8%, 5%, 3%, and 2% of the pixels, respectively, of the screen-
shots. The color combination black:darkgray:gray:white:dimgray with
the ratio 794:32:13:10:6 was the most commonly used combination
in apps without DEHs. It was used in 23% of apps without DEHs and
on average comprised 86% of the screenshots. In the apps with DEHs,
white, dimgray, and whitesmoke (#F5F5F5) were the three most pop-
ular main colors. They were used as the main colors in 42%, 12%, and
10% of the apps, respectively. On average, each of these colors covered
65%, 56%, and 55% of the pixels on the screen.
The results of this RQ showed that many apps in the Android market
are not optimized in terms of display energy efficiency and that signif-
icant savings could be realized through their optimization. The results
10 of 15 WAN ET AL.
FIGURE 3 The average estimated power savings of the subject apps
FIGURE 4 The number of apps with display energy hotspots
(A) (B)
FIGURE 5 Transformed and original screenshots of the most energy-inefficient app
WAN ET AL. 11 of 15
TABLE 6 The ten apps with the largest DEHs
Potential Power
App Package Name Savings (%)
biblereader.olivetree 50
com.amirnaor.happybday 49
com.adp.run.mobile 49
com.airbnb.android 49
com.darkdroiddevs.blondJokes 49
com.chapslife.nyc.traffic.free 49
com.al.braces 48
appinventor.ai_vishnuelectric.notextwhiledriving2_checkpoint1 48
appinventor.ai_freebies_freesamples_coupons.StoreCoupons 48
bazinga.emoticon 48
Abbreviation: DEH, display energy hotspot.
of this RQ also revealed basic trends and UI design patterns in both
apps with and without DEHs. These results show that dLens can gen-
erate useful and actionable information that can have a large potential
impact in terms of helping developers optimize the display energy for
their apps above and beyond the detection of DEHs.
4.8 Threats to validity
A possible threat to the external validity of the results is the selec-
tion of only the most popular apps and the workload generation. For
app selection, although the most popular apps may not be represen-
tative of all apps, choosing subjects in this way eliminated the threat
of selection bias for the subjects and made it possible to argue that
the approach is useful for even well-engineered apps. Furthermore, the
results of RQ4 show the general applicability of the approach to a wide
range of other apps. Even though the workloads were generated by this
paper’s authors, the workloads used the primary features of the apps,
which were easy to identify in all cases. It is important to note that the
usefulness of the approach does not depend on accurately identifying
typical or representative workloads, as the approach can be used for
any workload of interest.
A threat to the internal validity of the results could exist if the
mechanism of establishing ground truth or the approximation of the
CTS generated by the Nyx-based method was inaccurate. To ensure
the accuracy of the ground truth measurements, the protocols were
developed and tested to ensure that they reliably and accurately cap-
tured power measurements. The protocols are also based on prior
approaches [6,22,30]. The accuracy of the Nyx-based CTS has been
established in prior work [6].
A threat to internal validity is that that the screenshots may contain
additional ECs whose colors should not be optimized. To determine the
magnitude of this threat to validity, a study was performed to quan-
tify the potential impact of not excluding dynamic images and text.
In this study, the screenshots of nine apps (representing 298 screen-
shots) were manually modified to remove the display area associated
with EC from the display energy calculation. Then the difference in
power between the original and modified versions of the screenshots
was calculated. The median power difference was 0.81% and the aver-
age difference was 1.8%. Although these numbers are small, they are
high enough to affect the rankings of some apps. Therefore, a failure to
properly exclude EC could lead to misranked screenshots.
A final threat to internal validity is that the approach assumes that
the CTSs generated by Nyx represents an aesthetically acceptable ver-
sion of the UIs. This assumption is reasonable based on prior studies
that measured end users’ assessment of the aesthetics of the generated
color schemes. In an end user study of the color schemes generated
by Nyx, it was found that although the readability and attractiveness
of the transformed UIs were rated slightly lower than the originals,
users overwhelmingly preferred the new color schemes when made
aware of the energy trade-offs [6]. More recent approaches that incor-
porate additional aesthetic constraints into the generation of color
schemes report even better preference results [20]. Taken together,
these results indicate that the automatically generated color schemes
represent reasonable proxies for an aesthetically acceptable version of
the analyzed UIs.
For RQ1, a threat to validity is that the accuracy of only the top-five
ranked screenshots and a random sample of the remaining screenshots
were measured. Sampling was used since the screenshot isolation pro-
cess described in Section 3 is very time consuming and it was not feasi-
ble to measure the power and energy of every screenshot. Nonetheless,
the experiment evaluation included over 1800 such measurements to
evaluate the accuracy of the four devices for all of the experiments
required by the RQs. The subset was chosen at random to eliminate any
potential selection bias, and there is not a reason to believe that the
results would differ with a larger subset. The raw data is available via
the dLens project page [31].
For RQ2, there are two threats to validity. The first of these is a
threat to criterion validity for the selection of ranking as the metric
that was used to evaluate consistency across devices. An alterna-
tive would have been to use power measurements. However, rank-
ing is the more appropriate metric since developers would be likely
to prioritize their work based on rank instead of actual power dif-
ferences. Second, a threat to external validity for RQ2 is that only
four power models were used, and three of them are manufactured
by Samsung. Despite the results that showed generalizability across
devices, it is likely that some phones may have DEP cost functions
that will result in different rankings due to different underlying hard-
ware mechanisms. Therefore, the results will not always generalize
to all devices. Future investigations into what enables more reliable
12 of 15 WAN ET AL.
result generalizability will enable stronger conclusions to be made on
this aspect.
For RQ3, a threat to validity is that only the ranking differences for
five apps were computed. This was due to the limitations of reverse
engineering tools and the use of obfuscation techniques in the apps.
However, these five apps cover different app categories, and it is likely
that the results will be similar when considering a larger set of apps
containing ads.
5 RELATED WORK
This paper extends prior work [32] by the authors in the following ways:
(1) dLens was enhanced to be able to exclude dynamic content or con-
tent that should not be considered in the identification of the DEHs. For
advertisements, a fully automated mechanism was developed for iden-
tifying and excluding the portion of the screen they occupy. This mecha-
nism also allows developers to manually specify other areas to exclude
from the analysis. (2) The size of the evaluation was expanded by adding
five additional apps and adding an additional mobile phone platform,
the Samsung Galaxy S5, to evaluate the approach. Overall, these exten-
sions improve the accuracy of the technique and the generalizability of
the results.
The approach to building the DEP is based on research work per-
formed by Dong and colleagues [22,30]. In their work they constructed
a power model for a commercial QVGA OLED display module. In
their power model, they demonstrated the linear relationship between
power consumption and sRGB value and achieved 90% accuracy in
the display power estimation. Other power models for 𝜇OLED screens
have also been proposed and could also be used to implement the DEP.
Zhang [11] built a quadratic model for OLED screens, which increased
estimation accuracy. Kim and colleagues [33] modified Dong and col-
leagues’ model by considering the brightness and sum of RGB values
for AMOLED screens. Mittal and colleagues [34] refined a power model
based on threshold of RGB component values. However, these works
only focused on developing new techniques for modeling the power
consumption of 𝜇OLED screens and did not detect DEHs or give opti-
mization guidance to developers.
Many approaches have been proposed to help developers reduce
the energy consumption of UIs by manipulating their colors. The dLens
approach builds on prior work in the area, Nyx [6,19,35], to conduct
step 3 of the approach. Linares-Vásquez and colleagues [20] showed
that the same problem could be solved using a multi-objective genetic
algorithm–based approach. Prior to Nyx, Dong and colleagues [22,36]
proposed a method to generate CTSs and then later used this to build
a color transforming browser that could reduce the energy of the web
pages it displayed [9,10]. On the basis of a screen space variant energy
model, Chuang and colleagues [37] presented an approach to gener-
ate energy-efficient color designs by using iso-lightness colors. Wang
and colleagues [38] proposed a technique to find an energy-saving
color scheme for sequential data on OLED screens. Kamijoh and col-
leagues reduced the display energy of the IBM Wristwatch by reducing
the number of white pixels [39]. All of these techniques assume that a
DEH has been located. As such, these techniques can be seen as com-
plementary to the approach described in this paper. Once a DEH has
been identified by dLens, these techniques can help guide developers
to choose new color schemes that can reduce energy while maintaining
the aesthetics of the app’s UI.
Other proposed ways to save display energy include darkening the
unimportant parts of a screen. Iyer and colleagues [40] proposed a
method to reduce the energy consumption of OLED screens by dark-
ening the user-unfocused areas. Wee and colleagues [41] designed an
approach to reduce the power consumption of gaming on OLED dis-
plays by dimming noninteresting parts. Tan and colleagues [42] also
proposed a tool called Focus to reduce OLED display power by dimming
less important regions. Chen and colleagues [43] reduced OLED dis-
play power by using a dimming scheme to eliminate undesired details.
Lin and colleagues [44] provided an OLED power saving technique by
distorting image regions according to visual attention level. For LCD
displays, energy optimization is mainly achieved by reducing external
brightness [45,46] or refresh rates [47] and adapting the content to the
brightness change [48].
Sampson and colleagues [49] developed a tool called WebChar to
evaluate browser performance and the energy consumption of differ-
ent code features in HTML and CSS, which guides developers to opti-
mize browsers or web applications. This work focused on the impact of
HTML and CSS code structure on energy consumption, whereas dLens
focuses on UI color design.
Many approaches have also been proposed to model the power
consumption of other components in mobile devices (ie, nondisplay
components). Shye and colleagues [50] obtained power models for
all components of an Android G1 based on measurements of a log-
ger they developed. Negri and colleagues [51] treated applications as
Finite-state Machines (FSMs) and built power models through mea-
surement of selected states. Several approaches [11,52,53] acquired
power models automatically based on the battery behavior of mobile
devices. Other techniques estimate energy consumption based on dif-
ferent models. Previous work [14,15,54] estimated energy consump-
tion at the source line level. Tiwari and colleagues [55,56] modeled the
CPU energy of hardware instructions. Eprof [57] modeled energy with
a state machine. Wang and colleagues [58] estimated the power con-
sumption of mobile applications with profile-based battery traces. Li
and colleagues [59] proposed Bugu, an application level power profiler
and analyzer for mobile phones. Tsao and colleagues [60] estimated the
energy consumption of I/O requests in application processes. Xiao and
colleagues [61] proposed a methodology to build system-level power
models for different components of mobile devices without measure-
ments.
In addition, many other researchers have empirically investigated
the energy consumption of Android apps [4], and the energy impacts
of mobile advertisement [62,63], software changes [64,65,66,67], user
choice of applications [68], blocking advertisements [69], refactor-
ing [70,71], obfuscation [72,73], and test suite selection [74]. Other
researchers have proposed new techniques to detect different kinds
of energy bugs. Pathak and colleagues defined energy bugs [75] and
proposed an automatic technique to detect energy bugs on smart-
phones [7]. However, they only focused on identifying “wakelock bugs.”
Linares-Vásquez [76] studied energy greedy API usage in Android
apps. Liu and colleagues [77] proposed an automated approach to
detect energy bugs that did not deactivate sensors and misused sensor
WAN ET AL. 13 of 15
data. Other researchers have focused on optimization of mobile apps.
Kwon and colleagues [78] optimized the energy consumption by
offloading partial app functionality to the cloud. Li and colleagues
[79,80] used a proxy server to optimize the HTTP requests of mobile
apps. For Green Mining, Romansky and colleagues [81] introduced a
search-based approximation method to accelerate harvesting energy
profiles while minimizing the accuracy loss. In addition, Hindle and col-
leagues [82] proposed a dedicated hardware Mining Software Repos-
itories (MSR)-based test harness called Green Miner to facilitate the
research of Green Mining.
6 CONCLUSIONS
This paper presented a new technique for detecting DEHs in mobile
apps. A DEH is defined as a UI of a mobile app whose energy con-
sumption is higher than that of an energy-optimized but functionally
equivalent UI. The approach detects DEHs with five steps. First, the
approach processes the target app and instruments mobile ads so that
their location can be identified at runtime. Second, the approach exe-
cutes a developer specified workload for the target app on a mobile
device and captures screenshots of the display and ad related informa-
tion. Third, the approach generates a CTS for each captured screen-
shot and produces an approximation of an energy-efficient version.
Fourth, it analyzes each screenshot and its alternative version to deter-
mine their expected display energy. Finally, the approach calculates the
power and energy difference between the two versions of screenshots
and provides developers with a list of DEHs. The approach was imple-
mented in a prototype tool, dLens, and evaluated on real-world popular
mobile apps. The results of the evaluation showed that the approach
was able to accurately estimate display power consumption and rank
screenshots with DEHs. Furthermore, the technique was able to detect
DEHs in 398 Android market apps. Overall, the results are very promis-
ing and indicate that the technique is a viable and potentially impactful
technique for helping developers to reduce the energy consumption of
their mobile apps.
ACKNOWLEDGEMENTS
This work was supported, in part, by the National Science Foundation
under grant numbers CCF-1321141 and CCF-1619455.
REFERENCES
1. Inc A., Press Releases. http://www.apple.com/pr/library.
2. C. Warren, Google Play Hits 1 Million Apps. Mashable. Retrieved, 4 June2014.
3. T. Ahonen, Lets Do 2014 Numbers for the Mobile Industry: Now we are at100% Mobile Subscription Penetration Rate Per Capita Globally, RetrievedMay 12, 2014.
4. D. Li et al., An empirical study of the energy consumption of androidapplications, Software Maintenance and Evolution (ICSME), 2014IEEE International Conference on, 2014, Washington, DC, USA, pp.121–130.
5. D. Li and W. G. J. Halfond, An investigation into energy-saving program-ming practices for android smartphone app development, Proceedingsof the 3rd International Workshop on Green and Sustainable Software,GREENS 2014, ACM, New York, NY, USA, 2014, pp. 46–53.
6. D. Li, A. H. Tran, and W. G. J. Halfond, Making web applicationsmore energy efficient for OLED smartphones, Proceedings of the 36th
International Conference on Software Engineering, ICSE 2014, ACM, NewYork, NY, USA, 2014, pp. 527–538.
7. A. Pathak et al., What is keeping my phone awake? Characterizing anddetecting no-sleep energy bugs in smartphone apps, Proceedings of the10th International Conference on Mobile Systems, Applications, and Ser-vices, MobiSys ’12, ACM, New York, NY, USA, 2012, pp. 267–280.
8. A. Barredo, A comprehensive look at smartphone screen size statistics andtrends. Medium.
9. M. Dong and L. Zhong, Chameleon: a color-adaptive web browser formobile OLED displays, Proceedings of the 9th International Conference onMobile Systems, Applications, and Services, MobiSys ’11, ACM, New York,NY, USA, 2011, pp. 85–98.
10. M. Dong and L. Zhong, Chameleon: a color-adaptive web browser formobile OLED displays, IEEE Trans. Mobile Comput. 11 (2012), no. 5,724–738.
11. L. Zhang. (2013). Power, performance modeling and optimization formobile system and applications, Ph.D. Thesis.
12. C. Sahin et al., Initial explorations on design pattern energy usage,Proceedings of the First International Workshop on Green and Sustain-able Software, GREENS ’12, IEEE Press, Piscataway, NJ, USA, 2012,pp. 55–61.
13. I. Manotas, L. Pollock, and J. Clause, SEEDS: A software engineer’senergy-optimization decision support framework, Proceedings of the36th International Conference on Software Engineering, ICSE 2014, ACM,New York, NY, USA, 2014, pp. 503–514.
14. D. Li et al., Calculating source line level energy information for androidapplications, Proceedings of the 2013 International Symposium on Soft-ware Testing and Analysis, ISSTA 2013, ACM, New York, NY, USA, 2013,pp. 78–89.
15. S. Hao et al., Estimating mobile application energy consumption usingprogram analysis, Proceedings of the 2013 International Conference onSoftware Engineering, ICSE ’13, IEEE Press, Piscataway, NJ, USA, 2013,pp. 92–101.
16. I. J. M. Ruiz et al., Impact of Ad libraries on ratings of android mobile apps,IEEE Software 31 (2014), no. 6, 86–92.
17. S. Hao et al., PUMA: Programmable UI-automation for large-scaledynamic analysis of mobile apps, Proceedings of the 12th Annual Interna-tional Conference on Mobile Systems, Applications, and Services, MobiSys’14, ACM, New York, NY, USA, 2014, pp. 204–217.
18. L. Gomez et al., RERAN: Timing- and touch-sensitive record and replayfor android, Proceedings of the 2013 International Conference on SoftwareEngineering, ICSE ’13, IEEE Press, Piscataway, NJ, USA, 2013, pp. 72–81.
19. D. Li, A. H. Tran, and W. G. J. Halfond, Nyx: A Display Energy Optimizerfor Mobile Web Apps, Proceedings of the 2015 10th Joint Meeting onFoundations of Software Engineering, ESEC/FSE 2015, ACM, New York,NY, USA, 2015, pp. 958–961.
20. M. Linares-Vásquez et al., Optimizing energy consumption of GUIs inandroid apps: A multi-objective approach, Proceedings of the 2015 10thJoint Meeting on Foundations of Software Engineering, ESEC/FSE 2015,ACM, New York, NY, USA, 2015, pp. 143–154.
21. Recognized color keyword names. http://www.w3.org/TR/SVG/types.html.
22. M. Dong and L. Zhong, Power modeling and optimization for OLED dis-plays, IEEE Trans. Mobile Comput. 11 (2012), no. 9, 1587–1599.
23. Inc. Monsoon Solutions, Power Monitor. https://www.msoon.com/LabEquipment/PowerMonitor/.
24. DEP coefficients. https://sites.google.com/site/dlensproject/dep-coefficients.
25. A tool for reverse engineering Android apk files. https://ibotpeaches.github.io/Apktool/.
26. dex2jar. https://github.com/pxb1988/dex2jar.
27. ASM. http://asm.ow2.org/.
28. Android Screenshots and Screen Capture. http://sourceforge.net/projects/ashot/.
29. G. Inc., Android Debug Bridge. http://developer.android.com/tools/help/adb.html.

14 of 15 WAN ET AL.
30. M. Dong, Y-SK Choi, and L. Zhong, Power modeling of graphical userinterfaces on OLED displays, Proceedings of the 46th Annual DesignAutomation Conference, DAC ’09, ACM, New York, NY, USA, 2009,pp. 652–657.
31. dLens. https://sites.google.com/site/dlensproject/.
32. M. Wan et al., Detecting display energy hotspots in android apps, 2015IEEE 8th International Conference on Software Testing, Verificationand Validation (ICST), Washington, DC, USA, 2015, pp. 1–10.
33. D. Kim, W. Jung, and H. Cha, in Runtime power estimation of mobileAMOLED displays, Design, Automation Test in Europe ConferenceExhibition (DATE), 2013, Washington, DC, USA, 2013, pp. 61–64.
34. R. Mittal, A. Kansal, and R. Chandra, Empowering developers to esti-mate app energy consumption, Proceedings of the 18th Annual Interna-tional Conference on Mobile Computing and Networking, Mobicom ’12,ACM, New York, NY, USA, 2012, pp. 317–328.
35. D. Li, A. H. Tran, and W. G. J. Halfond, Optimizing display energy con-sumption for hybrid android apps (invited talk), Proceedings of the 3rdInternational Workshop on Software Development Lifecycle for Mobile,DeMobile 2015, ACM, New York, NY, USA, 2015, pp. 35–36.
36. M. Dong, Y-SK Choi, and L. Zhong, Power-saving color transforma-tion of mobile graphical user interfaces on OLED-based displays, Pro-ceedings of the 2009 ACM/IEEE International Symposium on Low PowerElectronics and Design, ISLPED ’09, ACM, New York, NY, USA, 2009,pp. 339–342.
37. J. Chuang, D. Weiskopf, and T. Möller, Energy aware color sets, Comput.Graphics Forum 28 (2009), no.2, 203–211.
38. J. Wang, X. Lin, and C. North, GreenVis: energy-saving color schemes forsequential data visualization on OLED displays, 2012.
39. N. Kamijoh et al., Energy trade-offs in the IBM wristwatch computer,Proceedings of the 5th IEEE International Symposium on WearableComputers, ISWC ’01, IEEE Computer Society, Washington, DC, USA,2001, pp. 133–140.
40. S. Iyer et al., Energy-adaptive display system designs for future mobileenvironments, Proceedings of the 1st International Conference on MobileSystems, Applications and Services, MobiSys ’03, ACM, New York, NY,USA, 2003, pp. 245–258.
41. T. K. Wee and R. K. Balan, Adaptive display power management forOLED displays, Proceedings of the First ACM International Workshop onMobile Gaming, MobileGames ’12, ACM, New York, NY, USA, 2012,pp. 25–30.
42. K. W. Tan et al., FOCUS: A usable & effective approach to OLED displaypower management, Proceedings of the 2013 ACM International JointConference on Pervasive and Ubiquitous Computing, UbiComp ’13, ACM,New York, NY, USA, 2013, pp. 573–582.
43. H. Chen et al., An image-space energy-saving visualization scheme forOLED displays, Comput. Graphics (2014).
44. C. H. Lin, C-K Kang, and P. C. Hsiu, in Catch your attention:Quality-retaining power saving on mobile OLED displays, 2014 51stACM/EDAC/IEEE Design Automation Conference (DAC), New York,NY, USA, 2014, pp. 1–6.
45. H. Shim, N. Chang, and M. Pedram, A backlight power management frame-work for battery-operated multimedia systems, IEEE Design Test of Com-put. 21 (2004), no. 5, 388–396.
46. A. Iranli and M. Pedram, in DTM: Dynamic tone mapping for back-light scaling, Proceedings. 42nd Design Automation Conference, 2005,2005, New York, NY, USA, pp. 612–616.
47. A. K. Bhowmik and R. J. Brennan, in System-level display power reduc-tion technologies for portable computing and communications devices,Portable Information Devices, 2007. Portable07. IEEE InternationalConference on, Washington, DC, USA, 2007, pp. 1–5.
48. A. Iranli, H. Fatemi, and M. Pedram, HEBS: Histogram equalizationfor backlight scaling, Proceedings of the Conference on Design, Automa-tion and Test in Europe - Volume 1, DATE ’05, IEEE Computer Society,Washington, DC, USA, 2005, pp. 346–351.
49. A. Sampson et al., Automatic discovery of performance and energy pit-falls in HTML and CSS, Workload Characterization (IISWC), 2012 IEEEInternational Symposium on, Washington, DC, USA, 2012, pp. 82–83.
50. A. Shye, B. Scholbrock, and G. Memik, Into the wild: Studying real useractivity patterns to guide power optimizations for mobile architec-tures, Proceedings of the 42nd Annual IEEE/ACM International Sympo-sium on Microarchitecture, MICRO 42, ACM, New York, NY, USA, 2009,pp. 168–178.
51. L. Negri, D. Barretta, and W. Fornaciari, Application-level power man-agement in pervasive computing systems: A case study, Proceedings ofthe 1st Conference on Computing Frontiers, CF ’04, ACM, New York, NY,USA, 2004, pp. 78–88.
52. L. Zhang et al., Accurate online power estimation and automatic bat-tery behavior based power model generation for smartphones, Hard-ware/Software Codesign and System Synthesis (CODES+ISSS), 2010IEEE/ACM/IFIP International Conference on, 2010, New York, NY,USA, pp. 105–114.
53. M. Dong and L. Zhong, Self-constructive high-rate system energymodeling for battery-powered mobile systems, Proceedings of the 9thInternational Conference on Mobile Systems, Applications, and Services,MobiSys ’11, ACM, New York, NY, USA, 2011, pp. 335–348.
54. S. Hao et al., Estimating android applications’ CPU energy usage viabytecode profiling, Proceedings of the First International Workshop onGreen and Sustainable Software, GREENS ’12, IEEE Press, Piscataway,NJ, USA, 2012, pp. 1–7.
55. V. Tiwari, S. Malik, and A. Wolfe, Power analysis of embedded software: Afirst step towards software power minimization (1994), 384–390.
56. V. Tiwari et al., Instruction level power analysis and optimization ofsoftware, VLSI Design, 1996. Proceedings., Ninth International Con-ference on, Washington, DC, USA, 1996, pp. 326–328.
57. A. Pathak, Y. C. Hu, and M. Zhang, Where is the energy spent insidemy app?: fine grained energy accounting on smartphones with Eprof,Proceedings of the 7th ACM European Conference on Computer Systems,EuroSys ’12, ACM, New York, NY, USA, 2012, pp. 29–42.
58. C. Wang et al., Power estimation for mobile applications withprofile-driven battery traces, Low Power Electronics and Design(ISLPED), 2013 IEEE International Symposium on, Washington, DC,USA, 2013, pp. 120–125.
59. Y. Li, H. Chen, and W. Shi, Power behavior analysis of mobile applicationsusing bugu, Sustainable Comput. Inf. Syst. (2014).
60. S-L Tsao, C-K Yu, and Y-H Chang, Architecture of Computing Sys-tems – ARCS 2013: 26th International Conference, Prague, Czech Republic,February 19-22, 2013. Proceedings, Springer Berlin Heidelberg, Berlin,Heidelberg, 2013, pp. 195–206.
61. Y. Xiao et al., A system-level model for runtime power estimation
on mobile devices, Green Computing and Communications (GREEN-
COM), 2010 IEEE/ACM Int’l Conference on Int’l Conference on Cyber,
Physical and Social Computing (CPSCom), Washington, DC, USA, 2010,
pp. 27–34.
62. J. Gui et al., Truth in advertising: the hidden cost of mobile Ads for
software developers, Proceedings of the 37th International Conference onSoftware Engineering - Volume 1, ICSE ’15, IEEE Press, Piscataway, NJ,
USA, 2015, pp. 100–110.
63. J. Gui et al., Lightweight measurement and estimation of mobile Ad
energy consumption, Proceedings of the 5th International Workshop onGreen and Sustainable Software, GREENS ’16, ACM, New York, NY, USA,
2016, pp. 1–7.
64. A. Hindle, in Green mining: Investigating power consumption across
versions, 2012 34th International Conference on Software Engineer-
ing (ICSE), Washington, DC, USA, 2012, pp. 1301–1304.
65. A. Hindle, in Green mining: A methodology of relating software changeto power consumption, 2012 9th IEEE Working Conference on MiningSoftware Repositories (MSR), Washington, DC, USA, 2012, pp. 78–87.
66. K. Aggarwal et al., The power of system call traces: Predicting
the software energy consumption impact of changes, Proceedings of24th Annual International Conference on Computer Science and Soft-ware Engineering, CASCON ’14, IBM Corp., Riverton, NJ, USA, 2014,
pp. 219–233.
WAN ET AL. 15 of 15
67. A. Hindle, Green Mining: a Methodology of Relating Software Change andConfiguration to Power Consumption, Empirical Software Eng. 20 (2015),no. 2, 374–409.
68. C. Zhang, A. Hindle, and D. M. German, The impact of user choice onenergy consumption, IEEE Software 31 (2014), no. 3, 69–75.
69. K. Rasmussen, A. Wilson, and A. Hindle, Green mining: Energy con-sumption of advertisement blocking methods, Proceedings of the 3rdInternational Workshop on Green and Sustainable Software, GREENS2014, ACM, New York, NY, USA, 2014, pp. 38–45.
70. C. Sahin, L. Pollock, and J. Clause, How do code refactorings affectenergy usage?, Proceedings of the 8th ACM/IEEE International Symposiumon Empirical Software Engineering and Measurement, ESEM ’14, ACM,New York, NY, USA, 2014, pp. 36:1–36:10.
71. W. G. da Silva et al., Evaluation of the impact of code refactoring onembedded software efficiency, Proceedings of the 1st Workshop deSistemas Embarcados, Porto Alegre, Brazil, 2010, pp. 145–150.
72. C. Sahin et al., How Does Code Obfuscation Impact Energy Usage?Proceedings of the 2014 IEEE International Conference on Software Main-tenance and Evolution, ICSME ’14, IEEE Computer Society, Washington,DC, USA, 2014, pp. 131–140.
73. C. Sahin et al., How does code obfuscation impact energy usage? J. Soft-ware: Evol. Process (2016).
74. D. Li et al., Integrated energy-directed test suite optimization, Proceed-ings of the 2014 International Symposium on Software Testing and Analysis,ISSTA 2014, ACM, New York, NY, USA, 2014, pp. 339–350.
75. A. Pathak, Y. C. Hu, and M. Zhang, Bootstrapping energy debugging onsmartphones: A first look at energy bugs in mobile devices, Proceedingsof the 10th ACM Workshop on Hot Topics in Networks, HotNets-X, ACM,New York, NY, USA, 2011, pp. 5:1–5:6.
76. M. Linares-Vásquez et al., Mining energy-greedy API usage patterns in
android apps: An empirical study, Proceedings of the 11th Working Con-ference on Mining Software Repositories, MSR 2014, ACM, New York, NY,
USA, 2014, pp. 2–11.
77. Y. Liu et al., GreenDroid: automated diagnosis of energy inefficiency forsmartphone applications, IEEE Trans. Software Eng. 40 (2014), no. 9,911–940.
78. Y-W Kwon and E. Tilevich, Reducing the energy consumption of mobile
applications behind the scenes, Proceedings of the 2013 IEEE Interna-tional Conference on Software Maintenance, ICSM ’13, IEEE Computer
Society, Washington, DC, USA, 2013, pp. 170–179.
79. D. Li and W. G. J. Halfond, Optimizing energy of HTTP requests in
android applications, Proceedings of the 3rd International Workshop onSoftware Development Lifecycle for Mobile, DeMobile 2015, ACM, New
York, NY, USA, 2015, pp. 25–28.
80. D. Li et al., Automated energy optimization of HTTP requests for
mobile applications, Proceedings of the 38th International Conferenceon Software Engineering, ICSE ’16, ACM, New York, NY, USA, 2016,
pp. 249–260.
81. S. Romansky and A. Hindle, On improving green mining for
energy-aware software analysis, Proceedings of 24th Annual Inter-national Conference on Computer Science and Software Engineering,
CASCON ’14, IBM Corp., Riverton, NJ, USA, 2014, pp. 234–245.
82. A. Hindle et al., GreenMiner: A hardware based mining software repos-itories software energy consumption framework, Proceedings of the11th Working Conference on Mining SoftwareRepositories, MSR 2014,ACM, New York, NY, USA, 2014, pp. 12–21.
How to cite this article: Wan M, Jin Y, Li D, Gui J,
Mahajan S, Halfond WGJ. Detecting display energy hotspots
in Android apps. Softw Test Verif Reliab. 2017;27:e1635.
https://doi.org/10.1002/stvr.1635