Detailed Study of Selenium in Glacial- Lake Deposits ... · evapoconcentration. Maximum...
59
Detailed Study of Selenium in Glacial- Lake Deposits, Wetlands, and Biota Associated with Irrigation Drainage in the Southern Freezeout Lake Area, West-Central Montana, 1994-95 U.S. Geological Survey Water-Resources Investigations Report 994019 U.S. Geological Survey U.S. Fish and Wildlife Service Bureau of Reclamation Bureau of Indian Affairs
Transcript of Detailed Study of Selenium in Glacial- Lake Deposits ... · evapoconcentration. Maximum...

Detailed Study of Selenium in Glacial-
Lake Deposits, Wetlands, and Biota
Associated with Irrigation Drainage in
the Southern Freezeout Lake Area,
West-Central Montana, 1994-95
U.S. Geological SurveyWater-Resources Investigations
Report 994019
U.S. Geological SurveyU.S. Fish and Wildlife Service
Bureau of ReclamationBureau of Indian Affairs


U.S. Department of the Interior U.S. Geological Survey
Detailed Study of Selenium in Glacial-Lake Deposits, Wetlands, and Biota Associated with Irrigation Drainage in the Southern Freezeout Lake Area, West-Central Montana, 1994-95
By Eloise Kendy and David A. Nimick, U.S. Geological Survey, and John C. Malloy and Bill Olsen, U.S. Fish and Wildlife Service
Water-Resources Investigations Report 99-4019
In cooperation with theU.S. GEOLOGICAL SURVEY U.S. FISH AND WILDLIFE SERVICE BUREAU OF RECLAMATION BUREAU OF INDIAN AFFAIRS

U.S. Department of the Interior
BRUCE BABBITT, Secretary
U.S. Geological Survey
Charles G. Groat, Director
Any use of trade, product, or firm name in this publication is for descriptive purposes only and does not imply endorsement by the U.S. Government
Helena, Montana May 1999
For additional information write to:
District Chief U.S. Geological Survey 3162 Bozeman Avenue Helena, MT 59601-6456
Copies of this report may be purchased from:
U.S. Geological Survey Branch of Information Services Box 25286 Denver, CO 80225-0286
CONTENTSPage
Abstract..............................................................................................................................................................................^ 1Introduction......................................................^ 2
Purpose and scope...................................................................................................................................................... 3Selenium chemistry and movement........................................................................................................................... 3Reference concentrations used for risk assessment................................................................................................... 8Acknowledgments...................................................................................................................................................... 8
Description of study area....................................................................................................................................................... 11Geologic setting......................................................................................................................................................... 11Hydrologic setting...................................................................................................................................................... 11Biologic setting.......................................................................................................................................................... 13Irrigation history........................................................................................................................................................ 13
Selenium in areas underlain by glacial-lake deposits............................................................................................................ 14Soils and underlying deposits .................................................................................................................................... 14
Selenium distribution...................................................................................................................................... 14Possible selenium source................................................................................................................................ 15
Soil moisture and ground water................................................................................................................................. 18Selenium distribution...................................................................................................................................... 18Water chemistry and evapoconcentration....................................................................................................... 18Selenium mobilization.................................................................................................................................... 23
Irrigation drainage...................................................................................................................................................... 24Drainage from Greenfields Bench.................................................................................................................. 24Drainage from glacial-lake deposits............................................................................................................... 24
Relation between selenium concentration and specific conductance................................................. 27Relation between selenium concentration and water discharge.............:............................................ 27
Selenium loads from source area............................................................................................................................... 28Selenium in wetlands ............................................................................................................................................................ 31
Surface water.............................................................................................................................................................. 32Bottom sediment........................................................................................................................................................ 33
Selenium rn biota..................................................................... 36Selenium distribution...........................................................................................,..._^ 37
Aquatic plants................................................................................................................................................. 37Aquatic invertebrates...................................................................................................................................... 38Fish................................................................................................................._^ 40Water-bird eggs.............................................................................................................................................. 41
Bioaccumulation ................................................... ..........^.................................. ...................................................... 41Toxicity risks.............................................................................................................................................................. 41
Effects of irrigation practices on selenium mobilization and accumulation......................................................................... 46Summary and conclusions............................................................................................................................................ 47References cited...............................................................................................................................................................^ 49
ILLUSTRATIONS
Figures 1. Map showing Sun River Irrigation Project and surrounding areas in west-central Montana........................... 42. Map showing irrigation practices on land underlain by glacial-lake deposits and locations of soil,
drill-core, soil-moisture, ground-water, surface-water, bottom-sediment, and biological samplingsites in the southern Freezeout Lake area, Montana...................................................................................... 6
3. Conceptual diagram of processes affecting selenium mobilization from irrigated glacial-lake deposits and accumulation in wetlands and biota of the Freezout Lake Wildlife Management Area,Montana....................................................................._^ 9
CONTENTS iii

ILLUSTRATIONS-Continued
Page Figure 4. Hydrographs of test wells completed in glacial-lake deposits east and south of Freezout Lake Wildlife
Management Area, Montana......................................................................................................................... 125-12. Graphs showing:
5. Selenium and sulfate concentations in glacial-lake deposits and weathered shale nearFreezeout Lake, Montana............................................................................................................ 16
6. Relations of selenium concentration to major-ion concentrations in soil moisture, groundwater, and irrigation drainage near Freezeout Lake, Montana................................................... 19
7. Relations of major-ion concentrations in soil moisture, ground water, and irrigationdrainage from glacial-lake deposits near Freezeout Lake, Montana .......................................... 22
8. Seasonal variation of dissolved-selenium concentration in irrigation drainage fromland underlain by glacial-lake deposits in the Freezeout Lake area, Montana........................... 26
9. Relations of specific conductance to dissolved-selenium concentration in irrigation drainage from land underlain by glacial-lake deposits in the Freezeout Lake area, Montana...................................................................................................................................... 28
10. Relations of water discharge to dissolved-selenium concentration in irrigation drainagefrom land underlain by glacial-lake deposits in the Freezeout Lake area, Montana.................. 29
11. Seasonal variation of selenium loads in irrigation drainage from land underlain byglacial-lake deposits in the Freezeout Lake area, Montana........................................................ 32
12. Map showing selenium concentrations in surficial bottom sediment in August 1995 and ranges of dissolved-selenium concentrations in surface water in 1990-95 in Freezeout Lake, Pond 5, and tributary irrigation drains in the southern Freezeout Lake area, Montana............................................. 34
13. Graph showing statistical distribution of selenium concentrations in surficial bottom sediment from thesouthern Freezeout Lake area, Montana, 1995 ............................................................................................. 36
14. Graph showing statistical distribution of selenium concentrations in water, bottom-sediment, andbiological samples from the southern Freezeout Lake area, Montana.......................................................... 42
15. Map showing biological sampling sites where geometric mean selenium concentration in at leastone species exceeded the concentration threshold for biological impairment in the southern FreezeoutLake area, Montana....................................................................................................................................... 44
TABLES
Table 1. Selenium concentrations in food sources, animal tissue, sediment, and water related to backgroundlevels and thresholds for potential biological impairment ........................................................................... 10
2. Chemical characteristics of soil moisture and glacial-lake deposits near Freezeout Lake, Montana............... 203. Characteristics of ground water in glacial-lake deposits near Freezeout Lake, Montana................................ 204. Means, medians, and ranges of selenium concentrations in surface-water and bottom-sediment samples
collected from the southern Freezeout Lake area, Montana, 1986-95.......................................................... 255. Chemical characteristics of irrigation drainage from glacial-lake deposits near Freezeout
Lake, Montana.............................................................................................................................................. 256. Correlation analyses of specific conductance and discharge with dissolved-selenium concentration
for irrigation drainage from glacial-lake deposits near Freezeout Lake, Montana....................................... 277. Estimated annual discharge from irrigated glacial-lake deposits to Freezout Lake Wildlife
Management Area, Montana, 1993-95 ........................................................................................................ 308. Estimated seasonal selenium loads from land underlain by glacial-lake deposits to
Freezout Lake Wildlife Management Area, Montana, 1993-95................................................................... 319. Geometric mean selenium concentrations in biological samples collected from the southern
Freezeout Lake area, Montana, 1987-95....................................................................................................... 38
Detailed study of selenium in glacial-lake deposits, wetlands, and biota associated with irrigation drainage in the southern Freezeout Lake area, west-central Montana, 1994-95

CONVERSION FACTORS, VERTICAL DATUM, AND ABBREVIATED WATER-QUALITY UNITS
Multiply By To obtain
acre acre-foot (acre-ft)
cubic foot per second (ft3/s)foot (ft)
inch (in.)mile
pound (Ib) pound per acre (Ib/acre)
pound per cubic inch square mile (mi2)
4,0471,233
0.0283170.30482.541.609
453.61.121
27.682.59
square meter cubic metercubic meter per secondmetercentimeterkilometergramkilogram per hectaregram per cubic centimeter (g/cm3 ) square kilometer
Specific conductance of water is a measure of the ability of water and dissolved constituents to conduct an electrical current and is an indication of the ionic strength of the solution. Specific conductance is expressed in microsiemens per centimeter at 25 degrees Celsius
and increases with the concentration of dissolved constituents.
Abbreviated units and symbols used in this report:
ug/g microgram per gramug/L microgram per literI^S/cm microsiemen per centimeter at 25 degrees Celsiusmg/L milligram per liter< less than minimum reporting level
Abbreviations and acronyms used in this report:
BIA Bureau of Indian Affairs, U.S. Department of the InteriorBOR Bureau of Reclamation, U.S. Department of the InteriorDOI U.S. Department of the InteriorMFWP Montana Fish, Wildlife and ParksNIWQP National Irrigation Water Quality Programsp. (spp.) species (species, plural)USFWS U.S. Fish and Wildlife ServiceUSGS U.S. Geological SurveyWMA Wildlife Management Area
CONTENTS


DETAILED STUDY OF SELENIUM IN GLACIAL-LAKE DEPOSITS, WETLANDS, AND BIOTA ASSOCIATED WITH IRRIGATION DRAINAGE IN THE SOUTHERN FREEZEOUT LAKE AREA, WEST-CENTRAL MONTANA, 1994-95
By Eloise Kendy and David A. Nimick, U.S. Geological Survey, and John C. Malloy and Bill Olsen, U.S. Fish and Wildlife Service
Abstract
Freezout Lake Wildlife Management Area (WMA) receives drainage from adjacent irrigated land. Results of a 1986 reconnaissance study and a 1990-92 detailed study indicated that some selenium concentra tions in water, bottom sediment, and biota in Freezout Lake WMA wetlands were higher than established cri teria and standards, raising concerns about potential toxicity to aquatic organisms and water birds. In 1994- 95, a second detailed study was conducted to determine the distribution, mobilization, and accumulation of selenium associated with irrigation drainage from land underlain by glacial-lake deposits in the southern part of the Freezout Lake WMA. Interpretations presented in this report are based on data obtained in 1986-95 from 25 soil or drill-core sites, 8 ground-water sites, 5 soil-moisture sites, 30 surface-water sites, 35 bottom- sediment sites, and 21 biological sites in a 20 square- mile area in and near the southern part of the WMA.
Freezout Lake WMA is bordered on the south and east by seleniferous glacial-lake deposits. Precipi tation and selenium-free irrigation water infiltrate the deposits and dissolve and mobilize selenium. Sele nium-rich ground water then discharges into open irri gation drains. The irrigation drains discharge into wetlands of Freezeout Lake and Pond 5 in Freezout Lake WMA. In the wetlands, selenium is removed from water and accumulates in bottom sediment and biota.
Sparingly soluble selenium-enriched gypsum that formed prior to irrigation probably constitutes a slowly diminishing reservoir of selenium in the glacial- lake deposits. As selenium-free irrigation water perco lates through soil, it dissolves this naturally occurring
selenium. Selenium concentrations in soil moisture and shallow ground water are further increased by evapoconcentration. Maximum concentrations were 1,100 micrograms per liter (ug/L) in soil moisture and 190 |ng/L in ground water.
Selenium in irrigation drainage is derived prima rily from ground-water discharge. The acute-toxicity criterion for aquatic life of 20 jug/L was exceeded in water from all four sampled drains that convey water primarily from glacial-lake deposits; the highest mea sured concentration was 180 iiig/L. During the irriga tion season, selenium concentrations in irrigation drainage were lower than during the non-irrigation sea son because of dilution from increased flow caused by irrigation. Selenium loads in irrigation drains were highest during the beginning of the irrigation season.
Irrigation drainage discharges into wetlands in Freezout Lake WMA. The average annual load of sele nium from irrigated glacial-lake deposits to Freezout Lake WMA wetlands is about 200 pounds, or about 0.06-0.08 pound per acre of irrigated land.
Selenium that discharges from irrigation drains to Freezout Lake WMA wetlands is converted rapidly by biogeochemical processes from soluble, oxidized selenate to insoluble, reduced selenium species, which accumulate in the reduced, organic-rich bottom sedi ment. Consequently, selenium concentrations are low in lake water (less than 3 fig/L), except in small areas near the mouths of drains. Selenium concentrations are high in bottom sediment (maximum of 13 micrograms per gram) and decrease with distance from the mouths of drains.
Biota samples typically had higher selenium con centrations than national average background concen-
Abstract 1
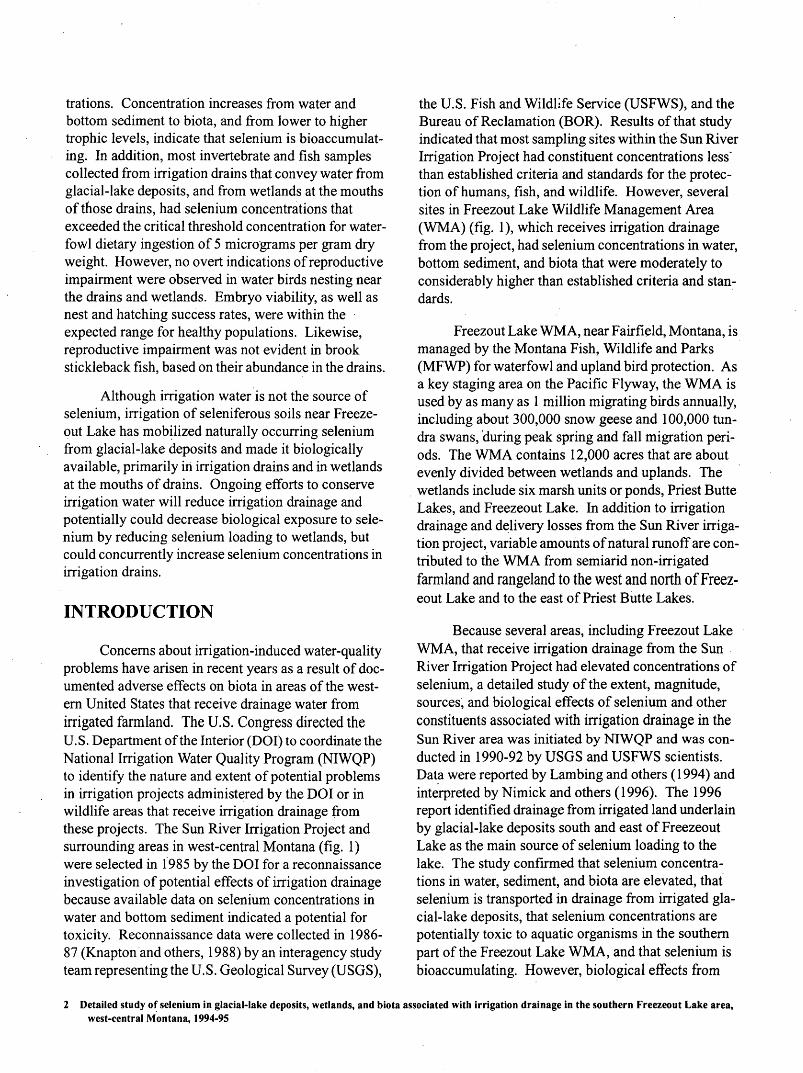
trations. Concentration increases from water and bottom sediment to biota, and from lower to higher trophic levels, indicate that selenium is bioaccumulat- ing. In addition, most invertebrate and fish samples collected from irrigation drains that convey water from glacial-lake deposits, and from wetlands at the mouths of those drains, had selenium concentrations that exceeded the critical threshold concentration for water fowl dietary ingestion of 5 micrograms per gram dry weight. However, no overt indications of reproductive impairment were observed in water birds nesting near the drains and wetlands. Embryo viability, as well as nest and hatching success rates, were within the expected range for healthy populations. Likewise, reproductive impairment was not evident in brook stickleback fish, based on their abundance in the drains.
Although irrigation water is not the source of selenium, irrigation of seleniferous soils near Freeze- out Lake has mobilized naturally occurring selenium from glacial-lake deposits and made it biologically available, primarily iri irrigation drains and in wetlands at the mouths of drains. Ongoing efforts to conserve irrigation water will reduce irrigation drainage and potentially could decrease biological exposure to sele nium by reducing selenium loading to wetlands, but could concurrently increase selenium concentrations in irrigation drains.
INTRODUCTION
Concerns about irrigation-induced water-quality problems have arisen in recent years as a result of doc umented adverse effects on biota in areas of the west ern United States that receive drainage water from irrigated farmland. The U.S. Congress directed the U.S. Department of the Interior (DOI) to coordinate the National Irrigation Water Quality Program (NIWQP) to identify the nature and extent of potential problems in irrigation projects administered by the DOI or in wildlife areas that receive irrigation drainage from these projects. The Sun River Irrigation Project and surrounding areas in west-central Montana (fig. 1) were selected in 1985 by the DOI for a reconnaissance investigation of potential effects of irrigation drainage because available data on selenium concentrations in water and bottom sediment indicated a potential for toxicity. Reconnaissance data were collected in 1986- 87 (Knapton and others, 1988) by an interagency study team representing the U.S. Geological Survey (USGS),
the U.S. Fish and Wildlife Service (USFWS), and the Bureau of Reclamation (BOR). Results of that study indicated that most sampling sites within the Sun River Irrigation Project had constituent concentrations less" than established criteria and standards for the protec tion of humans, fish, and wildlife. However, several sites in Freezout Lake Wildlife Management Area (WMA) (fig. 1), which receives irrigation drainage from the project, had selenium concentrations in water, bottom sediment, and biota that were moderately to considerably higher than established criteria and stan dards.
Freezout Lake WMA, near Fairfield, Montana, is managed by the Montana Fish, Wildlife and Parks (MFWP) for waterfowl and upland bird protection. As a key staging area on the Pacific Flyway, the WMA is used by as many as 1 million migrating birds annually, including about 300,000 snow geese and 100,000 tun dra swans, during peak spring and fall migration peri ods. The WMA contains 12,000 acres that are about evenly divided between wetlands and uplands. The wetlands include six marsh units or ponds, Priest Butte Lakes, and Freezeout Lake. In addition to irrigation drainage and delivery losses from the Sun River irriga tion project, variable amounts of natural runoff are con tributed to the WMA from semiarid non-irrigated farmland and rangeland to the west and north of Freez eout Lake and to the east of Priest Butte Lakes.
Because several areas, including Freezout Lake WMA, that receive irrigation drainage from the Sun River Irrigation Project had elevated concentrations of selenium, a detailed study of the extent, magnitude, sources, and biological effects of selenium and other constituents associated with irrigation drainage in the Sun River area was initiated by NIWQP and was con ducted in 1990-92 by USGS and USFWS scientists. Data were reported by Lambing and others (1994) and interpreted by Nimick and others (1996). The 1996 report identified drainage from irrigated land underlain by glacial-lake deposits south and east of Freezeout Lake as the main source of selenium loading to the lake. The study confirmed that selenium concentra tions in water, sediment, and biota are elevated, that selenium is transported in drainage from irrigated gla cial-lake deposits, that selenium concentrations are potentially toxic to aquatic organisms in the southern part of the Freezout Lake WMA, and that selenium is bioaccumulating. However, biological effects from
2 Detailed study of selenium in glacial-lake deposits, wetlands, and biota associated with irrigation drainage in the southern Freezeout Lake area, west-central Montana, 1994-95

selenium were not evident on the basis of hatching suc cess and nesting success.
Statistically valid inferences about the variability of selenium concentrations in water, bottom sediment, and fish in the Freezout Lake WMA were limited by small sample size during the 1990-92 study (Nimick and others, 1996). Moreover, the geochemical pro cesses of selenium mobilization and transport to the WMA were not specifically investigated. Therefore, in 1994, the NIWQP initiated a second detailed study that focused on the smaller (approximately 20 mi2), more specific area of concern identified in 1990-92 (fig. 2). Additional data were collected in 1994-95 to provide a basis to better understand (1) selenium distribution, mobilization processes, and transport rates from irri gated land underlain by glacial-lake deposits that drain to wetlands of Pond 5 and the southern part of Freeze- out Lake, and (2) selenium distribution, toxicity risks, and accumulation in the wetlands and biota.
Purpose and Scope
The purpose of this report is to describe and interpret (1) the distribution of selenium in water of glacial-lake deposits south and east of Freezout Lake WMA and the mobilization of that selenium by irriga tion drainage, and (2) the subsequent accumulation of selenium in wetlands and biota within the southern part of the WMA. During this study, physical, chemical, and biological data were collected to describe and ana lyze:
1. The spatial variability of selenium concentra tions in soil moisture and ground water in glacial-lake deposits; the relations between geology, soils, water quality, and geochemical conditions that control sele nium mobilization and transport; and the effects of irri gation on selenium mobilization.
2. The spatial and seasonal variability of sele nium concentrations in irrigation drainage derived principally from glacial-lake deposits, and the quantity of selenium transported annually to wetlands in the southern part of the Freezout Lake WMA under various hydrologic conditions.
3. The spatial distribution of selenium in wetland water and bottom sediment in the southern part of the Freezout Lake WMA, the processes controlling the
spatial distribution, and the estimated mass of selenium that has accumulated in bottom sediment.
4. The spatial and seasonal variability of sele nium concentrations in several trophic levels of wet land biota; the relation between selenium concentrations in biota, ambient exposure levels, and food-chain bioaccumulation; and the biological risk associated with exposure to selenium in surface water, bottom sediment, and dietary items in wetlands of the southern part of the Freezout Lake WMA.
Data collected in 1986-95 from sites shown in figure 2 were used for the study. Information was obtained from 25 soil or drill-core sites, 5 soil-moisture sites, 8 ground-water sites, 30 surface-water sites, 35 bottom-sediment sites, and 21 biological sites at fre quencies ranging from one-time visits to monthly mon itoring. Data-collection schedules were determined principally by hydrologic conditions related to irriga tion and natural runoff, seasonal variations in biologi cal productivity, and life-cycle stages of resident and migratory biota. Data and collection methods are reported in Knapton and others (1988), Lambing and others (1994), and Kendy and Olsen (1997). This study represents a collaborative effort by scientists from the USGS and the USFWS. Funding was provided to NIWQP by the USGS, the USFWS, the BOR, and the Bureau of Indian Affairs (BIA).
Selenium Chemistry and Movement
Selenium is a trace element that is widely distrib uted in aquatic and terrestrial systems. Many organ isms require small quantities for survival; however, excessive amounts of selenium can be toxic. Selenium chemistry is complex because selenium occurs in sev eral inorganic and organic forms, and many physical and biological processes affect its concentration, mobility, and distribution (McNeal and Balistrieri, 1989).
Selenate (SeO4~2, selenium oxidation state of+6) is the most mobile inorganic selenium species in natu ral water because chemical and physical processes do not greatly limit its solubility. Selenate generally is dissolved and occurs in oxidizing environments, such as well-aerated streams, where it adsorbs weakly to particles. Therefore, most selenium transported in
INTRODUCTION
47°45
47°30
Base modified from Bureau of Reclamation, 1973
S-1 EXPLANATION
O IRRIGATION-SUPPLY SAMPLING SITE AND NUMBER
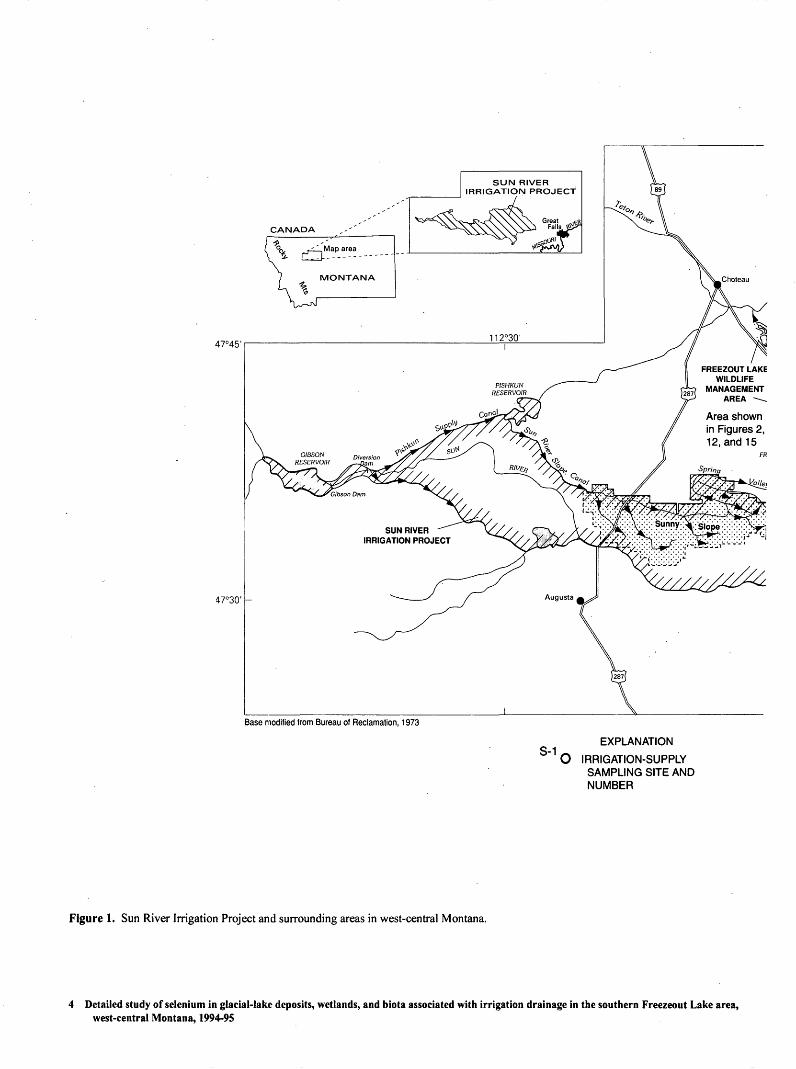
Figure 1. Sun River Irrigation Project and surrounding areas in west-central Montana.
4 Detailed study of selenium in glacial-lake deposits, wetlands, and biota associated with irrigation drainage in the southern Freezeout Lake area, west-central Montana, 1994-95

CHOUTEAU CO
TETON CO
GREENFIELDS IRRIGATION
uy DIVISIONGreenfields Bench
BENTONLAKE NATIONAL WILDLIFE REFUGE
CASCADE CO
FORT SHAW IRRIGATION DIVISION!
0 5 10 MILESI I I I i ill i i iI I I I I I \ I I I I0 5 10 KILOMETERS
INTRODUCTION 5

R.4W. II2°02'30" R.3W.
47°40'
T. 22 N.
47°37'30" -
'AX* x i v' ̂ ' v '*'Y *'N ' v * ^^iiiiKq ; v' v cT/ -^c -^ ̂ A'tJ^^Lif: V' V ' / f *«.< *// V '^iiiP?r» % / ^S-51;. xfVxffix; x jyX^ Vv-lr " ;%'f x^ "V '^^T1^ 'v ;e-32,v v ; v i^;A
v/v' v' I cr. v.'. v.^/. s-52r/ - x^r-4i/ *. v. - vA y^y: yi: -
Base modified from U.S. Geological Survey Cliev, 1983; Fairfield, 1983; Freezeout Lake, 1987; and Lowry, 1987,1:24,000
0.5 I
I I 0.5 1 KILOMETER
1MILEJ
Figure 2. Irrigation practices on land underlain by glacial-lake deposits and locations of soil, drill-core, soil-moisture, ground-water, surface- water, bottom-sediment, and biological sampling sites in the southern Freezeout Lake area, Montana. Irrigation practices in 1995 from Russ E. Barrett, (Greenfields Irrigation Division, written commun., 1996). Study area includes all glaciaWake deposits and wetlands shown on map.
6 Detailed study of selenium in glacial-lake deposits, wetlands, and biota associated with irrigation drainage in the southern Freezeout Lake area, west-central Montana, 1994-95

EXPLANATION FOR FIGURE 2
IRRIGATION PRACTICE IN 1995 ON LAND UNDERLAIN BY QUATERNARY GLACIAL-LAKE DEPOSITS
UNIRRIGATED
SPRINKLER IRRIGATED
FLOOD IRRIGATED
////// MARGIN OF GLACIAL-LAKE DEPOSITS ADJACENT TO FREEZEOUT LAKE
^ CANAL SHOWING DIRECTION OF FLOW
_ _ < _ _ _ IRRIGATION DRAIN SHOWING DIRECTION OF FLOW
S-74 SITE NUMBER--B, Biota; L, Soil, drill core, and soil moisture; S, Surface waterand bottom sediment; and W, Ground water. Note: Sites 17 and 19, as originally named by Knapton and others (1988, p. 20), have no prefixes
SAMPLING SITE
Cf SOIL OR DRILL CORE
9 SOIL MOISTURE
b GROUND WATER
A SURFACE WATER
A1 BOTTOM SEDIMENT
BIOTA
streams is dissolved selenate. Where conditions are oxidizing, selenium also is easily leached from soil and aquifer materials. Other inorganic selenium species are less soluble and, therefore, less mobile. Ground water under reducing conditions normally does not contain dissolved selenium (Long and others, 1990; Weres and others, .1990).
f\
Selenite (SeC>3 , selenium oxidation state of +4), elemental selenium (Se°, selenium oxidation state of 0), and selenide (Se~2 , selenium oxidation state of -2) are progressively more reduced forms of selenium. If selenate is reduced to one of these forms, selenium is removed almost completely from solution and is incor porated into particulate inorganic or organic phases. Much of the removal is through biological processes such as algal uptake (McNeal and Balistrieri, 1989).
Habitats that tend to accumulate the most sele nium are shallow-water areas of standing or slow- moving water with low flushing rates (Lemly and Smith, 1987). Dissolved selenium can be removed
from lake water and stored in sediment. Seventy-five percent of all the selenium in an aquatic system may be in the upper few inches of bottom sediment, and most of the selenium in sediment is associated with organic matter (Weres and others, 1989; Tokunaga and others, 1991).
Selenium can be removed from shallow wetlands by several processes. Selenium can be flushed from lakes by movement of water and suspended sediment through lake outlets. Formation of volatile selenium compounds and subsequent release to the atmosphere also can remove selenium from aquatic systems. If sedimentation rates are high, selenium can be buried deeply and effectively removed from the surficial, active biogeochemical zone of the aquatic system. Although evaporation can concentrate dissolved sele nium in lake water, removal processes generally are more active and selenium concentrations in lake water typically tend to decrease rather than increase relative
INTRODUCTION

to concentrations in inflow water (Lemly and Smith, 1987; White and others, 1991).
Biota can be exposed to selenium through water, sediment, or food. Although anaerobic sediments are a sink for selenium in aquatic ecosystems, selenium con tinually cycles from surficial sediment to water and biota and back into the sediment. Even where selenium concentrations in water are very low, biota can con tinue to be exposed to selenium accumulated in bottom sediments. Bioaccumulation of selenium in aquatic systems can cause selenium concentrations in aquatic organisms to be significantly higher than concentra tions in sediment. Selenium toxicity to fish and wild life typically occurs through ingestion of lower trophic level organisms that have bioaccumulated selenium. Bioaccumulation may occur easily because selenium is an essential micfonutrient and is chemically similar to sulfur (Lemly and Smith, 1987; Ohlendorf and others, 1993).
An overview of these hydrologic, geochemical, and biological processes affecting selenium mobiliza tion from irrigated areas and accumulation in wetlands and biota in the Freezeout Lake area is shown in figure 3: (1) Precipitation and selenium-free irrigation water infiltrate through seleniferous glacial-lake deposits. (2) Selenium dissolves from glacial-lake deposits and evapoconcentrates in soil and along flow paths of shal low ground water, enriching the oxidized ground water with dissolved selenium. (3) Seleniferous ground water discharges to open irrigation drains, where biota are exposed to high concentrations of selenium in water and sediment. (4) Bioaccumulation results from sele nium transfer through trophic levels, particularly in irrigation drains that convey water from glacial-lake deposits and in wetlands at the mouths of those drains. (5) Drain water discharges to wetlands, where selenate is reduced to insoluble selenium species, which accu mulate in wetland bottom sediments. If sediment burial rates exceed the rates of biological uptake, then some selenium may become chemically immobilized in lake-bottom sediment.
reference concentrations could indicate potential risk to aquatic organisms either by direct ingestion or by ambient exposure. Concentrations in water are not compared to drinking-water regulations because water investigated in this study is not used for human con sumption. Environmental risk also is evaluated indi rectly by comparison of selenium concentrations in bottom sediment and biota to local and national back ground concentrations to indicate whether ambient concentrations are elevated relative to natural condi tions.
Aquatic-life criteria for concentrations of selected constituents in water have been established by the Montana Department of Environmental Quality (1995) and the U.S. Environmental Protection Agency (1986) to protect aquatic organisms. Two levels of tox icity are designated by the criteria acute and chronic. Acute toxicity is manifested by widespread death of a large proportion of aquatic organisms within a rela tively short time as a result of rapid and large increases in contaminant concentrations. Chronic toxicity is manifested by suppression of normal biological func tions over a long time as a result of contaminant con centrations that consistently exceed biological thresholds for impairment.
Concentrations of selenium in sediment and in the tissue of organisms that are food sources for fish, water birds, and ducks are compared to available refer ence concentrations for potential toxicity (table 1). In addition, selenium residues in the tissue of fish and water-bird embryos (eggs) are compared to reference concentrations that are indicative of levels at which selenium adversely affects growth, survival, or repro duction. Most of the biological reference concentra tions in table 1 are compiled from the literature and are based on either laboratory toxicity tests conducted under controlled environmental conditions or field studies performed within the Central Valley of Califor nia. Exceedances of these concentrations either in dietary items or in body burden of higher trophic organisms could indicate potential risk.
Reference Concentrations Used for Risk Assessment
In this report, concentrations of selenium in water are compared to criteria established for the pro tection of aquatic life (table 1). Exceedances of these
Acknowledgments
The authors acknowledge with appreciation the many individuals who assisted in the study. Particular thanks for providing historical and land-use informa-
8 Detailed study of selenium in glacial-lake deposits, wetlands, and biota associated with irrigation drainage in the southern Freezeout Lake area, west-central Montana, 1994-95

EX
PLA
NA
TIO
N1.
In
filtr
atio
n \
2.
Dis
solu
tion
and
evap
ocon
cent
ratio
n \
3.
Dis
char
ge4.
B
ioac
cum
ulat
ion
5.
Imm
obili
zatio
n
AC
CU
MU
LAT
ION
MO
BIL
IZA
TIO
N-
I o O nFi
gure
3.
Con
cept
ual d
iagr
am o
f pro
cess
es a
ffec
ting
sele
nium
mob
iliza
tion
from
irrig
ated
gla
cial
-lake
dep
osits
and
acc
umul
atio
n in
wet
land
s an
d bi
ota
of th
e Fr
eezo
ut L
ake
Wild
life
Man
agem
ent A
rea,
Mon
tana
.
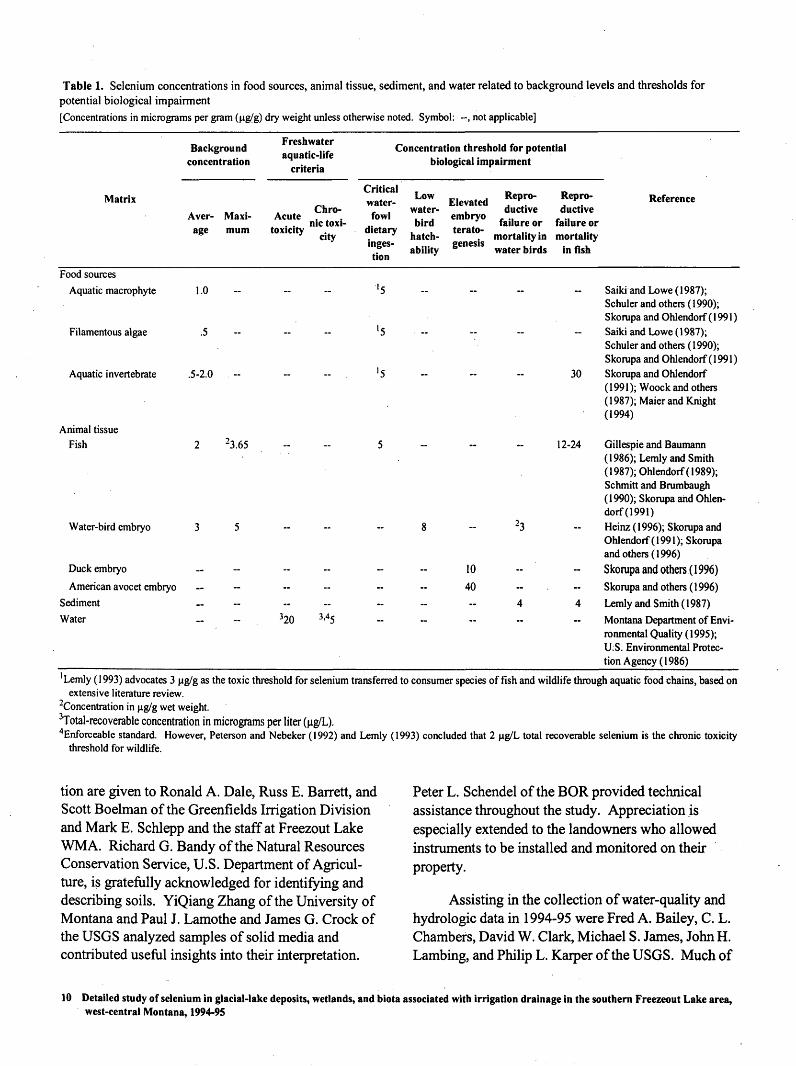
Table 1. Selenium concentrations in food sources, animal tissue, sediment, and water related to background levels and thresholds for potential biological impairment [Concentrations in micrograms per gram (ug/g) dry weight unless otherwise noted. Symbol: --, not applicable]
Background concentration
Matrix
Aver- Maxi- age mum
Freshwater aquatic-life
criteria
Acute toxicity
Chro nic toxi
city
Concentration threshold for potential biological impairment
Critical
fowl dietary inges- tion
Lowwater- bird
hatch- ability
Elevatedembryo terato- genesis
Reproductive
failure or mortality in water birds
Repro- Referenceductive
failure or mortality
in fish
Food sources Aquatic macrophyte 1.0
Filamentous algae .5
Aquatic invertebrate .5-2.0
Animal tissue Fish 23.65
Water-bird embryo
Duck embryo
American avocet embryo Sediment Water
23
10
40
320 3 -45
Saiki and Lowe( 1987); Schuler and others (1990); Skorupa and Ohlendorf (1991) Saiki and Lowe( 1987); Schuler and others (1990); Skorupa and Ohlendorf (1991)
30 Skorupa and Ohlendorf (199 l);Woock and others (1987); Maier and Knight (1994)
12-24 Gillespie and Baumann(1986); Lemly and Smith(1987); Ohlendorf (1989); Schmitt and Brumbaugh (1990); Skorupa and Ohlen- dorf(1991)Heinz (1996); Skorupa and Ohlendorf (1991); Skorupa and others (1996) Skorupa and others (1996)
Skorupa and others (1996) 4 Lemly and Smith (1987)
Montana Department of Envi ronmental Quality (1995); U.S. Environmental Protec tion Agency (1986)
Lemly (1993) advocates 3 ug/g as the toxic threshold for selenium transferred to consumer species of fish and wildlife through aquatic food chains, based onextensive literature review.
"Concentration in ug/g wet weight. 3Total-recoverable concentration in micrograms per liter (fig/L). 4Enforceable standard. However, Peterson and Nebeker (1992) and Lemly (1993) concluded that 2 ug/L total recoverable selenium is the chronic toxicity
threshold for wildlife.
tion are given to Ronald A. Dale, Russ E. Barrett, and Scott Boelman of the Greenfields Irrigation Division and Mark E. Schlepp and the staff at Freezout Lake WMA. Richard G. Bandy of the Natural Resources Conservation Service, U.S. Department of Agricul ture, is gratefully acknowledged for identifying and describing soils. YiQiang Zhang of the University of Montana and Paul J. Lamothe and James G. Crock of the USGS analyzed samples of solid media and contributed useful insights into their interpretation.
Peter L. Schendel of the BOR provided technical assistance throughout the study. Appreciation is especially extended to the landowners who allowed instruments to be installed and monitored on their property.
Assisting in the collection of water-quality and hydrologic data in 1994-95 were Fred A. Bailey, C. L. Chambers, David W. Clark, Michael S. James, John H. Lambing, and Philip L. Karper of the USGS. Much of
10 Detailed study of selenium in glacial-lake deposits, wetlands, and biota associated with irrigation drainage in the southern Freezeout Lake area, west-central Montana, 1994-95

the biological data were collected by Shannon B. Heath, Melinda L. Meade, and Fern K. Thompson of the USFWS, and Kristi L. DuBois and Quentin J. Kujula of the MFWP. John H. Lambing of the USGS and Donald U. Palawski of the USFWS provided sub stantial guidance and assistance in collecting, report ing, and interpreting data.
DESCRIPTION OF STUDY AREA
Irrigation drainage that flows to Freezout Lake WMA discharges from two different systems: terrace gravel underlying the Greenfields Bench and Quater nary glacial-lake deposits between the Greenfields Bench and Freezeout Lake. Nimick and others (1996) determined that irrigation drainage from the gravel aquifer underlying the Greenfields Bench contributes significantly less selenium to the WMA than does drainage from the glacial-lake deposits. Therefore, this study focused on the irrigated area between the Green- fields Bench and the WMA (fig. 2).
Geologic Setting
The geology of the study area is characterized by gently dipping sedimentary bedrock overlain by uncon- solidated Quaternary glacial-lake deposits (Mudge and others, 1983; Nimick and others, 1996, fig. 3). Bed rock consists of the seleniferous Cretaceous Colorado Group in the east and relatively non-seleniferous Upper Cretaceous Montana Group in the west. The contact between the two bedrock units in the study area is bur ied beneath about 10-40 ft of Quaternary glacial-lake deposits. The glacial-lake deposits are seleniferous where they contain detritus of the Colorado Group.
The Colorado Group is exposed from west-cen tral Montana north to Canada. This flat-lying to gently dipping unit is about 1,500 ft thick and consists prima rily of dark-gray marine shale with some interbedded siltstone, sandstone, and bentonite (Maughan, 1961). The Montana Group, which is exposed west of Freeze- out Lake, consists of marine mudstone, siltstone, and sandstone (Mudge and others, 1983).
The interface between shale of the Colorado Group and the overlying glacial-lake deposits is char acterized by 10-25 ft of weathered shale, commonly interbedded with thin varves of mudstone and very fine sandstone. The weathered shale is fairly dense and
generally oxidized, as evidenced by rust-colored, sandy laminae.
In late Pleistocene time, the continental ice sheet dammed the ancestral Missouri River, forming Glacial Lake Great Falls (Colton and others, 1961). The lake covered the study area. Glacial-lake deposits near Freezeout Lake consist of silt, clay, and some sand. The deposits generally are coarser near the Greenfields Bench, where colluvium derived from the Tertiary(?) or Quaternary terrace gravels that cap the Bench is mixed with the glacial deposits and where wave action selectively sorted the deposits. All glacial-lake depos its presumably contain a large amount of shale detritus eroded by the ice sheet from the widespread exposures of Cretaceous shale surrounding the study area (Nimick and others, 1996).
The dominant soil series in the study area are Kremlin loam, Rothiemay clay loam, Ethridge silty clay loam, and Richey silty clay loam, all derived from glacial-lake deposits. These soils typically are on 0-4 percent slopes and are more than 60 in. thick with a dark-colored surface layer. All are considered to be well drained with slow to moderate permeability. Soils in the Kremlin series are fine-loamy, mixed Aridic Haploborolls; Rothiemay series are fme:loamy, mixed Aridic Calciborolls; Ethridge series are fine, montmo- rillonitic Aridic Argiborolls; and Richey series are fine, montmorillonitic Aridic Haploborolls. Accumulations of gypsum (CaSC>4 2H2O) in fine nests and seams are typical of Ethridge soils. Rothiemay soils, which are calcic, accumulate calcium carbonate (R.G. Bandy, U.S. Department of Agriculture, Natural Resources Conservation Service, written commun., 1995).
Hydrologic Setting
Glacial-lake deposits in the study area are poorly permeable and do not constitute an aquifer in the tradi tional sense of yielding usable quantities of water to wells. Ground water is not used for drinking in the study area because the permeability of the glacial-lake deposits is too low to accommodate most well pumps and because the water is highly mineralized. The one stock well (W-23) that was sampled in 1991 (Lambing and others, 1994) is no longer in use.
Water-level data from well sites W-1, W-2, and W-3 indicate east-to-west ground-water flow in gla-
DESCRIPTION OF STUDY AREA 11

cial-lake deposits, roughly perpendicular to topo graphic contours (Nimick and others, 1996). This general flow pattern is interrupted or modified locally by irrigation drains. Assuming similar flow relations elsewhere, ground water likely flows through glacial- lake deposits from supply canals and irrigated areas toward Freezeout Lake and local drains throughout the study area.
Water levels in test wells completed in glacial- lake deposits in irrigated areas fluctuated seasonally in response to recharge from precipitation and irrigation (fig. 4). Heavy rainfall in May 1995 caused water lev els to rise prior to the start of irrigation, which did not occur in 1991 or 1992. Water levels continued to rise and remained high during peak irrigation from June to August 1995, although water levels temporarily declined somewhat between applications of irrigation water. Water levels generally declined after August
1995 as irrigation recharge drained from the glacial- lake deposits.
All wells (except W-1A) completed in glacial- lake deposits are located near the middle or end of ground-water flow paths. Results of chlorofluorocar- bon (CFC) analyses (Nimick and others, 1996) indicate that ground water probably is younger (about 5 years old, as found at well W-1A) in upgradient areas near the supply canal (GM 47-11, fig. 2) and older (about 15 years old, as found at well W-2A) in the downgradient parts of irrigated areas. Considering the magnitude of seasonal water-level fluctuations (fig. 4), ground water sampled at wells probably is a mixture of water recharged in different years.
Selenium is transported from irrigated areas to Freezout Lake WMA in open irrigation drains. Some selenium may be transported by ground water that dis-
1 1
UJgcr
1UJCD g
L1J UJ
uJ 10
UJ
a:
| 12
14
16
W-1A
H W-2A
W-3A
~0 w-58
O W-59
A W-60
A W-61
00"
d>~ ,
IRRIGATION SEASON
I_____|_____iN D
1994
J
1995
Figure 4. Hydrographs of test wells completed in glacial-lake deposits east and south of Freezout Lake Wildlife Management Area, Montana. All wells are in irrigated areas, except well W-3A. Dashed lines connecting symbols represent assumed water level during time intervals between measurements.
12 Detailed study of selenium in glacial-lake deposits, wetlands, and biota associated with irrigation drainage in the southern Freezeout Lake area, west-central Montana, 1994-95

charges directly to Freezeout Lake and Pond 5, but the quantity probably is minimal because irrigation drains were specifically designed to intercept almost all ground water from irrigated areas.
Irrigation drains discharge water derived from ground water, surface runoff, and direct spills from supply canals. Ground-water discharge to the drains may originate as seepage from supply canals, applied irrigation water, or infiltrated precipitation, and may have entered the ground-water flow system either on the western edge of the Greenfields Bench or on land underlain by glacial-lake deposits. Flow in irrigation drains is highest during the irrigation season; however, ground-water discharge maintains a small amount of flow in most drains throughout the fall, winter, and early spring. Because of irrigation applications and direct spills, flow rates in drains during the irrigation season are not predictable on the basis of weather pat terns, as would be expected for natural streamflow.
Biologic Setting
Freezout Lake WMA supports a diverse assem blage of aquatic and terrestrial plant and animal species typical of low-elevation uplands and wetlands east of the Continental Divide in Montana. The semi-arid upland vegetation consists of native and introduced grasses, forbs, and shrubs (predominantly greasewood, Sarcobatus vermiculatus), but few trees other than those planted as shelter belts exist in the area (Ellig, 1955). A grass and forb mixture was intentionally established on some sites to provide dense nesting cover for migratory birds. Grain fields on privately owned land surrounding the WMA provide food for more than 500,000 migrant ducks and geese in spring and fall (Szafranski, 1992). Submergent aquatic vege tation consists primarily of sago pondweed (Potamoge- ton pectinatus) and water milfoil (Myriophyllum exalbescens). The common emergents are cattails (Typha latifolia), rushes (Carex spp.), and sedges (Scir- pus spp.).
Sport hunting of migratory and upland game birds and wildlife watching are the major human uses of the WMA. At least 8 species of fish, 2 species of amphibians, 2 species of reptiles, and 13 species of mammals are known to occur on the WMA. The bird fauna of Freezout Lake WMA is an outstanding recre ational attraction. At least 155 species of bird have
been observed (Szafranski, 1992). The endangered peregrine falcon (Falco peregrinus anaturn), an obli gate predator of birds, occurs at Freezout Lake WMA, as does the threatened bald eagle (Haliaeetus leuco- cephalus). Other federally listed species that poten tially occur there (Anne Vandehey, U.S. Fish and Wildlife Service, oral commun., 1998) include the endangered whooping crane (Grus americand) and least tern (Sterna antillarum) and the threatened piping plover (Charadrius melodus). The mountain plover (Charadrius montanus), which is a candidate for list ing, occurs on remnant native prairie within 2 miles of the WMA.
Irrigation History
The Sun River Irrigation Project was authorized through the Newlands Reclamation Act of 1902, which encouraged the Federal Government to reclaim unused or under-used land in the West (Fabry, 1994). Irriga tion water is diverted from the Sun River below Gibson Reservoir (fig. 1). The irrigation water is conveyed by canals to about 80,000 acres of irrigated land on several elevated prairie plateaus, the largest of which is the Greenfields Bench. Water deliveries from the Sun River Irrigation Project commenced in 1908 in the Fort Shaw Irrigation Division. Deliveries to the Greenfields Bench in the Greenfields Irrigation Division began in 1921. Prior to irrigation, much of the Greenfields Bench had been dryland farmed.
Irrigation in the low-lying study area west of the Greenfields Bench began in 1927 with the completion of canal GM 47-11 (fig. 2), a lateral extension of the Greenfields Main Canal. The area between the Green- fields Bench and the southern part of what is now the Freezout Lake WMA has been irrigated more or less continuously since the canal was completed. Flood irrigation was used exclusively until about 1990, when conversion to sprinkler irrigation began. By 1995, roughly half the irrigated area was sprinkler irrigated, and the other half flood irrigated (fig. 2). About 3,000 to 6,000 acre-ft of irrigation water are delivered to farms in this area annually. The predominant crops are barley and alfalfa.
MFWP acquired the land around Freezeout Lake in 1946, after it had been homesteaded in 1941 and flood irrigated beginning in 1942. Irrigation decreased after 1946, although a 1966 aerial photograph indicates that some of the area was still flood irrigated. A 1978
DESCRIPTION OF STUDY AREA 13

aerial photograph indicates that all previously irrigated land on the WMA had been converted to dryland farm ing. By 1995, all the homesteads had been abandoned and farming had ceased in the WMA except for less than 100 acres on which MFWP had planted shelter belts.
Soon after irrigation began in the study area, accumulations of excess water became problematic. Decreased productivity in waterlogged fields prompted construction of irrigation drains within the study area and on the Greenfields Bench through most of the 1930's and the early 1940's. Irrigation drains facili tated discharge to Greenfields Lake, the ephemeral pre decessor of Freezeout Lake.
Today, irrigation drainage from farmland and irrigation delivery losses (canal seepage and unused excess supply) are major sources of water for the WMA; both are important supplements to natural flows. Most irrigation drainage and delivery losses enter the WMA through irrigation drains. All but one drain terminate at Pond 5 or Freezeout Lake.
Irrigation-supply water was sampled four times in 1986-95 from the Greenfields Main Canal near Fair- field (site S-l, fig. 1) when flows ranged from 260 to 1,020 ft3/s. The water was a calcium bicarbonate type with dissolved-solids concentrations ranging from 119 to 148 mg/L. All nutrient and trace-element concentra tions were at or below minimum reporting levels and all selenium concentrations were less than the mini mum reporting levels of 1 ^ig/L (Knapton and others, 1988, table 15; Lambing and others, 1994, tables 14 and 15; Kendy and Olsen, 1997, tables 10 and 11). Analyzed constituents in all samples of irrigation-sup ply water met State water-quality standards (Montana Department of Environmental Quality, 1995) for all uses, including human consumption, aquatic life, irri gation, and livestock watering.
SELENIUM IN AREAS UNDERLAIN BY GLACIAL-LAKE DEPOSITS
Glacial-lake deposits between the Greenfields Bench and Freezeout Lake were identified by Nimick and others (1996) as the primary source of the selenium draining to Freezeout Lake. Therefore, field work completed in 1995 focused on clarifying the distribu tion of selenium and the geochemical processes that mobilize selenium from these deposits. Information
was gleaned from solid-phase material, soil moisture, ground water, and irrigation drainage. Sample collec tion, processing, and analytical methods were described by Kendy and Olsen (1997).
Soils and Underlying Deposits
Solid-phase samples were collected from 2 bore holes (W-l and W-3) and 16 soil pits (L-l 1 to L-17, L- 19, and L-22 to L-29) in 1991 (Lambing and others, 1994, table 1) and from 5 boreholes (L-2A and L-58 to L-61) and 2 soil pits (L-41 and L-42) in 1995 (Kendy and Olsen, 1997, table 2). All sites (except W-l and W-3) from which solid-phase samples were collected are identified with the prefix "L" in figure 2. Solid- phase samples from soil pits and boreholes were ana lyzed for selenium and .sulfur species to determine the amount and speciation of selenium and sulfur in soils, glacial-lake deposits, and the weathered shale of the Colorado Group.
Selenium Distribution
The distribution of solid-phase selenium in soil and glacial-lake deposits can be described with data from composite soil samples and from specific-depth samples from soil pits and boreholes. Selenium con centrations in glacial-lake deposits ranged from 0.2 to 5.5 jug/g in soil and drill-core samples (Lambing and others, 1994, tables 6 and 13; Kendy and Olsen, 1997* table 4). The median concentration of selenium for all soils sampled in the study area was 0.5 jig/g. Although the spatial distribution of selenium is heterogeneous, selenium concentrations generally were higher directly east of Freezeout Lake than in the areas east of Pond 5 and south of Freezeout Lake. The additional drill-core data collected in 1995 emphasize the heterogeneity in selenium concentrations and indicate that not all gla cial-lake deposits have selenium concentrations as high as those measured in drill-core samples collected from a limited area (sites W-l and W-3) in 1991.
Because of their large number, the 16 soil sam ples composited from the upper 3 ft in 1991 (Lambing and others, 1994, table 6) provide the most information about the overall spatial distribution of surficial sele nium. Selenium concentrations ranged from 0.1 to 1.6 jiig/g, with a median value of 0.45 jag/g, in these sam ples. Concentrations were similar at irrigated
14 Detailed study of selenium in glacial-lake deposits, wetlands, and biota associated with irrigation drainage in the southern Freezeout Lake area, west-central Montana, 1994-95

(0.2-1.6 |ig/g) and non-irrigated sites (0.1-1.1 ug/g). However, within irrigated areas, samples with the high est concentrations (0.5-1.6 ng/g) generally were col lected east of Freezeout Lake (sites L-l 1, L-12, L-22, and L-23).
Multiple, depth-specific samples from six bore holes and one soil pit describe the deeper vertical dis tribution of selenium in irrigated glacial-lake deposits. As was the case with composite-soil sample data, sele nium concentrations in the four boreholes (W-1, L-2A, L-59, and L-60) and one soil pit (L-23) east of Freeze- out Lake were higher than in boreholes elsewhere (L- 58 and L-61) (fig. 5). Mean selenium concentrations in samples from each of the five sites east of the lake ranged from 0.6 to 3.3 Lig/g; the selenium concentration in at least one sample from each site was higher than 1.0 ng/g. In the two other boreholes, mean concentra tions were lower (0.2 and 0.4 jug/g) and no individual sample from glacial-lake deposits had a selenium con centration higher than 0.5 ug/g.
Selenium concentrations in weathered shale of the Colorado Group generally were higher than in over lying glacial-lake deposits (fig. 5). These higher con centrations could be caused by post-depositional enrichment from selenium mobilized from glacial-lake deposits or could represent differences in original sele nium concentrations in the two geologic units.
Water-extractable selenium concentrations in soil and drill core samples typically were low, gener ally ranging from O.003 to 0.028 u£/g, or less than 8 percent of the total selenium in each sample (Kendy andOlsen, 1997, table 4). The major exception was the middle portion of the glacial-lake deposits at L-59, where three samples at depths of 6.0 to 17.5 ft had extractable-selenium concentrations of 0.13 to 2.6 fig/g, or 26 to 100 percent of the total selenium in each sample (Lambing and others, 1994, table 6). At site L- 23, two of three samples from 0.4 to 4.1 ft had elevated extractable-selenium concentrations (0.16 to 0.17 Lig/g), but these concentrations were only 3 to 5 percent of the total selenium in each sample (Lambing and oth ers, 1994, table 6). Although not a particularly promi nent trend, the maximum extractable-selenium concentrations for each site were higher at sites east of Freezeout Lake than at sites elsewhere in the study area.
The predominant factors affecting the distribu tion of selenium in glacial-lake deposits are not well
known. Selenium concentrations in soil do not appear to correlate with soil series or land use. The large vari ability of selenium concentrations, both laterally and with depth, emphasizes the heterogeneity of the gla cial-lake deposits. The spatial variation may be a func tion of the source area of the glacial-lake deposits. Sediment derived from the non-seleniferous Montana Group west of the lake may have been deposited in the area south of Freezeout Lake, In the northern area, east of Pond 5, glacial-lake deposits are thicker (38 ft at L-58) compared to the other sites (8-19 ft), but how this difference may affect selenium distribution is unknown.
Possible Selenium Source
Sulfate salts such as gypsum could be a source of selenium to soil moisture and ground water; therefore, soil and drill-core samples collected in 1991 and 1995 were analyzed for sulfur species. Sulfate was the dom inant sulfur species in all samples of glacial-lake deposits as well as in the upper part of the underlying weathered shale. Thirteen samples of glacial-lake deposits and the upper part of weathered shale col lected at sites W-l and W-3 in 1991 were analyzed for total sulfur and sulfide-sulfur (Lambing and others, 1994, table 13). In these samples, the difference between total sulfur and sulfide-sulfur concentrations was assumed to represent the sulfate concentration (Nimick and others, 1996). Twenty-nine samples col lected from two soil pits and five boreholes in 1995 were analyzed for sulfate, sulfide, and organic forms of sulfur (Kendy and Olsen, 1997, table 4). Sulfide and organic sulfur were not detected in any sample. Where sulfur was detected, it was sulfate.
Sulfate was detected in glacial-lake deposits and the upper part of weathered shale at all but three sites (fig. 5). The three non-irrigated (L-41, L-42, and W-3) sites had sulfate in every sample (fig. 5), perhaps indi cating a pre-irrigation reservoir of soluble salts that may have been present at all sites. Samples from irri gated sites generally had less sulfate than those from non-irrigated sites. Sulfate was present at three irri gated sites (L-60, L-61, and L-59), but primarily at depths greater than about 4 ft, possibly signifying that the surficial sulfate at these sites was dissolved and removed during deep percolation of irrigation water. At the other three irrigated sites with sulfate data (L-58, W-l, and L-2A), sulfate was absent to depths of about 20-24 ft, possibly owing to considerable flushing by
SELENIUM IN AREAS UNDERLAIN BY GLACIAL-LAKE DEPOSITS IS

TOTAL SELENIUM CONCENTRATION, IN MICROGRAMS PER GRAM
10
12
14
16
18
20
22
24
5)
IRRIGATED (W-1)
GLACIAL- LAKE
DEPOSITS
\ WEATHERED \ SHALE
1 1
I
1
I
-
D
"
.
1
])..
.)'
)
..
.
ij_T
.0
i > i i i i i i i i i i i
IRRIGATED(L-2A)
GLACIAL- -LAKE
^ DEPOSITS -
iiiiiitiiiitiit
iiiiiiii i
iii .i iii
f '/ii
i iii iiiiiii1
*\\*
WEATHEREDSHALE
, , , i , , , , i , , , ,
cV
0.25 0.50 0.75SULFATE CONCENTRATION,
IN PERCENT
3 IRRIGATED J \(L-59) '
.<»>
M
*GLACIAL-
LAKE DEPOSITS
NOT RECENTLYIRRIGATED
(W-3)
*u II
- UII II II
GLACIAL- LAKE
X DEPOSITS
WEATHERED SHALE
, , , i i , , , i , .0 0.25 0.50 0.75
SULFATE CONCENTRA TION, IN PERCENT
0.25 0.50 0.75 1.00 1.25SULFATE CONCENTRATION,
IN PERCENT
1.50
TOTAL SELENIUM CONCENTRATION,IN MICROGRAMS PER GRAM
0123456
0 0.25 0.50 0.75 1.00 1.25 1.50
SULFATE CONCENTRATION, IN PERCENT
QO
IRRIGATED (L-23)
GLACIAL-LAKE. DEPOSITS
Figure 5. Selenium and sulfate concentrations in glacial-lake deposits and weathered shale near Freezeout Lake, Montana. Concentrations refer to dry sample weight. Sulfate concentrations less than the minimum reporting level (<0.05 percent) are plotted as 0.025 percent.
16 Detailed study of selenium in glacial-lake deposits, wetlands, and biota associated with irrigation drainage in the southern Freezeout Lake area, west-central Montana, 1994-95

TOTAL SELENIUM CONCENTRATION, IN MICROGRAMS PER GRAM
456 0123450 u
UJ rr*LU ^
w O o - Z ^
tQl 5
QO
^ 4CO ^ (
o (
2
UJ ..0 4
DCOQ 6ELOW LANI
oo
COh-Ul Ul"- 10zItuj 12Q '*
14
i
1 A16 (
1 1 1 1 I . 1 1 1 I 1 1 1 1 I 1 , 1 1 , 1 , I 1 I 1 1 1 1-
NEVER IRRIGATED
' / (L-41)
ii
- |
1 GLACIAL-LAKE DEPOSITS^fc^>) i i i i i i i i i i i i i i i i i i i i i i > i i
D 0.25 0.50 0.75 1.00 1.25 1.,
SULFATE CONCENTRATION, IN PERCENT
TOTAL SELENIUM CONCENTRATION, IN MICROGRAMS PER GRAM
) 1 2 3 4 5 £T i i i l i i i i l i i i i l i i i i l i i i i l i i i i
~J* IRRIGATED .
^ (L-61)I vxx
' s'
> /1 s ' -\\
- M
I 1, GLACIAL--',' LAKE
«\ DEPOSITS
!!)""""*" WEATHERED" / \ SHALEi \
\ / \ , \
'. \ I \ ' \' \i t
, , , , l , , , , i , , , , l , , , , i , , , , l , , , ,) 0.25 0.50 0.75 1.00 1.25 1.
SULFATE CONCENTRATION, IN PERCENT
u
UlO <
uj Sj 2 "-to~-z
!*Q- > 4
50 QO_iUlCD
o6 (
>
0
2UlO
u. ocDco 4Q
IsUJCO
UlUJ LL r flZ o
tUJQ
10
12C
50
i i i . l i . . . I i . i i I i i i i l i i ,, I i i i .
?
NEVER IRRIGATED
1 (L-42)
f j 1 1
1
3D
GLACIAL-LAKE DEPOSITS, , , , i , , , , i , , , , i , , , , l , , , , i , , , ,
3 0.25 0.50 0.75 1.00 1.25 1.J
SULFATE CONCENTRATION, IN PERCENT
TOTAL SELENIUM CONCENTRATION,IN MICROGRAMS PER GRAM
) 1 2 3 4 5 (i i i i i i i i i l i i i i i i i i i i i i i i l i i i i
IRRIGATED(L-60)
5^
\\̂ "*^\ x^
S *"^^ \ ^>_
\ ^^^^ Q -' GLACIAL- \
/ LAKE \/ DEPOSITS \ i N^ WEATHERED O
SHALE
_ _
. .
, , , , l i , , , i , , , , l , , , , l , , , , l , , , i) 0.25 0.50 0.75 1.00 1.25 1..
SULFATE CONCENTRATION, IN PERCENT
CVDI AMATinM
£.
4
6
508
LU
^ 10 > u.
DC
QZ 3 12
IUJmuj 14Ulu.zIQ- ic UJ IDQ
18
20
50 22
i
94
. . i i I i . i . I i i i i
IRRIGATED9 (L-58) -
|!J 11 111i .T
1
1 1
;»
..
..
T ' ~
!ji 'J |1 1
1 1jiT j
IIT|
i! GLACIAL-^l LAKE£ DEPOSITS
< , , > 1 , , , , 1 , , , i
SULFATE
SELENIUM
0 0.25 0.50 0.75
SULFATE CONCENTRATION,IN PERCENT
Figure 5. Selenium and sulfate concentrations in glacial-lake deposits and weathered shale near Freezeout Lake, Montana. Concentrations refer to dry sample weight. Sulfate concentrations less than the minimum reporting level (<0.05 percent) are plotted as 0.025 percent (Continued).
SELENIUM IN AREAS UNDERLAIN BY GLACIAL-LAKE DEPOSITS 17

deep percolation and ground water. However, the sulfate data indicate that sulfate salts, which could be dissolved in the future, still exist at some irrigated sites. Therefore, assuming selenium is associated with sulfate minerals, a large diminishing reservoir of sparingly soluble salts is a source of selenium in glacial-lake deposits and the potential exists for future selenium mobilization by irrigation.
Soil Moisture and Ground Water
Nimick and others (1996) described ground water in the study area on the basis of three well clus ters (sites W-l, W-2, and W-3) (fig. 2), each consisting of one well completed in glacial-lake deposits and 2 or 3 wells completed in the underlying shale of the Colo rado Group. In 1995, four additional wells (W-58, W- 59, W-60, and W-61) were completed in glacial-lake deposits (fig. 2). Lithologic, well-construction, and water-level data are in Lambing and others (1994, tables 7, 8, 9, and 10) and Kendy and Olsen (1997, tables 3, 7, and 8).
In 1995, suction lysimeters were installed next to well W-2A and next to each monitoring well installed in 1995 to sample soil moisture above the saturated zone. Soil-moisture samples were collected to deter mine if selenium was derived from the unsaturated zone and how major-ion chemistry of irrigation- recharge water changed as it percolated down from land surface. Ground-water samples were collected from the three sites instrumented in 1991 and the four sites instrumented in 1995 to examine the spatial vari ability in selenium and related water-quality constitu ents.
Selenium Distribution
Selenium concentrations in water samples from glacial-lake deposits ranged from 5 to 1,100 ug/L for soil moisture and from < 1 to 190 ^ig/L for ground water (tables 2 and 3). Selenium concentrations were lowest (<1 to 9 |J.g/L) in samples from wells W-58, W-61, and
W-1A and lysimeters L-60 and L-61; selenium concen trations in samples from all other wells and lysimeters exceeded 15 |ig/L. As described below, this pattern of selenium distribution in soil moisture and ground water can be explained by variations in selenium concentra tions in glacial-lake deposits and by geochemical pro cesses related to hydrologic conditions at each sampling site.
Selenium concentrations in many soil-moisture and ground-water samples generally increased with increasing concentrations of chloride, sodium, and sul fate (fig. 6), suggesting that selenium mobilization is related to major-ion chemistry and that evolution of water quality is governed by hydrogeochemical pro cesses that are common throughout the glacial-lake deposits. Therefore, the major-ion chemistry of soil moisture and ground water was examined to help deci pher the process(es) that may be important in mobiliz ing selenium and in controlling selenium concentra tions in water.
Water Chemistry and Evapoconcentration
The major-ion chemistry of soil moisture and ground water in glacial-lake deposits varied greatly, but the wide range in chemistry and the degree of dis- solved-solids enrichment were similar in both types of samples. Dissolved-solids concentrations ranged from 541 to 22,700 mg/L in soil-moisture samples collected in 1995 (table 2) and from 313 to 16,400 mg/L in ground-water samples collected in 1991-92 and 1995 from irrigated sites (table 3). The similar concentra tions in soil moisture and ground water indicate that processes in the unsaturated zone are important in determining chemical characteristics hi ground water.
Chloride, sodium, and sulfate concentrations were used to determine the geochemical enrichment of soil moisture and ground water because those ions can be non-reactive under certain geochemical conditions.
18 Detailed study of selenium in glacial-lake deposits, wetlands, and biota associated with irrigation drainage in the southern Freezeout Lake area, west-central Montana, 1994-95

2,000
1,000
500
200
100
50
20
10
5
2
1
0.5
L-2A
L-58
W-1A
10 100 1,000 10,000
cr 2,00001
li 1,000 crOL 500
200
100
50
20
10
5
2
1
0.5
- W-1A
W-58
20 1( 1,000
L-2A -
L-2A
W-61 pf.61
10,000 30,000
SODIUM CONCENTRATION, IN MILLIGRAMS PER LITER SULFATE CONCENTRATION, IN MILLIGRAMS PER LITER
EXPLANATION
Evapoconcentration line for ground water from well W-1A
TYPE OF SAMPLE
O Irrigation-drain water
Ground water
A Soil moisture
2,000
1,000
500
200
100
50
20
10
5
2
1
0.5
L-2A:
L-2A -
L-61 :
W-1 AW-58
0.5 1 ~10 100 1,000
CHLORIDE CONCENTRATION, IN MILLIGRAMS PER LITER
Figure 6. Relations of selenium concentration to major-ion concentrations in soil moisture, ground water, and irrigation drainage near Freezeout Lake, Montana. Site numbers are indicated for selected samples.
SELENIUM IN AREAS UNDERLAIN BY GLACIAL-LAKE DEPOSITS 19
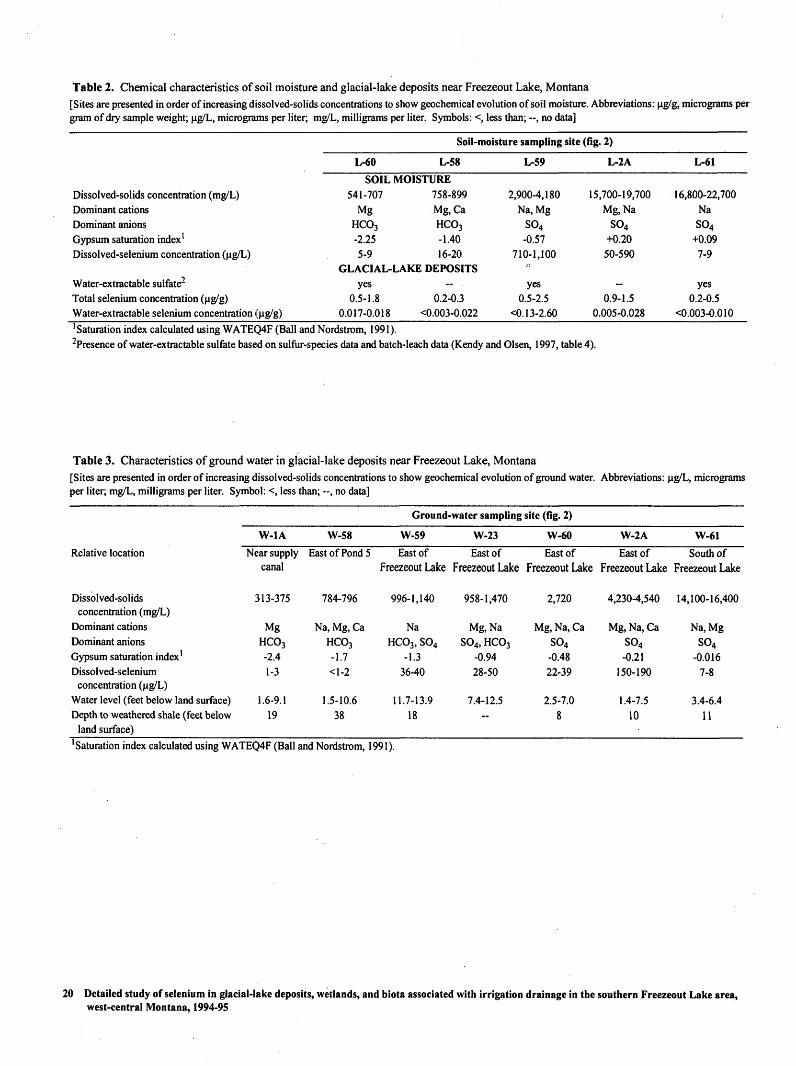
Table 2. Chemical characteristics of soil moisture and glacial-lake deposits near Freezeout Lake, Montana[Sites are presented in order of increasing dissolved-solids concentrations to show geochemical evolution of soil moisture. Abbreviations: ug/g, micrograms pergram of dry sample weight; ug/L, micrograms per liter; mg/L, milligrams per liter. Symbols: <, less than; --, no data]
Soil-moisture sampling site (fig. 2)
L-60 L-58 L-59 L-2A L-61
SOIL MOISTUREDissolved-solids concentration (mg/L)Dominant cationsDominant anionsGypsum saturation index'Dissolved-selenium concentration (ug/L)
541-707Mg
HCO3-2.255-9
758-899Mg, CaHCO3-1.4016-20
2,900-4,180Na, Mg
SO4-0.57
710-1,100
15,700-19,700Mg, Na
S04+0.2050-590
16,800-22,700NaSO4
+0.097-9
GLACIAL-LAKE DEPOSITSWater-extractable sulfate2Total selenium concentration (ug/g)Water-extractable selenium concentration (ug/g)
yes0.5-1.8
0.017-0.018
--
0.2-0.3O.003-0.022
yes0.5-2.5
<0. 13-2.60
-
0.9-1.50.005-0.028
yes0.2-0.5
O.003-0.010'Saturation index calculated using WATEQ4F (Ball and Nordstrom, 1991).2Presence of water-extractable sulfate based on sulfur-species data and batch-leach data (Kendy and Olsen, 1997, table 4).
Table 3. Characteristics of ground water in glacial-lake deposits near Freezeout Lake, Montana[Sites are presented in order of increasing dissolved-solids concentrations to show geochemical evolution of ground water. Abbreviations: ug/L, micrograms per liter; mg/L, milligrams per liter. Symbol: <, less than; , no data]
Ground-water sampling site (fig. 2)
Relative location
W-1A W-58
Near supply East of Pond 5 canal
W-59
East of
W-23
East of
W-60
East of
W-2A
East of
W-61
South ofFreezeout Lake Freezeout Lake Freezeout Lake Freezeout Lake Freezeout Lake
Dissolved-solidsconcentration (mg/L)
Dominant cationsDominant anionsGypsum saturation index 1Dissolved-selenium
concentration (ug/L)Water level (feet below land surface)Depth to weathered shale (feet below
land surface)
313-375
MgHCO3-2.41-3
1.6-9.119
784-796
Na, Mg, CaHCO3-1.7<l-2
1.5-10.638
'Saturation index calculated using WATEQ4F (Ball and Nordstrom,
996-1,140
NaHCO3 , SO4
-1.3
36-40
11.7-13.918
1991).
958-1,470
Mg, NaS04, HC03
-0.9428-50
7.4-12.5-
2,720
Mg, Na, CaS04-0.4822-39
2.5-7.0g
4,230-4,540
Mg, Na, CaSO4-0.21
150-190
1.4-7.510
14,100-16,400
Na, MgS04
-0.0167-8
3.4-6.411
20 Detailed study of selenium in glacial-lake deposits, wetlands, and biota associated with irrigation drainage in the southern Freezeout Lake area, west-central Montana, 1994-95

Chloride generally is non-reactive in most natural waters. Sodium can be non-reactive where ion- exchange reactions involving sodium are not active. Sulfate can be non-reactive in oxidizing environments where gypsum precipitation is not an important control on sulfate concentration. The somewhat linear relation exhibited by concentration ratios between these constituents (fig. 7) implies that each of these constituents is relatively non-reactive in the glacial- lake deposits.
Ratios of the concentrations of chloride, sodium, and sulfate are similar in most samples of soil moisture and ground water, and, therefore, describe a continuum between two extremes, or "end members," as shown in scatterplots in figure 7. One end member is relatively dilute water, which plots on the lower left of the dia grams in figure 7, and the other end member is water with higher concentrations of these ions, which plots on the upper right. The dilute end member has low dis- solved-solids concentrations and is a magnesium bicar bonate type water similar to irrigation water (tables 2 and 3). Typical characteristics of this end member were exhibited by samples from well W-1A and lysim- eter L-60. Ground-water chemistry at well W-1A has been altered only slightly from irrigation water, pre sumably because of the local coarse-grained nature of the deposits and the short flow path between a supply canal and this well (Nimick and others, 1996). Soil moisture from lysimeter L-60 is representative of the dilute end member because irrigation water had been applied shortly before sampling. The other end mem ber of the water-quality continuum has high dissolved- solids concentrations and is a sodium sulfate or sodium-magnesium sulfate type water. Typical char acteristics of this end member were exhibited by sam ples from well W-61 and lysimeters L-2A and L-61. Most other soil-moisture and ground-water samples plot between these end members. Surface-water sam ples from drains also follow the continuum, indicating that the quality of water in drains is controlled by the ground water that discharges to the drains (fig. 7).
One process that could cause the observed dis- solved-solids enrichment implied by the continuum is evapoconcentration. To demonstrate how evapocon- centration would affect water chemistry, an evapocon centration line (shown in each graph of figs. 6 and 7) was constructed by extrapolating the mean concentra tions in the three samples collected from well W-1A to higher concentrations. The assumption was made that
concentrations of chemical constituents would increase in direct proportion to the amount of water lost to evap oration. A 340-fold increase in constituent concentra tions was assumed for the line because this factor was the approximate change in concentrations between the two end members. The coincidence of the evapocon centration line and most of the concentration data in figure 7 indicates that evapoconcentration is a possible explanation for the observed dissolved-solids enrich ment.
Ground-water data tend to plot more closely to the evapoconcentration line than do soil-moisture data, probably because ground-water samples integrate water that has come from relatively large areas of irri gated fields. In contrast, soil moisture has traveled through the small volume of material adjacent to the lysimeter and thus can have more variable chemistry, depending on local geochemical conditions.
The relations between major-ion concentrations, positions along flow paths, and characteristics of sea sonal hydrographs support the hypothesis that evapo concentration is an important process controlling the major-ion chemistry of soil moisture and ground water in irrigated glacial-lake deposits. The degree of evapo concentration likely is a function of the amount of water evapotranspired, which in turn is a function of the depth to ground water. Where the water table is rel atively deep (for example, wells W-58 and W-59), ground-water samples had low dissolved-solids con centrations (784 to 1,140 mg/L, table 3). At these sites, water levels (fig. 4; Lambing and others, 1994, table 9) always were relatively deep in relation to the root zone (well W-59) or were near ground surface only briefly after application of irrigation water (well W-58). Little ground water probably evapotranspires at these sites; therefore, little or no evapoconcentration of dissolved solids in ground water is likely. Dissolved-solids con centrations (14,100 to 22,700 mg/L) in samples from well W-61 (table 3) and lysimeters L-2A and L-61 (table 2) were the highest of all samples from the gla cial-lake deposits, exceeding values in other samples by at least a factor of three. Water levels in well W-61 generally were high and fluctuated less than water lev els in some other wells. This site probably is a ground- water discharge area where water levels are maintained near ground surface throughout the year. Surficial salt crusts that form during dry periods in this area are indicative of ground-water discharge. Maximum evapotranspiration and evapoconcentration would be
SELENIUM IN AREAS UNDERLAIN BY GLACIAL-LAKE DEPOSITS 21

30,000
20,000
10,000
5,000
2,000
1,000
500
200
100
50
20
-L-60 A*
L-58
W-1A
30,000
£ 20,000
10 100 1,000 10,000
SODIUM CONCENTRATION, IN MILLIGRAMS PER LITER
EXPLANATION
Evapoconcentration line for ground water from well W-1A
TYPE OF SAMPLE
O Irrigation-drain water
0 Ground water
A Soil moisture
10,000
5,000
2,000
? 1,000
c 500
200
100
50
200.5
W-61 L-61
L-2A
1 10 100 . 1,000
CHLORIDE CONCENTRATION, IN MILLIGRAMS PER LITER
10,000
5,000
2,000
1,000
500
200
100
50
20
10
W-61 L-61 -
L-2A
| W-1 A A A L-60..p..,
0.5 1 10 100 1,000
CHLORIDE CONCENTRATION, IN MILLIGRAMS PER LITER
Figure 7. Relations of major-ion concentrations in soil moisture, ground water, and irrigation drainage from glacial-lake deposits near Freezeout Lake, Montana. Site numbers are indicated for selected samples.
22 Detailed study of selenium in glacial-lake deposits, wetlands, and biota associated with irrigation drainage in the southern Freezeout Lake area, west-central Montana, 1994-95

expected at this site. Wells such as W-2A and W-60, with hydrographs between the extremes for W-59 and W-61, had intermediate dissolved-solids concen trations (2,720 to 4,540 mg/L).
Selenium Mobilization
The presence of selenium in all but one sample of soil moisture and ground water (tables 2 and 3) com pared to the lack of selenium in irrigation-supply water at site S-1 indicates that the glacial-lake deposits are the likely source of the selenium. Selenium presumably is mobilized from glacial-lake deposits by irrigation water that percolates downward as soil moisture and then flows laterally as ground water.
Redox conditions are important in controlling selenium mobilization and concentrations. Concentra tions of redox-sensitive constituents in ground water indicate that redox conditions in the glacial-lake depos its were uniformly oxidizing. Iron and manganese con centrations were low (<15 jxg/L iron and <58 jug/L manganese); nitrate and dissolved oxygen consistently were present, with concentrations ranging from 0.10 to 11 mg/L nitrate and 1.4 to 6.0 mg/L dissolved oxygen (Lambing and others, 1994, table 11; Kendy and Olsen, 1997, table 6). Selenate, the oxidized species of sele nium, is the only highly soluble and, therefore, mobile form of selenium in soil or aquifer material. If selenate is reduced, selenium is removed almost completely from water. Speciation analyses for samples collected in April 1992 and July 1995 from wells completed in glacial-lake deposits (Lambing and others, 1994, table 12; Kendy and Olsen, 1997, table 6) indicate that virtu ally all the selenium was present as selenate. Selenite concentrations either were below the minimum report ing level or composed less than 5 percent of the total concentration of dissolved selenium. Therefore, sele nium derived from glacial-lake deposits remains dis solved in soil moisture and ground water and does not become immobilized along subsurface flow paths that connect canals and irrigated fields with drains.
Salts that formed prior to irrigation probably are the source of selenium in soil moisture and ground water. Solid-phase data from soil and drill-core sam ples indicate that the glacial-lake deposits contain a large but diminishing reservoir of soluble salts. Gyp sum likely is a major component of this reservoir, because shaley soils typically contribute dissolved sol ids to soil moisture and ground water through dissolu
tion of sparingly soluble gypsum, and because the glacial-lake deposits east of Freezeout Lake are pre sumed to contain a substantial component of shale eroded from the Colorado Group. The association between gypsum and solid-phase selenium is demon strated by a drill-core sample from a depth of 5.5 to 6.5 ft at site W-60 (Kendy and Olsen, 1997, table 4). This sample was primarily gypsum and contained 1.8 jo,g/g selenium, one of the highest concentrations among drill-core samples of glacial-lake deposits.
The importance of gypsum dissolution can be deduced from saturation indices of gypsum (tables 2 and 3). Samples with low dissolved-solids concentra tions were undersaturated with respect to gypsum. As dissolved-solids concentrations increased, the degree of undersaturation decreased; the samples with the highest dissolved-solids concentrations were slightly supersaturated. This pattern suggests, but does not prove, that gypsum dissolution is important in mobiliz ing selenium from glacial-lake deposits to water. Cal cium released by gypsum dissolution probably was removed from solution by precipitation of carbonate minerals (which were oversaturated in all soil-moisture samples) or by ion exchange with sodium.
The relation between selenium and other chemi cal constituents in soil moisture and ground water var ies with location, perhaps indicating that glacial-lake deposits surrounding Freezeout Lake may be derived from different sources. In particular, samples from L- 61, which is located south of Freezeout Lake, did not plot along the evapoconcentration line (fig. 6) that characterizes soil moisture and ground water from east of the lake. Dissolved-solids concentrations for L-61 were the highest (16,800 to 22,700 mg/L) of any soil- moisture sample, yet selenium concentrations were low (7 to 9 |tig/L) (table 2). Likewise, ground water from well W-61 had low selenium concentrations (7 to 8 ug/L), but the highest dissolved-solids concentrations (14,100 to 16,400 mg/L) of any ground-water sample from an irrigated area (table 3). Drill-core samples from L-61 also had relatively low selenium concentra tions. These relations suggest that glacial-lake deposits in this area south of Freezeout Lake are fundamentally different from glacial-lake deposits east of the lake and do not contain substantial selenium. The glacial-lake deposits at site W-61 could be derived from the non- seleniferous drainages to the south and west from which little, if any, selenium is mobilized.
SELENIUM IN AREAS UNDERLAIN BY GLACIAL-LAKE DEPOSITS 23
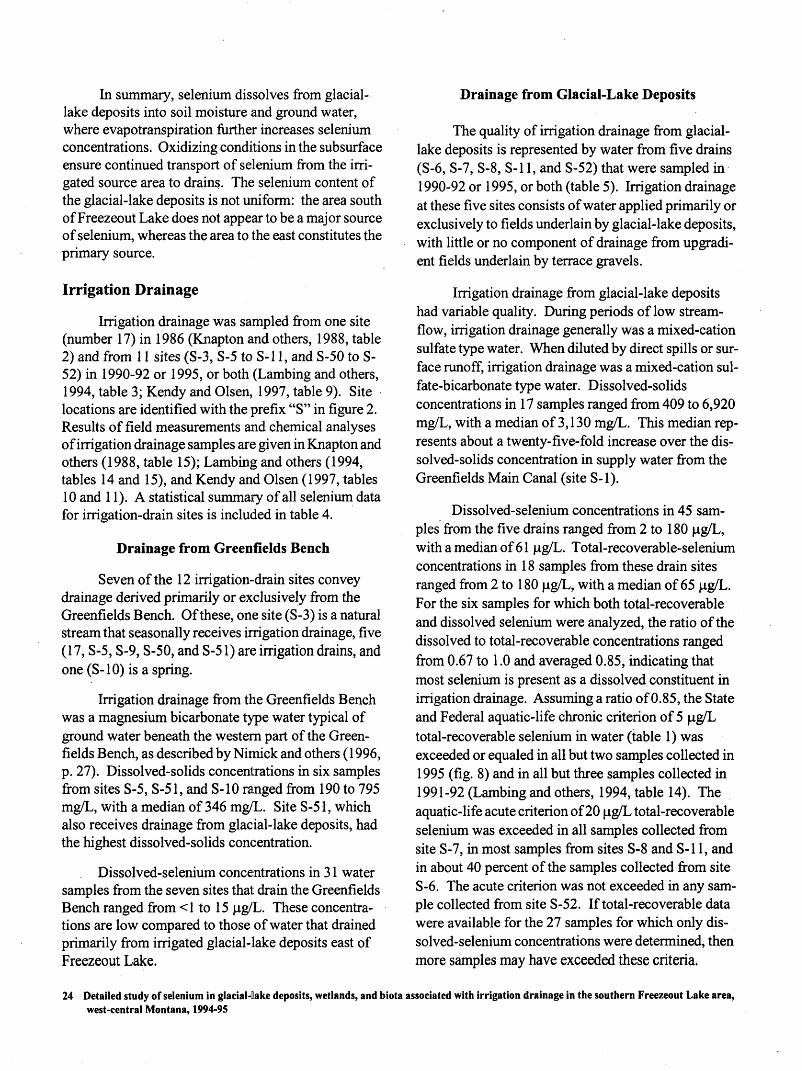
In summary, selenium dissolves from glacial- lake deposits into soil moisture and ground water, where evapotranspiration further increases selenium concentrations. Oxidizing conditions in the subsurface ensure continued transport of selenium from the irri gated source area to drains. The selenium content of the glacial-lake deposits is not uniform: the area south of Freezeout Lake does not appear to be a major source of selenium, whereas the area to the east constitutes the primary source.
Irrigation Drainage
Irrigation drainage was sampled from one site (number 17) in 1986 (Knapton and others, 1988, table 2) and from 11 sites (S-3, S-5 to S-l 1, and S-50 to S- 52) in 1990-92 or 1995, or both (Lambing and others, 1994, table 3; Kendy and Olsen, 1997, table 9). Site locations are identified with the prefix "S" in figure 2. Results of field measurements and chemical analyses of irrigation drainage samples are given in Knapton and others (1988, table 15); Lambing and others (1994, tables 14 and 15), and Kendy and Olsen (1997, tables 10 and 11). A statistical summary of all selenium data for irrigation-drain sites is included in table 4.
Drainage from Greenfields Bench
Seven of the 12 irrigation-drain sites convey drainage derived primarily or exclusively from the Greenfields Bench. Of these, one site (S-3) is a natural stream that seasonally receives irrigation drainage, five (17, S-5, S-9, S-50, and S-51) are irrigation drains, and one (S-10) is a spring.
Irrigation drainage from the Greenfields Bench was a magnesium bicarbonate type water typical of ground water beneath the western part of the Green- fields Bench, as described by Nimick and others (1996, p. 27). Dissolved-solids concentrations in six samples from sites S-5, S-51, and S-10 ranged from 190 to 795 mg/L, with a median of 346 mg/L. Site S-51, which also receives drainage from glacial-lake deposits, had the highest dissolved-solids concentration.
Dissolved-selenium concentrations in 31 water samples from the seven sites that drain the Greenfields Bench ranged from <1 to 15 |^g/L. These concentra tions are low compared to those of water that drained primarily from irrigated glacial-lake deposits east of Freezeout Lake.
Drainage from Glacial-Lake Deposits
The quality of irrigation drainage from glacial- lake deposits is represented by water from five drains (S-6, S-7, S-8, S-l 1, and S-52) that were sampled in 1990-92 or 1995, or both (table 5). Irrigation drainage at these five sites consists of water applied primarily or exclusively to fields underlain by glacial-lake deposits, with little or no component of drainage from upgradi- ent fields underlain by terrace gravels.
Irrigation drainage from glacial-lake deposits had variable quality. During periods of low stream- flow, irrigation drainage generally was a mixed-cation sulfate type water. When diluted by direct spills or sur face runoff, irrigation drainage was a mixed-cation sul- fate-bicarbonate type water. Dissolved-solids concentrations in 17 samples ranged from 409 to 6,920 mg/L, with a median of 3,130 mg/L. This median rep resents about a twenty-five-fold increase over the dis solved-solids concentration in supply water from the Greenfields Main Canal (site S-l).
Dissolved-selenium concentrations in 45 sam ples from the five drains ranged from 2 to 180 ng/L, with a median of 61 jiig/L. Total-recoverable-selenium concentrations in 18 samples from these drain sites ranged from 2 to 180 ug/L, with a median of 65 jig/L. For the six samples for which both total-recoverable and dissolved selenium were analyzed, the ratio of the dissolved to total-recoverable concentrations ranged from 0.67 to 1.0 and averaged 0.85, indicating that most selenium is present as a dissolved constituent in irrigation drainage. Assuming a ratio of 0.85, the State and Federal aquatic-life chronic criterion of 5 jug/L total-recoverable selenium in water (table 1) was exceeded or equaled in all but two samples collected in 1995 (fig. 8) and in all but three samples collected in 1991-92 (Lambing and others, 1994, table 14). The aquatic-life acute criterion of 20 (xg/L total-recoverable selenium was exceeded in all samples collected from site S-7, in most samples from sites S-8 and S-l 1, and in about 40 percent of the samples collected from site S-6. The acute criterion was not exceeded in any sam ple collected from site S-52. If total-recoverable data were available for the 27 samples for which only dis- solved-selenium concentrations were determined, then more samples may have exceeded these criteria;
24 Detailed study of selenium in glacial-Dake deposits, wetlands, and biota associated with irrigation drainage in the southern Freezeout Lake area, west-central Montana, 1994-95

Table 4. Means, medians, and ranges of selenium concentrations in surface-water and bottom-sediment samples collected from the southern Freezeout Lake area, Montana, 1986-95[Concentrations are in micrograms per liter for surface water and micrograms per gram for surficial bottom sediment. For selenium concentrations less than the minimum reporting level, a value of half the minimum reporting level was used to calculate the mean. Numbers in parentheses indicate ranges of data values. Abbreviations: n, number of samples; WMA, Freezout Lake Wildlife Management Area. Symbols: <, less than; --, no data]
Site numbers (fig. 2)
S-6, S-7, S-8, S-l 1
S-3, S-5, S-9, S-10, S-50, S-51, S-52, 17
S-53, S-55, S-62, S-72, S-80
Many sites2
S-37, S-75, S-76, S-77, S-78, S-79
S-6, S-7, S-8, S-l 1
S-3, S-5, S-9, S-10, S-50, S-5 1,8-52,17
S-53, S-55, S-62, S-72, S-80
Many sites2
S-37, S-75, S-76, S-77, S-78, S-79
Surface water
Site type
Drains from glacial-lake deposits east of WMA
Other irrigation drains 1
Wetlands near mouths of irrigation drains
Freezeout Lake away from mouths of drains
Pond 5 away from mouths of drains
Drains from glacial-lake deposits east of WMA
Other irrigation drains 1
Wetlands near mouths of irrigation drains
Freezeout Lake away from mouths of drains
Pond 5 away from mouths of drains
n
Dissolved selenium
mean median n
NON-IRRIGATION SEASON23 82 69 10
(5.0-180)
22
5
16
5
15
14
5
18
6
5.8 5.5
2.2 2.0 (2.0-3.0)
1.6 2.0 (< 1.0-2.0)
1.6 2.0 (1.0-2.0)
IRRIGATION SEASON42 20
(3.0-150)
2.4 1.0 (<1. 0-8.0)
4.0 1.0
1.4 1.0 (< 1.0-3.0)
1.2 1.0 (<2.0-2.0)
9
0
6
1
8
5
0
6
2
Total selenium
mean median
99 99(45-180)
5.0 3.0 (1.0-15)
" H "
1.6 2.0 (< 1.0-2.0)
2.0 2.0
35 16 (2.0-120)
2.2 1.0 (< 1.0-5.0)
" H "
1.6 2.0 (<1. 0-2.0)
1.2 1.2 (< 1.0-2.0)
Surficial bottom sediment
n
0
0
0
0
0
3
1
5
23,
8
Total selenium
mean median
" (-) "
" (-) "
' (--) "
" <--> "
15 13 (7.8-23)
.8 .8
7.9 12 (.7-13)
2.0 1.4 (.5-7.4)
4.1 3.0 (-9-11)
'Drainage sources are Greenfields Bench (S-3, S-5, S-9, S-10), Greenfields Bench and glacial-lake deposits (S-50, S-51, 17), or glacial-lake deposits southof Freezeout Lake (S-52).
2S-38, S-39, S-54, S-56, S-57, S-58, S-59, S-60, S-61, S-63, S-64, S-65, S-66, S-67, S-68, S-69, S-70, S-71, S-73, S-74.
Table 5. Chemical characteristics of irrigation drainage from glacial-lake deposits near Freezeout Lake, Montana [Abbreviations: ug/L, micrograms per liter; uS/cm, microsiemens per centimeter at 25 degrees Celsius; mg/L, milligrams per liter]
Irrigation-drain sampling site (fig. 2)
Specific conductance (nS/cm)Dissolved-solids concentration (mg/L)Dominant cationsDominant anionDissolved-selenium concentration(Hg/L), irrigation seasonDissolved-selenium concentration(^ig/L), non-irrigation season
S-6
785-3,600770-3,190
Mg, CaSO43-20
5-90
S-7
900-5,9902,870-4,060Mg, Na, Ca
S0464-85
58-110
S-8
650-5,310409-4,280
Mg, Na, CaS04
9-150
120-180
S-ll
800-6,450506-6,920
MgSO44-65
50-65
S-52
753-3,3201,610-2,490
Mg.CaS042-7
6-11
SELENIUM IN AREAS UNDERLAIN BY GLACIAL-LAKE DEPOSITS 25
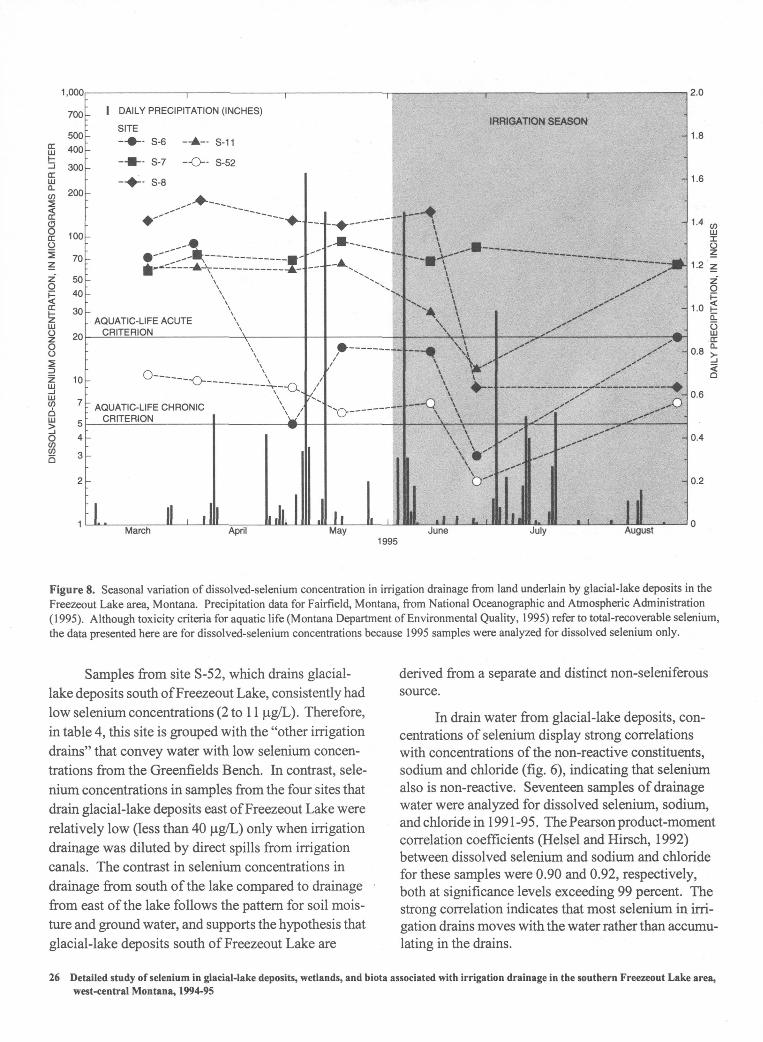
1,000
500
E 40°H
300CC LU Q-
8tr o
O
i
LU _l LUopQ LU
iCOQ
200
100
70
50
40
30
20
10
7
5
4
3
2
I DAILY PRECIPITATION (INCHES)
SITE *~ S-6 A S-11
- - S-7 -O- S-52
*-- S-8
AQUATIC-LIFE ACUTE CRITERION______
AQUATIC-LIFE CHRONIC CRITERION________J_
II ,ll
IRRIGATION SEASON
\
J _ll .1 1March April May June
1995July August
2.0
1.8
1.6
1.4
1.2
O
1.0
0.8
0.6
0.4
0.2
Figure 8. Seasonal variation of dissolved-selenium concentration in irrigation drainage from land underlain by glacial-lake deposits in the Freezeout Lake area, Montana. Precipitation data for Fairfield, Montana, from National Oceanographic and Atmospheric Administration (1995). Although toxicity criteria for aquatic life (Montana Department of Environmental Quality, 1995) refer to total-recoverable selenium, the data presented here are for dissolved-selenium concentrations because 1995 samples were analyzed for dissolved selenium only.
Samples from site S-52, which drains glacial- lake deposits south of Freezeout Lake, consistently had low selenium concentrations (2 to 11 ug/L). Therefore, in table 4, this site is grouped with the "other irrigation drains" that convey water with low selenium concen trations from the Greenfields Bench. In contrast, sele nium concentrations in samples from the four sites that drain glacial-lake deposits east of Freezeout Lake were relatively low (less than 40 |J.g/L) only when irrigation drainage was diluted by direct spills from irrigation canals. The contrast in selenium concentrations in drainage from south of the lake compared to drainage from east of the lake follows the pattern for soil mois ture and ground water, and supports the hypothesis that glacial-lake deposits south of Freezeout Lake are
derived from a separate and distinct non-seleniferous source.
In drain water from glacial-lake deposits, con centrations of selenium display strong correlations with concentrations of the non-reactive constituents, sodium and chloride (fig. 6), indicating that selenium also is non-reactive. Seventeen samples of drainage water were analyzed for dissolved selenium, sodium, and chloride in 1991-95. The Pearson product-moment correlation coefficients (Helsel and Hirsch, 1992) between dissolved selenium and sodium and chloride for these samples were 0.90 and 0.92, respectively, both at significance levels exceeding 99 percent. The strong correlation indicates that most selenium in irri gation drains moves with the water rather than accumu lating in the drains.
26 Detailed study of selenium in glacial-lake deposits, wetlands, and biota associated with irrigation drainage in the southern Freezeout Lake area, west-central Montana, 1994-95

Table 6. Correlation analyses of specific conductance and discharge with dissolved-selenium concentration for irrigation drainage from glacial-lake deposits near Freezeout Lake, Montana
[Abbreviations: ftVs, cubic feet per second; ug/L, micrograms per liter, uS/cm, microsiemens per centimeter at 25 degrees Celsius. Symbol: >, greater than]
Site number (fig. 2)
S-6S-7 S-8 S-ll S-52
Number of samples
10 10 8
107
Range of values, 1990-95
Specific conductance
(uS/cm)
785-3,600 900-5,990 650-5,310 800-6,450 753-3,320
Discharge (ft3/*)
0.07-2.4 0.02-0.6 0.04-3.7 0.1-7.8
0.08-11.0
Selenium, dissolved
(ug/L)
3-90 58-110 9-180 4-65 2-11
Correlation between specific conductance
and dissolved-selenium concentration
Pearson product- moment
correlation coefficient
0.95 -.28 .92 .88 .67
Significance level
(percent)
>99 57
>99 >99
90
Correlation between discharge and
dissolved-selenium concentration
Pearson product- moment
correlation coefficient
-0.66 -.16 -.84 -.84 -.81
Significance level
(percent)
96 34
>99 >99
98
Relation between Selenium Concentration and Specific Conductance. Because selenium con centrations in drain water periodically exceed aquatic- life criteria, resource managers may need the ability to monitor selenium concentrations continuously. Unfor tunately, no simple or inexpensive technology exists to monitor selenium concentrations in the field. How ever, continuous monitoring of specific conductance is feasible and in some circumstances might be used to estimate continuous selenium concentrations. There fore, the correlation between specific conductance and selenium concentration was examined to determine whether specific conductance could be a valid surro gate for selenium in irrigation drainage.
The concentration of selenium in irrigation drainage from glacial-lake deposits does correlate with specific conductance. Forty-five water samples were collected in 1990-95 from the five sites that drain pri marily glacial-lake deposits and were analyzed for dis solved selenium and specific conductance. The Pearson product-moment correlation coefficient between dissolved selenium and specific conductance for these samples was 0.62, at a significance level exceeding 99 percent. Although scattering is evident in figure 9, the plot shows that data for the different source areas generally are grouped by drain. Correla tion coefficients and significance levels for individual drains are listed in table 6.
Although there is a relation between selenium concentration and specific conductance, neither param eter is a surrogate for the other.. A given specific-con ductance value may represent a large range of selenium
concentrations. For example, on the basis of samples from site S-8, a specific-conductance value of about 5,000 jo,S/cm could correlate with a dissolved-selenium concentration as low as 120 ug/L or as high as 180 ug/L (fig. 9).
Relation between Selenium Concentration and Water Discharge. The concentration of selenium in irrigation drainage correlates inversely with water discharge (table 6, fig. 10); that is, the higher the flow rate, the lower the selenium concentration. Selenium is most concentrated in irrigation drainage during the non-irrigation season (fig. 8), when drains receive inflow primarily from ground water, and least concen trated during the irrigation season, when runoff from irrigated fields, seepage and direct spills from canals, and precipitation dilute ground-water discharge.
The correlation between water discharge and selenium concentration is most significant where wide ranges of discharge and concentration have been mea sured. Conversely, selenium is weakly correlated to discharge at site S-7, which consistently had relatively low discharge rates and high dissolved-selenium con centrations when they were measured. The low signif icance level of the correlation (table 6) may reflect the small range of discharges on which the correlation is based. However, when total-recoverable-selenium concentrations are considered, the correlation improves because one of the samples that was analyzed for total- recoverable selenium was collected when discharge was relatively high (1.2 ft3/s). Site S-7 was sampled for total-recoverable selenium three times when dissolved selenium was not measured. Adding the total-recover-
SELENIUM IN AREAS UNDERLAIN BY GLACIAL-LAKE DEPOSITS 27

1,000
700
500
400 tr£ 300 _j
£ 200
(O
1O 100DCy 70^? 50 Z 40
30
20
10
SITE
S-6
S-7
S-8
A S-11
O S-52
A
A
O O O
A
O
O
500 700 1,000 2,000 3,000 4,000 5,000 7,000 10,000
SPECIFIC CONDUCTANCE, IN MICRO-SIEMENS PER CENTIMETER AT 25 DEGREES CELSIUS
Figure 9. Relations of specific conductance to dissolved-selenium concentration in irrigation drainage from land underlain by glacial-lake deposits in the Freezeout Lake area, Montana.
able selenium concentrations from these samples to the data set and adjusting them by a dissolved:total-recov- erable ratio of 0.85 improves the Pearson product- moment correlation coefficient for site S-7 to -0.52 with a significance level of 93 percent.
The relation between dissolved-selenium con centration and discharge for site S-52 (fig. 10) is con sistent with the low selenium concentrations relative to major-ion concentrations in ground water and soil moisture south of Freezeout Lake. Both observations imply a non-seleniferous source area for glacial-lake deposits south of the lake.
Selenium Loads from Source Area
Although selenium concentrations in water are useful indicators of potential risks to biota, the concen trations alone are not evidence of the overall quantity
of selenium that is transported from source areas to the WMA. The total mass, or load, of selenium in irriga tion drainage is a function of both concentration and flow rate, or discharge. Selenium loads were estimated to determine the total mass of selenium delivered from areas underlain by glacial-lake deposits and to compare quantities of selenium discharging from different areas.
The annual load of dissolved selenium from a source area to the Freezout Lake WMA is expressed by the equation:
Load = Q * Se * 0.00272 (1)
whereLoad is the annual dissolved-selenium load, in
pounds, Q is the annual discharge from the source
area, in acre-feet, and Se is the corresponding dissolved-selenium
concentration, in micrograms per liter.
28 Detailed study of selenium in glacial-lake deposits, wetlands, and biota associated with irrigation drainage in the southern Freezeout Lake area, west-central Montana, 1994-95

1,000
700
500400
300
200
100
70
0.60
p < 0.0001
SITE
S-6
S-7
S-8
A S-11
O S-52
Se
0.01 0.02 0.05 0.1 0.2 0.5 1 2 5 10
WATER DISCHARGE, IN CUBIC FEET PER SECOND
20 50 100
Figure 10. Relations of water discharge (Q) to dissolved-selenium concentration (Se) in irrigation drainage from land underlain by glacial- lake deposits in the Freezeout Lake area, Montana.
On the basis of instantaneous streamflow and water-quality data and generalized irrigation statistics, Nimick and others (1996) estimated that 1,130 Ib of selenium are contributed to Freezout Lake WMA annu ally from irrigated land underlain by glacial-lake deposits south and east of Freezeout Lake. New data from sites that were first monitored in 1995 were added to data from sites that were first monitored in 1990-92 and used to refine the earlier estimate of selenium load ing, both spatially and temporally. Annual selenium loads from areas underlain by glacial-lake deposits to Freezout Lake WMA were estimated using available information for runoff quantities and water quality. Selenium loading was only grossly estimated, both by Nimick and others (1996) and in this study, owing to a lack of continuously recorded streamflow and water- quality data. However, the current estimate is based on
a larger sample size and a broader range of conditions and is, therefore, considered more accurate than the earlier estimate.
For purposes of the refined loading estimate, the glacial-lake deposits were divided into two apparently distinct geochemical subareas: 3,570 acres east of Freezeout Lake and Pond 5 and 500 acres south of the lake. Unique relations between irrigation-drain dis charge and selenium concentrations (fig. 10) distin guish the two subareas and are consistent with the distinct geochemical properties of the contributing ground water. The subarea east of Freezeout Lake drains primarily westward from seleniferous glacial- lake deposits and is represented by irrigation-drain sites S-6, S-7, S-8, and S-11. The subarea south of Freezeout Lake drains northward from presumably non-seleniferous glacial-lake deposits and is repre-
SELENIUM IN AREAS UNDERLAIN BY GLACIAL-LAKE DEPOSITS 29

sented by irrigation-drain site S-52. Exact geochemical boundaries of the subareas are not known; visible dif ferences between subareas, such as soil or geologic attributes, are not evident.
Estimates of seasonal discharge from each sub- area were used to compute annual selenium loading to the WMA from land underlain by glacial-lake deposits. Total discharge from irrigated glacial-lake deposits to Freezout Lake WMA is listed by source in table 7. These estimates were developed from data on total vol ume of irrigation water delivered to farms within a sub- area and corresponding irrigation efficiency estimates; total volume of direct spills from canals and corre sponding estimates of spill percentages to each sub- area; total volume of canal deliveries and corres ponding estimates of canal seepage to each subarea (Jerry Nypen and Scott Boelman, Greenfields Irriga tion Division, written commun., 1993 and 1996); and total annual precipitation (National Oceanographic and Atmospheric Administration, issued annually) and cor responding estimates of precipitation runoff and infil tration. According to these estimates, about 20 percent of annual discharge occurred during the non-irrigation season, and about 80 percent during the irrigation sea son in 1993-95.
Selenium-concentration data from the five sam pled drains that carry water derived primarily from gla cial-lake deposits were segregated by subarea and season and used to determine average selenium con centrations for each subarea for the irrigation and non- irrigation seasons. Average seasonal dissolved-sele- nium concentrations and the estimated seasonal dis charges were used to compute seasonal loads, which were summed to obtain an annual load for each sub- area. Table 8 summarizes seasonal flow and selenium loading for each of the subareas. The average annual
selenium load from both subareas combined was about 200 Ib in 1993-95.
The annual variation in selenium load is small (table 8), despite large variations in annual precipita tion (table 7). Table 7 helps to explain the small annual variation. In 1993, a high-precipitation year, little irri gation water was applied to fields and most (66 per cent) of the discharge to the WMA came from sources other than subsurface irrigation drainage (direct spills from canals and from precipitation runoff and infiltra tion). In contrast, in 1994, a low-precipitation year, more irrigation water was delivered to fields to com pensate for the lack of natural moisture, and subsurface irrigation drainage (on-farm losses and seepage from canals) contributed most (65 percent) of the discharge to the WMA. Consequently, total discharge and thus total loading~to the WMA varies much less from year to year than does total precipitation.
In contrast to the small variation in annual load ing, variation in seasonal loading is significant. Figure 11 illustrates seasonal changes in selenium loading to irrigation drains from March to August 1995. The loading rate was relatively constant during early spring, until the first major precipitation event. Several con secutive days of substantial rainfall in early May 1995 resulted in the first substantial increases in selenium loads. Loads at sites S-7 and S-8, which may receive some drainage from the Greenfields Bench, continued to increase as irrigation began on the Bench. Selenium loads at sites S-l 1 and S-52 increased more than ten fold in response to irrigation. Meanwhile, loads at S-6, S-7, and S-8 increased as well. By August, selenium loads had decreased at most sites. This seasonal pattern of selenium loads (fig. 11) contrasts with the seasonal pattern of selenium concentrations (fig. 8), which gen erally are lowest in early summer.
Table 7. Estimated annual discharge from irrigated glacial-lake deposits to Freezout Lake Wildlife Management Area, Montana, 1993-95
Year
1993 1994 1995
Precipitation (inches)
19.22 7.87
. 15.80
Estimated discharge by source, in acre-feet (and percent of total discharge)1
On-farm loss
520(14%) 1,200(27%) 720(18%)
Direct spills from canals
1,730(48%) 1,290 (29%) 1,890(46%)
Seepage from canals
700(19%) 1,690(38%) 940(23%)
Precipitation . runoff and infiltration
650(18%) 270 (6%) 540(13%)
Total discharge
(acre-feet)
3,600 4,450 4,090
'Percents in 1993 total 99 percent due to rounding.
30 Detailed study of selenium in glacial-lake deposits, wetlands, and biota associated with irrigation drainage in the southern Freezeout Lake area, west-central Montana, 1994-95

Table 8. Estimated seasonal selenium loads from land underlain by glacial-lake deposits to Freezout Lake Wildlife Management Area, Montana, 1993-95[Abbreviations: acre-ft, acre-feet; Ib, pounds; ug/L, micrograms per liter; I, irrigation season (135 days); NI, non-irrigation season (230 days). Symbol: --, not applicable]
Subarea
EastSouthAnnual total
EastSouthAnnual total
East SouthAnnual total
Average annual total
Area (acres)
3,570500
4,070
3,570500
4,070
3,570 500
4.070
4,070
Estimated seasonal discharge1
(acre-ft)
I
2,460420
2,880
2,610950
3,560
2,600 670
3.270
3,240
NI
610110720
650240890
650 17082Q
810
Average seasonal dissolved-selenium
concentration(ug/L)
I NI
199342 83
5 9..
199442 83
5 9..
199542 83
5 9- -
--
Seasonal dissolved-selenium load
(Ib)
I
1042
106
1105
115
1094
ill
111
NI
872
89
924
96
923
2593
Annual Annual dissolved- dissolved-
selenium load selenium yield (Ib) Ob/acre)
1914
195
2029
211
201 36
207
204
0.05.008.06
.06
.02
.08
.06
.01M
.07
1 Discharge estimates are based on total volume of irrigation water delivered to farms within a subarea and corresponding irrigation-efficiency estimates; total volume of direct spills from canals and corresponding estimates of spill percentages to each subarea; total volume of canal deliveries and corresponding estimates of canal seepage to each subarea (Jerry Nypen and Scott Boelman, Greenfields Irrigation Division, written commun., 1993 and 1996); and total annual precipitation (National Oceanographic and Atmospheric Administration, issued annually) and corresponding estimates of precipitation runoff and infiltration.
Concentration estimates are based on samples collected during 1990-92 (Lambing and others, 1994, table 14) and 1995 (Kendy and Olsen, 1997, table 10).3Sum of seasonal loads does not equal annual load due to Founding.
The seasonal pattern of selenium loading sup ports the hypothesis that ground-water discharge is the primary source of selenium in irrigation drainage, and implies that loading rates may be controlled seasonally by evapoconcentration and climate- and irrigation- induced hydraulic gradients. During the fall, winter, and early spring, ground water flows slowly toward irrigation drains in response to a relatively shallow hydraulic gradient. Selenium concentrations are rela tively high, owing to evapoconcentration of soil mois ture and ground water and dissolution of selenium-rich evaporative salts. This water discharges to irrigation drains at a fairly steady rate. In the spring, snowmelt, rainfall, and irrigation water percolate to shallow ground water, increasing hydraulic gradients of sele nium-rich ground water toward drains. Steeper gradi ents result in higher ground-water velocities and a decrease in contact time between the water and soluble salts in the aquifer. During the summer, rainfall and continued application of irrigation water maintain rela
tively high ground-water velocities and dilute selenium concentrations in ground water, resulting in a gradual decrease in selenium loading. By the end of the irriga tion season, the selenium-enriched ground water that had accumulated over the winter may be relatively dilute and selenium loading rates decrease to fall levels. It should be noted, however, that this scenario is based on relatively few sampling episodes during the summer irrigation season and actual fluctuations between sam ple dates may likely differ from those shown in figure 11.
SELENIUM IN WETLANDS
Irrigation drainage and irrigation delivery losses discharge into southern Freezeout Lake and Pond 5 and mix with water contributed by natural runoff and direct precipitation. Water is distributed by a canal system among the interconnected ponds of Freezout Lake WMA to manipulate water levels for waterfowl man-, agement. Pond 5 can discharge into Pond 6 and then
SELENIUM IN WETLANDS 31

Qrr LU CL co a z
8
LU_I LU
6LU
O COenQ
1
0.7
0.5
0.4
0.3
0.2
0.1
0.07
0.05
0.04
0.03
0.02
0.01
0.007
0.005
0.004
0.003
0.002
nnm
- I DAILY PRECIPITATION (INCHES)
- SITE- -- S-6 --A- S-11
~m~ S-7 -O- S-52
--*" S-8
r
:- ^V*^^,'-'''/' ^~^-^''_^-~.^
- »'., -.---'"H
wx-:
\1 D-
-
1 II , ,1 1
1
-A""""
>^"T
-a
nil.
/̂
s'
7AX ^/jf*''v^.
C3~~ -'
\\
\ \ 1
IRRIGATION SEASON
^/ V"\
/I
1
"""^
x
\
1 i
..^-~~''-+' I ! ^\
/ / --, / ^'""\ //'/
;
i/
/
/I; // O
1
III ... , Jill,
_
VKxs
VNV
--**-.> SN\
^ S-^f=J--xr"""" *^~^
"-vv^NVX
v"-^^Vv^^v
^y-x
-
_
1
'
-
id
1.8
1.6
1.4CO
¥
L2 iz
o1.0 fee
oLUcr
0.8 0-
i0.6
0.4
0.2
nMarch April May June July August
1995
Figure 11. Seasonal variation of selenium loads in irrigation drainage from land underlain by glacial-lake deposits in the Freezeout Lake area, Montana. Symbols represent calculated instantaneous loads based on measured instantaneous discharges and dissolved-selenium concentrations in samples collected from irrigation-drain sampling sites on the dates shown. Precipitation data for Fairfield, Montana, from National Oceanographic and Atmospheric Administration (1995).
into Freezeout Lake (fig. 2). Water from Freezeout Lake can be transferred by canal to Priest Butte Lakes (fig. 1), from which it can discharge to the Teton River through an outlet structure and canal. These discharges are regulated by the Montana Department of Environ mental Quality in accordance with State criteria for dis charge of saline water.
Surface Water
Water from lakes and ponds (wetlands) was sam pled from one site (number 19) in 1986 (Knapton and others, 1988, table 2). This site (renamed S-39) and sites S-3 7 and S-3 8 were sampled in 1991 -92 (Lambing and others, 1994, table 3) and analyzed for major ions,
nutrients, trace elements, and stable isotopes. Eighteen sites, including the original three sites, were sampled in 1995 and analyzed for selenium concentration to better define the spatial distribution of selenium in wetland waters (Kendy and Olsen, 1997, table 9). Surface- water sites are identified with the prefix "S" in figure 2. Results of water-quality analyses are reported in Knap- ton and others (1988, table 15), Lambing and others (1994, tables 14 and 15), and Kendy and Olsen (1997, tables 10 and 11).
Concentrations of dissolved selenium in water samples collected in 1986-95 from 18 sites in Freeze- out Lake and Pond 5 ranged from <1 to 10 ug/L. The highest selenium concentrations in lake water were at wetland sites located within about 100 ft of the mouths of the four sampled irrigation drains (S-6, S-7, S-8, and
32 Detailed study of selenium in glacial-lake deposits, wetlands, and biota associated with irrigation drainage in the southern Freezeout Lake area, west-central Montana, 1994-95

S-11) that convey water derived primarily from glacial- lake deposits east of Freezeout Lake (table 4). Sele nium concentrations in lake water at the mouths of these irrigation drains (<2 to 10 ug/L) generally are much lower than concentrations in the contributing drains throughout the year (3 to 180 ^g/L). No water sample collected farther than about 100 ft from the mouth of an irrigation drain had a selenium concentra tion greater than 3 ug/L.
Evaporation causes the concentration of dis solved solids in the wetlands of Freezout Lake WMA to increase as water moves through the small ponds and lakes. However, because selenium is removed from solution almost immediately upon entering the wet lands, evaporation does not have a significant effect on selenium concentrations (Nimick and others, 1996).
Bottom Sediment
Bottom sediment was sampled from one wetland site (number 19) in 1986 (Knapton and others, 1988, table 2). This site (renamed S-39) and sites S-37 and S- 38 were sampled in 1991-92 (Lambing and others, 1994, table 3) and analyzed for major ions and trace elements. Bottom-sediment samples were collected in 1995 from 4 irrigation drains, 24 locations in Freezeout Lake, and 7 locations in Pond 5, and analyzed for sele nium concentrations. Sites where bottom sediment was sampled are identified with the prefix "S" in figure 2. Twenty-two of the 35 bottom-sediment sampling loca tions, including the three previously sampled sites, cor respond to surface-water sampling sites (Kendy and Olsen, 1997, table 9). The unsieved bulk samples were analyzed for total selenium. Results of bottom-sedi ment analyses are reported in Knapton and others (1988, table 16), Lambing and others (1994, table 20), and Kendy and Olsen (1997, table 12).
The depth of surficial material varied among sites but generally consisted of about 0-8 in. of uni formly black, organic-rich sediment overlying dense, gray sediment (J.H. Lambing, U.S. Geological Survey, written commun., 1995). Depth-specific samples, sep arated by distinct color and texture differences, were collected from eight sites. At each of those sites, sele nium concentrations decreased with depth (Kendy and Olsen, 1997, table 12).
Concentrations of selenium in surficial bottom- sediment samples ranged from 0.5 to 23 jig/g (table 4) with a median of 1.7 |ig/g; concentrations in the under lying dense, gray sediment ranged from 0.2 to 11 j^g/g with a median of 0.8 ug/g. Several samples from irri gation drains and from Freezeout Lake near the mouths of drains had selenium concentrations that exceeded 4 ug/g. Lemly and Smith (1987) suggested that concen trations of 4 (j,g/g or higher pose a concern for fish and wildlife because of possible food-chain bioaccumula- tion. In this study, the highest concentrations were in organic-rich sediment samples from irrigation drains that convey drainage primarily from glacial-lake deposits (13 ug/g at S-8 and 23 ug/g at site S-l 1) arid from sites in Freezeout Lake within about 50 ft from the mouths of drains (13 ug/g at S-53, and 12 ug/g at S-62 and S-72) (fig. 12).
Selenium concentrations generally are higher hi wetland bottom sediment than in soil (fig. 13), indicat ing that selenium has accumulated in bottom sediment. Although concentrations generally were highest in drains and in wetlands near mouths of drains, almost all samples of bottom sediment from Freezeout Lake and Pond 5 also exceeded the median concentration (0.5 ug/g) of all soils sampled in the study area in 1990-92 (Lambing and others, 1994, table 6) and 1995 (Kendy and Olsen, 1997, table 5).
Seasonal and spatial variations in selenium load ing are evident, based on the previously discussed mass-loading analysis. Variations in loading rates con tribute to the heterogeneous distribution of selenium concentrations in wetland bottom sediment. Selenium content can vary considerably within relatively small areas of lake bottom. The three sites sampled in 1991- 92 were located (to within about 100 ft) in 1995 and resampled. At site S-39, the selenium concentration was 2.5 ug/g in 1991 and 0.5 ng/g in 1995; at S-38, the concentration was 0.7 ug/g in 1991 and 1.0 ug/g in 1995; and at S-37, the concentration was 11 (ig/g in 1991, 8 ug/g in 1992, and 3.8 ug/g in 1995 (Lambing and others, 1994, table 20; Kendy and Olsen, 1997, table 12). The highest selenium concentration in lake- bottom sediment, 13 jo,g/g, was found at the mouth of the southernmost irrigation drain (site S-53), even though dissolved-selenium concentrations in this drain, as well as in the nearby monitoring well (W-61) and lysimeter (L-61), were low compared to areas east of the lake. This locally elevated value may be related in
SELENIUM IN WETLANDS 33

R.4W. II2°02'30" R.3W.
47°40' *
T. 22 N.
47°37'30" -
Base modified from U.S. Geological Survey Cliev, 1983; Fairfield, 1983; Freezeout Lake, 1987; and Lowry, 1987, 1:24,000
0.5 I
1 MILE I
I 0.5
\1 KILOMETER
Figure 12. Selenium concentrations in surficial bottom sediment in August 1995 and ranges of dissolved-selenium concentrations in surface water in 1990-95 in Freezeout Lake, Pond 5, and tributary irrigation drains in the southern Freezeout Lake area, Montana. Bottom-sediment samples were unsieved.
34 Detailed study of selenium in glacial-lake deposits, wetlands, and biota associated with irrigation drainage in the southern Freezeout Lake area, west-central Montana, 1994-95
EXPLANATION FOR FIGURE 12
CONCENTRATION OF SELENIUM IN BOTTOM SEDIMENT, IN MICROGRAMS PER GRAM-Lines of equal concentration are dashed where approximately located
[TTT] LESS THAN 1
HI MORE THAN 3
////// MARGIN OF GLACIAL-LAKE DEPOSITS ADJACENT TO FREEZEOUT LAKE
<$ CANAL SHOWING DIRECTION OF FLOW
_ _ < - - _ IRRIGATION DRAIN SHOWING DIRECTION OF FLOW
3 3 A1 ' BOTTOM-SEDIMENT SAMPLING SITE AND CONCENTRATION OF SELENIUM
IN AUGUST 1995 SURFICIAL-SEDIMENT SAMPLE, IN MICROGRAMS PER GRAM OF DRY SAMPLE WEIGHT
(5-90)A SURFACE-WATER SAMPLING SITE AND 1990-95 RANGE OF CONCENTRATIONS
OF DISSOLVED SELENIUM, IN MICROGRAMS PER LITER-Symbol: <, less than
part to bottom-sediment variability; resampling of this area might result in a different concentration. Alternatively, the high concentration might result from more selenium loading from the contributing irrigation drain during the past.
Selenium delivered in drain water to the lake is selenate, the mobile, oxidized selenium species. Sel- enate is rapidly removed from lake water and stored in wetland bottom sediment, either by bacterial reduction and conversion to organic or elemental selenium or by biological uptake (Lemly and Smith, 1987; Oremland and others, 1990,1991; Weres and others, 1989,1990; Zhang and Moore, 1996, 1997b, 1997c, 1998). Conse quently, the highest concentrations of selenium in bot tom sediment were close to the mouths of the four irrigation drains that carry large loads of selenium from irrigated glacial-lake deposits. Conversely, selenium concentrations in bottom sediment were lower near the mouths of the two drains (S-50 and S-51, fig. 2) that deliver drainage primarily from the Greenfields Bench.
The distribution of selenium in bottom sediments might result in part from the currents in Freezeout Lake. Selenium concentrations in bottom sediment are elevated (3.8 and 3.3 ng/g) at two sites (S-59 and S-74) distant from the mouths of drains (fig. 12). However, lake-water samples collected away from the mouths of drains consistently had low (<3 ng/L) selenium con centrations. Therefore, sediment transport, rather than
transport of water and subsequent transfer to sediment, better explains the selenium distribution in bottom sed iment. Lake currents probably transport selenium- enriched suspended sediment or algae some distance before deposition occurs. Currents in the lake could be wind-induced or caused by water flow, which is from south to north in the main part of Freezeout Lake.
The mass of selenium presently contained in bot tom sediment in Freezeout Lake and Pond 5 was esti mated by manually contouring measured selenium concentration on maps. First, concentrations of sele nium in bottom-sediment cores were weighted by the length of the core (Kendy and Olsen, 1997, table 12) to obtain a weighted-selenium concentration for each core. The weighted-selenium concentrations were plotted and contoured on two maps-one map for the black, poorly cohesive, organic sediment that typically is present at the water-sediment interface and another map for the gray, compacted, inorganic sediment found at depth, as described in field notes recorded during sediment sampling (J.H. Lambing, written commun., 1995). Areas of equal weighted-selenium concentra tion were then determined and multiplied by sediment density to calculate selenium mass. Sediment density was assumed to be 0.5 g/cm3 for organic sediment and 1.5 g/cm3 for inorganic sediment. On the basis of these assumptions, about 11,000 Ib of selenium currently are contained in lake-bottom sediment in the study area.
SELENIUM IN WETLANDS 35

20
10
(3)
(5)
(1)
(8)
(23)
(3)
O
*
EXPLANATION
Number of samples
Outlier data value more than 3 times the interquartile range outside the quartile
Outlier data value less than or equal to 3 and more than 1.5 times the interquartile range outside the quartile
Data value less than or equal to 1.5 times the interquartile range outside the quartile
75th percentile
Median
25th percentile
Data value more than or equal to 1.5 times the interquartile range outside the quartile
CONCENTRATION THRESHOLD FOR POTENTIAL BIOLOGICAL IMPAIRMENT (Lemly and Smith, 1987)
MEDIAN CONCENTRATION OF LOCAL SOILS DERIVED FROM GLACIAL-LAKE DEPOSITS
Drains from glacial-lake
deposits east of Freezout
Lake Wildlife Management
Area
Otherirrigation
drains
Wetlandsnear
mouthsof
irrigation drains
FreezeoutLake
away frommouths ofirrigationdrains
PondS away from mouths ofirrigation drains
Figure 13. Statistical distribution of selenium concentrations in surficial bottom sediment from the southern Freezeout Lake area, Montana, 1995. Sampling sites are grouped according to the criteria used for table 4. Data from Kendy and Olsen (1997; table 12).
About 15 percent of this mass is in Pond 5 and 85 per cent is in Freezeout Lake. Despite relatively high con centrations of selenium in irrigation-drain-bottom sediment, the total mass of selenium contained in bot tom sediment in irrigation drains is comparatively small (less than 1 percent of the selenium in bottom sediment at the WMA), owing to the small volume of bottom sediment in the drains relative to the lakes.
Using the estimated annual average selenium- loading rate of 200 Ib per year, about 14,000 Ib of sele nium have been delivered to Freezeout Lake and Pond 5 in the 68 years since irrigation of glacial-lake depos its began. But the most readily leachable selenium probably was flushed from the deposits first, resulting in a loading rate that has decreased over time. Conse quently, the total selenium load may be greater than the
estimated 14,000 Ib. However, the total amount of selenium delivered to the wetlands over time is not stored in the wetlands because some selenium likely has been lost from bottom sediments by volatilization (Thompson-Eagle and Frankenberger, 1991; Zhang and Moore, 1997a) or transported through the outlet from Freezeout Lake to Priest Butte Lakes.
Aquatic plants, aquatic invertebrates, fish, and water-bird eggs were sampled in and near Freezout Lake WMA to determine selenium concentrations in organisms representative of several trophic levels of the food web; to assess major pathways of selenium accumulation by higher trophic-level organisms, such
36 Detailed study of selenium in glacial-lake deposits, wetlands, and biota associated with irrigation drainage in the southern Freezeout Lake area, west-central Montana, 1994-95

as fish and birds; and to evaluate the current and poten tial effects of selenium on fish and water-bird health and reproduction. Biota were sampled from 21 sites in 1990-92 or 1995, or both. Site names and types of data collected from each site are listed in Lambing and oth ers (1994, table 3) and Kendy and Olsen (1997, table 9). Site locations are shown in figure 2 and are identi fied with the prefix "B." Results of chemical analyses are in Lambing and others (1994, tables 21-31) and Kendy and Olsen (1997, tables 13-17).
Selenium Distribution
Selenium-concentration data for biota are segre gated by season and site type and are summarized as geometric means and ranges of data values (table 9). Data for some species (fathead minnows, for example) are not summarized in table 9 owing to low sample numbers. Biological sampling sites are grouped using the same location criteria as those used for surface water and sediment (table 4) to emphasize spatial dif ferences in selenium concentrations and to facilitate the comparison between selenium concentrations in biota and ambient exposure levels in water and sediment. Recall that the selenium concentrations were highest in water and bottom sediment from irrigation drains that convey water primarily from glacial-lake deposits east of Freezeout Lake and from bottom sediment in wet lands near the mouths of these drains, and that concen trations in drain water are highest during the non- irrigation season (table 4).
In this section, selenium concentrations in biota are compared to background concentrations reported for other areas to illustrate the relative degree of sele nium enrichment in study-area biota. In the next sec tions (Bioaccumulation and Toxicity Risks), selenium concentrations in biota are compared to reference con centrations for potential toxicity and biological impair ment to evaluate levels of risk associated with selenium at Freezeout Lake WMA.
Aquatic Plants
Plants were collected during the 1992 and 1995 irrigation seasons from 11 wetland sites and analyzed for selenium concentrations (Lambing and others, 1994, table 21; Kendy and Olsen, 1997, table 13). Two taxa~a submergent aquatic plant, and a filamentous
green alga-were collected in 1995 (Kendy and Olsen, 1997, table 13). The aquatic plant, sago pondweed, is a highly preferred waterfowl food plant (Martin and Uhler, 1939) associated with the invertebrate prey of ducks (Berg, 1949). Algae are consumed in at least small quantities by water birds feeding on the diverse invertebrate community living within algal mats (Krull, 1970).
Selenium concentrations in some samples of sago pondweed from wetland sites exceeded the 1.0 ug/g dry weight concentration reported as the average background concentration for aquatic macrophytes from uncontaminated sites in the San Joaquin Valley (Saiki and Lowe, 1987; Schuler and others, 1990). The single sample of sago pondweed collected from Pond 5 (site B-16) away from drain mouths, 11 of the 15 sam ples from wetlands near drain mouths, and 1 of the 5 samples from Freezeout Lake away from drain mouths had selenium concentrations exceeding 1.0 ng/g dry weight.
Within each site type, selenium concentrations in filamentous-algae samples were similar to concentra tions in sago-pondweed samples (table 9). Selenium concentrations in many samples of filamentous algae from wetland sites exceeded the 0.5 (ig/g dry weight concentration reported as the average background con centration for filamentous algae from uncontaminated sites in the San Joaquin Valley of California (Saiki and Lowe, 1987; Schuler and others, 1990). Selenium con centrations in all 9 samples from wetlands away from drain mouths and in 9 of the 15 samples from wetlands near the mouths of irrigation drains exceeded 0.5 jug/g dry weight.
Selenium concentrations were highest in plant samples from Freezeout Lake (site B-39) near the mouth of the irrigation drain that had the highest sele nium concentration in water (180 ug/L at site S-8). The selenium concentration also was high (12 (ig/g) at the corresponding bottom-sediment site (S-72). Minimum selenium concentrations in both sago pondweed and filamentous-algae samples collected at site B-39 (5.2 and 4.9 fig/g dry weight, respectively) exceeded the maximum concentrations recorded elsewhere in the study area.
SELENIUM IN BIOTA 37

Table 9. Geometric mean selenium concentrations in biological samples collected from the southern Freezeout Lake area, Montana, 1987-95
[Numbers in parentheses indicate ranges of data values. Abbreviations: n, number of samples; Se, geometric mean selenium concentration in micrograms per gram dry weight; WMA, Freezout Lake Wildlife Management Area. Symbols: <, less than; --, no data or not applicable]
Site numbers (fig. 2)
B-2, B-3, B-4, B-31,B-36
Aquatic plants
Sago pondweed Filamentous algae
n Se n SeNON-IRRIGATION SEASON
Drains from glacial-lake 0 0 deposits east of WMA
Invertebrates
Chironomid Waterboatmen
n Se n Se
0 0 -
B-1, B-32, B-33 Other irrigation drains 1
B-34, B-35, Wetlands near mouths ofB-37, B-39, B-40 irrigation drains
B-17, B-18, Freezeout Lake away fromB-19, B-38, B-43 mouths of drains
B-16, B-41, B-42 Pond 5 away from mouths of drains
B-2, B-3, B-4, Drains from glacial-lakeB-31, B-36 deposits east of WMA
B-l, B-32, B-33 Other irrigation drains 1
IRRIGATION SEASON0 0
12
6
3
13 (5.4-26)
7.5 (5.9-9.6)
5.1 (4.8-5.3)
12
6
3
3.1 (2.2-4.5)
1.8 (.6-3.2)
1.6 (.6-2.5)
B-34, B-35, B-37, B-39, B-40
B-17,B-18, B-l 9, B-38, B-43
B-l 6,8-41, B-42
Wetlands near mouths of irrigation drains
Freezeout Lake away from mouths of drains
Pond 5 away from mouths of drains
15
5
1
2 1.6 (O.5-7.2)
2.9
(.6-4.3)
2.9 (--)
15
6
3
2 1.1 (<0.5-5.7)
1.5 (1.3-1.9)
2.3 (1.7-3.0)
13
11
1
15 (8.3-26)
5.6 (2.7-14)
3.3 (--)
13 5.8 (3.8-8.4)
10 2.9 (1.3-16)
4 4.3 (3.9-4.5)
Drainage source is Greenfields Bench (B-1, B-32) or glacial-lake deposits south of Freezeout Lake (B-33). 2For selenium concentrations less than the minimum reporting level, a value of half the minimum reporting level was used to calculate the geometric mean.
Aquatic Invertebrates
Invertebrates are an important food source for water birds, especially during egg-laying (Serie and Swanson 1976). Invertebrates were sampled from 16 wetland and irrigation-drain sites in 1991-92 and 1995 (Lambing and others, 1994, table 22; Kendy and Olsen, 1997, table 14). Chironomid larvae (Family Chirono- midae), waterboatmen (Family Corixidae), and other invertebrate taxa were collected. Where a single fam ily or order did not predominate, mixed composites of multiple orders of common invertebrates were col
lected. Many different taxa were represented in these composite samples of multiple orders, including, but not restricted to, amphipods (Order Amphipoda), daph- nia (Order Cladocera), copepods (Order Copepoda), waterboatmen, backswimmefs (Order Hemiptera), damselflies (Order Odonata), and beetles (Order Coleoptera).
Geometric mean selenium concentrations in invertebrate samples from almost all site types exceeded the 0.5 to 2.0 p,g/g dry weight range of con centrations reported by Maier and Knight (1994) to be average background concentrations. The exceptions
38 Detailed study of selenium in glacial-lake deposits, wetlands, and biota associated with irrigation drainage in the southern Freezeout Lake area, west-central Montana, 1994-95

Table 9. Geometric mean selenium concentrations in biological samples collected from the southern Freezeout Lake area, Montana, 1987-95 (Continued)
Invertebrates
Multiple orders
n
6
6
3
0
0
9
9
3
0
3
Se
9.7 (5.6-18)
2 1.4 (O.5-3.5)
2.2 (2.0-2.3)
. --
22 (14-42)
3.1 (.9-7.6)
5.9 (4.9-6.8)
~
3.4 (3.1-3.9)
Fish
Brook stickleback
n Se
13 20 (6.9-47)
4 5.0 (3.6-7.8)
12 6.5 (2.8-22)
1 17
3 3.0 (1.8-6.5)
9 43 (19-98)
6 8.5 (5.6-12)
15 11 (6.1-19)
0
4 5.2 (4.3-6.1)
Bird eggs
_ . . _. , .... . . Duck (family American Eared grebe Pied-billed grebe . ;.. . ^ Amencancoot
6 ° Anatidae) avocet
n Se n Se n Se n Se n Se
NON-IRRIGATION SEASON0 - 0 - 0 - 0 - 0
0 - 0 0 0 - 0 --
0 - 0 - 0 - 0 - 0
0 0 -- 0 - 0 - 0 -
0 - 0 - 0 - 0 - 0
IRRIGATION SEASON0 - 0 - 0 - 20 8.3 0
(5.3-22)
0 - 0 - 0 - 0 0 -
0 0 - 0 - 0 - 0
21 14 0 - 32 4.6 49 5.0 3 7.2 (10-18) (0.9-10) (2.9-10) (5.1-9.3)
5 14 2 6.4 15 8.0 5 6.5 10 6.4 (10-18) (5.6-7.3) (2.6-13) (5.2-9.4) (4.2-11.7)
were some waterboatmen and multiple-order samples collected during the non-irrigation season (table 9).
Chironomids generally had higher selenium con centrations than waterboatmen. Geometric mean sele nium concentrations in chironomid larvae exceeded those in waterboatmen at each type of site where both were collected, except Pond 5 sites away from mouths of drains during the irrigation season (table 9). Com parisons between selenium concentrations in compos ite samples of multiple orders and samples of chironomid larvae and waterboatmen could not be made, because sufficient biomass of both groups was
not present at the same sites. Samples of chironomid larvae and waterboatmen were collected from most non-drain sites, but only multiple-order composites were collected from the drain sites (table 9). However, samples of waterboatmen and multiple orders collected during the irrigation season at one site (B-42) in Pond 5 had similar selenium concentrations (Kendy and Olsen, 1997, table 14).
Geometric mean selenium concentrations in waterboatmen and multiple-order composite samples consistently were higher during the irrigation season than during the non-irrigation season at all site types.
SELENIUM IN BIOTA 39

However, chironomid-larvae samples did not show the same consistent trend (table 9).
Differences in routes of exposure could account for the observed seasonal differences in selenium con centrations between waterboatmen and chironomid lar vae. The pelagic waterboatmen move freely in the water column and feed on living algae and microinver- tebrates associated with flocculent sediment (Istock, 1973). Feeding on suspended organisms may limit exposure to the higher, more constant concentrations of selenium typically found in bottom sediment compared to water. In contrast, chironomid larvae are detritivores that live buried in sediment (Ward, 1992). Chironomid larvae collected from wetland sites near the mouths of drains, where selenium accumulates in bottom sedi ment, contained higher selenium concentrations than chironomid samples from other sites.
Alternatively, the seasonal differences in sele nium concentrations could be explained by differing life cycles. Waterboatmen sampled during the irriga tion season (August 1995) may have been older than those collected during the non-irrigation season (April 1995) and may have had more time to accumulate sele nium in their tissues. Chironomid larvae collected dur ing the non-irrigation and irrigation seasons also may represent different age classes. Chironomid larvae col lected in April may have overwintered, resulting in selenium exposure for 8 or more months, whereas chi ronomid larvae sampled in August may have hatched from eggs laid earlier in the same season, resulting in a much shorter selenium exposure period.
Fish
Fish were sampled from 16 wetland and drain sites and analyzed as whole-body composites. Fathead minnows (Pimephales promelas), northern redbelly dace (Photinus eos\ and brook sticklebacks (Culaea inconstans) were sampled in 1991-92 (Lambing and others, 1994, table 23); only brook sticklebacks were sampled in 1995 (Kendy and Olsen,1997, table 15). Although this species is not preferred prey for water birds, selenium concentrations in brook sticklebacks are indicative of the degree of bioaccumulation at the highest trophic level that inhabits the drains and wet lands throughout its life cycle.
Selenium concentrations in 66 of the 67 brook- stickleback samples exceeded the 2 ug/g dry weight selenium concentration found by Ohlendorf (1989) to
be the average background concentration for whole- body freshwater fish collected nationwide. Only a sin gle sample collected from site B-42 (Kendy and Olsen, 1997, table 15) had a lower concentration (1.8 ^ig/g dry weight). Selenium concentrations in 36 percent of all brook-stickleback samples collected exceeded the 3.65 fig/g wet weight concentration reported by Schmitt and Brumbaugh (1990) as the maximum background sele nium concentration in freshwater fish collected nation wide [wet-weight concentrations were calculated from dry-weight concentrations reported in Kendy and Olsen (1997, table 15) and Lambing and others (1994, table 23) and unpublished USFWS moisture-content data]. Selenium concentrations in 18 of the 24 stickle
back samples that exceeded 3.65 ng/g wet weight were collected in drains from glacial-lake deposits east of Freezeout Lake; 5 samples were collected from wet lands near mouths of drains, and 1 was collected from Freezeout Lake away from drain mouths.
Selenium concentrations in brook sticklebacks collected from drains conveying water from glacial- lake deposits east of Freezeout Lake were higher than in fish from all other sites during both non-irrigation and irrigation seasons (table 9). The three brook-stick leback samples collected from irrigation-drain site B-4 during the irrigation season contained the highest sele nium concentrations (geometric mean concentration of 94 jig/g dry weight) (Kendy and Olsen, 1997, table 15). Fathead minnows collected from site B-4 also had high selenium concentrations (geometric mean of 19 ng/g) (Lambing and others, 1994, table 23). In addition, this drain site (S-l 1) had the highest selenium concentra tion in bottom sediment (23 ug/g) and high concentra tions in water (12 to 65 ug/L) (Kendy and Olsen, 1997, tables 10 and 12).
Samples of brook sticklebacks collected from all sites contained higher selenium concentrations during the irrigation season than during the non-irrigation sea son. Brook sticklebacks prey on aquatic insect larvae, crustaceans, and other invertebrates. They overwinter in lakes and ascend tributaries to spawn (Wootton, 1976). At Freezout Lake WMA, brook sticklebacks probably spend the spring and early summer spawning period in the drains and then return to the lake by mid summer. Brook sticklebacks collected during the irri gation season may have spent all or part of May, June, and July in the drains, feeding on invertebrates contain ing higher selenium concentrations than those found in Freezeout Lake. The lower selenium concentrations in
40 Detailed study of selenium in glacial-lake deposits, wetlands, and biota associated with irrigation drainage in the southern Freezeout Lake area, west-central Montana, 1994-95

samples collected during non-irrigation season may represent the results of a relatively low-selenium diet in the main lake.
Water-Bird Eggs
Water-bird eggs were collected from five sites in and near wetlands and irrigation drains. Eggs of eared grebes (Podiceps nigricolis), ducks [Family Anatidae, including lesser scaup (Aythya affirms), mallard (Anas platyrhynchos\ northern shoveler (Anas clypeata), redhead (Aythya americana\ ruddy duck (Oxyura jamaicensis), northern pintail (Anas acuta), and teal (Anas sp.)], American coots (Fulica americand), and American avocets (Recurvirostra americana) were collected in 1989-91 (Lambing and others, 1994, tables 24-27). The eggs collected in 1989 were part of another study, but were reported in Lambing and others (1994, table 25). Eggs of pied-billed grebe (Podilym- bus podiceps), American coot, and American avocet were collected in 1995 (Kendy and Olsen, 1997, table 16).
Geometric mean concentrations of selenium in the 164 eggs collected for all species from every type of site exceeded the 3 j^g/g dry weight concentration suggested by Skorupa and others (1996) as the average background concentration in avian eggs (table 9). Fur thermore, selenium concentrations in 92 percent of all .eggs collected exceeded 3 ug/g dry weight and 75 per cent exceeded the 5 jug/g dry weight concentration reported by Skorupa and others (1996) as the maximum background concentration. The maximum selenium concentration (22 jj,g/g dry weight) was in an American avocet egg from an irrigation drain that conveys water from glacial-lake deposits east of Freezeout Lake (site B-36). Geometric mean selenium concentrations in the eggs of pied-billed grebes, American coots, and ducks were similar to those found in American avocets; con centrations in the eggs of eared grebes were somewhat higher.
Bioaccumulation
Selenium concentrations generally were higher in biota than in water and bottom sediment, indicating that selenium is accumulating in the biota of drains and wetlands in the study area (fig. 14). Selenium concen trations were higher in aquatic plants than in the surface
water in which the plants grow. Similarly, selenium concentrations in aquatic invertebrates generally were higher than in water or bottom sediment. Selenium concentrations in fish and bird eggs generally were higher than in aquatic plants and invertebrates, indicat ing that selenium has bioaccumulated in higher trophic level organisms (fig. 14). However, bioaccumulation was less pronounced in bird eggs than in fish. The lower concentrations in bird eggs than in fish may rep resent differences in food habits and migratory behav iors between fish and birds. Although both fish and birds feed on invertebrates, fish are obligate predators, whereas many bird species are not. Some water-bird species (American coot, for example) feed on aquatic vegetation and some ducks (mallard and northern pin tail, for example) feed on upland vegetation to some extent during their breeding seasons. The year-round diet of most duck species is predominantly composed of plant material (Cottam, 1939; Martin and Uhler, 1939). The relatively high selenium concentrations in fish collected from most sites may reflect their use of the drains during their breeding seasons, and their con finement to the lake at other times of the year. In con trast, migratory birds spend their lengthy non-breeding season away from Freezeout Lake in presumably non- seleniferous areas.
Toxicity Risks
Although the selenium data for water, sediment, and biota indicate that selenium bioaccumulates, the question remains whether the observed selenium con centrations pose a risk to biota. To evaluate this ques tion, selenium concentrations in plants, invertebrates, and fish are compared to the critical threshold for waterfowl dietary ingestion (5 |ig/g dry weight) reported by Skorupa and Ohlendorf (1991). Similarly, concentrations in water-bird eggs, or embryos, are compared to the threshold for low water-bird hatchabil- ity (8 fig/g dry weight) reported by Skorupa and Ohlen dorf (1991). Figure 15 summarizes these comparisons by illustrating, for each taxonomic group at each bio logical sampling site, whether the geometric mean sele nium concentration for at least one species exceeded the appropriate concentration threshold for biological impairment. Geometric mean selenium concentrations in at least one species exceeded concentration thresh olds for potential biological impairment at all sites
SELENIUM IN BIOTA 41
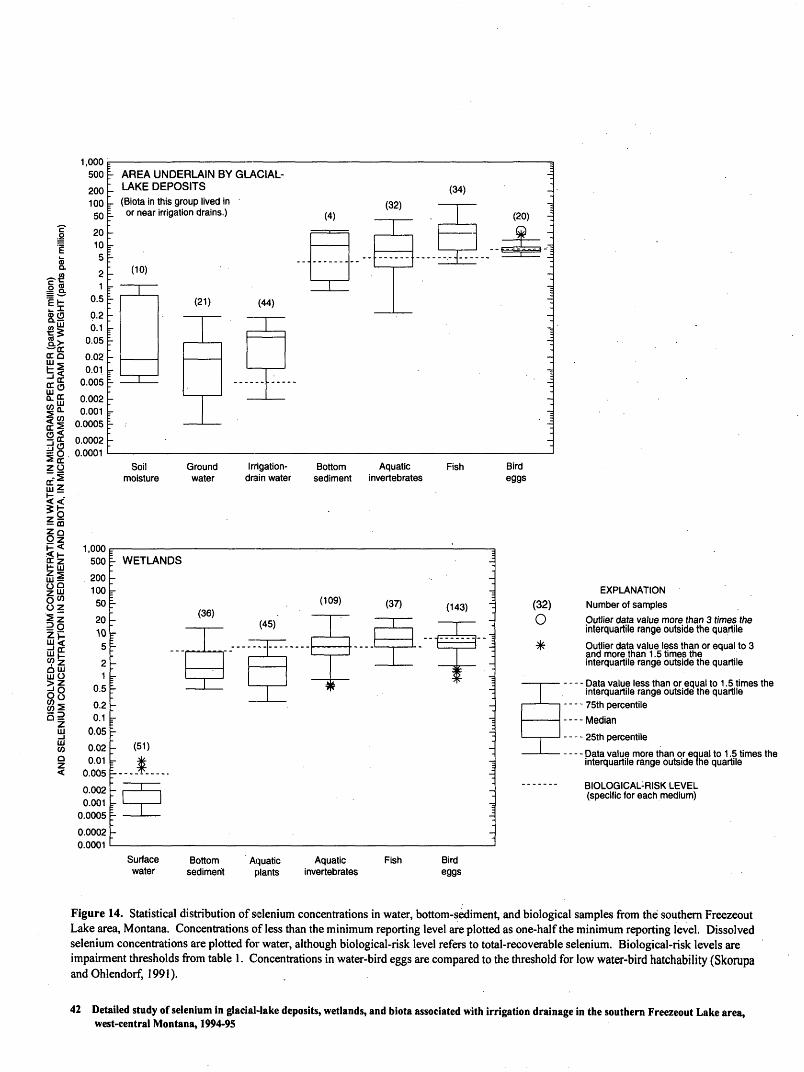
500
200 10050
C ono 201 i.a
|| 11 K o-5<5>O 0.2 11 °' 1§.> 0.05* *" or
0:0 o 02UJ ,- Cb| 0.01erg 0.005LUo- gj 0.002 5 °- 0.001CC fc w.wvw^
§ g 0.0002^ O . 0.0001
ZO
^- AREA UNDERLAIN BY GLACIAL- -= _ LAKE DEPOSITS (34) J
(RiOta in this group liverl in /Q2\L or near irrigation drains.) /4\ /2Q) J
/7\ 2p! -
: J r "i" J :
_ (10) J
r | I 1f (21) (44) . ~
r I -L "-
hr ~
i;
r -j
r : -i
Soil Ground Irrigation- Bottom Aquatic Fish BirdFION IN WATER, IN 1 AND BIOTA, IN MICF
DCONCENTRA-
IN SEDIMENT-L ro 01 c%88 8i
^z 20
zp 10|j rr 5UlECO ~y iQ LU
CO 2 0.252 0.1
LU 0.05
co 0.02 Q 0.01 < 0.005
0.002 0.001
0.0005
0.0002 n nnni
Soil Ground Irrigation- Bottom Aquatic Fish moisture water drain water sediment invertebrates
E- WETLANDS -j
E. (109) /07\ .. , 2 ' ' (143)
~ (45) I I ~r I _
i ...... 1 ' -I : ' ' I ' 1
1 ^r ' _ _|_ * ~-~ j- (si) :r * i-
P iSurface Bottom Aquatic Aquatic Fish Bird water sediment plants invertebrates eggs
Bird eggs
EXPLANATION
(32) Number of samples
O Outlier data value more than 3 times theinterquartile range outside the quartile
^ Outlier data value less than or equal to 3and more than 1 .5 times the interquartile range outside the quartile
interquartile range outside the quartile
- - - - Median
' - - - - Data value more than or equal to 1 .5 times the interquartile range outside the quartile
------- BIOLOGICAL-RISK LEVEL (specific for each medium)
Figure 14. Statistical distribution of selenium concentrations in water, bottom-sediment, and biological samples from the southern Freezeout Lake area, Montana. Concentrations of less than the minimum reporting level are plotted as one-half the minimum reporting level. Dissolved selenium concentrations are plotted for water, although biological-risk level refers to total-recoverable selenium. Biological-risk levels are impairment thresholds from table 1. Concentrations in water-bird eggs are compared to the threshold for low water-bird hatchability (Skorupa and Ohlendorf, 1991).
42 Detailed study of selenium in glacial-lake deposits, wetlands, and biota associated with irrigation drainage in the southern Freezeout Lake area, west-central Montana, 1994-95

except B-l, which conveys water from the Greenfields Bench, and at sites B-l7 and B-41, where only bird eggs were sampled.
Aquatic-plant samples generally had selenium concentrations that were less than the dietary-ingestion threshold for waterfowl (5 ug/g dry weight). However, all six plant samples from one site (B-39) in Freezeout Lake near the mouth of a drain had selenium concentra tions at or above the threshold (Kendy and Olsen, 1997, table 13). These relatively high concentrations in aquatic plants probably are related to selenium from the nearby drain (site S-8), which had some of the highest selenium concentrations in water (9-180 ug/L) and bot tom sediment (13 ug/g) in the study area (Kendy and Olsen, 1997, tables 10 and 12).
Invertebrate samples, particularly chironomids, had selenium concentrations that exceeded the dietary- ingestion threshold for waterfowl of 5 ug/g dry weight at 15 of 16 sites (fig. 15). Geometric mean selenium concentrations in chironomid larvae exceeded the threshold at all site types during both non-irrigation and irrigation seasons, except for site B-42 during the irri gation season (table 9). Selenium concentrations in waterboatmen samples from many sites were at or below the threshold, although most samples collected from wetlands near mouths of drains during the irriga tion season exceeded the threshold.
Composite samples of multiple orders of inverte brates collected from drains from glacial-lake deposits east of Freezeout Lake had geometric mean selenium concentrations that exceeded the dietary-ingestion threshold for waterfowl of 5 ug/g dry weight. The geo metric mean selenium concentration of multiple-order samples collected from wetlands near mouths of drains during the irrigation season also exceeded the thresh old, but to a lesser extent (table 9). The selenium con centration (42 ug/g) of one multiple-order sample from site B-4 exceeded the 30 ug/g dry weight selenium con centration reported by Woock and others (1987) to be associated with reproductive failure or mortality when consumed by fish.
Fish had geometric mean selenium concentra tions that exceeded the 5 ug/g dietary-ingestion thresh old for waterfowl in at least one species collected from 13 of the 16 sites sampled (fig. 15). The only excep tions were samples from wetland sites away from drains (B-38 and B-42) and samples from a drain that conveys water primarily from the Greenfields Bench
(B-1.). All northern redbelly dace and fathead minnows exceeded the threshold (Lambing and others, 1994, table 23), and samples collected from drains from gla cial-lake deposits, particularly sites B-2, B-3, and B-4, greatly exceeded the dietary threshold value.
At least one brook-stickleback sample from every site (Kendy and Olsen, 1997, table 15; Lambing and others, 1994, table 23) equaled or exceeded the dietary-ingestion threshold for waterfowl of 5 ug/g. Geometric mean selenium concentrations for brook sticklebacks collected from most types of sites equaled or exceeded the threshold. The only exception was the geometric mean for Pond 5 during the non-irrigation season (table 9).
Selenium concentrations in most brook stickle backs collected in drains from glacial-lake deposits exceeded the 12 ug/g dry weight concentration Lemly and Smith (1987) reported to be associated with repro ductive failure in sensitive warmwater fish species, as well as the 24 ug/g dry weight concentration that Gillespie and Baumann (1986) found to produce blue- gill (Lepomis macrochirus) larvae that did not survive to the swim-up stage. However, brook sticklebacks are abundant in the study area. Although selenium concern levels in brook sticklebacks were exceeded, effects of the elevated selenium concentrations oh reproduction of the native brook stickleback at Freezout Lake WMA were not apparent.
Brook sticklebacks are small, short-lived fish; the great majority of those breeding are thought to be 1 year old and in no case older than 3 years. All of the sticklebacks alive in 1991 must have died and been replaced by young fish by 1995. Therefore, sufficient reproduction must have taken place to maintain the stocks during that period. It is possible that the appar ently breeding fish collected from the high-selenium sites were recruited from other, low-selenium sites, and that no reproduction occurs at the high-selenium sites. However, the limited and anecdotal information avail able for other species of sticklebacks suggests that adult fish return to the site of their birth to breed (Woot- ton, 1976).
In contrast, Nimick and others (1996) reported no evidence of successful reproduction by the non- native fish collected from Priest Butte Lakes, a saline and seleniferous wetland 5 miles north of the study area (fig. 1). Unlike the non-native fish species in Priest Butte Lakes, brook sticklebacks belong to a family that
SELENIUM IN BIOTA 43

R.4W. II2°02'30" R.3W.
47°40
T. 22 N.
47°37'30" -
Freezout Lake Wildlife Management Area
Base modified from U.S. Geological Survey Cliev, 1983; Fairfield, 1983; Freezeout Lake, 1987; and Lowry, 1987,1:24,000
0.5l
1MILE J
0.5n
1 KILOMETER
Figure 15. Biological sampling sites where geometric mean selenium concentration in at least one species exceeded the concentration threshold for biological impairment in the southern Freezeout Lake area, Montana. Selenium concentrations in aquatic plants, invertebrates, and fish are compared to the critical threshold for waterfowl dietary ingestion (5 ^g/g dry weight) reported by Skorupa and Ohlendorf (1991). Concentrations in water-bird eggs are compared to the threshold for low water-bird hatchability (8 ng/g dry weight) reported by Skorupa and Ohlendorf (1991).
44 Detailed study of selenium in glacial-lake deposits, wetlands, and biota associated with irrigation drainage in the southern Freezeout Lake area, west-central Montana, 1994-95
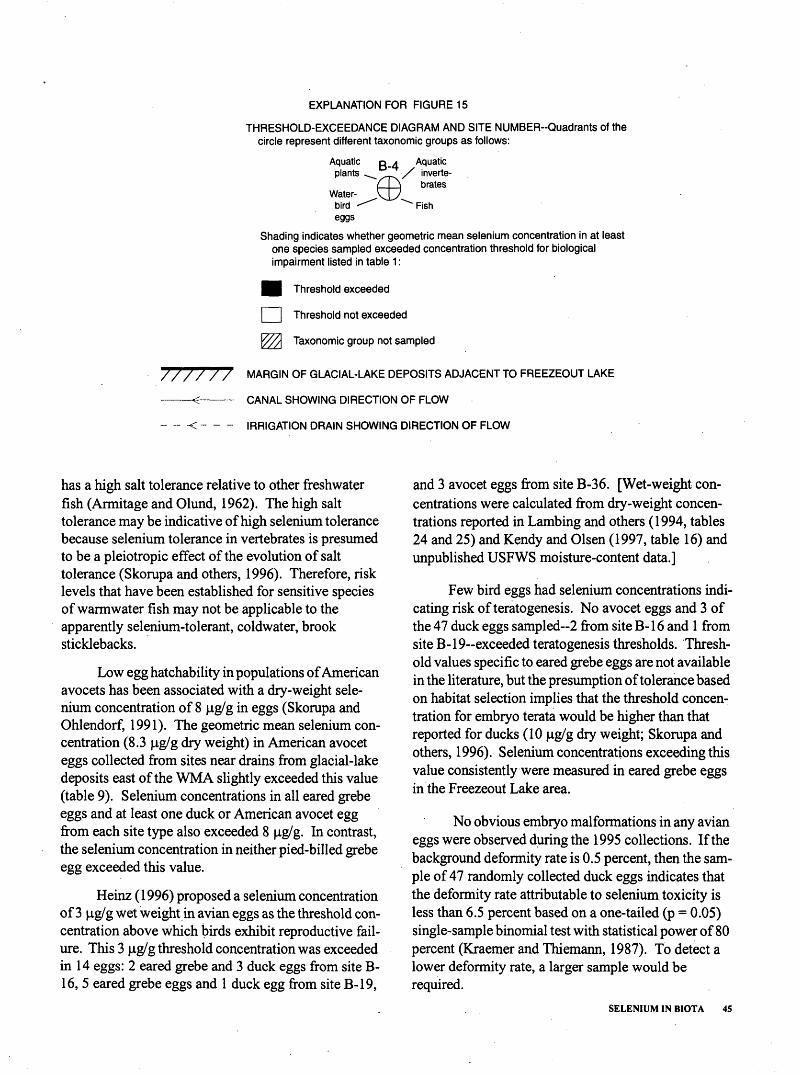
EXPLANATION FOR FIGURE 15
THRESHOLD-EXCEEDANCE DIAGRAM AND SITE NUMBER-Quadrants of the circle represent different taxonomic groups as follows:
Aquatic DA plants
Water- bird eggs
Aquatic inverte- brates
Fish
Shading indicates whether geometric mean selenium concentration in at least one species sampled exceeded concentration threshold for biological impairment listed in table 1 :
Threshold exceeded
| [ Threshold not exceeded
Y//X Taxonomic group not sampled
// / / / / MARGIN OF GLACIAL-LAKE DEPOSITS ADJACENT TO FREEZEOUT LAKE
^ CANAL SHOWING DIRECTION OF FLOW
_._.<___. IRRIGATION DRAIN SHOWING DIRECTION OF FLOW
has a high salt tolerance relative to other freshwater fish (Armitage and Olund, 1962). The high salt tolerance may be indicative of high selenium tolerance because selenium tolerance in vertebrates is presumed to be a pleiotropic effect of the evolution of salt tolerance (Skorupa and others, 1996). Therefore, risk levels that have been established for sensitive species of warmwater fish may not be applicable to the apparently selenium-tolerant, coldwater, brook sticklebacks.
Low egg hatchability in populations of American avocets has been associated with a dry-weight sele nium concentration of 8 ug/g in eggs (Skorupa and Ohlendorf, 1991). The geometric mean selenium con centration (8.3 jig/g dry weight) in American avocet eggs collected from sites near drains from glacial-lake deposits east of the WMA slightly exceeded this value (table 9). Selenium concentrations in all eared grebe eggs and at least one duck or American avocet egg from each site type also exceeded 8 ug/g. In contrast, the selenium concentration in neither pied-billed grebe egg exceeded this value.
Heinz (1996) proposed a selenium concentration of 3 jxg/g wet weight in avian eggs as the threshold con centration above which birds exhibit reproductive fail ure. This 3 ng/g threshold concentration was exceeded in 14 eggs: 2 eared grebe and 3 duck eggs from site B- 16, 5 eared grebe eggs and 1 duck egg from site B-19,
and 3 avocet eggs from site B-36. [Wet-weight con centrations were calculated from dry-weight concen trations reported in Lambing and others (1994, tables 24 and 25) and Kendy and Olsen (1997, table 16) and unpublished USFWS moisture-content data.]
Few bird eggs had selenium concentrations indi cating risk of teratogenesis. No avocet eggs and 3 of the 47 duck eggs sampled~2 from site B-16 and 1 from site B-19~exceeded teratogenesis thresholds. Thresh old values specific to eared grebe eggs are not available in the literature, but the presumption of tolerance based on habitat selection implies that the threshold concen tration for embryo terata would be higher than that reported for ducks (10 ug/g dry weight; Skorupa and others, 1996). Selenium concentrations exceeding this value consistently were measured in eared grebe eggs in the Freezeout Lake area.
No obvious embryo malformations in any avian eggs were observed during the 1995 collections. If the background deformity rate is 0.5 percent, then the sam ple of 47 randomly collected duck eggs indicates that the deformity rate attributable to selenium toxicity is less than 6.5 percent based on a one-tailed (p = 0.05) single-sample binomial test with statistical power of 80 percent (Kraemer and Thiemann, 1987). To detect a lower deformity rate, a larger sample would be required.
SELENIUM IN BIOTA 45

Nimick and others (1996, p. 86) reported a com plete absence of overt embryo malformations in 164 embryos of 7 species and concluded that embryo via bility was within the expected range for healthy popu lations. Duck nest success (41-43 percent; Nimick and others, 1996) greatly exceeded the 15-20 percent thought necessary to maintain viable populations in prairie wetlands and exceeded all reported nest success rates for the north-central United States (Klett and oth ers, 1988). The sample set examined by Nimick and others (1996) was composed of eggs collected from throughout the Freezout WMA, including nests near the highly seleniferous Priest Butte Lakes.
Therefore, although selenium concentrations in bird eggs collected from Freezout Lake WMA are ele vated compared to national background concentra tions, the only indication that water birds may be adversely affected were the nominally elevated (more than 3 ug/g wet weight) selenium concentrations in 14 bird eggs from several sites. Whether exceedances of this level indicate any real threat to populations of water birds at Freezout Lake WMA is unknown. No indication of reproductive impairment in water-bird populations was observed (Nimick and others, 1996). Other investigators (Skorupa and others, 1996) have found no indications of toxicity in populations of American avocets whose eggs contained much higher selenium concentrations than were found in this study.
In summary, any organism whose life history brings it into contact with irrigation drains from gla cial-lake deposits, or with wetlands near the mouths of these drains, is potentially at risk of exposure to high selenium concentrations in water, sediment, and food. However, no overt indications of reproductive impair ment were observed in the fish populations inhabiting the drains and wetlands, nor in water-bird populations nesting nearby. Perhaps the chemical environment of the drains prohibits their use by taxa that would other wise inhabit them if selenium concentrations in sedi ment, water, or biota were lower. The present distribution and abundance of plants and animals at Freezout Lake WMA may represent the results of past exposure to increased levels of selenium. The drains, in particular, may be inhabited only by species that can tolerate high body burdens of selenium.
The bird species that were sampled during this study use the lakes more frequently than the irrigation drains. For example, avocets primarily use shorelines,
and grebes nest on emergent vegetation in the lakes. In contrast, some migratory birds such as Forster's terns (Sterna forsteri), common terns (Sterna hirundd), many swallows (Hirundinidae family), yellow-headed blackbirds (Xanthocephalus xanthocephalus), and red- winged blackbirds (Agelaiusphoeniceus) may be more frequent users of the drains, where they could be exposed to harmful selenium concentrations in food or water. Because these migratory bird populations may have had no evolutionary history of exposure to seleniferous environments, they may lack tolerance to selenium. Therefore, elevated body burdens of sele nium in invertebrates and fish might pose a threat to migratory birds if they forage in the drains during their migration or breeding seasons.
EFFECTS OF IRRIGATION PRACTICES ON SELENIUM MOBILIZATION AND ACCUMULATION
Before irrigation, the area currently in Freezout Lake WMA was a closed basin that, at times, became completely dry. Natural vegetation consumed much of the precipitation that fell in the basin, leaving little excess water to percolate through the seleniferous gla cial-lake deposits. Most of the glacial-lake deposits probably were unsaturated, as they currently are, in places, during the non-irrigation season. Any ground water in the glacial-lake deposits likely would have been seleniferous, as it is today. This ground water probably discharged through evapotranspiration in low-lying areas of the basin or directly into the ephem eral lake, father than into irrigation drains. Selenium- rich salts may have formed during dry periods in the low-lying areas, and precipitation runoff may have flushed these salts to the ephemeral lake. If the ephem eral lake contained organic-rich, reduced sediment, any selenium in ground water that discharged directly to the lake likely would have been reduced to an insoluble species and immobilized deep in the sediment, below the depth of biological activity. Because little precipi tation actually infiltrated into ground water, the net effect probably was limited transport of selenium from glacial-lake deposits to the ephemeral lake.
With development of irrigation and the conse quent inflow of irrigation drainage to the WMA, the area of wetlands has increased and water levels have
46 Detailed study of selenium in glacial-lake deposits, wetlands, and biota associated with irrigation drainage in the southern Freezeout Lake area, west-central Montana, 1994-95
been sustained. At the same time, more selenium prob ably has been mobilized from the glacial-lake deposits into the wetlands because a larger quantity of water moves through the seleniferous deposits than before irrigation began. Open irrigation drains were con structed to control the waterlogging caused by irriga tion. Biological exposure to selenium is high in these drains. Exposure to dissolved selenium in the wetlands is less because, of the lower dissolved-selenium con centrations in lake water than in drains. Upon dis charging to wetlands, selenate is reduced to relatively insoluble selenium species that accumulate in bottom sediment, particularly at the mouths of irrigation drains. Although selenium concentrations in sediment are not excessively high, they are higher than the 4 Hg/g threshold for potential reproductive failure in water birds and fish (Lemly and Smith, 1987) in some areas near mouths of drains. Benthic invertebrates and aquatic plants that live in enriched bottom sediment may have increased exposure to selenium.
Solid-phase sulfate data indicate that the reser voir of soluble selenium in glacial-lake deposits proba bly has been reduced, but not eliminated, during the past 68 years of irrigation. Therefore, if flood-irriga tion practices were to predominate in the future, then selenium concentrations in drain water probably would remain about at the levels measured during this study. Concentrations in bottom sediment potentially could increase as selenium continues to be delivered and accumulate in wetlands. Concentrations in some biota likely would remain at current levels if selenium con centrations in surface water remain unchanged. How ever, concentration increases in bottom sediment may result in concentration increases in biota, such as chi- ronomid larvae, that are associated with sediment.
Ongoing efforts to conserve irrigation water effectively reduce the amount of water that infiltrates through glacial-lake deposits and discharges to irriga tion drains. For example, efforts are underway to line irrigation canals to reduce seepage, and many farms recently have converted from flood irrigation to more efficient sprinkler irrigation. In areas (such as site W- 59) where irrigation water currently is applied only by sprinkling, the water table remains low enough (deeper than 11 ft below land surface) to prevent waterlogging, thereby significantly reducing discharge to irrigation drains throughout the irrigation season. Evapoconcen- tration is less effective when the water table is deep, so selenium concentrations in ground water might
decrease if sprinkling becomes the norm. If flows and concentrations both decrease, then selenium loading to wetlands would be reduced. On the other hand, reduc ing the amount of ground-water recharge from flood irrigation would reduce the hydraulic gradient toward the wetlands, which would increase the residence time of ground water in glacial-lake deposits. This could result in less water, but with higher selenium concen trations, in the irrigation drains than was observed dur ing this study.
Because ground water moves slowly through the glacial-lake deposits, the water samples collected from irrigation drains during this study likely represent the effects of past land-use practices dominated by flood irrigation. The effects of water conservation will begin to manifest themselves as changes in drain-water qual ity in the coming years. In the future, periodic monitor ing of the quality of water in the irrigation drains could quantify the effects of conserving irrigation water on selenium concentrations and loading to Freezeout Lake. Also, future monitoring of water birds that use the drains would help to assess the long-term effects of bioaccumulation.
Therefore, although irrigation water is not the source of selenium, past irrigation practices have mobi lized naturally occurring selenium from glacial-lake deposits and made it biologically available, primarily in irrigation drains and in wetlands at the mouths of drains. Modifying irrigation practices to reduce irriga tion drainage potentially could decrease biological exposure to selenium by reducing selenium loading to wetlands, but could concurrently increase selenium concentrations in irrigation drains.
SUMMARY AND CONCLUSIONS
The southern part of the Freezout Lake WMA has been studied as part of the DOI National Irrigation Water Quality Program to address water-quality prob lems related to irrigation drainage. This report presents the interpretive results of a detailed study completed in 1995 to determine the distribution, mobilization, and accumulation of selenium associated with irrigation drainage. Results of a 1986-87 reconnaissance study and a 1990-92 detailed study of the Sun River Irrigation Project indicated that glacial-lake deposits are the pri mary source of selenium to the wetlands and biota. Interpretations presented in this report are based on data obtained in 1986-95 from 25 soil or drill-core
SUMMARY AND CONCLUSIONS 47
sites, 5 soil-moisture sites, 8 ground-water sites, 30 sur face-water sites, 35 bottom-sediment sites, and 21 bio logical sites.
The southern part of Freezout Lake WMA is bor dered on the south and east by seleniferous glacial-lake deposits that underlie irrigated land. Precipitation and selenium-free irrigation water infiltrate and dissolve naturally occurring selenium from the heterogeneous glacial-lake deposits. Selenium-rich ground water then moves through the glacial-lake deposits into irrigation drains. The irrigation drains discharge into the wet lands of Freezeout Lake and Pond 5 in the WMA. In the wetlands, selenium is removed from water and accumulates hi bottom sediment and biota.
The predominant factors affecting the distribu tion of selenium in glacial-lake deposits are not well known. Selenium concentrations in soil do not appear to correlate with soil series or land use. However, sele nium concentrations in glacial-lake deposits generally are higher east of Freezeout Lake than south of the lake. Sulfate-sulfur in glacial-lake sediments appears to be partially depleted in irrigated areas compared to non- irrigated areas, indicating that infiltrated irrigation water has removed some, but not all, of a slowly dimin ishing reservoir of selenium in soluble salts such as gypsum that existed prior to irrigation.
The quality of soil moisture and ground water is governed by hydrogeochemical processes that are com mon throughout the glacial-lake deposits. Selenium dissolved from glacial-lake deposits is added to soil moisture and ground water, and evaporation from the root zone further increases selenium concentrations. Maximum concentrations were 1,100 ug/L in soil moisture and 190 ug/L in ground water. Redox condi tions are important in controlling selenium mobiliza tion and transport; most selenium in ground water is present as the mobile, oxidized species, selenate.
Selenium in irrigation drainage is derived prima rily from ground-water discharge. The U.S. Environ mental Protection Agency and the Montana Depart- .ment of Environmental Quality have established an acute-toxicity standard for aquatic life of 20 (ig/L. This standard was exceeded in water from all four sampled drains that convey water primarily from glacial-lake deposits; the highest concentration measured was 180 ug/L. During the irrigation season, selenium concen trations in irrigation drainage were lower than during the non-irrigation season because of increased flow
caused by irrigation. Selenium loads in irrigation drain-water were highest at the beginning of the irriga tion season.
Irrigation drainage discharges into wetlands in Freezout Lake WMA. The average annual load of sele nium from irrigated glacial-lake deposits to Freezout Lake WMA wetlands is about 200 Ib, or 0.06- 0.08 Ib/acre of irrigated land.
In wetlands of the Freezout Lake WMA, sele nium discharged from irrigation drains is converted rapidly by biogeochemical processes from soluble, oxi dized selenate to insoluble, reduced selenium species, which accumulate in the reduced, organic-rich bottom sediment. Consequently, selenium concentrations are low in lake water (less than 3 ug/L), except in small areas near the mouths of drains, and selenium concen trations are high in bottom sediment (as high as 13 jug/g in Freezeout Lake and 23 jag/g in an irrigation drain). Selenium concentrations are higher in bottom sediment than in local soils, indicating that selenium has accumulated in bottom sediment. Approximately 11,000 Ib of selenium have accumulated in bottom sed iment in southern Freezeout Lake and Pond 5 since 1927, when irrigation began.
Selenium concentrations generally were higher in biota than in water and bottom sediment, indicating that selenium is bioaccumulating in the drains and wet lands of the study area. Selenium concentrations were higher in aquatic plants than in surface water, generally higher in aquatic invertebrates than in water or bottom sediment, and generally higher in fish and bird eggs, than in aquatic plants and invertebrates.
Biota samples typically had higher selenium concentrations than national average background con centrations. More than 60 percent of filamentous-algae samples from wetland sites exceeded the average back ground concentration of 0.5 (ig/g dry weight. Geomet ric mean selenium concentrations in invertebrate samples from almost all site types exceeded the aver age background concentration range of 0.5 to 2.0 ng/g dry weight. Ninety-eight percent of the whole-body brook-stickleback samples exceeded the average back ground concentration of 2 ug/g dry weight. Selenium concentrations in 92 percent of the water-bird eggs exceeded the average background concentration of 3 |ig/g dry weight.
Most invertebrate and fish samples collected from irrigation drains that convey water from glacial-
48 Detailed study of selenium in glacial-lake deposits, wetlands, and biota associated with irrigation drainage in the southern Freezeout Lake area, west-central Montana, 1994-95

lake deposits, and from wetlands at the mouths of those drains, had selenium concentrations that exceeded the critical threshold concentration for waterfowl dietary ingestion of 5 |ig/g dry weight. Therefore, any organ ism whose life-history characteristics bring it into con tact with irrigation drains from glacial-lake deposits, or with wetlands near the mouths of these drains, is poten tially at risk of exposure to high selenium concentra tions in water, sediment, and food. Yet, no overt indications of reproductive impairment were observed in water birds nesting near the drains and wetlands. Embryo viability, as well as nesting and hatching suc cess rates, were within the expected range for healthy populations. Furthermore, reproductive impairment was not evident in brook stickleback fish, based on abundant populations in the drains. However, recruit ment of healthy individuals to the populations in the drains cannot be excluded as an explanation for the presence of abundant fish at those sites.
The present faunal composition and distribution at Freezout Lake WMA may represent the results of past exposure to increased levels of selenium. Inverte brate and fish species that currently inhabit the drains apparently are tolerant of seleniferous environments.
Although irrigation water is not the source of selenium, irrigation practices have mobilized naturally occurring selenium from glacial-lake deposits and made it biologically available, primarily in irrigation drains and in wetlands at the mouths of drains. Ongo ing efforts to conserve irrigation water will reduce irri gation drainage and potentially could decrease biological exposure to selenium by reducing selenium loading to wetlands, but could concurrently increase selenium concentrations in irrigation drains.
REFERENCES CITED
Armitage, K.B., and Olund, L.J., 1962, Salt tolerance of the brook stickleback: American Midland Naturalist, v. 68, p. 274-277.
Ball, J.W., and Nordstrom, D.K., 1991, User's manual for WATEQ4F, with revised thermodynamic data base and test cases for calculating speciation of major, trace, and redox elements in natural waters: U.S. Geological Survey Open-File Report 91-183, 193 p.
Berg, C.O., 1949, Limnological relations of insects to plants of the genus Potamogeton: Transactions of the American Microscopical Society, v. 68, p. 279-291.
Colton, R.B., Lemke, R.W., and Lindvall, R.M., 1961, Glacial map of Montana east of the Rocky Mountains: U.S. Geological Survey Miscellaneous Investigations Map 1-327, scale 1:500,000.
Cottam, Clarence, 1939, Food habits of North American diving ducks: U.S. Department of Agriculture Technical Bulletin No. 643, 140 p.
Ellig, L.J., 1955, Waterfowl relationships to Greenfields Lake, Teton County, Montana: Montana Fish and Game Department Technical Bulletin no. 1, 35 p.
Fabry, Judith, 1994, Enlightened selfishness-Great Falls and the Sun River Project: Montana~the Magazine of Western History, v. 44, no. 1, p. 14-27.
Gillespie, R.B., and Baumann, P.C., 1986, Effects of high tissue concentrations of selenium on reproduction by bluegills: Transactions of the American Fisheries Society, v. 115, p. 208-213.
Heinz, G.H., 1996, Selenium in birds, in Beyer, W.N., Heinz, G.H., and Redmon-Norwood, A.W., eds., Environmental contaminants in wildlife-interpreting tissue concentrations: Boca Raton, Fla., CRC Press, Inc., p. 447-458.
Helsel, D.R., and Hirsch, R.M., 1992, Statistical methods in water resources: New York, Elsevier Science Publishers, 522 p.
Istock, C.A., 1973, Population characteristics of a species ensemble of waterboatmen (Corixidae): Ecology, v. 54, p. 535-544.
Kendy, Eloise, and Olsen, Bill, 1997, Physical, chemical, and biological data associated with irrigation drainage in the Freezeout Lake area, west-central Montana, 1994-95: U.S. Geological Survey Open-File Report 97-349,46 p.
Klett, A.T., Shaffer, T.L., and Johnson, D.H., 1988, Duck nest success in the prairie pothole region: Journal of Wildlife Management, v. 52, p. 431-440.
Knapton, J.R., Jones, WE., and Sutphin, J.W., 1988,Reconnaissance investigation of water quality, bottom sediment, and biota associated with irrigation drainage in the Sun River area, west-central Montana, 1986-87: U.S. Geological Survey Water-Resources Investi gations Report 87-4244, 78 p.
Kraemer, H.C., and Thiemann, Sue, 1987, How many subjects? Statistical power analysis in research: Newbury Park, Calif, Sage Publications, 120 p.
Krull, J.N., 1970, Aquatic plant-macroinvertebrate associations and waterfowl: Journal of Wildlife Management, v. 34, p. 707-718.
REFERENCES CITED 49

Lambing, J.H., Nimick, D.A., Knapton, J.R., and Palawski, D.U., 1994, Physical, chemical, and biological data for detailed study of the Sun River Irrigation Project, Freezout Lake Wildlife Management Area, and Benton Lake National Wildlife Refuge, west-central Montana, 1990-92, with selected data for 1987-89: U.S. Geological Survey Open-File Report 94-120, 171 p.
Lemly, A.D., 1993, Guidelines for evaluating selenium data from aquatic monitoring and assessment studies: Environmental Monitoring and Assessment, v. 28, p. 83-100.
Lemly, A.D., and Smith, G.J., 1987, Aquatic cycling of selenium Implications for fish and wildlife: U.S. Fish and Wildlife Service Fish and Wildlife Leaflet 12,10 p.
Long, R.H.B., Benson, S.M., Tokunaga, T.K., and Yee, A.W., 1990, Selenium immobilization in a pond system at Kesterson Reservoir: Journal of Environmental Quality, v. 19, p. 302-311.
Maier, K.J., and Knight, A.W., 1994, Ecotoxicology of selenium in freshwater systems: Reviews of Environmental Contamination and Toxicology, v. 134, p. 31-48.
Martin, A.C., and Uhler, P.M., 1939, Food of game ducks in the United States and Canada: U.S. Department of Agriculture Technical Bulletin No. 634, 306 p.
Maughan, E.K., 1961, Geologic map of the Vaughn quadrangle, Montana: U.S. Geological Survey Geologic Quadrangle Map GQ-135, scale 1:62,500.
McNeal, J.M., and Balistrieri, L.S., 1989, Geochemistry and occurrence of selenium--An overview, in Jacobs, L.W., ed., Selenium in agriculture and the environment: Soil Science Society of America Special Publication 23, p. 1-13.
Montana Department of Environmental Quality, 1995, Montana numeric water quality standards: Helena, Mont., Water Quality Division, Circular WQB-7, 39 p.
Mudge, M.R., Earhart, R.L., Whipple, J.W., and Harrison, J.E., 1983, Geologic and structure maps of the Choteau 1 x° x 2° quadrangle, northwestern Montana: U.S. Geological Survey Miscellaneous Investigations Series Map 1-1300,2 sheets, scale 1:250,000.
National Oceanic and Atmospheric Administration, issued annually, Climatological data annual summary, Montana: Asheville, N.C., ISSN 0145-0395.
_____1995, Climatological data, Montana: Asheville, N.C., ISSN 0145-039,5, v. 98, no. 3-8.
Nimick, D.A., Lambing, J.H., Palawski, D.U., and Malloy, J.C., 1996, Detailed study of selenium in soil, water, bottom sediment, and biota in the Sun River Irrigation Project, Freezout Lake Wildlife Management Area, and Benton Lake National Wildlife Refuge, west-central Montana, 1990-92: U.S. Geological Survey Water- Resources Investigations Report 95-4170,120 p.
Ohlendorf, H.M., 1989, Bioaccumulation and effects of selenium in wildlife, in Jacobs, L.W., and others, eds., Selenium in agriculture and the environment: Soil Science Society of America Special Publication 23, p. 133-177.
Ohlendorf, H.M., Skorupa, J.P., Saiki, M.K., and Barnum, D.A., 1993, Food-chain transfer of trace elements to wildlife, i/i Alien, R.G., andNeale, C.M.U., eds., Management of irrigation and drainage systems- Integrated perspectives, Proceedings of 1993 National Conference on Irrigation and Drainage Engineering, Park City, Utah, July 21-23, 1993: New York, American Society of Civil Engineers, p. 596-603.
Oremland, R.S., Steinberg, N.A., Maest, A.S., Miller, L.G., and Hollibaugh, J.T., 1990, Measurement of in situ rates of selenate removal by dissimilatory bacterial reduction in sediments: Environmental Science and Technology, v. 24, p. 1157-1164.
Oremland, R.S., Steinberg, N.A., Presser, T.S., and Miller, L.G., 1991, In situ bacterial selenate reduction in the agricultural drainage systems of western Nevada: Applied and Environmental Microbiology, v. 57, p. 615-617.
Peterson, J.A., and Nebeker, A.V., 1992, Estimation of waterborne selenium concentrations that are toxicity thresholds for wildlife: Archives of Environmental Contaminant Toxicology, v. 23, p. 154-162.
Saiki, M.K., and Lowe, T.P., 1987, Selenium in aquatic organisms from subsurface agricultural drainage water, San Joaquin Valley, California: Archives of Environmental Contamination and Toxicology, v. 16, p. 657-670.
Schmitt, C.J., and Brumbaugh, W.G., 1990, NationalContaminant Biomonitoring Program-Concentrations of arsenic, cadmium, copper, lead, mercury, selenium, and zinc in U.S. freshwater fish, 1976-1984: Archives of Environmental Contamination and Toxicology, v. 19, p. 731-747.
Schuler, C.A., Anthony, R.G., and Ohlendorf, H.M., 1990, Selenium in wetlands and waterfowl foods at Kesterson Reservoir, California, 1984: Archives of Environ mental Contamination and Toxicology, v. 19, p. 845- 853.
Serie, J.R., and Swanson, G.A., 1976, Feeding ecology of breeding gadwalls on saline wetlands: Journal of Wildlife Management, v. 40, p. 69-81.
Skorupa, J.P., Morman, S.P., and Sefchick-Edwards, J.S., 1996, Guidelines for interpreting selenium exposures of biota associated with nonmarine aquatic habitats: U.S. Fish and Wildlife Service, Sacramento Field Office, 74 p.
50 Detailed study of selenium in glacial-lake deposits, wetlands, and biota associated with irrigation drainage in the southern Freezeout Lake area, west-central Montana, 1994-95

Skorupa, J.P., and Ohlendorf, H.M., 1991, Contaminants in drainage water and avion risk thresholds, in Dinar, A., and Zilberman, D., eds., The economics and management of water and drainage in agriculture: Boston, Kluwer Academic Publishers, p. 345-368.
Szafranski, Keith, 1992, Birder's guide to Freezeout Lake Wildlife Management Area, Montana: Wildbird, September 1992, p. 45-49.
Thompson-Eagle, E.T., and Frankenberger, W.T., Jr., 1991, Selenium biomethylation in an alkaline, saline environment: Water Research, v. 25, p. 231-240.
Tokunaga, T.K., Lipton, D.S., Benson, S.M., Yee, A.W., Oldfather, J.M., Duckart, P.W.J., and Halvorsen, K.E., 1991, Soil selenium fractionation, depth profiles and time trends in a vegetated site at Kesterson Reservoir: Water, Air, and Soil Pollution, v. 57-58, p. 31-41.
U.S. Environmental Protection Agency, 1986, Quality criteria for water 1986: Washington, D.C., Office of Water Regulations and Standards, EPA 440/5/86-001, variously paged.
Ward, J.V., 1992, Aquatic insect ecology--!. Biology and habitat: New York, John Wiley and Sons, Inc., 438 p.
Weres, Oleh, Bowman, H.R., Goldstein, Aaron, Smith, E.G., and Tsao, Leon, 1990, The effect of nitrate and organic matter upon mobility of selenium in groundwater and in a water treatment process: Water, Air, and Soil Pollution, v. 49, p. 251-272.
Weres, Oleh, Jaouni, Abdur-Rahim, and Tsao, Leon, 1989, The distribution, speciation and geochemical cycling of selenium in a sedimentary environment, Kesterson Reservoir, California, U.S.A.: Applied Geochemistry, v. 4, p. 543-563.
White, A.F., Benson, S.M., Yee, A.W., Wollenberg, H.A., Jr., and Flexser, Steven, 1991, Groundwater contamination at the Kesterson Reservoir, California, 2~Geochemical parameters influencing selenium mobility: Water Resources Research, v. 27, p. 1085- 1098.
Woock, S.E., Garrett, W.R., Partin, W.E., and Bryson, W.T., 1987, Decreased survival and teratogenesis during laboratory selenium exposures to bluegill, Lepomis macrochiris: Bulletin of Environmental Contamination and Toxicology, v. 39, p. 998-1005.
Wootton, R.J., 1976, The biology of the sticklebacks: New York, Academic Press, 387 p.
Zhang, YiQiang, and Moore, J.N., 1996, Selenium fractionation and speciation in a wetland system: Environmental Science and Technology, v. 30, no. 8, p. 2613-2619.
___1997a, Environmental conditions controlling selenium volatilization from a wetland system: Environmental Science and Technology, v. 31, p. 511- 517.
___1997b, Reduction potential of selenate in wetland sediment: Journal of Environmental Quality, v. 26, p. 910-916.
___1997c, Interaction of selenate with a wetlandsediment: Applied Geochemistry, v. 12, p. 685-691.
___1998, Selenium accumulation in a wetland channel, Benton Lake, Montana, in Frankenberger, W.T., Jr., and Engberg, R.A., eds., Environmental chemistry of selenium: New York, Marcel Dekker, Inc, p. 243-257.
Fifcj Printed on Recycled Piper
*U.S. GOVERNMENT PRINTING OFFICE: 1999-844-626 REFERENCES CITED 51