detailed project report on selai gadadhar integrated watershed ...
83
1 DETAILED PROJECT REPORT ON SELAI GADADHAR INTEGRATED WATERSHED MANAGEMENT PROJECT OF DHUBRI DISTRICT UNDER THE DEPARTMENT OF LAND RESOURCES MINISTRY OF RURAL DEVELOPMENT GOVERNMENT OF INDIA NEW DELHI PREPARED & SUBMITTED TO STATE LEVEL NODAL AGENCY INTEGRATED WATERSHED MANAGEMENT PROGRAMME GOVERNMENT OF ASSAM BY BS CONSULTANTS 128, RAJGARH ROAD, 2 nd FLOOR, GUWAHATI-781 007
Transcript of detailed project report on selai gadadhar integrated watershed ...
1
DETAILED PROJECT REPORT
ON SELAI GADADHAR INTEGRATED WATERSHED
MANAGEMENT PROJECT OF DHUBRI DISTRICT
UNDER
THE DEPARTMENT OF LAND RESOURCES MINISTRY OF RURAL DEVELOPMENT
GOVERNMENT OF INDIA NEW DELHI
PREPARED & SUBMITTED
TO
STATE LEVEL NODAL AGENCY INTEGRATED WATERSHED MANAGEMENT
PROGRAMME GOVERNMENT OF ASSAM
BY
BS CONSULTANTS 128, RAJGARH ROAD, 2nd FLOOR,
GUWAHATI-781 007
2
PROJECT AT A GLANCE 1. Name of project : Selai Gadadhar Integrated Watershed Management Project Code No: 3A1E3 2. Name of the State : Assam (Code No. 18) 3. Name of the State Level Nodal Agency: Department of Soil Conservation, Government of Assam 4. Name of the District : Dhubri (Code No: 2) 5. Name of the Development Block :1. Debitola Development Block 2. Rupsi Development Block 6. Name of Gaon Panchyats : 1. Uttar Geramari, 2. Alomganj, 3. Chapgarh
4. Madhusoulmari 5. Selairpar, 6. Folimari,
7. Asharikandi
7. Numbers of villages covered : 30 Nos. 8. Name of Micro Watershed : 1. Selai
2. Gadadhar 3. Tiamari 9. Total Geographical area of the project : 5392 ha. 10. Area proposed to be treated : 3160.88 ha. 11. Total project cost : Rs. 379.31 Lakh 12. Name & Address of PIA : Divisional Soil Conservation Officer, Barpeta
3
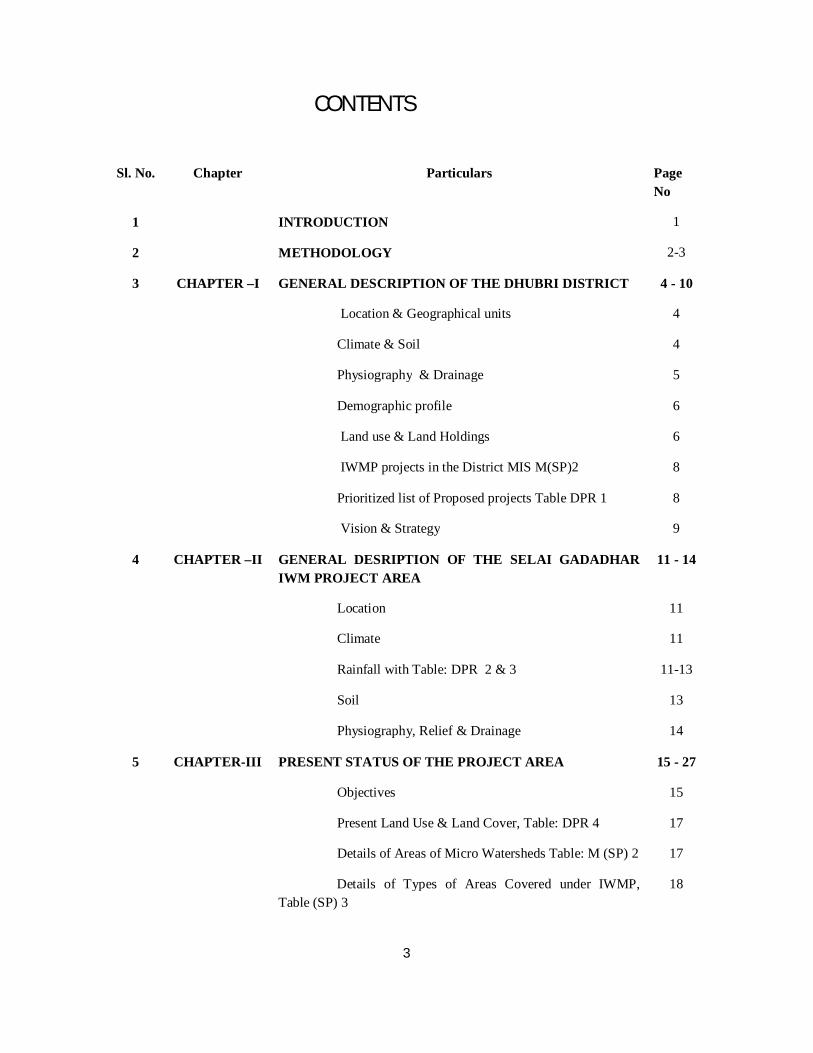
CONTENTS
Sl. No. Chapter Particulars Page No
1 INTRODUCTION 1
2 METHODOLOGY 2-3
3 CHAPTER –I GENERAL DESCRIPTION OF THE DHUBRI DISTRICT 4 - 10
Location & Geographical units 4
Climate & Soil 4
Physiography & Drainage 5
Demographic profile 6
Land use & Land Holdings 6
IWMP projects in the District MIS M(SP)2
Prioritized list of Proposed projects Table DPR 1
8
8
Vision & Strategy 9
4 CHAPTER –II GENERAL DESRIPTION OF THE SELAI GADADHAR IWM PROJECT AREA
11 - 14
Location 11
Climate 11
Rainfall with Table: DPR 2 & 3 11-13
Soil 13
Physiography, Relief & Drainage 14
5 CHAPTER-III PRESENT STATUS OF THE PROJECT AREA 15 - 27
Objectives 15
Present Land Use & Land Cover, Table: DPR 4 17
Details of Areas of Micro Watersheds Table: M (SP) 2 17
Details of Types of Areas Covered under IWMP, Table (SP) 3
18
4
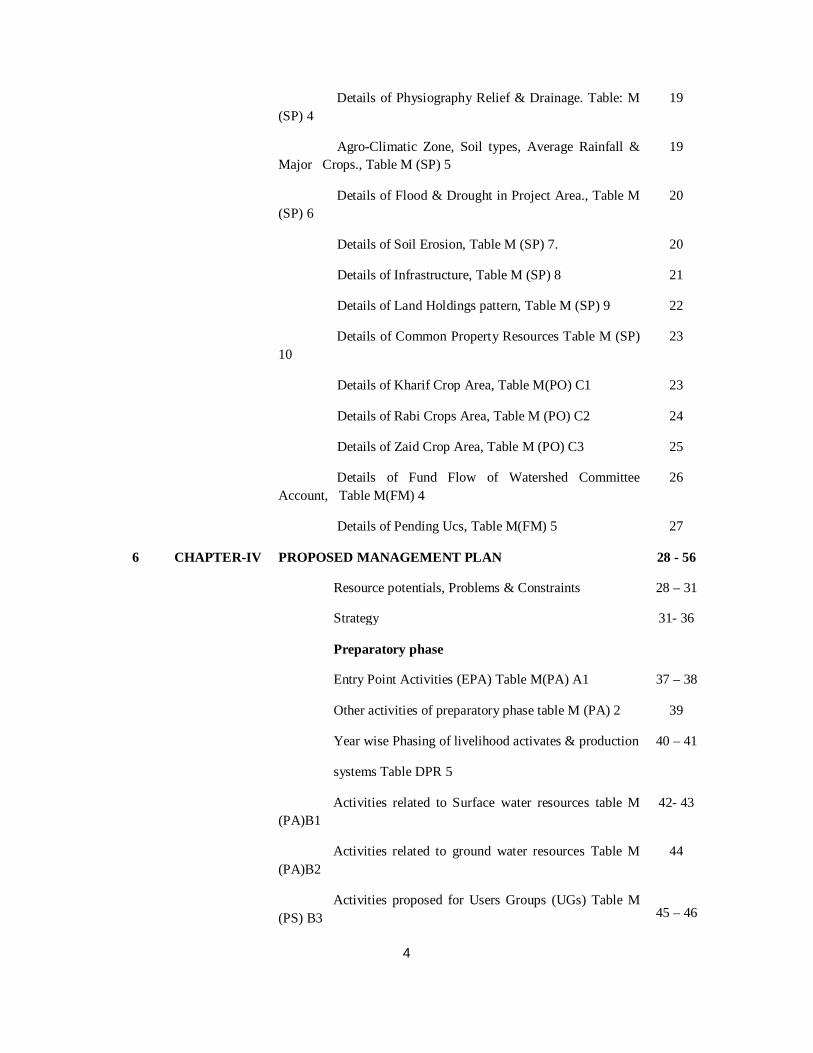
Details of Physiography Relief & Drainage. Table: M (SP) 4
19
Agro-Climatic Zone, Soil types, Average Rainfall & Major Crops., Table M (SP) 5
19
Details of Flood & Drought in Project Area., Table M (SP) 6
20
Details of Soil Erosion, Table M (SP) 7. 20
Details of Infrastructure, Table M (SP) 8 21
Details of Land Holdings pattern, Table M (SP) 9 22
Details of Common Property Resources Table M (SP) 10
23
Details of Kharif Crop Area, Table M(PO) C1 23
Details of Rabi Crops Area, Table M (PO) C2 24
Details of Zaid Crop Area, Table M (PO) C3 25
Details of Fund Flow of Watershed Committee Account, Table M(FM) 4
26
Details of Pending Ucs, Table M(FM) 5 27
6 CHAPTER-IV PROPOSED MANAGEMENT PLAN 28 - 56
Resource potentials, Problems & Constraints 28 – 31
Strategy 31- 36
Preparatory phase
Entry Point Activities (EPA) Table M(PA) A1 37 – 38
Other activities of preparatory phase table M (PA) 2 39
Year wise Phasing of livelihood activates & production
systems Table DPR 5
40 – 41
Activities related to Surface water resources table M (PA)B1
42- 43
Activities related to ground water resources Table M (PA)B2
Activities proposed for Users Groups (UGs) Table M (PS) B3
44
45 – 46
5
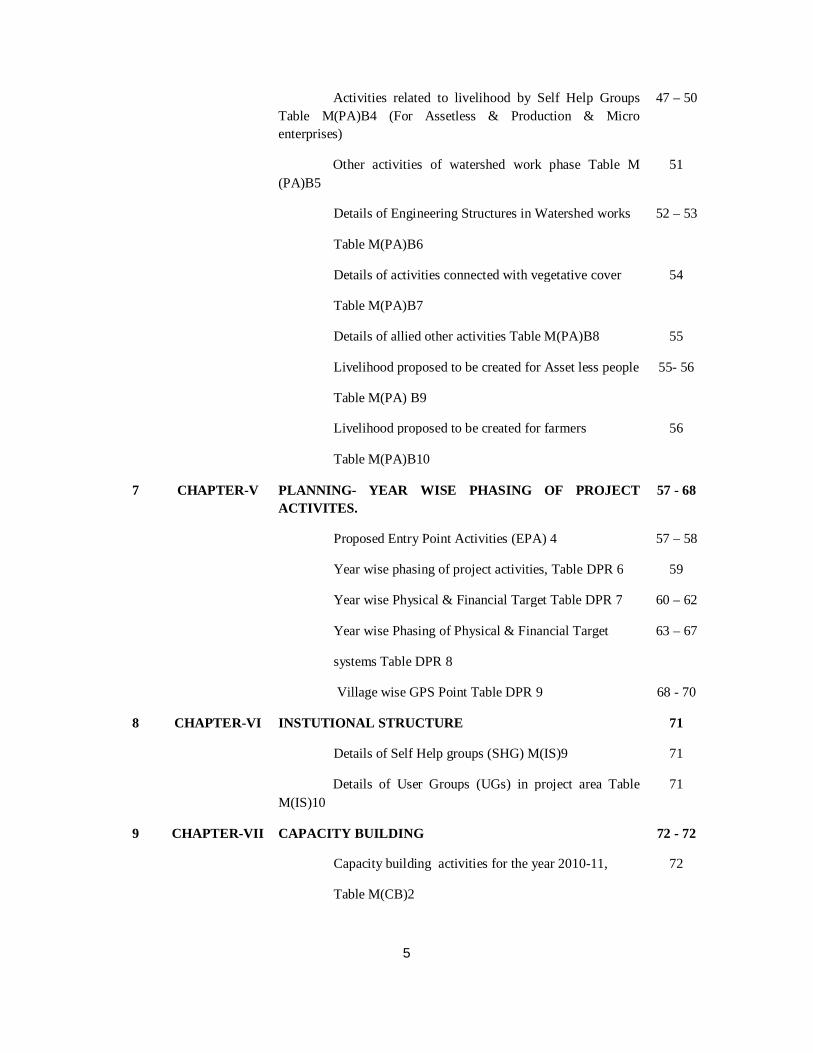
Activities related to livelihood by Self Help Groups Table M(PA)B4 (For Assetless & Production & Micro enterprises)
47 – 50
Other activities of watershed work phase Table M (PA)B5
51
Details of Engineering Structures in Watershed works
Table M(PA)B6
52 – 53
Details of activities connected with vegetative cover
Table M(PA)B7
54
Details of allied other activities Table M(PA)B8 55
Livelihood proposed to be created for Asset less people
Table M(PA) B9
55- 56
Livelihood proposed to be created for farmers
Table M(PA)B10
56
7 CHAPTER-V PLANNING- YEAR WISE PHASING OF PROJECT ACTIVITES.
57 - 68
Proposed Entry Point Activities (EPA) 4 57 – 58
Year wise phasing of project activities, Table DPR 6 59
Year wise Physical & Financial Target Table DPR 7 60 – 62
Year wise Phasing of Physical & Financial Target
systems Table DPR 8
63 – 67
Village wise GPS Point Table DPR 9 68 - 70
8 CHAPTER-VI INSTUTIONAL STRUCTURE 71
Details of Self Help groups (SHG) M(IS)9 71
Details of User Groups (UGs) in project area Table M(IS)10
71
9 CHAPTER-VII CAPACITY BUILDING 72 - 72
Capacity building activities for the year 2010-11,
Table M(CB)2
72

6
Information, Education & Communication (IEC)
Table M(CB)3
73
10 MAPS Location Map of Selai Gadadhar IWM Project.
Present Land Use Map of Selai Gadadhar IWMP Watershed Area.
Watershed map of Selai Gadadhar IWM project showing Micro Watersheds, villages, drainage, relief etc.
Treatment map of Selai Gadadhar IWMP
PRA Under Progress (Photograph)

7
INTRODUCTION
Soil-Water-Plant resources are nature’s gift to mankind. These three resources are the
most important and vital natural resources for the existence of man and animals. Soil,
water and plant are so interdependent that one cannot be managed efficiently without
the other two. But due to high rate of population growth in both human and livestock,
there is indiscriminate exploitation of natural resources for meeting the ever-
increasing demand for food, fodder, fuel, fibres and fertilizers. Thus, developed
continuous degradation of production base and imbalance in land-water-plant and
human-animal system, is creating ecological imbalance and economic insecurity. As a
result there is threat to the quality of our life and cultivation. Therefore it is highly felt
that the natural resources are to be managed efficiently, collectively and
simultaneously. One has to look and find out the suitable “unit of management”. Of
the three resources soil, water and vegetation or plants. Soil and vegetation subjected
themselves to an easier manipulation where as water is the climatic parameter that
needs to be disciplined, once it comes in contact with vegetation and the soil.
However, water can be managed conveniently and efficiently only if watershed is
taken as a unit. Since soil, plant and water are interdependent resources, “watershed”
is considered to be the ideal unit for most effective and gainful management of these
resources.
Watershed is defined as an unit of an area which covers all land and water area that
contributes runoff to a common point. It is a complete dynamic unit, which invariably
responds to any change that may be brought about within its extent. The soil and
water must therefore be considered planned and managed on watershed basis for
effective results.
Watershed approach has conventionally aimed at treating degraded land with the help
of low cost and locally accessed technologies such as in-situ soil and moisture
conservation measures, afforestation etc. through a participatory approach that seek to
secure close involvement of the user communities. The broad objectives are the
promotion of the overall economic development and improvement of socio-economic

8
conditions of the resource poor section of the people in-habiting in the programme
areas. With this aim, the Govt. of India has launched the “Integrated Watershed
Management Programme (IWMP).
METHODOLOGY
The general the common guidelines for watershed development projects (2008) of the
Department of Land Resources (DoLR), Government of India were followed in
preparation of the Detailed Project Report (DPR).
The Methodology of planning envisaged in the guidelines is the participatory planning
approach involving directly the villagers (Beneficiaries) of the project area with active
co-operation & participation from the Gram Panchayats (GP) and PIA officials. The
Participatory Rural Appraisal (PRA) was carried out in all the villages in the project
area. Participatory work sheet for assessment of needs and priorities including details
of activities were prepared. The socio economic survey was conducted covering each
and every house hold. The data collected house wise and village wise were generated
and analyzed.
The Comprehensive District Agricultural Plan (C-DAP) was also referred to and the
prescriptions suggested in C-DAP were adhered to in finalizing the work phase.
Basic information on watershed including rainfall, temperature, topography,
hydrogeology, soil, forests etc. were collected from various published and
unpublished records and reports etc. of various Central and State Government
Organizations including remote sensing data/maps of NRSO, Topo-sheets, soil maps,
Climatic maps, hydro-ecological maps prepared and published by the National Bureau
of soil survey and Land use planning. Land use Land cover maps were supplied by the
SLNA and the present land use Land cover was analyzed and interpreted from these
maps with ground truth verification as well as data available with revenue authority.
The treatment measures taken up for compiling and preparing the work phase in the
DPR as detailed in the common guidelines and as prescribed by the SLNA. The cost

9
analysis, design and drawing etc. of different activities were also prepared and
supplied by the SLNA and accordingly used in project Planning.
The GPS points were taken for all village level proposed project sites and were
transferred in GIS layers.
The draft plan (both soft copy as well as hard copy) were prepared and placed for
review, modify and seek approval of the SLNA. On scrutiny of the draft plan by the
SLNA as well as by the concerned Project Manager/PIA Final Detailed Project
Reports have been prepared.

10
CHAPTER- I
DISTRICT PROFILE
General Description of the District
Location and geographical units:
Dhubri district falls under Lower Brahmaputra Agro-climatic Zone and is bounded by
Kokrajhar district in the north, West Bengal and Bangladesh in the west, Meghalaya
in the south and Meghalaya and Bongaigoan district in the east. The river
Brahmaputra flows through the district roughly from east to west dividing the district
into two distinct parts-north bank and south bank. The river has innumerable tiny
islands (Char) created due to frequent change of its course. Besides Brahmaputra,
there are several other tributaries of the Bhramaputra, namely Champavati, Gaurang,
Sankosh, Tipkai, Gadadhar, Gangadhar in the north bank and river Ginziram and Kalo
in the south bank. The total geographical area of the district is 2361sq km that is
3.01% of the total geographical area of the state. The district has a varied topography
of high, medium and low-lying area.
The district has three civil sub-divisions-Dhubri, Bilasipara and South Salmara-
Mankachar, 15 development blocks, 168 Gaon Panchayat and 1136 revenue villages.
The Dhubri Sub-Division consists of 6 Dev. Blocks consisting of 59 G.Ps and 389
revenue villages, Bilasipara Sub-Division consists of 4 blocks with 43 G.Ps and 344
villages while the South-Salmara Mankachar Sub-Division consists of 5 Blocks with
66 G.Ps and 403 villages.
Climate& Soil:
The climate of the district is sub-tropical in nature with warm and humid summer
followed by dry and cool winter. Taking the five years’ average, the monthly
minimum temperature was observed 12.250 C in January. Similarly the average
monthly maximum temperature observed 31.78.0 C in May. The last eight years,
average annual rainfall in the district is 2077 mm ranging from 1553.7 mm (lowest) in
2006 & 2888.2 (highest) in 2005. The rainfall pattern observed dry during November

11
to March (winter) with an average annual rainfall of 95 mm only while April to
October was observed as wet period that received the average annual rainfall of 1982
mm. Due to varied distribution of rainfall, the district suffers from heavy flood during
wet period and moisture stress in the dry period.
Soil of the district is predominantly sandy loam in texture which covers 58.06% of the
total cultivable area. It is followed by clay loam (23.29%), red soil (2.29%) sandy soil
(11.03%) and clay soil (5.30%). There is no available data based on soil sample
analysis regarding organic Carbon, N, P, K, and other micronutrient content of the soil
in the district. However in general, soil of the district is acidic in reaction. Soil of
major areas are mildly acidic (5.5-6.5 PH), while soil in high land old alluvial is
severely acidic. There is a problem of riverbank erosion in the riverine tracts,
especially during flood season. This problem is more acute in South-Salmara Sub-
division. Mild micronutrient deficiency especially of Boron has been observed in
same areas throughout the district. Soil erosion is a serious problem especially in
South Salmara Sub-division.
Physiography & Drainage:
The district is generally plains in topography being flanked by the hills of Meghalaya
in the southern side and the river Brahmaputra flows through the district roughly from
east to west dividing the district into two distinct parts- the north bank and the south
bank. The river has innumerable tiny islands (Char) created due to frequent change of
its course.
The district is endowed with river Brahmaputra and many other rivers like Gaurang,
Champawati, Sankosh,Tipkai, Gadadhar, Gangadhar in the North bank and river
Ginziram and Kalo in the south bank. Most of the rivers flow down from north to
south to reach the river Brahmaputra and some others like river Gangadhar flow into
Bangladesh. Though a number of rivers and tributaries are flowing over the district,
the scenario of flow and lift irrigation is very poor. Out of total net sown area, 37.22%
is actually under assured irrigation and remaining 62.78% is rain-fed. No major and
medium irrigation project is running in the district. Minor irrigation scheme, STW and

12
LLP are the main sources of irrigation. Present strength of STW and LLP is 27890 and
24 nos. minor irrigation projects, only in the district. The district is said to be a major
flood prone district. As a result, the provision of irrigation is must for Summer Paddy
cultivation.
Demographic Profile:
The total population of the district is 1415371 (Census 2001) out of which 97.23%
belongs to General Caste, 2.66% Schedule Caste and a negligible percentage of
Schedule Tribe population which is only 1.1%. The number of female per 1000 male
is 954. Under 168 G.Ps in total, there are 1136 revenue villages out of which 68 are
uninhabited. The reason of un-inhabitation is mainly complete erosion of the villages
by flood & river Brahmaputra. In a total population of 14.15 lakh the percentage of
SC & ST people are only 2.66% and 1.1% respectively.
Land use & Land Holdings:
The total geographical area of the district is 236126 ha. AS per data available in the
Statistical Hand Book of Assam for Dhubri district 2008, 14.26% is forest land,
25.31% not available for cultivation, 3.39% for uncultivated land excluding fallow
land and 4.40% current fallow. The net sown area of the district is 1,41,896 ha which
is 50.87 % of the district. There are 2,55,449 operational holdings and average size of
land holding is 0.76 ha . The marginal farmer constitutes 33.40 % of farm families
with 31.35 % of land under their possession. The landless farmer is 46.72 %
occupying 14.75 % of land while small farmers 15.19% with 33.24% of land, medium
farmers (3.01%) with 10.92 % land, large farmer (1.13%) with 5.57% land and very
large farmer (0.48%) with 4.14% of land. Thus large farmers comprise 9.71 % total
land holdings.
Based on the rainfall, physiography, soil, occurrence of flood and cropping pattern,
the district has been delineated into four different agro-ecological situation (AES)
with a view to generate location specific technologies to meet the specific needs of the
farmers. The AES are as follows:
13
1. Flood prone riverine alluvial plains (low – lying area).
2. Flood free old riverine alluvial plains (medium high land)
3. High land old alluvials.
4. Char land (very much prone to flood and erosion)
Agriculture is the main occupation of the district. The District favoured by desirable
soil and climatic condition grows a wide range of crops. Paddy is the main crop of the
district, grown mainly as summer and winter paddy. The other major crops are
Mustard, Jute, Potato, Wheat, Lentil, Black gram and different vegetables like Brinjal,
Cabbage, Cauliflower, Lady’s finger, Radish, Tomato, Cucumber, Carrot and Guards.
Onion, Garlic, Chilly, Zinger and Turmeric are also grown in small areas in all the
Dev. Blocks. Some other minor crops are Pea, Sesamum, Cucumber, Tapioca etc.
Important plantation crops are Banana, Coconut, areca-nut, guava, mango, lemon,
bamboo etc. At present cropping intensity of the district is 203%. Only 18% of the net
sown area is under mono cropping, 61% under double cropping and 21% under triple
cropping. In animal husbandry sector, different indigenous and cross breeds are reared
by the farmers of Dhubri district.
IWMP in the District:
The district has proposed three numbers of IWMP projects that are indicated below
along with the salient features.
14
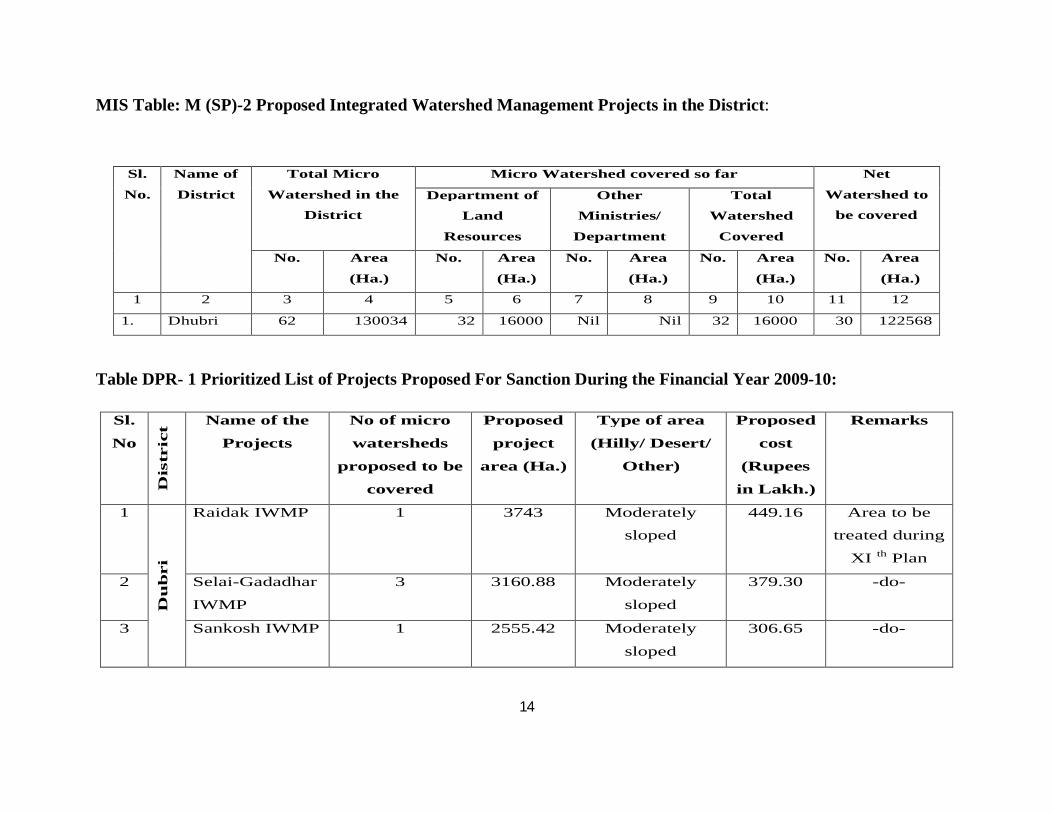
MIS Table: M (SP)-2 Proposed Integrated Watershed Management Projects in the District:
Table DPR- 1 Prioritized List of Projects Proposed For Sanction During the Financial Year 2009-10:
Sl.
No
Dis
tric
t Name of the
Projects
No of micro
watersheds
proposed to be
covered
Proposed
project
area (Ha.)
Type of area
(Hilly/ Desert/
Other)
Proposed
cost
(Rupees
in Lakh.)
Remarks
1
Du
bri
Raidak IWMP 1 3743 Moderately
sloped
449.16 Area to be
treated during
XI th Plan
2 Selai-Gadadhar
IWMP
3 3160.88 Moderately
sloped
379.30 -do-
3 Sankosh IWMP 1 2555.42 Moderately
sloped
306.65 -do-
Sl.
No.
Name of
District
Total Micro
Watershed in the
District
Micro Watershed covered so far Net
Watershed to
be covered Department of
Land
Resources
Other
Ministries/
Department
Total
Watershed
Covered
No. Area
(Ha.)
No. Area
(Ha.)
No. Area
(Ha.)
No. Area
(Ha.)
No. Area
(Ha.)
1 2 3 4 5 6 7 8 9 10 11 12
1. Dhubri 62 130034 32 16000 Nil Nil 32 16000 30 122568

15
VISION AND STRATEGY:
The district of Dhubri needs major rejuvenation and reconstruction in all the sectors of
development as it has been running through a stagnation Agriculture in the district is
of subsistence type.
The productivity of almost all major crops in the district as reflected in the
Comprehensive District Agriculture Plan (C-DAP), has remained below the State’s
average. The average yield of the most important food crops of rice (2711 kg/ha.)
which is higher than that in the State and even then that of the neighbouring district of
Kokrajhar. Similarly yields of pulses and spices are also higher. Yields of oil seeds,
vegetables and tuber crops are higher than those of the States average.
Under the circumstances critical issues relating to the development of agriculture and
allied sectors vis-à-vis in-situ conservation of soil & moisture, that need to be eddies
are as follows.
The Stable productivity and income through in-situ conservation of soil & moisture,
up-gradation and utilization of natural endowments like land, water, plant, and human
resources in harmonious and integrated manner. This will aim at perpetual availability
of food, fodder, fuel, fiber, timber and biomass for rural and cottage industry to meet
the growing demands of human and livestock population through diversification and
intensification in existing farming system.
i. Introducing land use technologies: Which improve production and productivity
and will enable the farmers to make use of land according to capability.
ii. Farmers Organization: Formation, promotion and empowering Users Groups,
Shelf Help Groups covering marginal and landless farmers providing facilities of
integrated development of the watershed with effective participation of the people of
the project area.
iii. Sustainability of production and farm income: The high rainfall and light soil
condition need attention for efficient natural resources management including

16
judicious water management, rain water harvesting, proper drainage line treatment,
rejuvenation of degraded vegetative cover to tackle the problems of soil erosion, soil
acidity, loss of vegetative cover and bio-diversity.
iv. Generation of employment by optimum development of natural and human
resources of villages through creating general awareness on scientific farming and
market information as well as human resources through adequate time-to-time
training.

17
CHAPTER-II
GENERAL DESCRIPTION OF THE SELAI GADADHAR IWM PROJECT
AREA
LOCATION
The Selai Gadadhar IWM project area is located in the North-eastern side of the
district Head Quarter i.e Dhubri town. It lies between 29o50/E to 900 00/ E longitude
and 2605/0/ to 260 90/N latitude.
CLIMATE
The Climate of the project area is warm and humid with hot summer followed by
monsoon of heavy rainfall and relatively cool and dry in winter. The minimum
temperature is ranges from 80 - 120C and maximum temperature is ranges in between
330 - 350C and the relative humidity is minimum 72.75% and maximum of 75.50%.
RAINFALL
The last eight years, average annual rainfall in the district is 2077 mm ranging from
1553.7 mm (lowest) in 2006 & 2888.2 (highest) in 2005. The rainfall pattern observed
dry during November to March (winter) with an average annual rainfall of 95 mm
only while April to October was observed as wet period that received the average
annual rainfall of 1982 mm. Due to varied distribution of rainfall, the district suffers
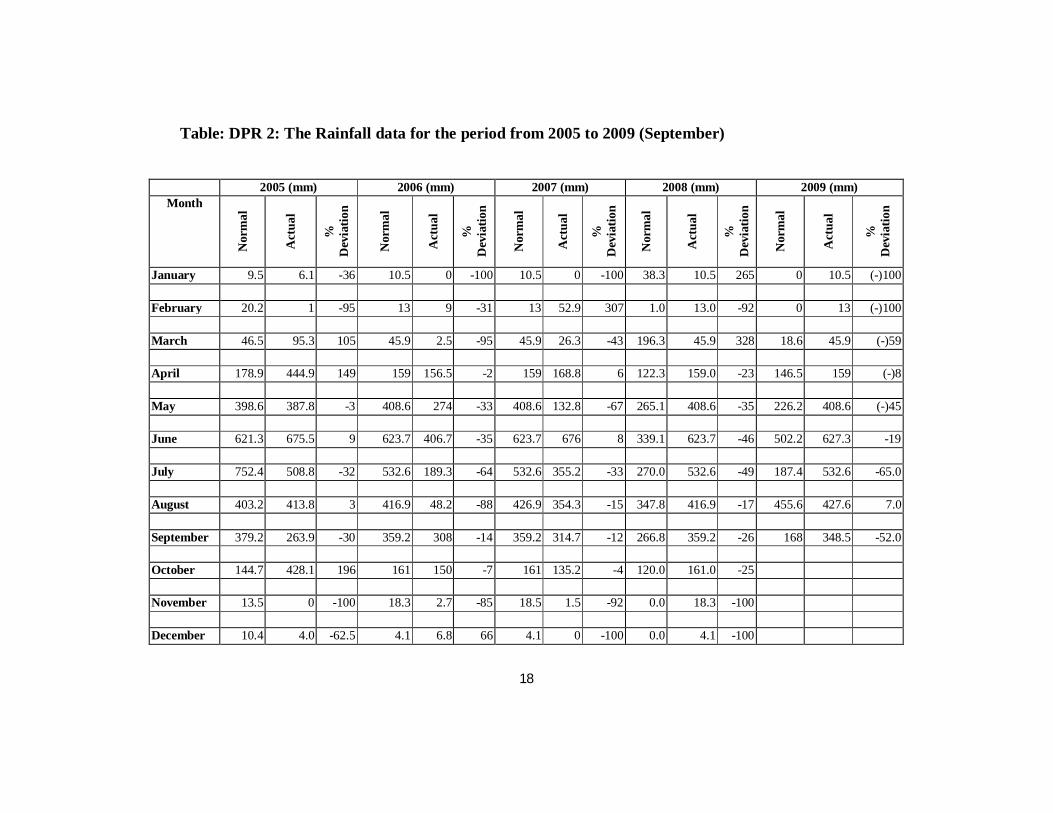
from heavy flood during wet period and moisture stress in the dry period. The normal
rainfall, actual rainfall and deviation in percentage for the period from January 2005 to
October 2009 are given in the following table:
18
Table: DPR 2: The Rainfall data for the period from 2005 to 2009 (September)
2005 (mm) 2006 (mm) 2007 (mm) 2008 (mm) 2009 (mm) Month
Nor
mal
Act
ual
%
Dev
iatio
n
Nor
mal
Act
ual
%
Dev
iatio
n
Nor
mal
Act
ual
%
Dev
iatio
n
Nor
mal
Act
ual
%
Dev
iatio
n
Nor
mal
Act
ual
%
Dev
iatio
n
January 9.5 6.1 -36 10.5 0 -100 10.5 0 -100 38.3 10.5 265 0 10.5 (-)100
February 20.2 1 -95 13 9 -31 13 52.9 307 1.0 13.0 -92 0 13 (-)100
March 46.5 95.3 105 45.9 2.5 -95 45.9 26.3 -43 196.3 45.9 328 18.6 45.9 (-)59
April 178.9 444.9 149 159 156.5 -2 159 168.8 6 122.3 159.0 -23 146.5 159 (-)8
May 398.6 387.8 -3 408.6 274 -33 408.6 132.8 -67 265.1 408.6 -35 226.2 408.6 (-)45
June 621.3 675.5 9 623.7 406.7 -35 623.7 676 8 339.1 623.7 -46 502.2 627.3 -19
July 752.4 508.8 -32 532.6 189.3 -64 532.6 355.2 -33 270.0 532.6 -49 187.4 532.6 -65.0
August 403.2 413.8 3 416.9 48.2 -88 426.9 354.3 -15 347.8 416.9 -17 455.6 427.6 7.0
September 379.2 263.9 -30 359.2 308 -14 359.2 314.7 -12 266.8 359.2 -26 168 348.5 -52.0
October 144.7 428.1 196 161 150 -7 161 135.2 -4 120.0 161.0 -25
November 13.5 0 -100 18.3 2.7 -85 18.5 1.5 -92 0.0 18.3 -100
December 10.4 4.0 -62.5 4.1 6.8 66 4.1 0 -100 0.0 4.1 -100
19
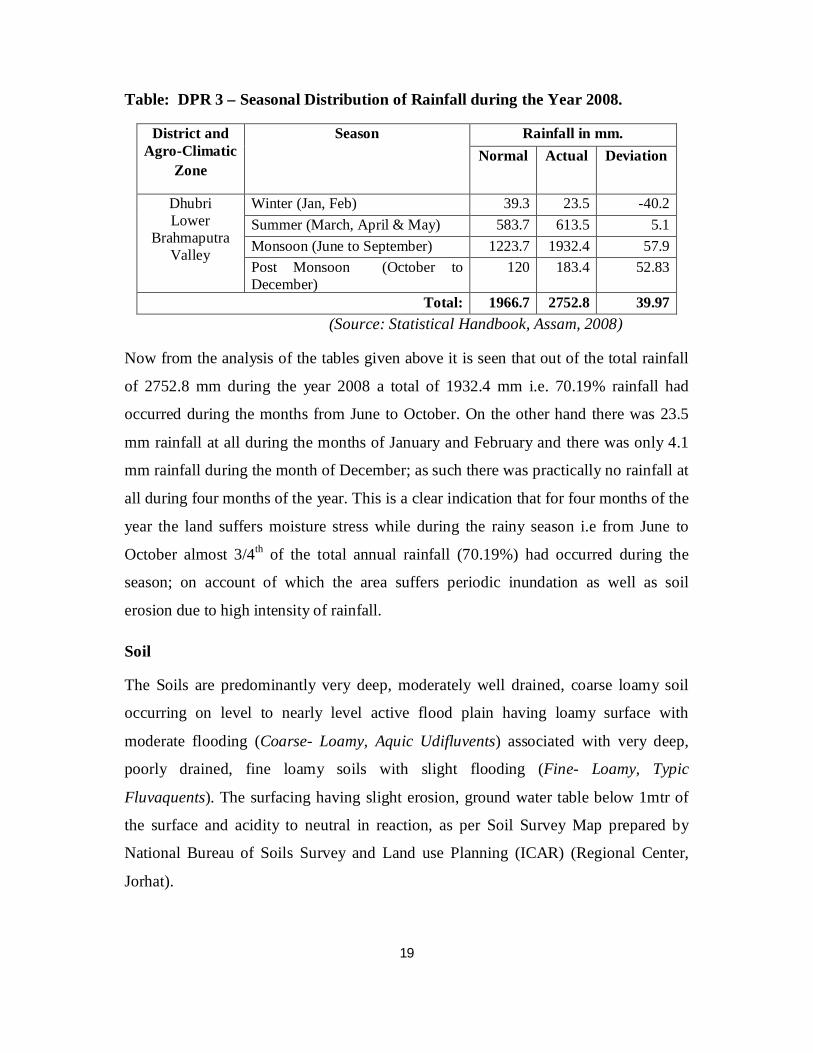
Table: DPR 3 – Seasonal Distribution of Rainfall during the Year 2008.
District and Agro-Climatic
Zone
Season Rainfall in mm. Normal Actual Deviation
Dhubri Lower
Brahmaputra Valley
Winter (Jan, Feb) 39.3 23.5 -40.2 Summer (March, April & May) 583.7 613.5 5.1 Monsoon (June to September) 1223.7 1932.4 57.9 Post Monsoon (October to December)
120 183.4 52.83
Total: 1966.7 2752.8 39.97 (Source: Statistical Handbook, Assam, 2008)
Now from the analysis of the tables given above it is seen that out of the total rainfall
of 2752.8 mm during the year 2008 a total of 1932.4 mm i.e. 70.19% rainfall had
occurred during the months from June to October. On the other hand there was 23.5
mm rainfall at all during the months of January and February and there was only 4.1
mm rainfall during the month of December; as such there was practically no rainfall at
all during four months of the year. This is a clear indication that for four months of the
year the land suffers moisture stress while during the rainy season i.e from June to
October almost 3/4th of the total annual rainfall (70.19%) had occurred during the
season; on account of which the area suffers periodic inundation as well as soil
erosion due to high intensity of rainfall.
Soil
The Soils are predominantly very deep, moderately well drained, coarse loamy soil
occurring on level to nearly level active flood plain having loamy surface with
moderate flooding (Coarse- Loamy, Aquic Udifluvents) associated with very deep,
poorly drained, fine loamy soils with slight flooding (Fine- Loamy, Typic
Fluvaquents). The surfacing having slight erosion, ground water table below 1mtr of
the surface and acidity to neutral in reaction, as per Soil Survey Map prepared by
National Bureau of Soils Survey and Land use Planning (ICAR) (Regional Center,
Jorhat).

20
Physiography Relief and Drainage:
The area is very gently sloping characterized by almost plain topography mostly less
than 10 meters per km. gradient towards west. The lowest elevation recorded in the
project area is 47mts and the highest elevation is 70 meters.

21
CHAPTER-III
PRESENT STATUS OF THE PROJECT AREA
Objectives:
The specific objectives of the project are as follows:
i. Conservation up-gradation and utilization of natural endowments like land, water
plant, animal and human resources in harmonious and integrated manner. This will
aim at perpetual availability of food, fodder, fuel, fiber, timber and biomass for rural
and cottage industries to meet the growing demands of human and livestock
population through diversification use pattern.
ii. Introducing land use technologies, which improve production and productivity of
crops in the project areas.
iii. Introducing measures, which will enable the farmers to make use of land according
to its capability.
iv. Generation of employment during project period and regular employment after
completion of the project.
v. Securing stability and growth of agricultural production.
vi. Optimization of available resources such as soil, water and land within the micro
watershed.
vii. Creating a general awareness among the local farmers about adopting scientific
farming.
viii. Providing facilities of integrated development and production of the watershed
with effective participation of the people of the project area.
ix. In addition to food, fodder and fuel, the project will endeavor to enhance cash flow
to the farmers and landless agricultural labourer through increased casual
employment, marketing of marketable surplus of various produce with the help of
forming various self help groups (SHG).
22
x. Generation of employment by optimum development of natural and human
resources of villages in order to promote income generation activities and to
encourage savings.
23
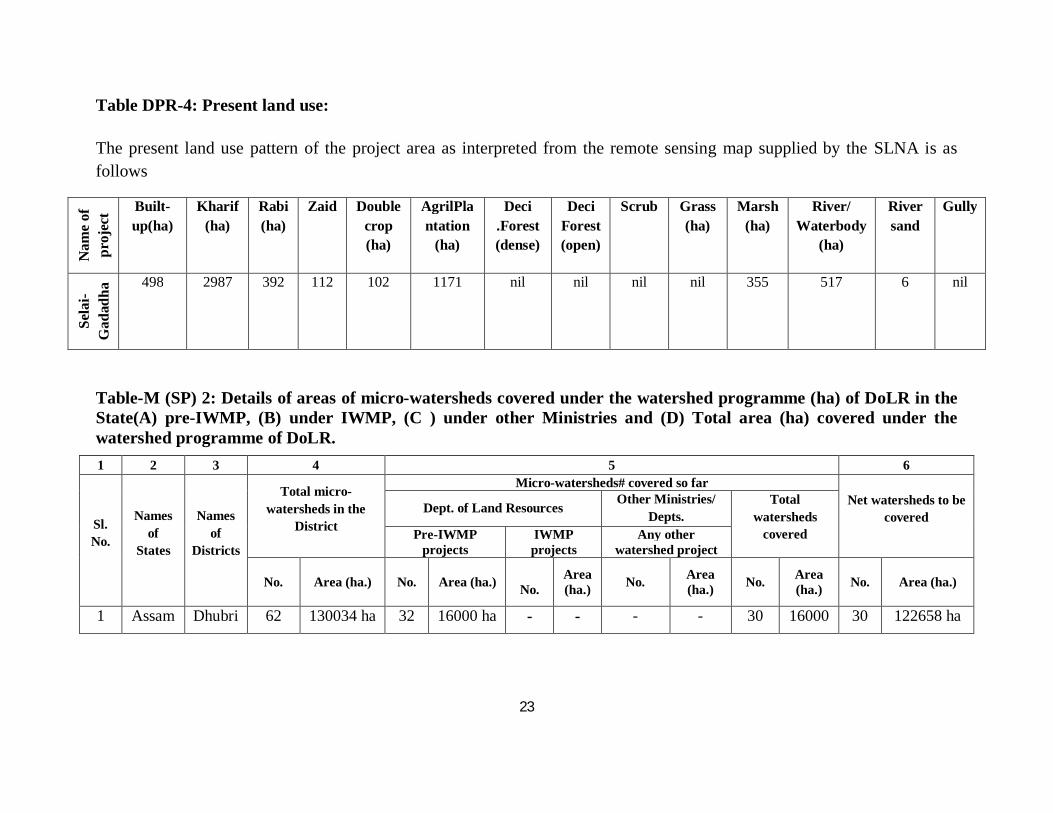
Table DPR-4: Present land use:
The present land use pattern of the project area as interpreted from the remote sensing map supplied by the SLNA is as follows
Nam
e of
pr
ojec
t Built-up(ha)
Kharif (ha)
Rabi (ha)
Zaid Double crop (ha)
AgrilPlantation
(ha)
Deci .Forest (dense)
Deci Forest (open)
Scrub Grass (ha)
Marsh (ha)
River/ Waterbody
(ha)
River sand
Gully
Sela
i-G
adad
har
498 2987 392 112 102 1171 nil nil nil nil 355 517 6 nil
Table-M (SP) 2: Details of areas of micro-watersheds covered under the watershed programme (ha) of DoLR in the State(A) pre-IWMP, (B) under IWMP, (C ) under other Ministries and (D) Total area (ha) covered under the watershed programme of DoLR. 1 2 3 4 5 6
Sl. No.
Names of
States
Names of
Districts
Total micro-watersheds in the
District
Micro-watersheds# covered so far Net watersheds to be
covered Dept. of Land Resources
Other Ministries/ Depts.
Total watersheds
covered Pre-IWMP projects
IWMP projects
Any other watershed project
No. Area (ha.) No. Area (ha.) No.
Area (ha.) No. Area
(ha.) No. Area (ha.) No. Area (ha.)
1 Assam Dhubri 62 130034 ha 32 16000 ha - - - - 30 16000 30 122658 ha
24
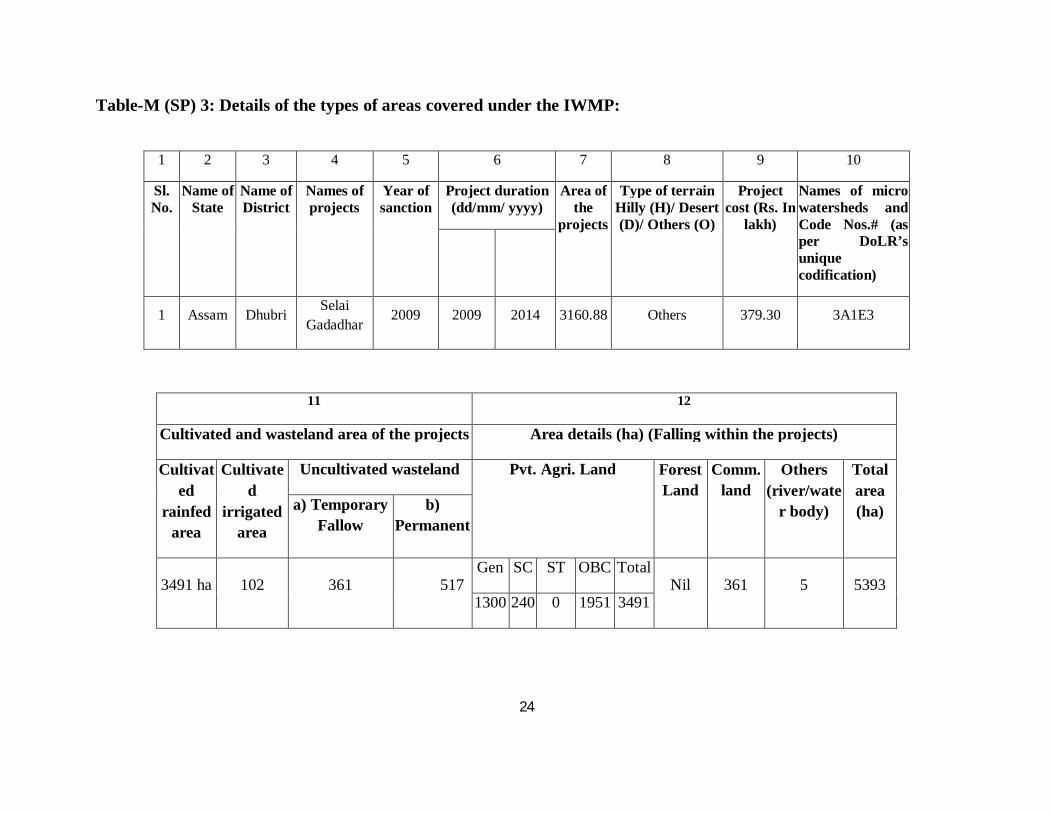
Table-M (SP) 3: Details of the types of areas covered under the IWMP:
1 2 3 4 5 6 7 8 9 10
Sl. No.
Name of State
Name of District
Names of projects
Year of sanction
Project duration (dd/mm/ yyyy)
Area of the
projects
Type of terrain Hilly (H)/ Desert (D)/ Others (O)
Project cost (Rs. In
lakh)
Names of micro watersheds and Code Nos.# (as per DoLR’s unique codification)
1 Assam Dhubri Selai Gadadhar
2009 2009 2014 3160.88 Others 379.30 3A1E3
11 12
Cultivated and wasteland area of the projects Area details (ha) (Falling within the projects)
Cultivated
rainfed area
Cultivated
irrigated area
Uncultivated wasteland Pvt. Agri. Land Forest Land
Comm. land
Others (river/wate
r body)
Total area (ha) a) Temporary
Fallow b)
Permanent
3491 ha 102 361 517 Gen SC ST OBC Total
Nil 361 5 5393 1300 240 0 1951 3491
25
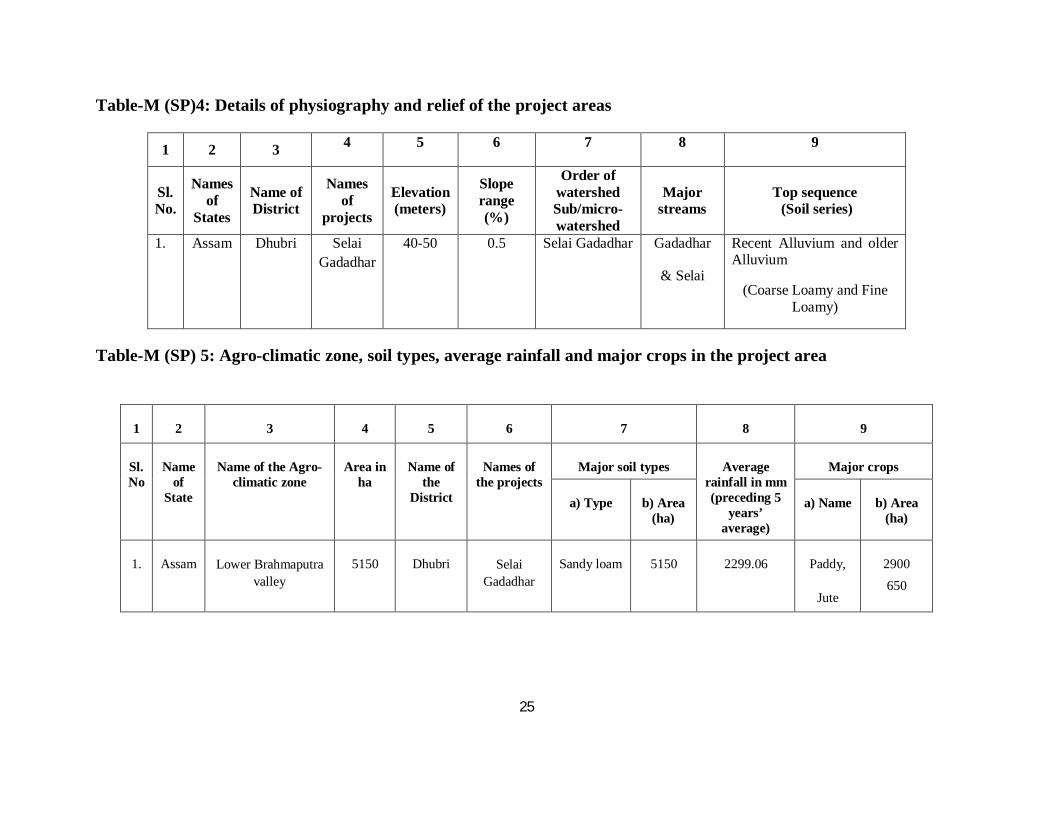
Table-M (SP)4: Details of physiography and relief of the project areas
1 2 3 4 5 6 7 8 9
Sl. No.
Names of
States
Name of District
Names of
projects
Elevation (meters)
Slope range (%)
Order of watershed Sub/micro-watershed
Major streams
Top sequence (Soil series)
1. Assam Dhubri Selai Gadadhar
40-50 0.5 Selai Gadadhar Gadadhar
& Selai
Recent Alluvium and older Alluvium
(Coarse Loamy and Fine Loamy)
Table-M (SP) 5: Agro-climatic zone, soil types, average rainfall and major crops in the project area
1 2 3 4 5 6 7 8 9
Sl. No
Name of
State
Name of the Agro-climatic zone
Area in ha
Name of the
District
Names of the projects
Major soil types Average rainfall in mm (preceding 5
years’ average)
Major crops
a) Type b) Area (ha)
a) Name b) Area (ha)
1. Assam Lower Brahmaputra valley
5150 Dhubri
Selai Gadadhar
Sandy loam 5150 2299.06 Paddy,
Jute
2900 650
26
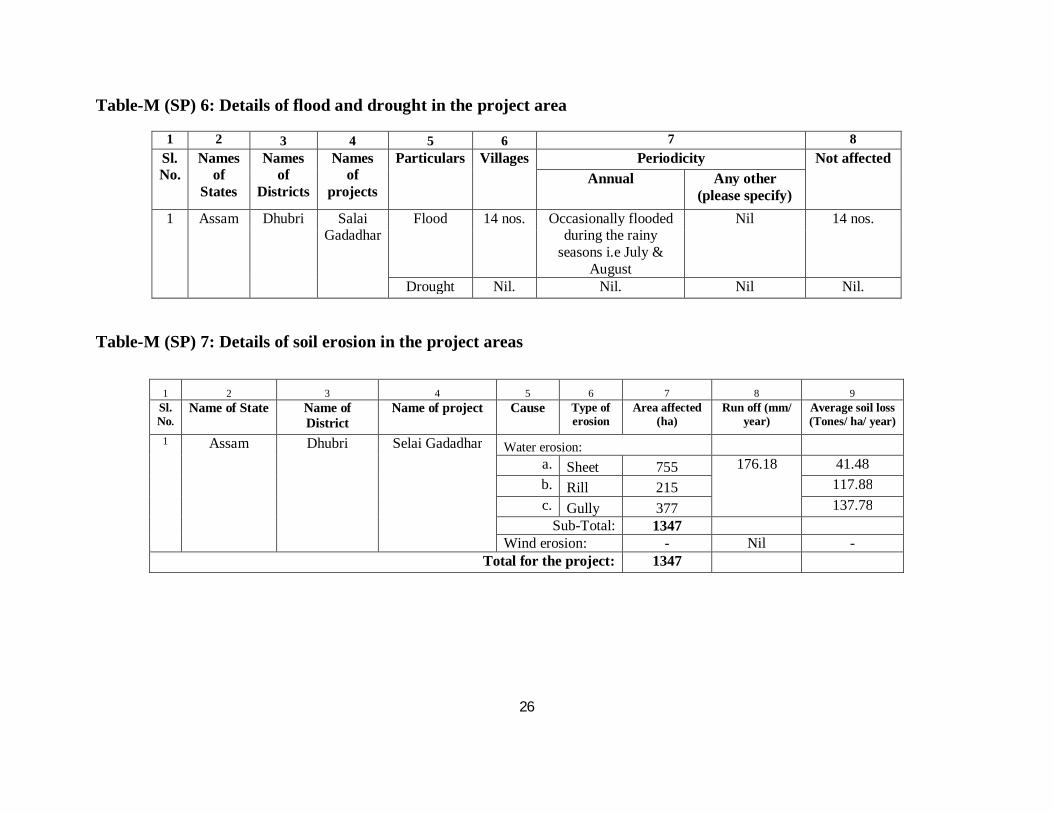
Table-M (SP) 6: Details of flood and drought in the project area
1 2 3 4 5 6 7 8 Sl. No.
Names of
States
Names of
Districts
Names of
projects
Particulars Villages Periodicity Not affected Annual Any other
(please specify) 1 Assam Dhubri Salai
Gadadhar Flood 14 nos. Occasionally flooded
during the rainy seasons i.e July &
August
Nil 14 nos.
Drought Nil. Nil. Nil Nil.
Table-M (SP) 7: Details of soil erosion in the project areas
1 2 3 4 5 6 7 8 9 Sl. No.
Name of State Name of District
Name of project Cause Type of erosion
Area affected (ha)
Run off (mm/ year)
Average soil loss (Tones/ ha/ year)
1 Assam Dhubri Selai Gadadhar Water erosion:
a. Sheet 755 176.18 41.48 b. Rill 215 117.88 c. Gully 377 137.78
Sub-Total: 1347 Wind erosion: - Nil -
Total for the project: 1347

27
Table-M SP) 8: Details of infrastructure in the project area
1 2 3 4 5 6
Sl. No. Name of State
Name of
District
Name of
project Parameters Status
1.
Ass
am
Dhu
bri
Sela
i Gad
adha
r
(i) No. of villages connected to the main road by an all-weather road 28
(ii) No. of villages provided with electricity 28
(iii) No. of households without access to drinking water Nil
(iv) No. of educational institutions : Primary (P)/ Secondary (S)/ Higher Secondary (HS)/ vocational institution (VI)
(P) 17
(S) Nil
(HS) 1
(VI) 0
(v) No. of villages with access to Primary Health Center 28 (1PHC & 8 nos. Sub center)
(vi) No. of villages with access to Veterinary Dispensary 28 (1 nos)
(vii) No. of villages with access to Post Office 28 (Sub post 1 nos. & 3 Branch PO)
(viii) No. of villages with access to Banks 28 (2 nos)
(ix) No. of villages with access to Markets / mandis 28 (2 weekly & 3 daily)
(x) No. of villages with access to Agro-industries Nil
(xi) Total quantity of surplus milk Nil.
(xii) No. of milk collection centers (e.g. Union(U)/ Society(S)/ Pvt. agency(PA)/ others (O))
(U)
Nil.
(U)
Nil.
(U)
Nil.
(U)
Nil.
(xiii) No. of villages with access to Anganwadi Center 28
(xiv) Any other facilities with no. of villages (Please specify) Nil
28
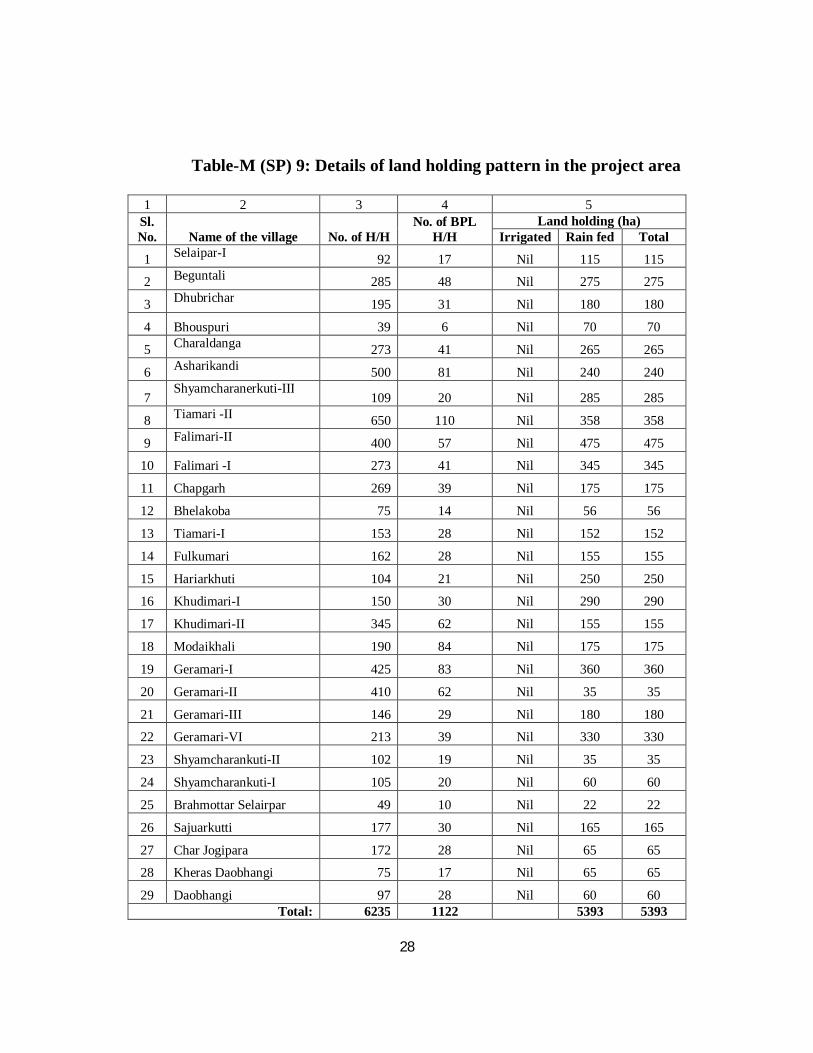
Table-M (SP) 9: Details of land holding pattern in the project area
1 2 3 4 5 Sl. No. Name of the village No. of H/H
No. of BPL H/H
Land holding (ha) Irrigated Rain fed Total
1 Selaipar-I 92 17 Nil 115 115
2 Beguntali 285 48 Nil 275 275
3 Dhubrichar 195 31 Nil 180 180
4 Bhouspuri 39 6 Nil 70 70
5 Charaldanga 273 41 Nil 265 265
6 Asharikandi 500 81 Nil 240 240
7 Shyamcharanerkuti-III
109 20 Nil 285 285
8 Tiamari -II 650 110 Nil 358 358
9 Falimari-II 400 57 Nil 475 475
10 Falimari -I 273 41 Nil 345 345
11 Chapgarh 269 39 Nil 175 175
12 Bhelakoba 75 14 Nil 56 56
13 Tiamari-I 153 28 Nil 152 152
14 Fulkumari 162 28 Nil 155 155
15 Hariarkhuti 104 21 Nil 250 250
16 Khudimari-I 150 30 Nil 290 290
17 Khudimari-II 345 62 Nil 155 155
18 Modaikhali 190 84 Nil 175 175
19 Geramari-I 425 83 Nil 360 360
20 Geramari-II 410 62 Nil 35 35
21 Geramari-III 146 29 Nil 180 180
22 Geramari-VI 213 39 Nil 330 330
23 Shyamcharankuti-II 102 19 Nil 35 35
24 Shyamcharankuti-I 105 20 Nil 60 60
25 Brahmottar Selairpar 49 10 Nil 22 22
26 Sajuarkutti 177 30 Nil 165 165
27 Char Jogipara 172 28 Nil 65 65
28 Kheras Daobhangi 75 17 Nil 65 65
29 Daobhangi 97 28 Nil 60 60 Total: 6235 1122 5393 5393
29
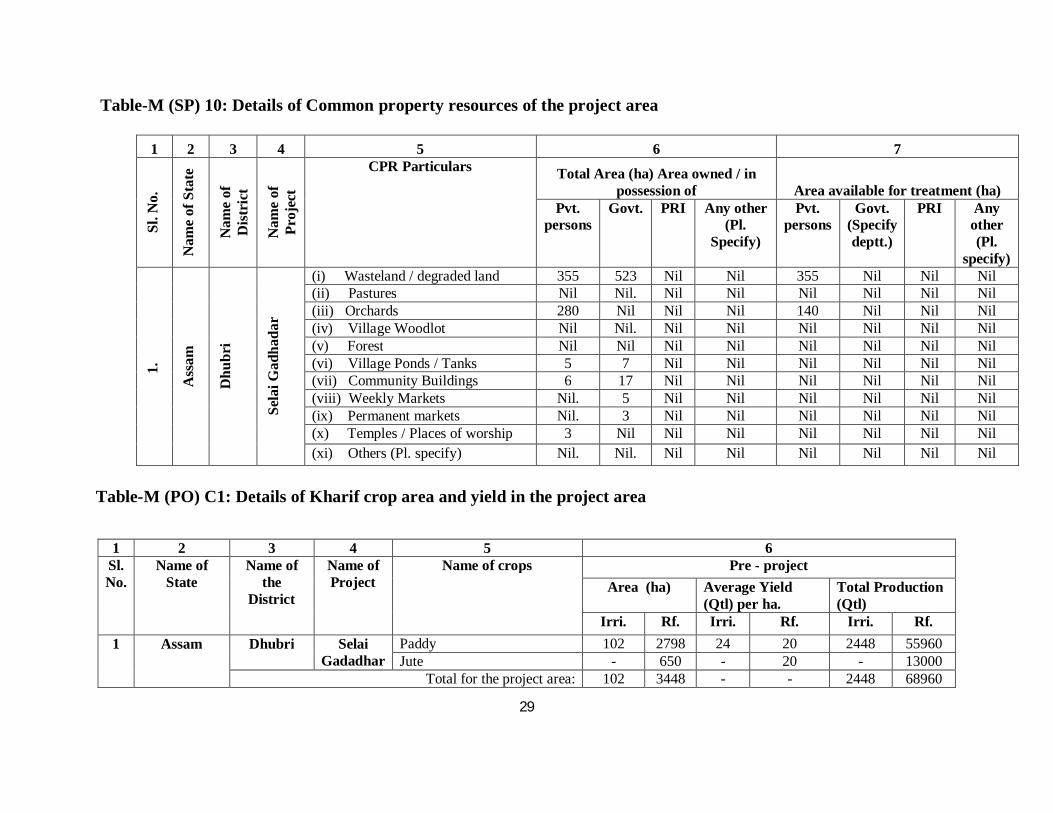
Table-M (SP) 10: Details of Common property resources of the project area
1 2 3 4 5 6 7 Sl
. No.
Nam
e of
Sta
te
Nam
e of
D
istr
ict
Nam
e of
Pr
ojec
t
CPR Particulars Total Area (ha) Area owned / in possession of Area available for treatment (ha)
Pvt. persons
Govt. PRI Any other (Pl.
Specify)
Pvt. persons
Govt. (Specify deptt.)
PRI Any other (Pl.
specify)
1.
Ass
am
Dhu
bri
Sela
i Gad
hada
r (i) Wasteland / degraded land 355 523 Nil Nil 355 Nil Nil Nil (ii) Pastures Nil Nil. Nil Nil Nil Nil Nil Nil (iii) Orchards 280 Nil Nil Nil 140 Nil Nil Nil (iv) Village Woodlot Nil Nil. Nil Nil Nil Nil Nil Nil (v) Forest Nil Nil Nil Nil Nil Nil Nil Nil (vi) Village Ponds / Tanks 5 7 Nil Nil Nil Nil Nil Nil (vii) Community Buildings 6 17 Nil Nil Nil Nil Nil Nil (viii) Weekly Markets Nil. 5 Nil Nil Nil Nil Nil Nil (ix) Permanent markets Nil. 3 Nil Nil Nil Nil Nil Nil (x) Temples / Places of worship 3 Nil Nil Nil Nil Nil Nil Nil (xi) Others (Pl. specify) Nil. Nil. Nil Nil Nil Nil Nil Nil
Table-M (PO) C1: Details of Kharif crop area and yield in the project area
1 2 3 4 5 6 Sl. No.
Name of State
Name of the
District
Name of Project
Name of crops Pre - project Area (ha) Average Yield
(Qtl) per ha. Total Production (Qtl)
Irri. Rf. Irri. Rf. Irri. Rf. 1 Assam Dhubri Selai
Gadadhar Paddy 102 2798 24 20 2448 55960 Jute - 650 - 20 - 13000
Total for the project area: 102 3448 - - 2448 68960

30
Table-M (PO) C2: Details of Rabi crop area and yield in the project area:
1 2 3 4 5 6 7 8
Sl. N
o.
Nam
e of
Sta
te
Nam
e of
the
Dis
tric
t
Nam
e of
Pro
ject
Name of
crop Pre-project Mid-term Post-project
Area
(ha)
Average Yield
(Qtl) per ha.
Total Production
(Qtl)
Area
(ha)
Average Yield per ha
(qtl)
Total production (qtl)
Area
(ha)
Average Yield per ha (qtl)
Total production
(qtl)
Irri Rf. Irri Rf. Irri Rf. Irri Rf. Irri Rf. Irri Rf. Irri Rf. Irri Rf. Irri Rf.
1.
Ass
am
Dhu
bri
Sela
i Gad
adha
r
Wheat - 50 - 11 - 550 2 60 20 25 40 1500 10 100 25 30 250 3000
Rape & Mustard
- 80 -
0.65 - 52 - 100 - 1 - 100 - 150 - 1.5 - 225
Green Gram
- 15 -
0.53 - 8 - 30 - 1 - 30 - 50 - 1.5 - 75
Black Gram
- 7 -
0.65 - 5 - 20 - 1 - 20 - 50 - 1.5 - 75
Vegetables - 30 - 35 - 1050 10 50 70 50 700 2500 300 100 100 70 30000 7000
Total for the Project: - 282 - - - 4665 12 260 - - 1540 4150 300 200 - - 30250 10375
* From column no.2 total number of States, from column no.3 total no. of Districts; from column no.4 total no. of projects; from column no.5, total no. of crops; from column no.6 to 8, the totals for the area, average yield per ha and total production, category-wise, for the entire country may be given at the end of the Table.
Irri. – Irrigated Rf. – Rainfed

31
Table-M(PO)C3: Details of Zaid crop area and yield in the project area
1 2 3 4 5 6 7 8
Sl. N
o.
Nam
e of
Sta
te
Nam
e of
the
Dist
rict
Nam
e of
Pro
ject
Name of
crops Pre-project Mid-term Post-project
Area
(ha)
Average Yield (Qtl)
per ha.
Total
Production(Qtl)
Area
(ha)
Average Yield per ha
(qtl)
Total production
(qtl)
Area
(ha)
Average Yield per ha
(qtl)
Total production (qtl)
Irri Rf. Irri Rf. Irri Rf. Irri Rf. Irri Rf. Irri Rf. Irri Rf. Irri Rf. Irri Rf.
1
Ass
am
Dhu
bri
Sel
ai G
adad
har
Brinjal - 20 - 15 - 300 - 20 - 25 - 500 - 55 - 25 - 1250
Maize - 8 - 16 - 120 - 15 - 30 - 450 - 18 - 30 - 54
Ladys finger
- 19 - 7 - 133 - 10 - 10 - 100 - 50 - 10 - 500
Chilly - 8 - 2 - 16 - 5 - 5 - 25 - 15 - 5 - 75
Turmeric - 6 - 6 - 36 - 10 - 7 - 70 - 12 - 7 - 84
Cucumber - 10 - 7 - 70 - 10 - 10 - 100 - 26 - 10 - 260
Total for the project: - 71 53 675 70 87 1245 176 87 2223
32
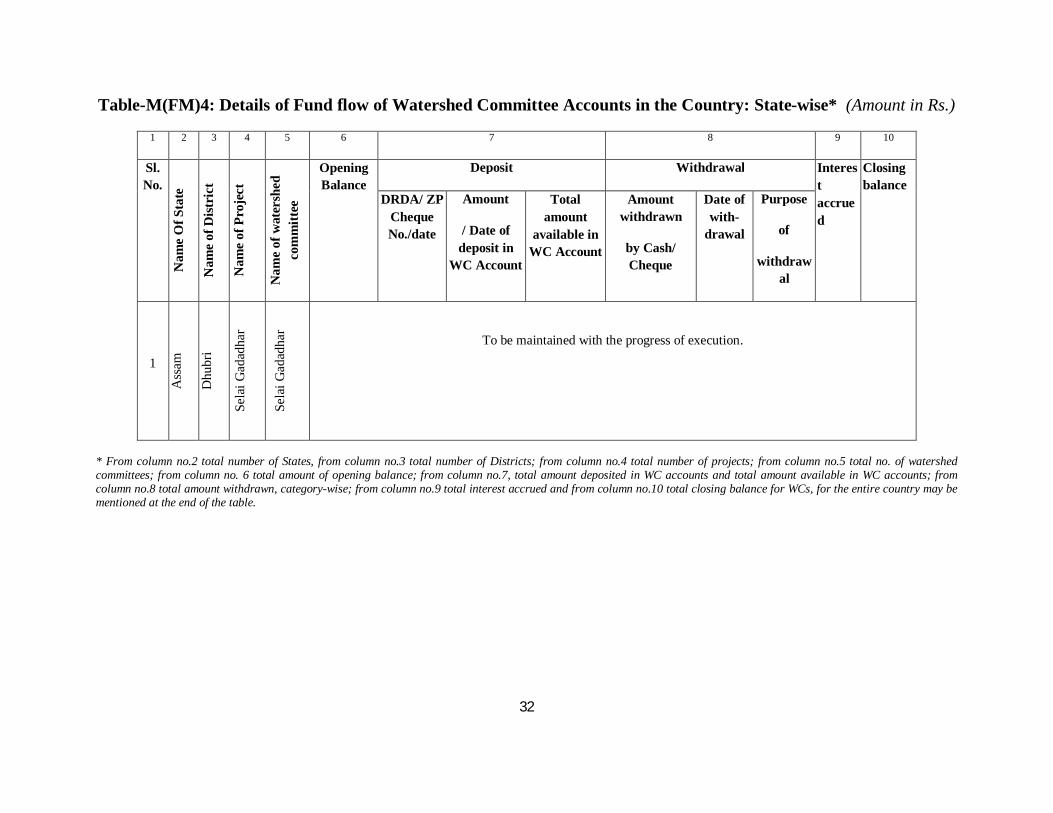
Table-M(FM)4: Details of Fund flow of Watershed Committee Accounts in the Country: State-wise* (Amount in Rs.)
1 2 3 4 5 6 7 8 9 10
Sl. No.
Nam
e O
f Sta
te
Nam
e of
Dis
tric
t
Nam
e of
Pro
ject
Nam
e of
wat
ersh
ed
com
mitt
ee
Opening Balance
Deposit Withdrawal Interest accrued
Closing balance
DRDA/ ZP Cheque No./date
Amount
/ Date of deposit in
WC Account
Total amount
available in WC Account
Amount withdrawn
by Cash/ Cheque
Date of with-
drawal
Purpose
of
withdrawal
1
Ass
am
Dhu
bri
Sela
i Gad
adha
r
Sela
i Gad
adha
r
To be maintained with the progress of execution.
* From column no.2 total number of States, from column no.3 total number of Districts; from column no.4 total number of projects; from column no.5 total no. of watershed committees; from column no. 6 total amount of opening balance; from column no.7, total amount deposited in WC accounts and total amount available in WC accounts; from column no.8 total amount withdrawn, category-wise; from column no.9 total interest accrued and from column no.10 total closing balance for WCs, for the entire country may be mentioned at the end of the table.

33
Table-M(FM)5: Details of pending UCs.
1 2 3 4 5 6 7 8 9 10 11 12
Sl. No.
Stat
e
Dis
tric
t
Proj
ect
Instal-ment no.
Financial year of
release of fund
Amount released (Rs. in lakh)
Amount utilized (Rs.in lakhs)
Submission of UC@
Date of Submission of
UC
Reasons for not
submitting/ delayed
submission of UC
Pending UCs
Due date
Amount (Rs. In lakhs)
Date Amount (Rs.
In lakhs)
Period Amount (Rs. in lakhs)
1
Ass
am
Dhu
bri
Birsing Jarua (IWDP)
3rd 2003-2004
209.71 154.93 Mar/04 154.93 July/04 154.93 Does not arise
Nil Nil
Dharmasala Hariyali Project
2ND 2004-05 164.15 130.65 Mar/
05
130.65 April/05 130.65 Nil Nil
Sonai-Tumni Hariyali Project
1st 2005-06 46.06 44.68 Mar/
06
44.68 July/06 44.68 Nil Nil
NWDPRA (7 nos) 7 2003-04 25.93 23.93 - 23.93 Oct/07 23.93 Nil Nil
Total: 445.85 354.19 354.19 354.19
34
CHAPTER –IV
PROPOSED MANAGEMENT PLAN
RESOURCE POTENTIALS, PROBLEMS AND CONSTRAINTS
RESOURCE POTENTIALS
The favourable climate and altitude, the high rainfall and humidity and the ecology make
the area a distinct and unique. The favourable climate for growth, the soil types, the water
resources, the diversity of crops etc. make the area endowed with rich potentials.
Crop diversity- The project area has good potentialities for growing a wide diversity of
crops because of favourable climate, rainfall and other factors. Food crops such as
cereals, pulses and oilseeds are grown in the project area although rice is by far the most
important crop. Other cereals grown in the area are maize, wheat, millet etc. the pulses
grown include black gram, green gram, lathyrus (khesari), peas, pegion pea (arahar) and
lentil. Among the oilseeds are mustard, sesame and ground nut. Cash crops include jute,
mesta cotton, potatoes and sugarcane. Horticultural crops include pineapple, banana,
orange and other citrus fruits, guava coconut, mango, jackfruit, litchi, plums, papaya etc.
The spice crops such as zinger, turmeric and tuber crops like tapioca, sweet potato etc.
are grown. Plantation crops like tea, rubber, black pepper, betel nut and betelvine, etc. are
common in the project area. All common vegetable are also grown in the project area.
Medicinal and aromatic crops as well as timber trees, bamboo and cane are also grown.
Grasses are more important in flush seasons, but tree leaves, shrubs and weeds have an
important role to play in feeding domestic livestocks during lean season.
35
Genetic diversity- The entire North Eastern Region of India is considered to be the home
of origin of many crops such as rice, cucumber, brinjal, phaseolus beans, amaranth,
mandarin orange and other citrus fruits including assam lemon, jambara etc. The wide
variability in the germplasm of the region is a major sources for improving productivity
of crops, enhancing quality and for imparting resistance to pests, diseases as well as
various other stress conditions. Agro industrial potentialities are rather vast in the entire
region. However, these potentialities for agro based industries have not been utilized fully
mainly because of infrastructural deficiencies, lack of awareness and other socio
economic bottlenecks.
Water resources- There is abundant resources of water in the area because of heavy
rainfall. There are also large numbers of tributaries emanating from the hills and flowing
through the project area in to the river Brahmaputra. With proper planning, harvesting
and management water resources potentials can be effectively utilized for production
purposes. Rain water from the major sources as well as natural lakes, ponds, springs,
beels, marshy lands and ground water etc. form other sources of water. The ground water
potentials of the area is also high.
Institutional base- Institutions concerned with development, education, research and
training in agriculture and allied sectors are vitally linked with improvement of
agriculture. The development departments of the Govt. of Assam like Department of
Agriculture, Soil Conservation, Animal Husbandry, Fishery, Sericulture, and Forestry are
proposed to facilitate coordinating in proper implementation of the management plan.
Technological and capacity building supports are proposed from the National Institute of
Rural Development (NIRD) (NER), Assam Remote Sensing Application Centre
(ARSAC), Assam Agriculture University (AAU) including Veterinary and Fishery
Colleges and Krishi Vikash Kendras (KVK) as well as other Research Centres including
ICAR research Complex at Borapani, Meghalaya etc.
36
CONSTRAINTS AND PROBLEMS:
Despite having so much of potentialities agriculture in the region have remained under
developed. It is primarily because there are also a number of constraints and problems
which are responsible for the present state of agricultural production. These constraints
can be grouped under five broad heads. These are (1) Climatic Constraints, (2)
Infrastructural Constraints, (3) Bio-physical Constraints, (4) Constraints of Management
and (5) Socio-economic Constraints.
Constraints of Climate include heavy rainfall with high intensity and periodic distribution
and humidity, low temperature during winter, low light intensity and radiation, recurrent
floods as well as drought conditions. The high rainfall and the humidity not only create
favourable environment for the prevalence of wide range of pests, diseases and weeds,
the rainfall also create problems not only of floods but also in drying, storage and hay
making etc. It needs to be mentioned however that there are also positive aspects of high
rainfall and humidity resulting in adequacy of water as well as favourable climate for
growth of crops.
Infrastructural Constraints include geographic isolation, lack of road, transport and
communication facilities, inadequacy of irrigated areas and lack of post harvest facilities
and marketing etc. Transport and communication system is absolutely poor in the entire
North Eastern Region. Similarly, the cost of transport to and fro out side the region is also
very costly and time consuming. Such a situation hampers not only in transfer of
technology, supply of input in time but also leads to higher cot in transportation; and thus
creating disadvantage in competitive market outside. The scope for increased production
utilizing modern technology, modern tools and higher rate of fertilizers is limited due to
lack of assured irrigation. Similarly, facilities for post harvest operations such as drying,
threshing, storage and processing have practically not been developed.
37
The acidic soil, in accessible areas, the varied undulating topography, soil erosion and
degradation, ecological imbalance, recurring floods, abundance of weeds, insects, pests,
and diseases and low level technology are some of the important bio-physical constraints
limiting agricultural production.
There are also a large number of problems connected with management of agricultural
production. Some important ones are the gap in extension, poor motivation and
awareness, inadequacy of training, lack of incentive for the farmers including non
assurance of support price; non availability of improved inputs in time, lack of credit
facilities and market, dearth of qualified manpower in many cases, weak linkage between
research and development and above all in effective coordination of all concerned.
STRATEGY-
The new approach envisages a broader vision of hydrological units (watershed)
comprising of clusters of micro watersheds. There would be a multi tier ridge to valley-
sequenced approach, which is proposed to be adopted towards implementation of
Watershed Development Project.
Keeping in mind in the guiding principles of watershed management the major thrust will
be to immediately increase the vegetative cover in the project area and to restore
degraded ecosystem, which is at critical stage. It is also equally stressed to conserve
rainwater through increasing time of concentration by way of decreasing the velocity of
runoff water, encouraging ground water recharge through surface water storage,
harvesting and distribution of rainwater arriving to provide alternative and self sustaining
occupation to the people with enhanced livelihood opportunities and improvements in
productivity and income.
An Integrated Watershed Management Project with due emphasis on protective
afforestation pasture development, scientific agriculture through various soil conservation
measures, harvesting of rainwater and runoff water, distribution of water to agriculture

38
field, horticulture, pisiculture, sericulture, piggery development, poultry development,
dairy development etc.
Emphasis should also be given adequately at imparting training and environmental
motivation programme to all users group and self help groups as such it is proposed to
make the people conscious and develop skill specially among womenfolk who are
traditionally an important constituent of the society particularly in respect of economic
activity and thereby improving access of the poor, specially women to the benefits and
ensuring access to usufructs right from common property resources for the resource poor.
The schemes proposed in the project area are basically on the basis on the participatory
rural appraisal (PRA) exercises conducted in the project area. The needs of the villagers
are taken into consideration and compromising on the availability of fund and magnitude
of the requirement of the villagers the schemes are proposed.
Entry Point Activities: With a view to establish credibility of the project implementing
agency as well as watershed development team and to create a rapport with the village
community some important entry point activities have been proposed as envisaged in the
guidelines of the Govt. of India. The schemes/projects are selected and proposed by the
PIA/Project Manager in consultation with the beneficiaries, the gram panchyats, the
watershed committee as well as the watershed development team.
A. Agricultural Strategy proposed:
Production of rice will have to be raised through improving productivity of winter and
summer rice through use of quality seeds, high yielding varieties, hybrid inputs and
irrigation potential. Area under rice with very poor productivity should be diverted to
summer rice with creation of irrigation potential.
However there is need to bridge the gap between research and extension for which the
Watershed Committee, Project Implementing Agency, The District Agricultural
39
Machinery as well as District Watershed Development Unit should Co-ordinate; not only
to increase agricultural production but also on agri. processing, input availability, and
marketing as well as overall transfer of technology from lab to land.
More over it is proposed that one no of Central Nursery with different suitable
horticultural species be raised under entry point activities as well as 0.5 ha of
Horticultural Nursery under work phase, so as to enable to distribute seedlings to the
people to supplement in their home stead garden and orchards. Crop demonstration
activities like paddy, vegetables and potato etc. are also proposed in the project area for
benefit of the beneficiaries.
B. Protective Afforestation:
Forest are important natural resources and they influence climate, soil conditions
particularly soil and water balance, erosion, floods, maintenance of bio-sphere, ecology
as well as wild flora and fauna etc. In this project it is proposed to create additional forest
coverage of 15.4 ha. in and around Selai Gadadhar with suitable species. In areas with
sandy soil in reverine environment Khair Sisso and Simul etc. should be planted while in
other areas plantation of bamboo be stressed as it is not only poor man’s timber but are
also needed for paper industries.
Moreover, it is proposed that one nos. of central nursery with around 3.00 lakhs planting
stock be raised with important forest species suitable for the locality under entry point
activity so that seedlings can be given to the people within the project area as well as
planting can be undertaken in road sides river bank and institutional campus.
C. Development of Pasture and Animal Husbandry:
The project area has good potential for development of animal husbandry, which needs
special attention. The rural people rear livestock and poultry as important source of
income.

40
Grasess like Gunea, Napier, Para and other locally available grass species may be
considered for being raised in the proposed area. It is proposed that two hectares of area
with fodder grass to be raised in the project area under entry point activity and output to
be sold to or may be distributed to the beneficiaries as the watershed committee /District
Watershed Development Unit feel proper.
As many as 234 units of Self Help Groups (SHGs) are selected in the project area to take
up schemes of rearing of milch cow, poultry, piggery and duckery, beekeeping etc.
D. Pisciculture:
Pisciculture is one of the important developmental schemes, which helps in improving
life style of the people. In one hand creation of water bodies helps in recharging of
ground water level and improves in soil moisture regime. On the other hand pisciculture
in water bodies like Farm Pond, fisheries etc. gives additional income to the farmers. In
general this would meet the nutrient requirement of the people in the project area and
others.
E. Soil and Water Conservation Activities:
In situ-conservation, utilization of soil and water within the Project is the prime criteria
for sustaining agricultural and horticultural production in the cultivated land for which
proper soil and water conservation activities are to be taken on priority basis. Therefore
considering the necessity for comprehensive in situ soil and water conservation measures
in the project area the following soil conservation engineering measures are
recommended as detailed in the work plan.
Water harvesting structures - To store runoff water and to check gully erosion as well as
sheet and rill erosion construction of R.C.C. check dams or drop spill ways, earthen
check dam, farm ponds, earthen embankments, water distribution channel etc. are
proposed in the project area which will give benefit to arrest soil loss, improve soil
41
moisture regime and increase production of crops of kharif as well as rabi crops in the
project area 7 nos. of water distribution canal are proposed to be constructed in the
project area. Further by using water pumps kharif crops can also be cultivated in nearby
areas.
F. Land Development:
To protect the land from erosion as well as to arrest the runoff water in the project area 16
nos. of earthen bunds with and without core wall involving 24420 m3 of earthworks are
proposed to be created in the project area to give benefit in about 900 hectares of
cultivated field.
These earthen bunds will also protect the paddy fields from inundation by the floodwater
of the adjoining Selai Gadadhar river and to give strength to the dykes boulder pitching is
also proposed in areas where it is felt needed.
G. Surface Water Storage / Ground Water Recharge:
To create facility for storage of runoff water and to facilitate rearing of fish construction
of RCC check dams, farm ponds, fishery ponds as well as reclamation of marshy lands
are also proposed in the project area. The water from the farms dug out ponds and ring
wells in agricultural fields and homestead garden will recharge the ground water level
about 3 mts. And can be utilized in paddy fields, orchards including vegetables gardens
can be utilized by using water pumps.
Moreover 14 nos. of open wells and 10 nos. of tube wells are also proposed in the project
area under EPA to recharge ground water level as well as for meeting up requirement of
drinking water of the people of the project area.
For effective implementation of the project activities in the project area all concerned
must share the overall responsibilities from the District Water Shed Development Unit
42
(DWDU) level to the Users Groups (UG) and Self Help Group (SHG) Level. For proper
and fruitful implementation of the Project the responsibility of the Project Implementing
Agency and that of the Watershed committee is maximum. The watershed Development
Team must co-ordinate with the watershed committee and Project Implementing Agency
for effective implementation of the water shed works. Proper Training to the Users
Groups (UG) and Self Help Groups (SHG) is most required for effective implementation
of the project activities.
43
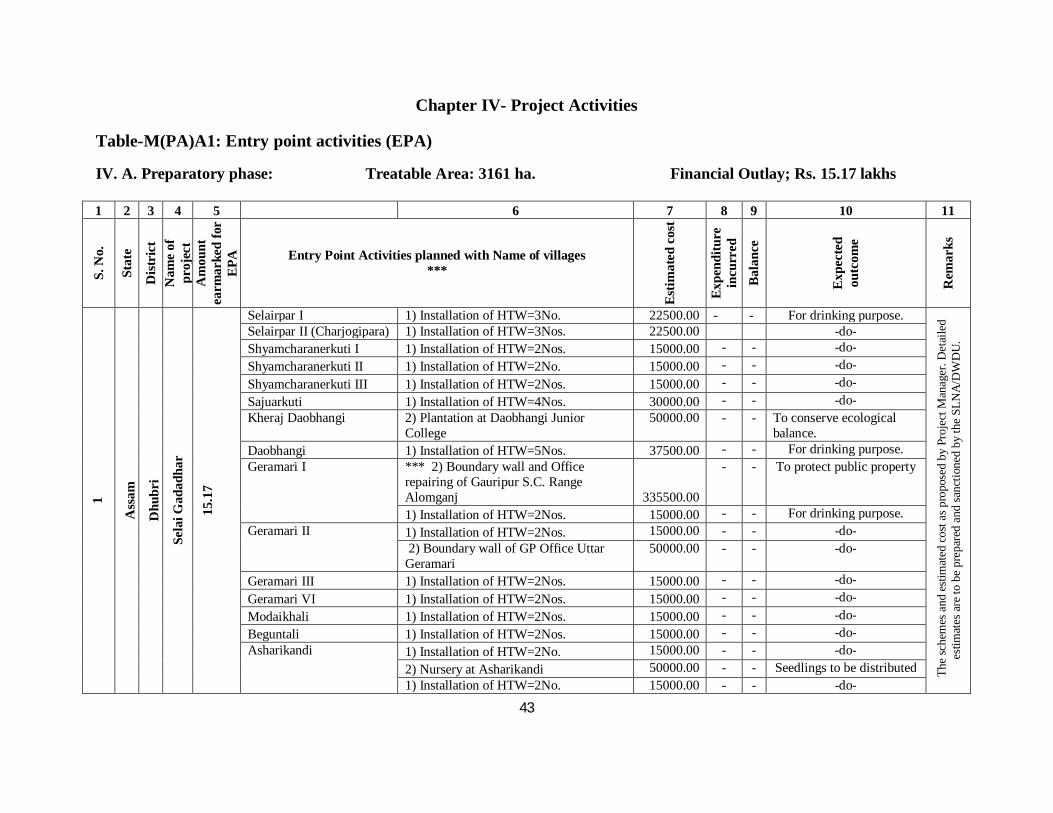
Chapter IV- Project Activities
Table-M(PA)A1: Entry point activities (EPA)
IV. A. Preparatory phase: Treatable Area: 3161 ha. Financial Outlay; Rs. 15.17 lakhs
1 2 3 4 5 6 7 8 9 10 11
S. N
o.
Stat
e
Dis
tric
t N
ame
of
proj
ect
Am
ount
ea
rmar
ked
for
EPA
Entry Point Activities planned with Name of villages ***
Est
imat
ed c
ost
Exp
endi
ture
in
curr
ed
Bal
ance
Exp
ecte
d ou
tcom
e
Rem
arks
1
Ass
am
D
hubr
i
Sela
i Gad
adha
r
15.1
7
Selairpar I 1) Installation of HTW=3No. 22500.00 - - For drinking purpose.
The
sche
mes
and
est
imat
ed c
ost a
s pro
pose
d by
Pro
ject
Man
ager
. Det
aile
d es
timat
es a
re to
be
prep
ared
and
sanc
tione
d by
the
SLN
A/D
WD
U.
Selairpar II (Charjogipara) 1) Installation of HTW=3Nos. 22500.00 -do- Shyamcharanerkuti I 1) Installation of HTW=2Nos. 15000.00 - - -do- Shyamcharanerkuti II 1) Installation of HTW=2No. 15000.00 - - -do- Shyamcharanerkuti III 1) Installation of HTW=2Nos. 15000.00 - - -do- Sajuarkuti 1) Installation of HTW=4Nos. 30000.00 - - -do- Kheraj Daobhangi 2) Plantation at Daobhangi Junior
College 50000.00 - - To conserve ecological
balance. Daobhangi 1) Installation of HTW=5Nos. 37500.00 - - For drinking purpose. Geramari I *** 2) Boundary wall and Office
repairing of Gauripur S.C. Range Alomganj 335500.00
- - To protect public property
1) Installation of HTW=2Nos. 15000.00 - - For drinking purpose. Geramari II
1) Installation of HTW=2Nos. 15000.00 - - -do- 2) Boundary wall of GP Office Uttar Geramari
50000.00 - - -do-
Geramari III 1) Installation of HTW=2Nos. 15000.00 - - -do- Geramari VI 1) Installation of HTW=2Nos. 15000.00 - - -do- Modaikhali 1) Installation of HTW=2Nos. 15000.00 - - -do- Beguntali 1) Installation of HTW=2Nos. 15000.00 - - -do- Asharikandi
1) Installation of HTW=2No. 15000.00 - - -do- 2) Nursery at Asharikandi 50000.00 - - Seedlings to be distributed 1) Installation of HTW=2No. 15000.00 - - -do-
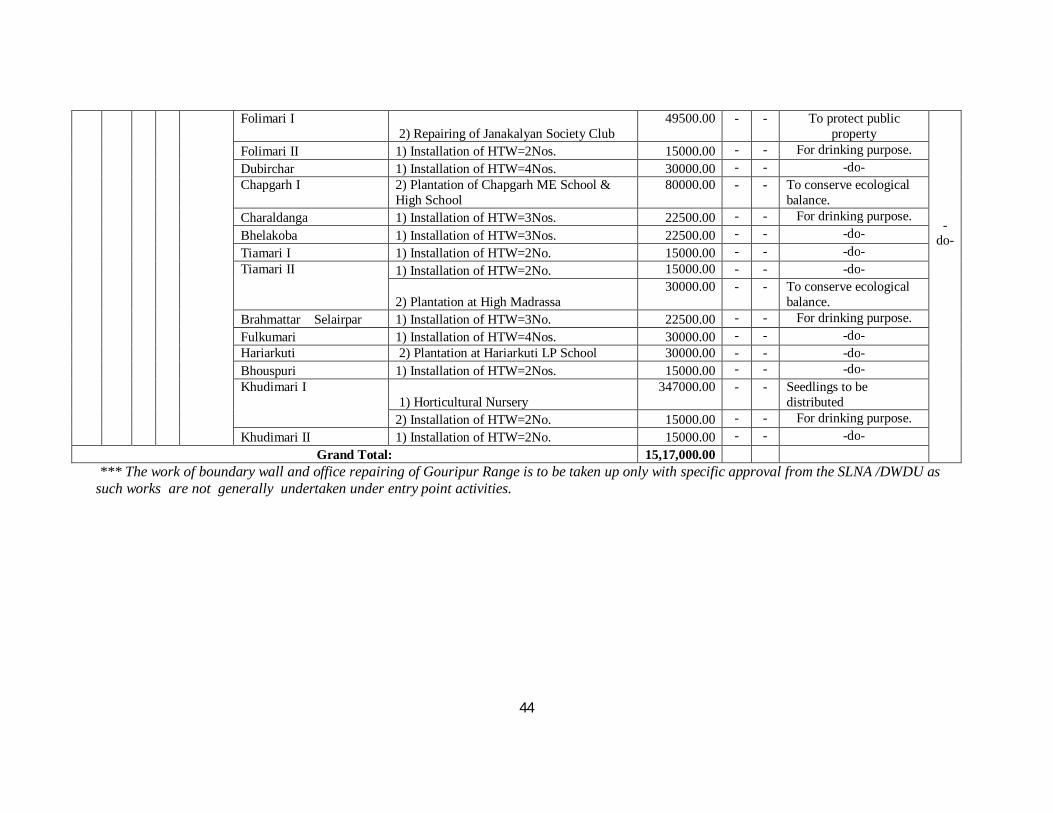
44
Folimari I 2) Repairing of Janakalyan Society Club
49500.00 - - To protect public property
-
do-
Folimari II 1) Installation of HTW=2Nos. 15000.00 - - For drinking purpose. Dubirchar 1) Installation of HTW=4Nos. 30000.00 - - -do- Chapgarh I 2) Plantation of Chapgarh ME School &
High School 80000.00 - - To conserve ecological
balance. Charaldanga 1) Installation of HTW=3Nos. 22500.00 - - For drinking purpose. Bhelakoba 1) Installation of HTW=3Nos. 22500.00 - - -do- Tiamari I 1) Installation of HTW=2No. 15000.00 - - -do- Tiamari II 1) Installation of HTW=2No. 15000.00 - - -do-
2) Plantation at High Madrassa 30000.00 - - To conserve ecological
balance. Brahmattar Selairpar 1) Installation of HTW=3No. 22500.00 - - For drinking purpose. Fulkumari 1) Installation of HTW=4Nos. 30000.00 - - -do- Hariarkuti 2) Plantation at Hariarkuti LP School 30000.00 - - -do- Bhouspuri 1) Installation of HTW=2Nos. 15000.00 - - -do- Khudimari I
1) Horticultural Nursery 347000.00 - - Seedlings to be
distributed 2) Installation of HTW=2No. 15000.00 - - For drinking purpose.
Khudimari II 1) Installation of HTW=2No. 15000.00 - - -do- Grand Total: 15,17,000.00
*** The work of boundary wall and office repairing of Gouripur Range is to be taken up only with specific approval from the SLNA /DWDU as such works are not generally undertaken under entry point activities.
45
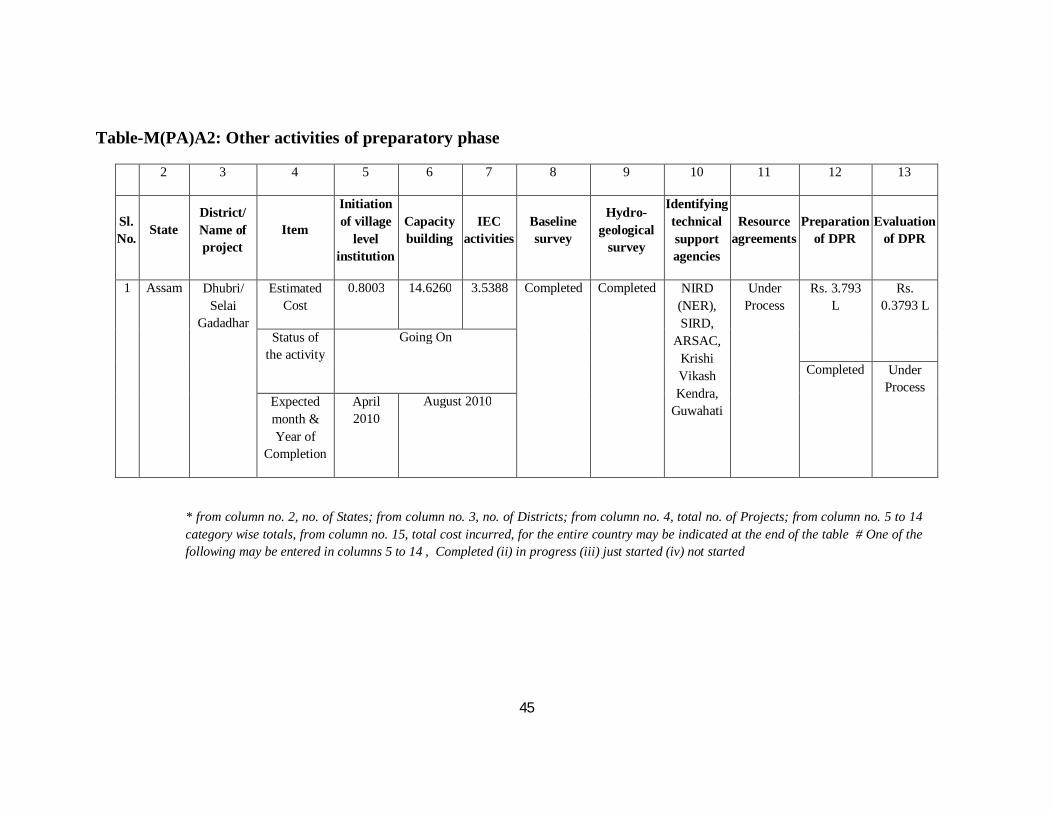
Table-M(PA)A2: Other activities of preparatory phase
2 3 4 5 6 7 8 9 10 11 12 13
Sl. No.
State District/ Name of project
Item
Initiation of village
level institution
Capacity building
IEC activities
Baseline survey
Hydro-geological
survey
Identifying technical support agencies
Resource agreements
Preparation of DPR
Evaluation of DPR
1 Assam Dhubri/ Selai
Gadadhar
Estimated Cost
0.8003 14.6260 3.5388 Completed Completed NIRD (NER), SIRD,
ARSAC, Krishi Vikash Kendra,
Guwahati
Under Process
Rs. 3.793 L
Rs. 0.3793 L
Status of the activity
Going On
Completed Under Process
Expected month & Year of
Completion
April 2010
August 2010
* from column no. 2, no. of States; from column no. 3, no. of Districts; from column no. 4, total no. of Projects; from column no. 5 to 14 category wise totals, from column no. 15, total cost incurred, for the entire country may be indicated at the end of the table # One of the following may be entered in columns 5 to 14 , Completed (ii) in progress (iii) just started (iv) not started
46
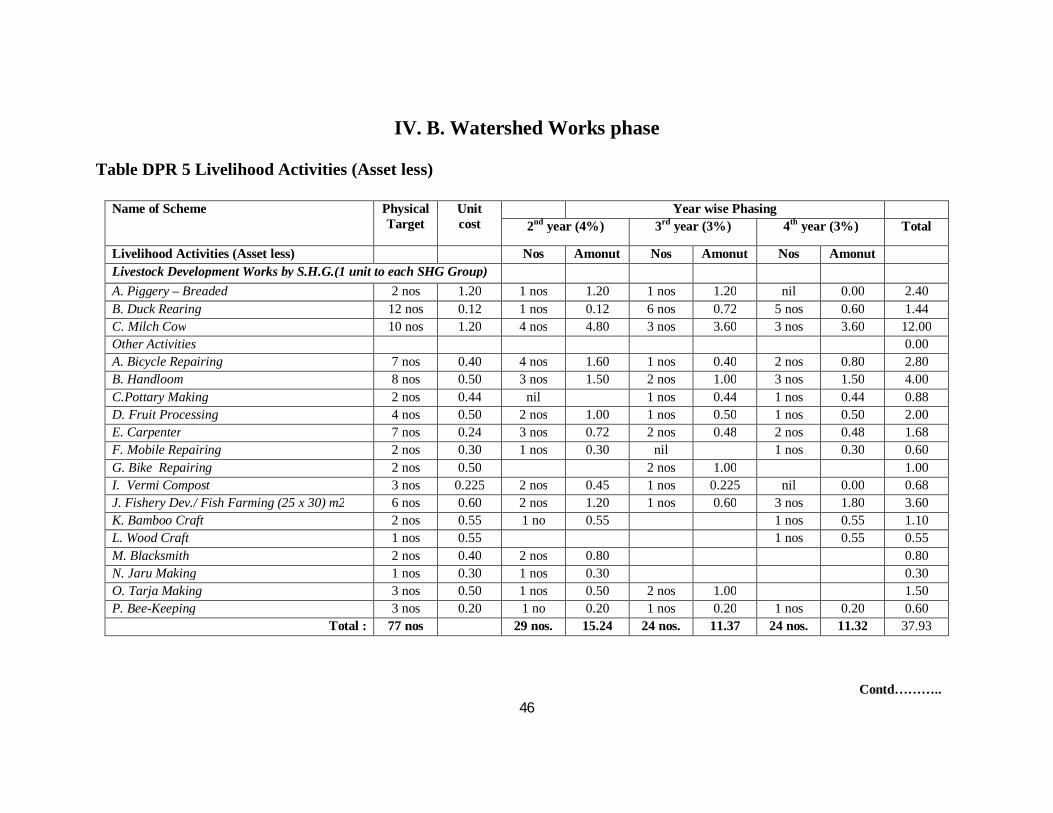
IV. B. Watershed Works phase
Table DPR 5 Livelihood Activities (Asset less)
Name of Scheme Physical
Target Unit cost
Year wise Phasing 2nd year (4%) 3rd year (3%) 4th year (3%) Total
Livelihood Activities (Asset less) Nos Amonut Nos Amonut Nos Amonut Livestock Development Works by S.H.G.(1 unit to each SHG Group) A. Piggery – Breaded 2 nos 1.20 1 nos 1.20 1 nos 1.20 nil 0.00 2.40 B. Duck Rearing 12 nos 0.12 1 nos 0.12 6 nos 0.72 5 nos 0.60 1.44 C. Milch Cow 10 nos 1.20 4 nos 4.80 3 nos 3.60 3 nos 3.60 12.00 Other Activities 0.00 A. Bicycle Repairing 7 nos 0.40 4 nos 1.60 1 nos 0.40 2 nos 0.80 2.80 B. Handloom 8 nos 0.50 3 nos 1.50 2 nos 1.00 3 nos 1.50 4.00 C.Pottary Making 2 nos 0.44 nil 1 nos 0.44 1 nos 0.44 0.88 D. Fruit Processing 4 nos 0.50 2 nos 1.00 1 nos 0.50 1 nos 0.50 2.00 E. Carpenter 7 nos 0.24 3 nos 0.72 2 nos 0.48 2 nos 0.48 1.68 F. Mobile Repairing 2 nos 0.30 1 nos 0.30 nil 1 nos 0.30 0.60 G. Bike Repairing 2 nos 0.50 2 nos 1.00 1.00 I. Vermi Compost 3 nos 0.225 2 nos 0.45 1 nos 0.225 nil 0.00 0.68 J. Fishery Dev./ Fish Farming (25 x 30) m2 6 nos 0.60 2 nos 1.20 1 nos 0.60 3 nos 1.80 3.60 K. Bamboo Craft 2 nos 0.55 1 no 0.55 1 nos 0.55 1.10 L. Wood Craft 1 nos 0.55 1 nos 0.55 0.55 M. Blacksmith 2 nos 0.40 2 nos 0.80 0.80 N. Jaru Making 1 nos 0.30 1 nos 0.30 0.30 O. Tarja Making 3 nos 0.50 1 nos 0.50 2 nos 1.00 1.50 P. Bee-Keeping 3 nos 0.20 1 no 0.20 1 nos 0.20 1 nos 0.20 0.60
Total : 77 nos 29 nos. 15.24 24 nos. 11.37 24 nos. 11.32 37.93
Contd………..
47
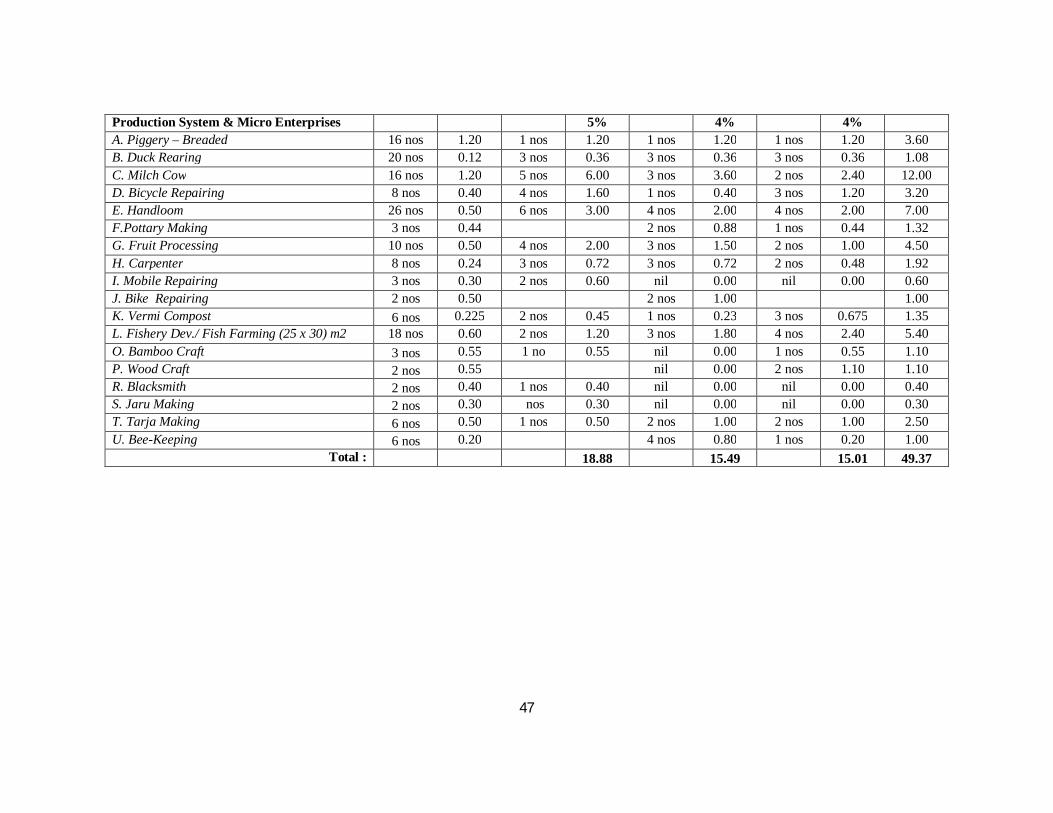
Production System & Micro Enterprises 5% 4% 4% A. Piggery – Breaded 16 nos 1.20 1 nos 1.20 1 nos 1.20 1 nos 1.20 3.60 B. Duck Rearing 20 nos 0.12 3 nos 0.36 3 nos 0.36 3 nos 0.36 1.08 C. Milch Cow 16 nos 1.20 5 nos 6.00 3 nos 3.60 2 nos 2.40 12.00 D. Bicycle Repairing 8 nos 0.40 4 nos 1.60 1 nos 0.40 3 nos 1.20 3.20 E. Handloom 26 nos 0.50 6 nos 3.00 4 nos 2.00 4 nos 2.00 7.00 F.Pottary Making 3 nos 0.44 2 nos 0.88 1 nos 0.44 1.32 G. Fruit Processing 10 nos 0.50 4 nos 2.00 3 nos 1.50 2 nos 1.00 4.50 H. Carpenter 8 nos 0.24 3 nos 0.72 3 nos 0.72 2 nos 0.48 1.92 I. Mobile Repairing 3 nos 0.30 2 nos 0.60 nil 0.00 nil 0.00 0.60 J. Bike Repairing 2 nos 0.50 2 nos 1.00 1.00 K. Vermi Compost 6 nos 0.225 2 nos 0.45 1 nos 0.23 3 nos 0.675 1.35 L. Fishery Dev./ Fish Farming (25 x 30) m2 18 nos 0.60 2 nos 1.20 3 nos 1.80 4 nos 2.40 5.40 O. Bamboo Craft 3 nos 0.55 1 no 0.55 nil 0.00 1 nos 0.55 1.10 P. Wood Craft 2 nos 0.55 nil 0.00 2 nos 1.10 1.10 R. Blacksmith 2 nos 0.40 1 nos 0.40 nil 0.00 nil 0.00 0.40 S. Jaru Making 2 nos 0.30 nos 0.30 nil 0.00 nil 0.00 0.30 T. Tarja Making 6 nos 0.50 1 nos 0.50 2 nos 1.00 2 nos 1.00 2.50 U. Bee-Keeping 6 nos 0.20 4 nos 0.80 1 nos 0.20 1.00
Total : 18.88 15.49 15.01 49.37
48
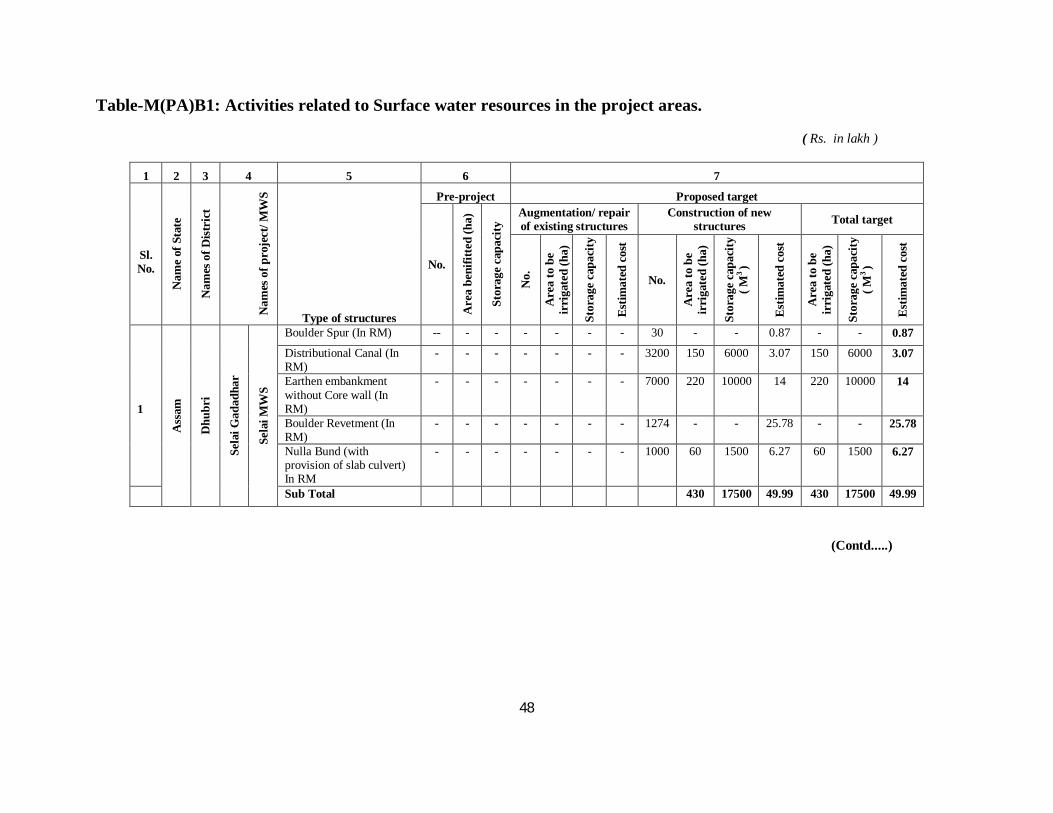
Table-M(PA)B1: Activities related to Surface water resources in the project areas.
( Rs. in lakh )
1 2 3 4 5 6 7
Sl. No.
Nam
e of
Sta
te
Nam
es o
f Dist
rict
Nam
es o
f pro
ject
/ MW
S
Type of structures
Pre-project Proposed target
No.
Are
a be
nifit
ted
(ha)
Stor
age
capa
city
Augmentation/ repair of existing structures
Construction of new structures Total target
No.
Are
a to
be
irri
gate
d (h
a)
Stor
age
capa
city
Estim
ated
cos
t
No.
Are
a to
be
irri
gate
d (h
a)
Stor
age
capa
city
( M3 )
Estim
ated
cos
t
Are
a to
be
irri
gate
d (h
a)
Stor
age
capa
city
( M
3 )
Estim
ated
cos
t
Ass
am
Dhu
bri
Sela
i Gad
adha
r
Sela
i MW
S
Boulder Spur (In RM) -- - - - - - - 30 - - 0.87 - - 0.87
Distributional Canal (In RM)
- - - - - - - 3200 150 6000 3.07 150 6000 3.07
1
Earthen embankment without Core wall (In RM)
- - - - - - - 7000 220 10000 14 220 10000 14
Boulder Revetment (In RM)
- - - - - - - 1274 - - 25.78 - - 25.78
Nulla Bund (with provision of slab culvert) In RM
- - - - - - - 1000 60 1500 6.27 60 1500 6.27
Sub Total 430 17500 49.99 430 17500 49.99
(Contd.....)
49
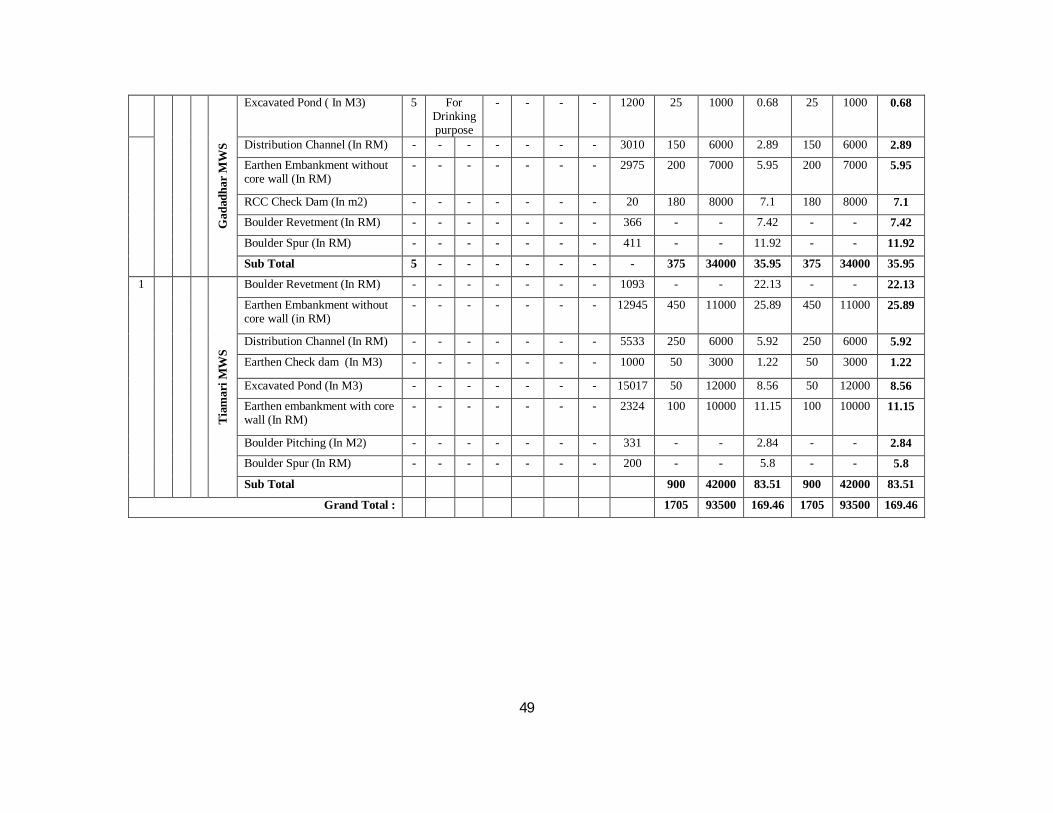
Gad
adha
r MW
S
Excavated Pond ( In M3) 5 For Drinking purpose
- - - - 1200 25 1000 0.68 25 1000 0.68
Distribution Channel (In RM) - - - - - - - 3010 150 6000 2.89 150 6000 2.89
Earthen Embankment without core wall (In RM)
- - - - - - - 2975 200 7000 5.95 200 7000 5.95
RCC Check Dam (In m2) - - - - - - - 20 180 8000 7.1 180 8000 7.1
Boulder Revetment (In RM) - - - - - - - 366 - - 7.42 - - 7.42
Boulder Spur (In RM) - - - - - - - 411 - - 11.92 - - 11.92
Sub Total 5 - - - - - - - 375 34000 35.95 375 34000 35.95
1
Tiam
ari M
WS
Boulder Revetment (In RM) - - - - - - - 1093 - - 22.13 - - 22.13
Earthen Embankment without core wall (in RM)
- - - - - - - 12945 450 11000 25.89 450 11000 25.89
Distribution Channel (In RM) - - - - - - - 5533 250 6000 5.92 250 6000 5.92
Earthen Check dam (In M3) - - - - - - - 1000 50 3000 1.22 50 3000 1.22
Excavated Pond (In M3) - - - - - - - 15017 50 12000 8.56 50 12000 8.56
Earthen embankment with core wall (In RM)
- - - - - - - 2324 100 10000 11.15 100 10000 11.15
Boulder Pitching (In M2) - - - - - - - 331 - - 2.84 - - 2.84
Boulder Spur (In RM) - - - - - - - 200 - - 5.8 - - 5.8
Sub Total 900 42000 83.51 900 42000 83.51
Grand Total : 1705 93500 169.46 1705 93500 169.46
50
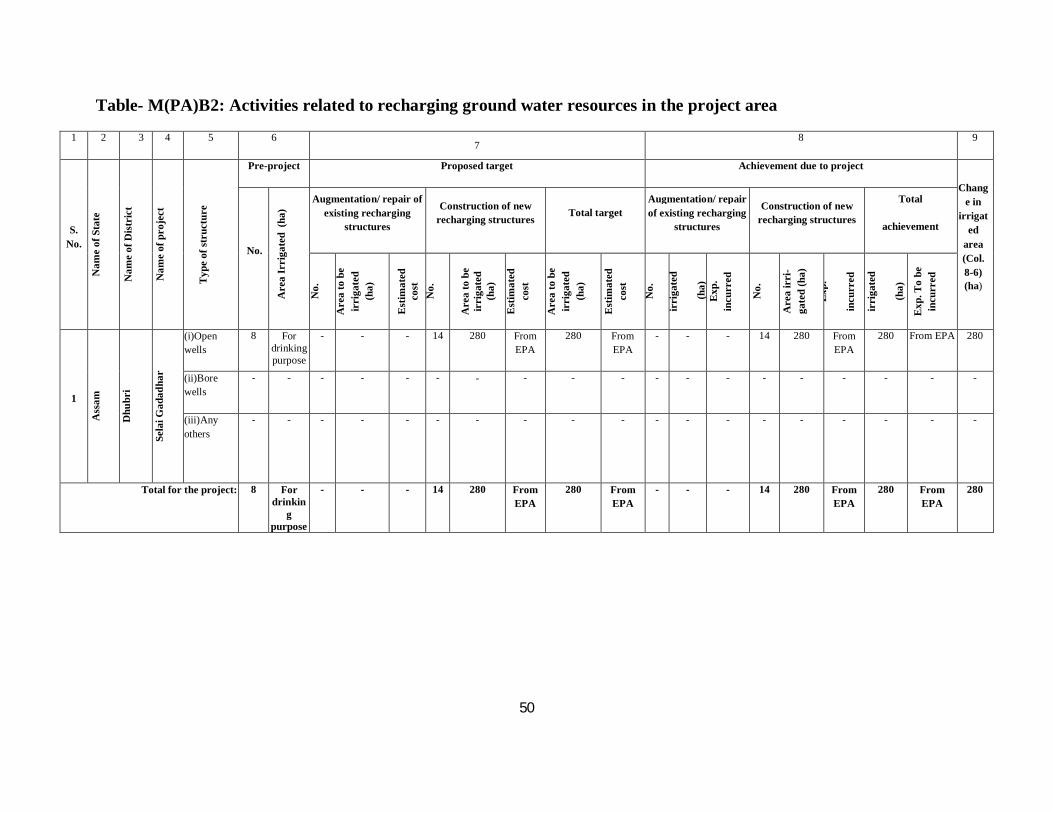
Table- M(PA)B2: Activities related to recharging ground water resources in the project area
1 2 3 4 5 6 7
8 9
S. No.
Nam
e of
Sta
te
Nam
e of
Dis
tric
t
Nam
e of
pro
ject
Typ
e of
stru
ctur
e
Pre-project Proposed target Achievement due to project
Change in
irrigated
area (Col. 8-6) (ha)
No.
Are
a Ir
riga
ted
(ha)
Augmentation/ repair of existing recharging
structures
Construction of new recharging structures
Total target Augmentation/ repair of existing recharging
structures
Construction of new recharging structures
Total
achievement
No.
Are
a to
be
irri
gate
d (h
a)
Est
imat
ed
cost
N
o.
Are
a to
be
irri
gate
d (h
a)
Est
imat
ed
cost
Are
a to
be
irri
gate
d (h
a)
Est
imat
ed
cost
No.
irri
gate
d
(ha)
E
xp.
incu
rred
No.
Are
a ir
ri-
gate
d (h
a)
Exp
.
incu
rred
irri
gate
d
(ha)
Exp
. To
be
incu
rred
1
Ass
am
Dhu
bri
Sela
i Gad
adha
r
(i)Open wells
8 For drinking purpose
- - - 14 280 From EPA
280 From EPA
- - - 14 280 From EPA
280 From EPA 280
(ii)Bore wells
- - - - - - - - - - - - - - - - - - -
(iii)Any others
- - - - - - - - - - - - - - - - - - -
Total for the project: 8 For drinkin
g purpose
- - - 14 280 From EPA
280 From EPA
- - - 14 280 From EPA
280 From EPA
280
51
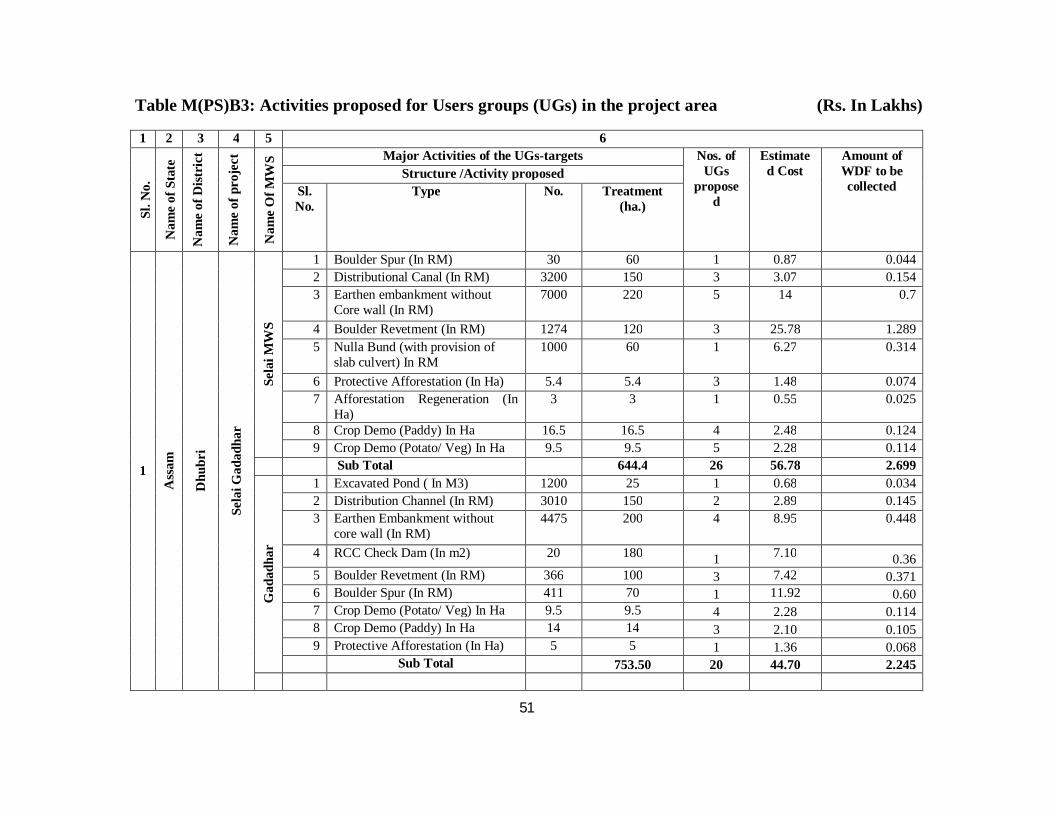
Table M(PS)B3: Activities proposed for Users groups (UGs) in the project area (Rs. In Lakhs)
1 2 3 4 5 6 Sl
. No.
Nam
e of
Sta
te
Nam
e of
Dis
tric
t
Nam
e of
pro
ject
Nam
e O
f MW
S Major Activities of the UGs-targets Nos. of UGs
proposed
Estimated Cost
Amount of WDF to be collected
Structure /Activity proposed Sl. No.
Type No. Treatment (ha.)
1
Ass
am
Dhu
bri
Sela
i Gad
adha
r
Sela
i MW
S 1 Boulder Spur (In RM) 30 60 1 0.87 0.044 2 Distributional Canal (In RM) 3200 150 3 3.07 0.154 3 Earthen embankment without
Core wall (In RM) 7000 220 5 14 0.7
4 Boulder Revetment (In RM) 1274 120 3 25.78 1.289 5 Nulla Bund (with provision of
slab culvert) In RM 1000 60 1 6.27 0.314
6 Protective Afforestation (In Ha) 5.4 5.4 3 1.48 0.074 7 Afforestation Regeneration (In
Ha) 3 3 1 0.55 0.025
8 Crop Demo (Paddy) In Ha 16.5 16.5 4 2.48 0.124 9 Crop Demo (Potato/ Veg) In Ha 9.5 9.5 5 2.28 0.114
Sub Total 644.4 26 56.78 2.699
Gad
adha
r
1 Excavated Pond ( In M3) 1200 25 1 0.68 0.034 2 Distribution Channel (In RM) 3010 150 2 2.89 0.145 3 Earthen Embankment without
core wall (In RM) 4475 200 4 8.95 0.448
4 RCC Check Dam (In m2) 20 180 1 7.10 0.36 5 Boulder Revetment (In RM) 366 100 3 7.42 0.371 6 Boulder Spur (In RM) 411 70 1 11.92 0.60 7 Crop Demo (Potato/ Veg) In Ha 9.5 9.5 4 2.28 0.114 8 Crop Demo (Paddy) In Ha 14 14 3 2.10 0.105 9 Protective Afforestation (In Ha) 5 5 1 1.36 0.068 Sub Total 753.50 20 44.70 2.245
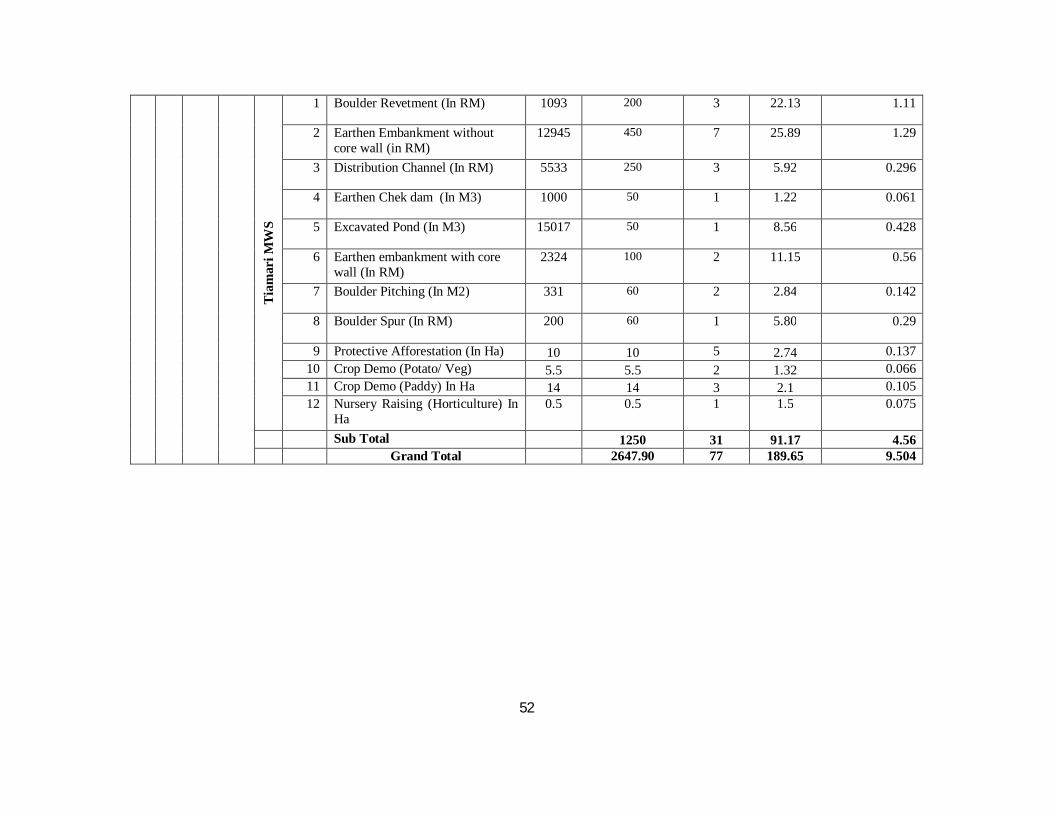
52
Tia
mar
i MW
S
1 Boulder Revetment (In RM) 1093 200 3 22.13 1.11
2 Earthen Embankment without core wall (in RM)
12945 450 7 25.89 1.29
3 Distribution Channel (In RM) 5533 250 3 5.92 0.296
4 Earthen Chek dam (In M3) 1000 50 1 1.22 0.061
5 Excavated Pond (In M3) 15017 50 1 8.56 0.428
6 Earthen embankment with core wall (In RM)
2324 100 2 11.15 0.56
7 Boulder Pitching (In M2) 331 60 2 2.84 0.142
8 Boulder Spur (In RM) 200 60 1 5.80 0.29
9 Protective Afforestation (In Ha) 10 10 5 2.74 0.137 10 Crop Demo (Potato/ Veg) 5.5 5.5 2 1.32 0.066 11 Crop Demo (Paddy) In Ha 14 14 3 2.1 0.105 12 Nursery Raising (Horticulture) In
Ha 0.5 0.5 1 1.5 0.075
Sub Total 1250 31 91.17 4.56 Grand Total 2647.90 77 189.65 9.504
53
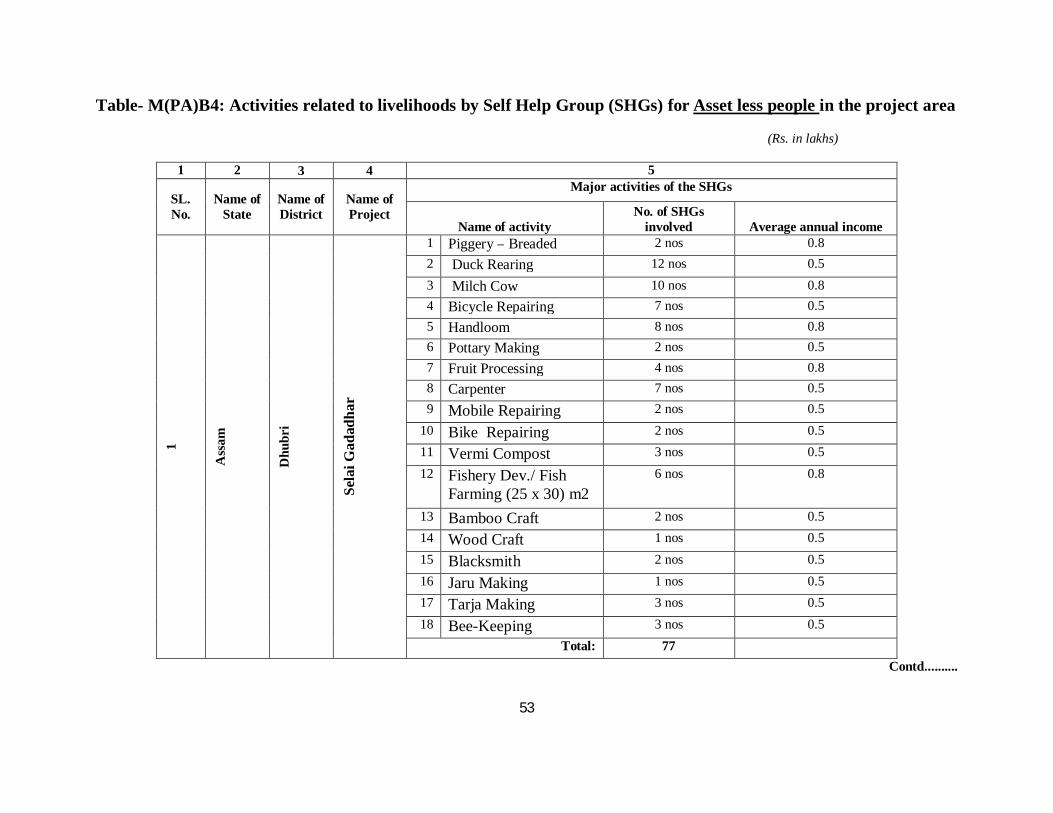
Table- M(PA)B4: Activities related to livelihoods by Self Help Group (SHGs) for Asset less people in the project area
(Rs. in lakhs)
1 2 3 4 5
SL. No.
Name of State
Name of District
Name of Project
Major activities of the SHGs
Name of activity No. of SHGs
involved Average annual income
1
Ass
am
Dhu
bri
Sela
i Gad
adha
r
1 Piggery – Breaded 2 nos 0.8 2 Duck Rearing 12 nos 0.5 3 Milch Cow 10 nos 0.8 4 Bicycle Repairing 7 nos 0.5 5 Handloom 8 nos 0.8 6 Pottary Making 2 nos 0.5 7 Fruit Processing 4 nos 0.8 8 Carpenter 7 nos 0.5 9 Mobile Repairing 2 nos 0.5
10 Bike Repairing 2 nos 0.5 11 Vermi Compost 3 nos 0.5 12 Fishery Dev./ Fish
Farming (25 x 30) m2 6 nos 0.8
13 Bamboo Craft 2 nos 0.5 14 Wood Craft 1 nos 0.5 15 Blacksmith 2 nos 0.5 16 Jaru Making 1 nos 0.5 17 Tarja Making 3 nos 0.5 18 Bee-Keeping 3 nos 0.5
Total: 77 Contd..........
54
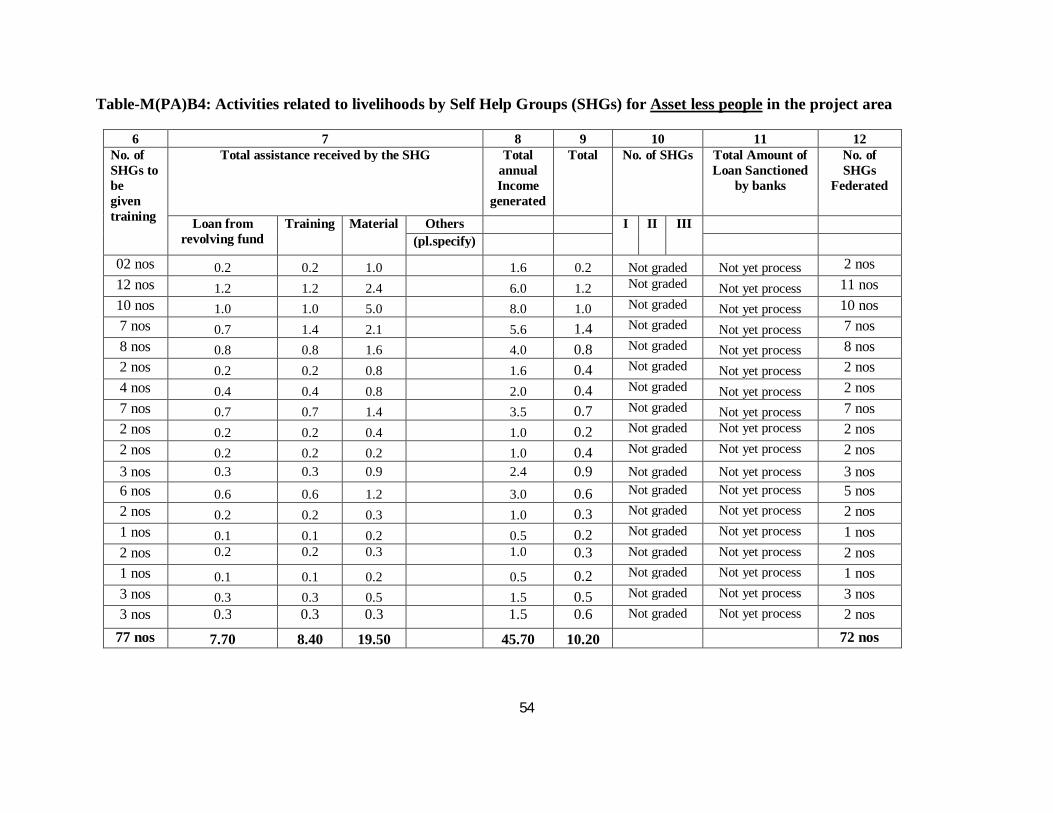
Table-M(PA)B4: Activities related to livelihoods by Self Help Groups (SHGs) for Asset less people in the project area
6 7 8 9 10 11 12 No. of SHGs to be given training
Total assistance received by the SHG Total annual Income
generated
Total No. of SHGs Total Amount of Loan Sanctioned
by banks
No. of SHGs
Federated
Loan from revolving fund
Training Material Others I II III (pl.specify)
02 nos 0.2 0.2 1.0 1.6 0.2 Not graded Not yet process 2 nos 12 nos 1.2 1.2 2.4 6.0 1.2 Not graded Not yet process 11 nos 10 nos 1.0 1.0 5.0 8.0 1.0 Not graded Not yet process 10 nos 7 nos 0.7 1.4 2.1 5.6 1.4 Not graded Not yet process 7 nos 8 nos 0.8 0.8 1.6 4.0 0.8 Not graded Not yet process 8 nos 2 nos 0.2 0.2 0.8 1.6 0.4 Not graded Not yet process 2 nos 4 nos 0.4 0.4 0.8 2.0 0.4 Not graded Not yet process 2 nos 7 nos 0.7 0.7 1.4 3.5 0.7 Not graded Not yet process 7 nos 2 nos 0.2 0.2 0.4 1.0 0.2 Not graded Not yet process 2 nos 2 nos 0.2 0.2 0.2 1.0 0.4 Not graded Not yet process 2 nos 3 nos 0.3 0.3 0.9 2.4 0.9 Not graded Not yet process 3 nos 6 nos 0.6 0.6 1.2 3.0 0.6 Not graded Not yet process 5 nos 2 nos 0.2 0.2 0.3 1.0 0.3 Not graded Not yet process 2 nos 1 nos 0.1 0.1 0.2 0.5 0.2 Not graded Not yet process 1 nos 2 nos 0.2 0.2 0.3 1.0 0.3 Not graded Not yet process 2 nos 1 nos 0.1 0.1 0.2 0.5 0.2 Not graded Not yet process 1 nos 3 nos 0.3 0.3 0.5 1.5 0.5 Not graded Not yet process 3 nos 3 nos 0.3 0.3 0.3 1.5 0.6 Not graded Not yet process 2 nos
77 nos 7.70 8.40 19.50 45.70 10.20 72 nos

55
Table-M(PA)B4: Activities related to livelihoods by Self Help Groups (SHGs) Under Production System & Micro Enterprises in the project area
1 2 3 4 5
SL. N
o.
Nam
e of
the
Stat
e
Nam
e of
the
dist
rict
Nam
e of
the
proj
ect
Major activities of the SHGs Name of activity No. of
SHGs involved
Average annual income
from activity per SHG
1 Assam Dhubri Selai Gadadhar
1 Piggery – Breaded 16 nos 0.8
2 Duck Rearing 20 nos 0.5
3 Milch Cow 16 nos 0.8
4 Bicycle Repairing 8 nos 0.5
5 Handloom 26 nos 0.8
6 Pottary Making 3 nos 0.5
7 Fruit Processing 10 nos 0.8
8 Carpenter 8 nos 0.5
9 Mobile Repairing 3 nos 0.5
10 Bike Repairing 2 nos 0.5
11 Vermi Compost 6 nos 0.5
12 Fishery Dev./ Fish Farming (25 x 30) m2 18 nos 0.8 13 Bamboo Craft 3 nos 0.5
14 Wood Craft 2 nos 0.5
15 Blacksmith 2 nos 0.5
16 Jaru Making 2 nos 0.5
17 Tarja Making 6 nos 0.5
18 Bee-Keeping 6 nos 0.5
Total: 157

56
Table-M(PA)B4: Activities related to livelihoods by Self Help Groups (SHGs) Under Production System & Micro Enterprises in the project area
6 7 8 9 10 11 12 No. of
SHGs to be given
training
Total assistance received by the SHG (Rs. In Lakh)
Total annual Income
generated (Rs. In Lakh)
Total Annual
Savings (Rs. In Lakh)
No. of SHGs Graded as
Total Amount of loan
sanctioned by the banks (s)
No. of SHGs
federated
Loan from revolving
fund
Training Material Others (pl.specify)
I II III
16 nos 1.60 1.60 8.00 - 12.80 1.60 Not graded Under process 16 nos 20 nos 2.00 2.00 4.00 - 10.00 2.00 Not graded -do- 20 nos 16 nos 1.60 1.60 8.00 - 12.80 1.60 Not graded -do- 16 nos 8 nos 0.80 0.80 1.60 - 4.00 0.80 Not graded -do- 8 nos 26 nos 2.60 5.20 7.80 - 20.80 5.20 Not graded -do- 26 nos 3 nos 0.30 0.30 0.60 - 1.50 0.30 Not graded -do- 3 nos 10 nos 1.00 1.00 2.00 - 5.00 1.00 Not graded -do- 10 nos 8 nos 0.80 0.80 1.60 - 4.00 0.80 Not graded -do- 8 nos 3 nos 0.30 0.30 0.60 - 1.50 0.30 Not graded -do- 3 nos 2 nos 0.20 0.20 0.40 - 1.00 0.20 Not graded -do- 2 nos 6 nos 0.60 0.60 1.20 - 3.00 0.60 Not graded -do- 6 nos 18 nos 1.80 1.80 3.60 - 9.00 1.80 Not graded -do- 18 nos 3 nos 0.30 0.30 0.60 - 1.50 0.30 Not graded -do- 3 nos 2 nos 0.20 0.20 0.40 - 1.00 0.20 Not graded -do- 2 nos 2 nos 0.20 0.20 0.40 - 1.00 0.20 Not graded -do- 2 nos 2 nos 0.20 0.20 0.40 - 1.00 0.20 Not graded -do- 2 nos 6 nos 0.60 0.60 1.20 - 3.00 0.60 Not graded -do- 6 nos 6 nos 0.60 0.60 1.20 - 3.00 0.60 Not graded -do- 6 nos
157 Nos. 15.70 18.30 43.60 95.90 18.30 157 Nos.
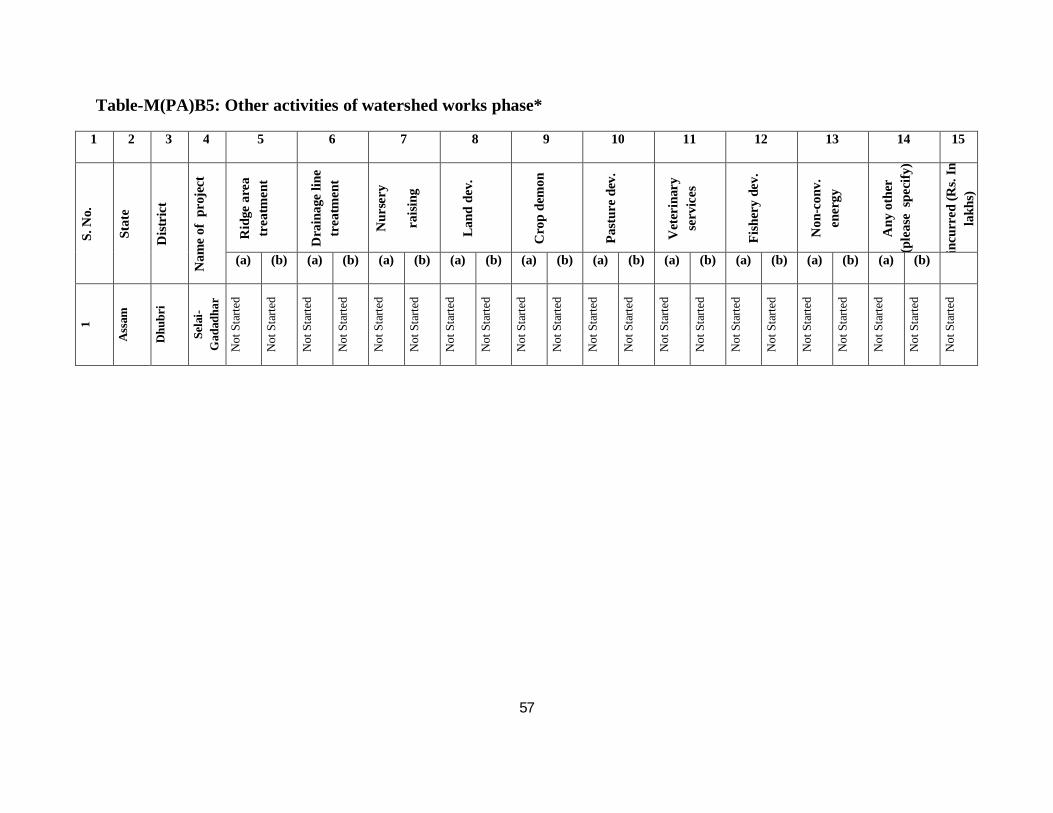
57
Table-M(PA)B5: Other activities of watershed works phase*
1 2 3 4 5 6 7 8 9 10 11 12 13 14 15
S. N
o.
Stat
e
Dis
tric
t
Nam
e of
pro
ject
Rid
ge a
rea
trea
tmen
t
Dra
inag
e lin
e tr
eatm
ent
Nur
sery
rais
ing
Lan
d de
v.
Cro
p de
mon
Past
ure
dev.
Vet
erin
ary
serv
ices
Fish
ery
dev.
Non
-con
v.
ener
gy
Any
oth
er
(ple
ase
spec
ify)
incu
rred
(Rs.
In
lakh
s)
(a) (b) (a) (b) (a) (b) (a) (b) (a) (b) (a) (b) (a) (b) (a) (b) (a) (b) (a) (b)
1
Ass
am
Dhu
bri
Sela
i-G
adad
har
Not
Sta
rted
Not
Sta
rted
Not
Sta
rted
Not
Sta
rted
Not
Sta
rted
Not
Sta
rted
Not
Sta
rted
Not
Sta
rted
Not
Sta
rted
Not
Sta
rted
Not
Sta
rted
Not
Sta
rted
Not
Sta
rted
Not
Sta
rted
Not
Sta
rted
Not
Sta
rted
Not
Sta
rted
Not
Sta
rted
Not
Sta
rted
Not
Sta
rted
Not
Sta
rted
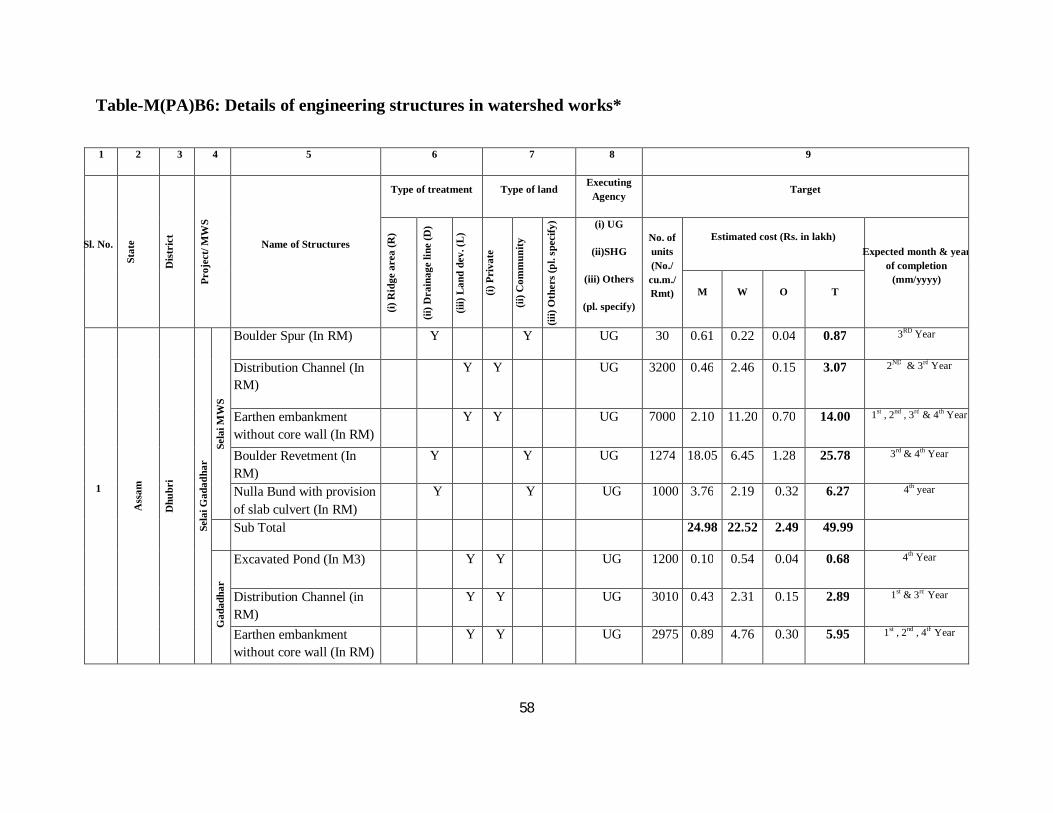
58
Table-M(PA)B6: Details of engineering structures in watershed works*
1 2 3 4 5 6 7 8 9
Sl. No.
Stat
e
Dis
tric
t
Proj
ect/
MW
S
Name of Structures
Type of treatment Type of land Executing
Agency Target
(i) R
idge
are
a (R
)
(ii) D
rain
age
line
(D)
(iii)
Lan
d de
v. (L
)
(i) P
riva
te
(ii) C
omm
unity
(iii)
Oth
ers (
pl. s
peci
fy) (i) UG
(ii)SHG
(iii) Others
(pl. specify)
No. of units (No./ cu.m./ Rmt)
Estimated cost (Rs. in lakh) Expected month & year
of completion (mm/yyyy)
M W O T
1
Ass
am
Dhu
bri
Sela
i Gad
adha
r Se
lai M
WS
Boulder Spur (In RM) Y Y UG 30 0.61 0.22 0.04 0.87 3RD Year
Distribution Channel (In RM)
Y Y UG 3200 0.46 2.46 0.15 3.07 2ND & 3rd Year
Earthen embankment without core wall (In RM)
Y Y UG 7000 2.10 11.20 0.70 14.00 1st , 2nd , 3rd & 4th Year
Boulder Revetment (In RM)
Y Y UG 1274 18.05 6.45 1.28 25.78 3rd & 4th Year
Nulla Bund with provision of slab culvert (In RM)
Y Y UG 1000 3.76 2.19 0.32 6.27 4th year
Sub Total 24.98 22.52 2.49 49.99
Gad
adha
r
Excavated Pond (In M3) Y Y UG 1200 0.10 0.54 0.04 0.68 4th Year
Distribution Channel (in RM)
Y Y UG 3010 0.43 2.31 0.15 2.89 1st & 3rd Year
Earthen embankment without core wall (In RM)
Y Y UG 2975 0.89 4.76 0.30 5.95 1st , 2nd , 4th Year
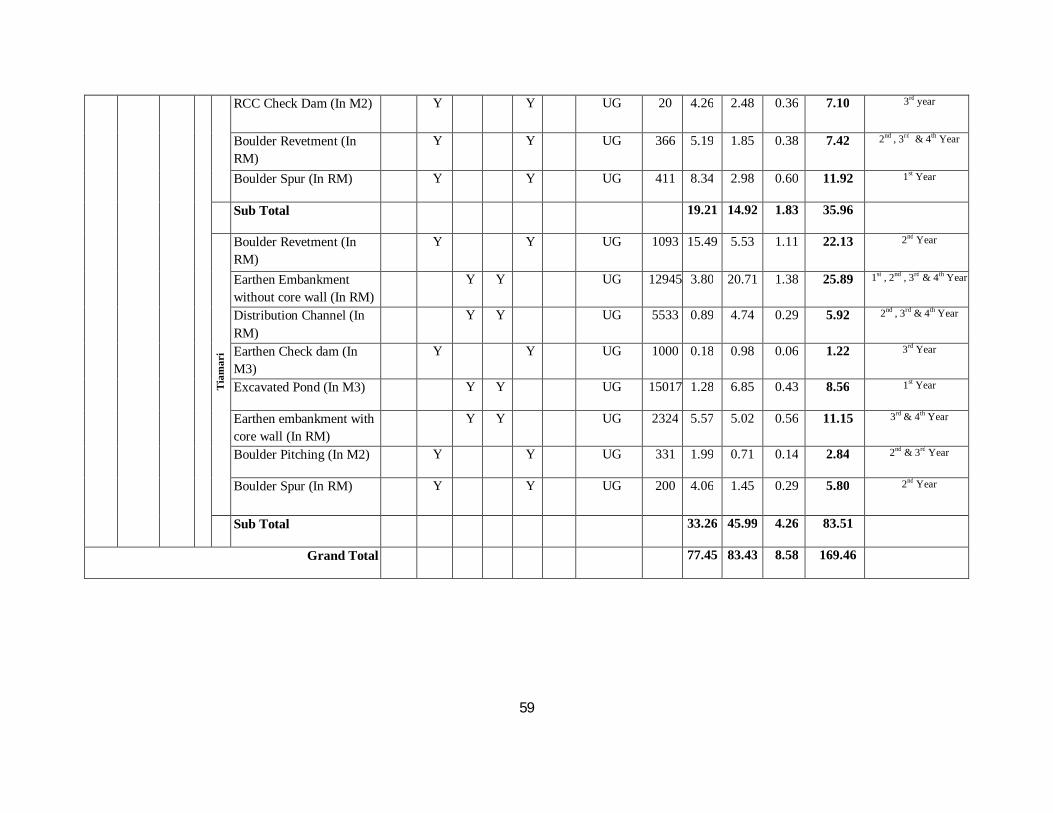
59
RCC Check Dam (In M2) Y Y UG 20 4.26 2.48 0.36 7.10 3rd year
Boulder Revetment (In RM)
Y Y UG 366 5.19 1.85 0.38 7.42 2nd , 3rd & 4th Year
Boulder Spur (In RM) Y Y UG 411 8.34 2.98 0.60 11.92 1st Year
Sub Total 19.21 14.92 1.83 35.96
Tia
mar
i
Boulder Revetment (In RM)
Y Y UG 1093 15.49 5.53 1.11 22.13 2nd Year
Earthen Embankment without core wall (In RM)
Y Y UG 12945 3.80 20.71 1.38 25.89 1st , 2nd , 3rd & 4th Year
Distribution Channel (In RM)
Y Y UG 5533 0.89 4.74 0.29 5.92 2nd , 3rd & 4th Year
Earthen Check dam (In M3)
Y Y UG 1000 0.18 0.98 0.06 1.22 3rd Year
Excavated Pond (In M3) Y Y UG 15017 1.28 6.85 0.43 8.56 1st Year
Earthen embankment with core wall (In RM)
Y Y UG 2324 5.57 5.02 0.56 11.15 3rd & 4th Year
Boulder Pitching (In M2) Y Y UG 331 1.99 0.71 0.14 2.84 2nd & 3rd Year
Boulder Spur (In RM) Y Y UG 200 4.06 1.45 0.29 5.80 2nd Year
Sub Total 33.26 45.99 4.26 83.51
Grand Total 77.45 83.43 8.58 169.46

60
Table-M(PA)B7: Details of activities connected with vegetative cover in watershed works*
1 2 3 4 5 6 7 8 9
Sl. N
o.
Stat
e
Dis
tric
t
Proj
ect/
MW
S Name of structure/ work
Type of treatment Type of land Executing ancy Target
(i) Ridg
e area (R)
(ii) Drainage line (DL)
(iii) Lan
d dev. (L)
(i) Pvt.
(ii) Comm.
(iii) Others (pl. specif
y)
(i) UG (ii) SHG (iii) Others (IB)
Area (ha)
No. of plants
Estimated cost
(Rs. In Lakh)
Expected month & year of
completion (mm/ yyyy)
1
Ass
am
Dhu
bri
Sela
i Gad
adha
r
Sela
i
Afforestation (stamp planting)
Y - - Y Y - UG 5.40 5400 1.48 1st & 4th Yr
Aff. Regenaration y - - - Y - UG 3.00 3000 0.55 3rd year Crop Demo (Paddy) - - y y - - IB 16.50 - 2.48 2nd Year
Crop Demo (Potato/ Veg) - - y y - - IB 9.50 - 2.28 2nd Year
Sub Total 34.40 8400 6.79
Gad
adha
r Crop Demo (Potato/ Veg) - - y y - - IB 8.50 - 2.28 2nd Year Crop Demo (Paddy) - - Y y - - IB 14.00 - 2.10 2nd Year Afforestation (stamp planting)
y - - - y - UG 5.00 5000 1.36 4th Year
Sub Total 27.50 5000 5.74
Tia
mar
i
Afforestation (stamp planting)
y - - y y - UG 10.00 10000 2.74 2nd,3rd &4th
Horticulture Nursery Raising y - - y - - UG 0.50 100000 1.50 1st year Crop Demo (Potato/ Veg) - - y y - - IB 5.50 - 1.32 2nd Year Crop Demo (Paddy) - - y y - - IB 14.00 - 2.10 2nd Year Sub Total 30.00 110000 7.66
Grand Total 91.90 123400 20.19

61
Table-M(PA)B8: Details of allied / other activities
1 2 3 4 5 6 7 8 Sl. No.
State District Project Name of activity@
Type of land Executing agency Target (i)
Pvt. (ii)
Comm. (iii) Others (pl.
specify) (i) UG (ii)SHG (iii) Others (pl. specify)
Estimated cost
(Rs. in lakh)
Expected month & year of completion
(mm/yyyy)
1 Assam Dhubri Selai Gadadhar Nil Nil Nil Nil Nil Nil Nil
Table-M(PA)B9: Livelihood Proposed to be Created for Asset less People
Sl. N
o.
Stat
e
Dis
tric
t
Proj
ect
Mic
ro W
S
Name of activity@ No. of HH by social group Pre-Project Income (Avg./ HH) in Rs.
Cost per Unit
(In Rs.)
Estimated cost (Rs. in lakh)
Expected
income per unit
(BC Ratio)
1
Ass
am
Dhu
bri
Sela
i Gad
adha
r
Sela
i, G
adad
har
& T
iam
ari
SC ST Others Total SC ST Others Piggery – Breaded 4 0 16 20 - - - 1.20 2.40 100% Duck Rearing 20 0 100 120 - - - 0.12 1.44 100%
Milch Cow 10 0 90 100 - - - 1.20 12.00 100% Bicycle Repairing 10 0 60 70 - - - 0.40 2.80 100%
Handloom 10 0 70 80 - - - 0.50 4.00 100%
Pottary Making 20 0 0 20 - - - 0.44 0.88 100% Fruit Processing 10 0 30 40 - - - 0.50 2.00 100%
Carpenter 10 0 60 70 - - - 0.24 1.68 100%
Mobile Repairing 10 0 10 20 - - - 0.30 0.60 100%
Bike Repairing 0 0 20 20 - - - 0.50 1.00 100%
Vermi Compost 10 0 20 30 - - - 0.225 0.675 100%
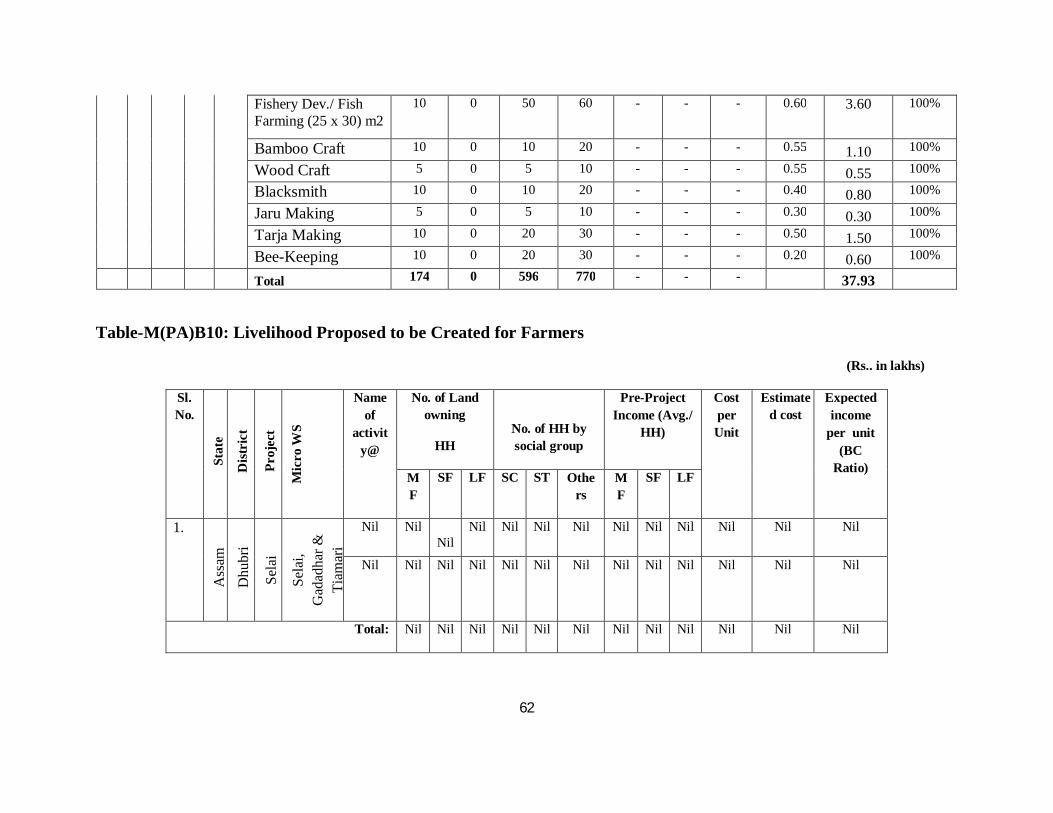
62
Fishery Dev./ Fish Farming (25 x 30) m2
10 0 50 60 - - - 0.60 3.60 100%
Bamboo Craft 10 0 10 20 - - - 0.55 1.10 100%
Wood Craft 5 0 5 10 - - - 0.55 0.55 100%
Blacksmith 10 0 10 20 - - - 0.40 0.80 100%
Jaru Making 5 0 5 10 - - - 0.30 0.30 100%
Tarja Making 10 0 20 30 - - - 0.50 1.50 100%
Bee-Keeping 10 0 20 30 - - - 0.20 0.60 100%
Total 174 0 596 770 - - - 37.93
Table-M(PA)B10: Livelihood Proposed to be Created for Farmers
(Rs.. in lakhs)
Sl. No.
Stat
e
Dis
tric
t
Proj
ect
Mic
ro W
S
Name of
activity@
No. of Land owning
HH
No. of HH by social group
Pre-Project Income (Avg./
HH)
Cost per Unit
Estimated cost
Expected income
per unit (BC
Ratio) MF
SF LF SC ST Others
MF
SF LF
1.
Ass
am
Dhu
bri
Sela
i
Sela
i, G
adad
har &
Ti
amar
i
Nil Nil Nil
Nil Nil Nil Nil Nil Nil Nil Nil Nil Nil
Nil Nil Nil Nil Nil Nil Nil Nil Nil Nil Nil Nil Nil
Total: Nil Nil Nil Nil Nil Nil Nil Nil Nil Nil Nil Nil

63
Chapter- V Planning
PROPOSED ACTION PLAN UNDER ENTRY POINT ACTIVITIES (EPA)
Treatable Area: 3161 ha. Financial Outlay; Rs. 15.17 lakhs
Table-M(PA)A1: Entry point activities (EPA). (Rs. in lakh)
1 2 3 4 5 6 7 8 9 10 11
S. N
o.
Stat
e
Dis
tric
t N
ame
of
proj
ect
Am
ount
ea
rmar
ked
for
EPA
Entry Point Activities planned with Name of villages ***
Est
imat
ed c
ost
Exp
endi
ture
in
curr
ed
Bal
ance
Exp
ecte
d ou
tcom
e
Rem
arks
1
Ass
am
D
hubr
i
Sela
i Gad
adha
r
15.1
7
Selairpar I 1) Installation of HTW=3No. 22500.00 - - For drinking purpose.
The
sche
mes
and
est
imat
ed c
ost a
s pro
pose
d by
Pro
ject
Man
ager
. D
etai
led
estim
ates
are
to b
e pr
epar
ed a
nd sa
nctio
ned
by th
e SL
NA
/DW
DU
.
Selairpar II (Charjogipara)
1) Installation of HTW=3Nos. 22500.00 -do-
Shyamcharanerkuti I 1) Installation of HTW=2Nos. 15000.00 - - -do- Shyamcharanerkuti II 1) Installation of HTW=2No. 15000.00 - - -do- Shyamcharanerkuti III 1) Installation of HTW=2Nos. 15000.00 - - -do- Sajuarkuti 1) Installation of HTW=4Nos. 30000.00 -do- Kheraj Daobhangi 2) Plantation at Daobhangi Junior
College 50000.00
To conserve ecological balance.
Daobhangi 1) Installation of HTW=5Nos. 37500.00 For drinking purpose. Geramari I *** 2) Boundary wall and Office
repairing of Gauripur S.C. Range alomganj 335500.00
To protect public property
1) Installation of HTW=2Nos. 15000.00 For drinking purpose. Geramari II
1) Installation of HTW=2Nos. 15000.00 -do- 2) Boundary wall of GP Office Uttar Geramari
50000.00
-do-
Geramari III 1) Installation of HTW=2Nos. 15000.00 -do- Geramari VI 1) Installation of HTW=2Nos. 15000.00 -do- Modaikhali 1) Installation of HTW=2Nos. 15000.00 -do-
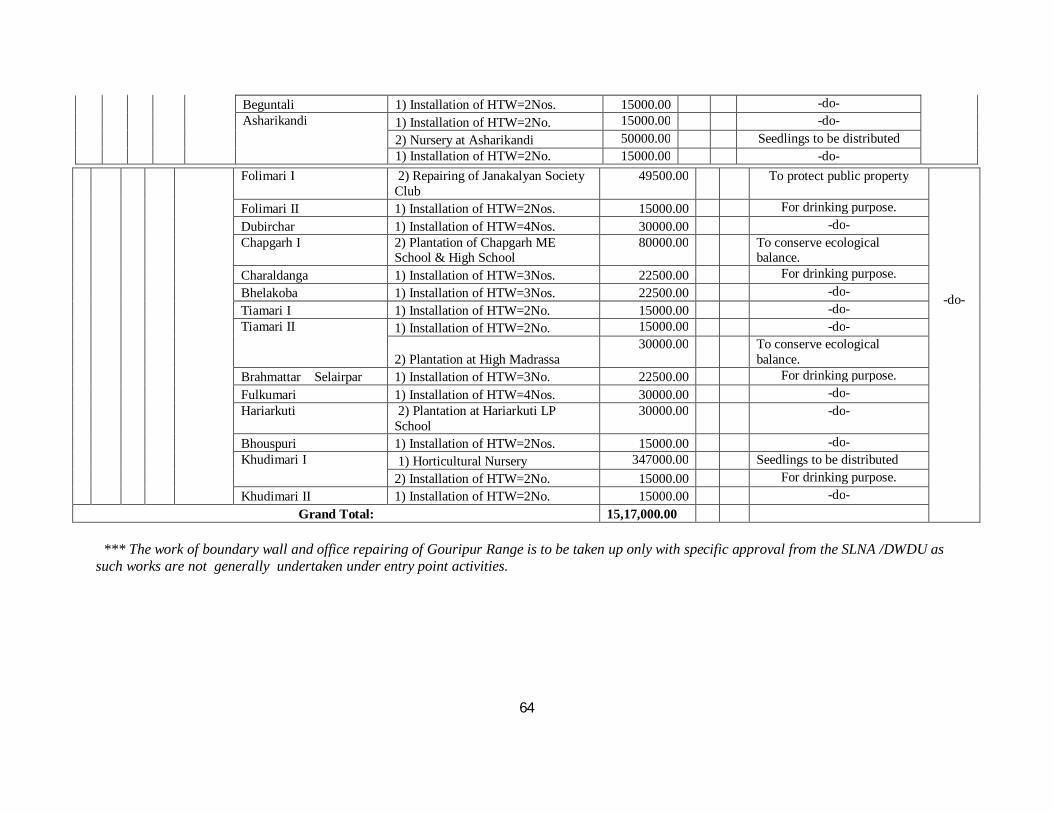
64
Beguntali 1) Installation of HTW=2Nos. 15000.00 -do- Asharikandi
1) Installation of HTW=2No. 15000.00 -do- 2) Nursery at Asharikandi 50000.00 Seedlings to be distributed 1) Installation of HTW=2No. 15000.00 -do-
*** The work of boundary wall and office repairing of Gouripur Range is to be taken up only with specific approval from the SLNA /DWDU as such works are not generally undertaken under entry point activities.
Folimari I 2) Repairing of Janakalyan Society Club
49500.00
To protect public property
-do-
Folimari II 1) Installation of HTW=2Nos. 15000.00 For drinking purpose. Dubirchar 1) Installation of HTW=4Nos. 30000.00 -do- Chapgarh I 2) Plantation of Chapgarh ME
School & High School 80000.00
To conserve ecological balance.
Charaldanga 1) Installation of HTW=3Nos. 22500.00 For drinking purpose. Bhelakoba 1) Installation of HTW=3Nos. 22500.00 -do- Tiamari I 1) Installation of HTW=2No. 15000.00 -do- Tiamari II 1) Installation of HTW=2No. 15000.00 -do-
2) Plantation at High Madrassa 30000.00
To conserve ecological balance.
Brahmattar Selairpar 1) Installation of HTW=3No. 22500.00 For drinking purpose. Fulkumari 1) Installation of HTW=4Nos. 30000.00 -do- Hariarkuti 2) Plantation at Hariarkuti LP
School 30000.00
-do-
Bhouspuri 1) Installation of HTW=2Nos. 15000.00 -do- Khudimari I 1) Horticultural Nursery 347000.00 Seedlings to be distributed
2) Installation of HTW=2No. 15000.00 For drinking purpose. Khudimari II 1) Installation of HTW=2No. 15000.00 -do-
Grand Total: 15,17,000.00

65
Table DPR 6: Year wise phasing of Selai Gadadhar IWM Project for 5 (five) years Plan (IWMP)
Name of the District: Dhubri Name of watershed:-Selai Godadhar
Total project area:- 5393 ha Treatable area:- 3160.80 ha Project cost:- 379.30 Lakh
Component 1st Year 2nd Year 3rd Year 4th Year 5th Year
20% Amount 26% Amount 24% Amount 23% Amount 7% Amount 100% Total amount
Administrative 2.5 9.48 2 7.59 2 7.59 2 7.59 1.5 5.69 10 37.93 Monitoring 0.1 0.38 0.3 1.14 0.3 1.14 0.3 1.14 0 0.00 1 3.79 Evaluation 0.4 1.52 0 0.00 0 0.00 0 0.00 0.6 2.28 1 3.79 Entry Point Activities 4 15.17 0 0.00 0 0.00 0 0.00 0 0.00 4 15.17 Institution & Capacity Building 2 7.59 1 3.79 1 3.79 1 3.79 0 0.00 5 18.97 Detailed Project Report (DPR) 1 3.79 0 0.00 0 0.00 0 0.00 0 0.00 1 3.79
Watershed Deve. Works 10 37.93 13.7 51.96 13.7 51.96 12.6 47.79 0 0.00 50 189.65 Livelihood activities (Asetless) 0 0 4 15.17 3 11.38 3 11.38 0 0.00 10 37.93 Production System 0 0 5 18.97 4 15.17 4 15.17 0 0.00 13 49.31 Consolidation 0 0 0 0.00 0 0.00 0 0.00 5 18.97 5 18.97 20 75.86 26 98.62 24 91.03 23 87.24 7.1 26.93 100 379.30

66
Table DPR 7: YEARWISE PHYSICAL & FINANCIAL TARGET UNDER WATERSHED WORK PHASE.
Name of the District: Dhubri Name of watershed:-Selai Godadhar Name of The MWS: Selai, Gadadhar & Tiamari
Total project area:- 5393 ha Treatable area:- 3160.80 ha Project cost:- 379.30 Lakh
Sl. No.
Name of village Name of Schemes Physical target
Unit cost
Year wise financial target 1st
year 2nd year
3rd year
4th year
5th year Total
10% 13.7% 13.7% 12.6% (Consolidation) 5%
1 2 3 4 5 6 7 8 9 10 11 SELAI MWS 1 Selairpar Pt-I 1. Boulder Spur at Selai River 30 rm. 2900 0.87 0.87
2. Protective Afforestation 0.40 ha. 27300 0.11 0.11 3. Crop Demonstration (Paddy) 1.5 ha. 15000 0.23 0.23
2 Geramari I 1. Irrigation Channel at Ghuguland 2000 rm.
96 1.92 1.92
2. Earthen Emb. Without C/Wallimg at Selai river bank
1500 rm.
200 3.00 3.00
3. Crop Demonstration (vegetables) 1.5 ha. 24000 0.36 0.36 3 Geramari II 1. Earthen Embt. Without C/ Wallimg at
Rowa Beel bank 1000 rm.
200 2.00 2.00
2. Crop demonstration (Paddy) 5 ha. 15000 0.75 0.75 4 Geramari III 1. RTP at Selai river 430 rm. 2024 8.70 8.7
2. Earthen Embankment Without Core Walling
1000 rm.
200 2.00 2.00
5 Shyamcharanerkuti-III
1. Earthen Embankment Without Core Walling
2000 rm.
200 4.00 4.00
2. Protective Afforestation 3.0 ha. 27300 0.82 0.82 6 Shyamcharnerkuti 1. Const. of Channel 1200
rm. 96 1.15 1.15
2. Protective Afforestation 2.0 ha. 27300 0.55 0.55 3.Crop Demonstration (Vegetables) 2 ha. 24000 0.48 0.48 4. Crop demonstration (Paddy) 5 ha. 15000 0.75 0.75
7 Dampur-II 1. Boulder Revetment 350 rm 2024 7.08 7.08 8 Shyamcharanerkuti- 1. Eathen Embankment at Village 1500 rm 200 3.00 3.00
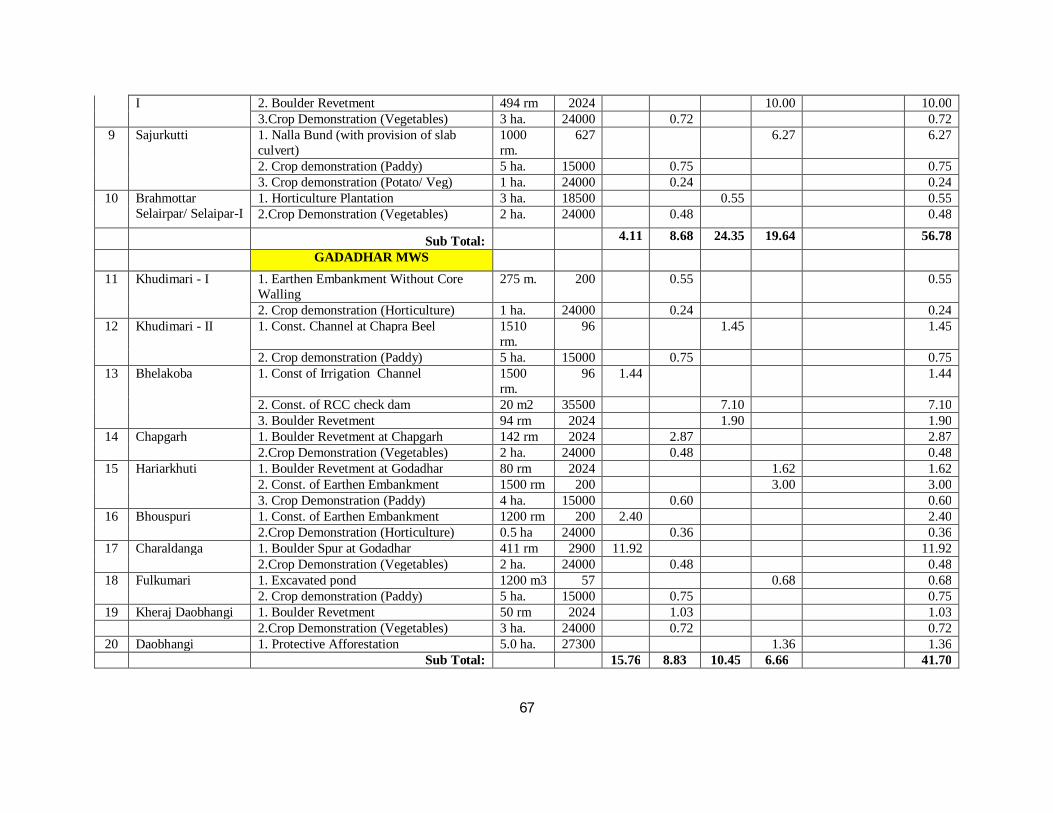
67
I 2. Boulder Revetment 494 rm 2024 10.00 10.00 3.Crop Demonstration (Vegetables) 3 ha. 24000 0.72 0.72
9 Sajurkutti 1. Nalla Bund (with provision of slab culvert)
1000 rm.
627 6.27 6.27
2. Crop demonstration (Paddy) 5 ha. 15000 0.75 0.75 3. Crop demonstration (Potato/ Veg) 1 ha. 24000 0.24 0.24
10 Brahmottar Selairpar/ Selaipar-I
1. Horticulture Plantation 3 ha. 18500 0.55 0.55 2.Crop Demonstration (Vegetables) 2 ha. 24000 0.48 0.48
Sub Total: 4.11 8.68 24.35 19.64 56.78 GADADHAR MWS
11 Khudimari - I 1. Earthen Embankment Without Core Walling
275 m. 200 0.55 0.55
2. Crop demonstration (Horticulture) 1 ha. 24000 0.24 0.24 12 Khudimari - II 1. Const. Channel at Chapra Beel 1510
rm. 96 1.45 1.45
2. Crop demonstration (Paddy) 5 ha. 15000 0.75 0.75 13 Bhelakoba 1. Const of Irrigation Channel 1500
rm. 96 1.44 1.44
2. Const. of RCC check dam 20 m2 35500 7.10 7.10 3. Boulder Revetment 94 rm 2024 1.90 1.90
14 Chapgarh 1. Boulder Revetment at Chapgarh 142 rm 2024 2.87 2.87 2.Crop Demonstration (Vegetables) 2 ha. 24000 0.48 0.48
15 Hariarkhuti 1. Boulder Revetment at Godadhar 80 rm 2024 1.62 1.62 2. Const. of Earthen Embankment 1500 rm 200 3.00 3.00 3. Crop Demonstration (Paddy) 4 ha. 15000 0.60 0.60
16 Bhouspuri 1. Const. of Earthen Embankment 1200 rm 200 2.40 2.40 2.Crop Demonstration (Horticulture) 0.5 ha 24000 0.36 0.36
17 Charaldanga 1. Boulder Spur at Godadhar 411 rm 2900 11.92 11.92 2.Crop Demonstration (Vegetables) 2 ha. 24000 0.48 0.48
18 Fulkumari 1. Excavated pond 1200 m3 57 0.68 0.68 2. Crop demonstration (Paddy) 5 ha. 15000 0.75 0.75
19 Kheraj Daobhangi 1. Boulder Revetment 50 rm 2024 1.03 1.03 2.Crop Demonstration (Vegetables) 3 ha. 24000 0.72 0.72
20 Daobhangi 1. Protective Afforestation 5.0 ha. 27300 1.36 1.36 Sub Total: 15.76 8.83 10.45 6.66 41.70

68
TIAMARI MWS 21 Beguntali 1. Gadadhar River Boulder Revetment 150 rm. 2024 3.04 3.04
2. Earthen Embankment Without Core Walling 1500 rm. 200 3.00 3.00 22 Asharikandi 1. Earthen embankment without core walling 2500 rm. 200 5.00 5.00
2. Drainage Channel 2533 rm 120 3.04 3.04 3. Protective Afforestation 3.0 ha. 27300 0.82 0.82
23 Madaikhali 1. Const. of Irrigation Cannel 1500 rm. 96 1.44 1.44 3. Crop Demonstration (vegetables) 1.5 ha. 24000 0.36 0.36 2. Crop demonstration (Horticulture) 1 ha. 24000 0.24 0.24
24 Geramari VI 1. Boulder Revetment 878 rm. 2024 17.77 17.77 2. Protective Afforestation 1.0 ha. 27300 0.27 0.27 3. Earthen Check dam 1000 m3 122 1.22 1.22 4. Earthen embankment without core walling 3445 rm 200 6.89 6.89
25 Tiamari -I 1. Earthen Embankment Without Core Walling 1500 rm. 200 3.00 3.00 2. Crop demonstration (Paddy) 5 ha. 15000 0.75 0.75
26 Tiamari -II 1. Excavated pond 15017 m3.
57 8.56 8.56
2. Earthen Embankment Without Core Walling 1250 rm. 200 2.00 2.00 3. Protective Afforestation 2.0 ha. 27300 0.55 0.55 4. Const. of Channel 1500 rm. 96 1.44 1.44 5. Crop demonstration (Paddy) 5 ha. 15000 0.75 0.75
27 Dubirchar 1. Earthen Embankment 1500 rm. 200 3.00 3.00 2. Protective Afforestation 2.0 ha. 27300 0.55 0.55 2.Crop Demonstration (Vegetables) 3 ha. 24000 0.72 0.72
28 Falimari -I 1. Const. of Earthen Embankment with Core Walling
1324 rm. 480 6.35 6.35
2. Protective Afforestation 2.0 ha. 27300 0.55 0.55 3. Boulder Revetment 65 m2 858 0.56 0.56 3. Crop Demonstration (Paddy) 4 ha. 15000 0.60 0.60
29 Falimari -II 1. Boulder Revetment at Ghoramara 65 rm 2024 1.32 1.32 2. Graded Bund with Core Walling 1000 rm 480 4.80 4.80 3. Nursery Raising for Horticulture Species 0.5 ha. 300000 1.50 1.50 4. Boulder Revetment 266 m2 858 2.28 2.28
30 Charjogipara 1. Boulder Spur 200 rm 2900 5.8 5.80 2. Const. of Earthen Embankment 1500 rm 200 3.00 3.00
Sub Total: 18.06 34.45 17.16 21.50 91.17 Grand Total: 37.93 51.96 51.96 47.80 189.65
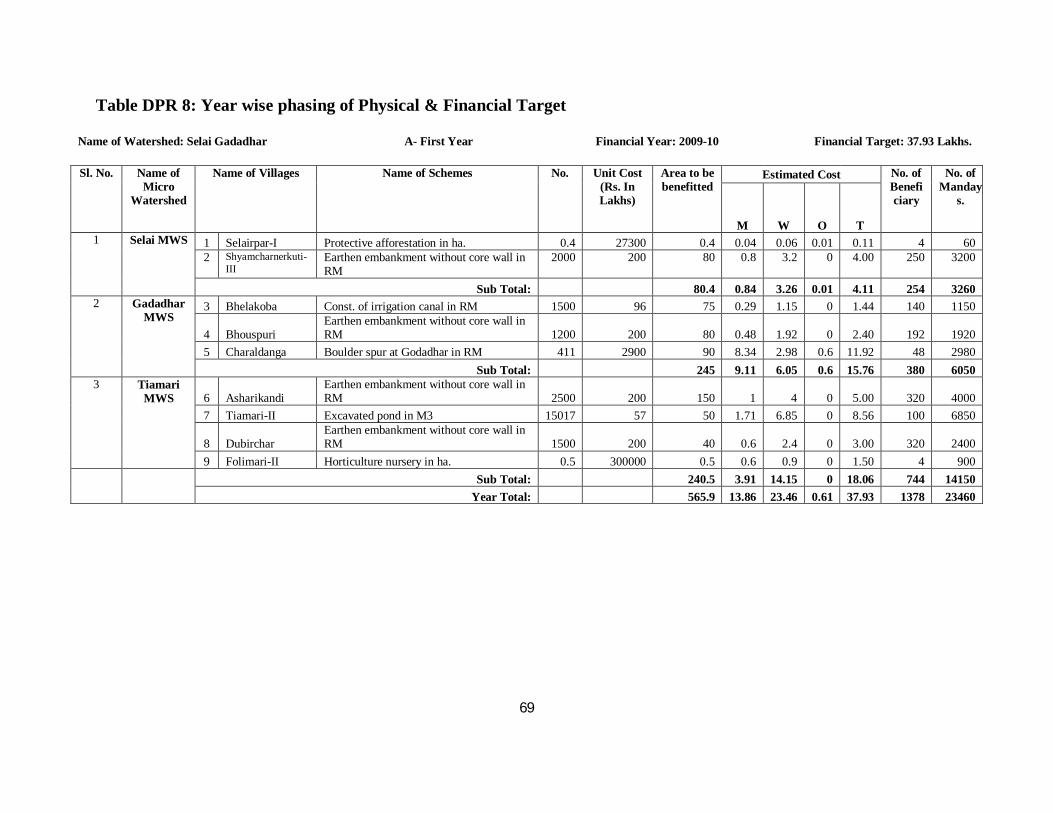
69
Table DPR 8: Year wise phasing of Physical & Financial Target
Name of Watershed: Selai Gadadhar A- First Year Financial Year: 2009-10 Financial Target: 37.93 Lakhs. Sl. No. Name of
Micro Watershed
Name of Villages Name of Schemes No. Unit Cost (Rs. In Lakhs)
Area to be benefitted
Estimated Cost No. of Beneficiary
No. of Manday
s.
M W O T 1 Selai MWS 1 Selairpar-I Protective afforestation in ha. 0.4 27300 0.4 0.04 0.06 0.01 0.11 4 60
2 Shyamcharnerkuti-III
Earthen embankment without core wall in RM
2000 200 80 0.8 3.2 0 4.00 250 3200
Sub Total: 80.4 0.84 3.26 0.01 4.11 254 3260 2 Gadadhar
MWS 3 Bhelakoba Const. of irrigation canal in RM 1500 96 75 0.29 1.15 0 1.44 140 1150
4 Bhouspuri Earthen embankment without core wall in RM 1200 200 80 0.48 1.92 0 2.40 192 1920
5 Charaldanga Boulder spur at Godadhar in RM 411 2900 90 8.34 2.98 0.6 11.92 48 2980 Sub Total: 245 9.11 6.05 0.6 15.76 380 6050
3 Tiamari MWS 6 Asharikandi
Earthen embankment without core wall in RM 2500 200 150 1 4 0 5.00 320 4000
7 Tiamari-II Excavated pond in M3 15017 57 50 1.71 6.85 0 8.56 100 6850
8 Dubirchar Earthen embankment without core wall in RM 1500 200 40 0.6 2.4 0 3.00 320 2400
9 Folimari-II Horticulture nursery in ha. 0.5 300000 0.5 0.6 0.9 0 1.50 4 900 Sub Total: 240.5 3.91 14.15 0 18.06 744 14150 Year Total: 565.9 13.86 23.46 0.61 37.93 1378 23460

70
Name of Watershed: Selai Gadadhar B 2nd year Financial Year: 2010-11 Financial Target: 51.96 Lakhs. Sl. No.
Name of Micro
Watershed
Name of Villages Name of Schemes No. Unit Cost
(Rs. In Lakhs)
Area to be
benefitted
Estimated Cost No. of Beneficiar
y
No. of Manday
s. M W O T
1 Selai MWS 1 Selairpar-I Crop demo. (paddy) In ha. 1.5 15000 1.5 0.09 0.14 0 0.23 12 140
2 Geramari-I Irrigation canal at Gughuland in RM 2000 96 90 0.38 1.54 0 1.92 100 1540
Crop demo.(vege) In ha. 1.5 24000 1.5 0.14 0.22 0 0.36 12 220 3 Gramari-II Earthen embankment without
core wall 1000 200 40 0.4 1.6 0 2.00 100 400 Crop demo (paddy) in ha. 5 15000 5 0.3 0.45 0 0.75 40 450 4 Shyamcharn
erkuti Crop demo.(vege) In ha. 2 24000 2 0.19 0.29 0.00 0.48 16 290 Crop demo (paddy) in ha. 5 15000 5 0.3 0.45 0 0.75 40 450 5 Shyamcharner
kuti-I Crop. Demo (veg) in ha 3 24000 3 0.29 0.43 0 0.72 24 430 6 Sajurkutti Crop demo (paddy) in ha. 5 15000 5 0.3 0.45 0 0.75 40 450 Crop demo (Horti) in ha 1 24000 1 0.09 0.15 0 0.24 8 150 7 Bhromottar
Selairpar Crop demo (veg) in ha. 2 24000 2 0.19 0.29 0 0.48 8 290 Sub Total: 156 2.67 6.01 0 8.68 400 4810
2 Gadadhar MWS
8 Khudimari-I Earthen embankment without core wall 275 200 20 0.11 0.44 0 0.55 24 440
Crop demo (Horti) in ha 1 24000 1 0.09 0.15 0 0.24 8 150 9 Khudimari-
II Crop demo. (paddy) in ha. 5 15000 5 0.3 0.45 0 0.75 40 450 10 Chapgarh Boulder revetment in Rm 142 2024 220 2.00 0.71 0.16 2.87 889 710 Crop demo (veg) in ha. 2 24000 2 0.19 0.29 0 0.48 16 290
11 Hariayrkuthi Crop demo (paddy) in ha. 4 15000 4 0.24 0.36 0 0.60 32 360 12 Bhouspuri Crop demo (Horti) in ha 0.5 24000 0.5 0.14 0.22 0 0.36 8 220 13 Saraldanga Crop demo (veg) in ha. 2 24000 2 0.19 0.29 0 0.48 16 290 14 Fulkumari Crop demo. (paddy) in ha. 5 15000 5 0.3 0.45 0 0.75 40 450 15 Kheras
Daobhangi Boulder revetment in Rm 50 2024 70 0.72 0.25 0.06 1.03 250 250 Crop. Demo (veg) in ha 3 24000 3 0.29 0.43 0 0.72 24 430 Sub Total: 329.5 4.28 3.61 0.22 8.11 1347 3610
3 Tiamari MWS
16 Beguntali Boulder revetment in Rm 150 2024 60 2.13 0.76 0.15 3.04 32 760 17 Modaikhali Const. if irrigation canal in
RM 1500 96 75 0.29 1.15 0.00 1.44 48 1150 Crop demo.(vege) In ha. 1.5 24000 1.5 0.14 0.22 0 0.36 12 220
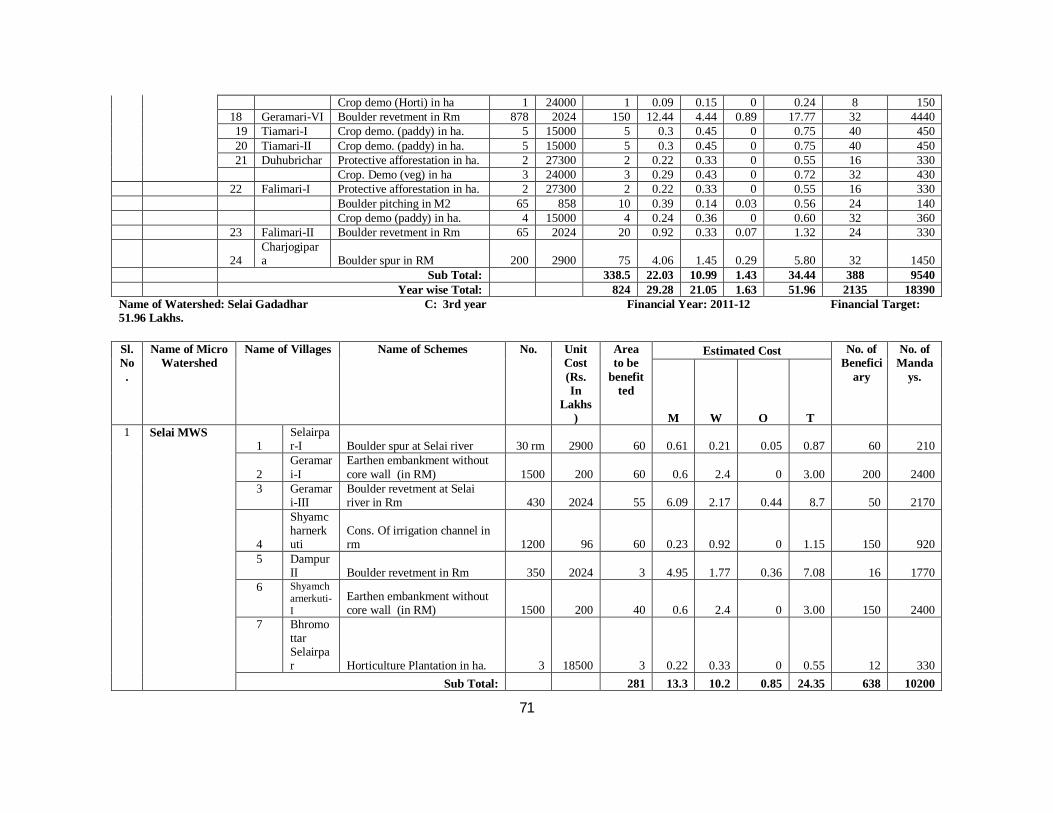
71
Crop demo (Horti) in ha 1 24000 1 0.09 0.15 0 0.24 8 150 18 Geramari-VI Boulder revetment in Rm 878 2024 150 12.44 4.44 0.89 17.77 32 4440 19 Tiamari-I Crop demo. (paddy) in ha. 5 15000 5 0.3 0.45 0 0.75 40 450 20 Tiamari-II Crop demo. (paddy) in ha. 5 15000 5 0.3 0.45 0 0.75 40 450 21 Duhubrichar Protective afforestation in ha. 2 27300 2 0.22 0.33 0 0.55 16 330 Crop. Demo (veg) in ha 3 24000 3 0.29 0.43 0 0.72 32 430
22 Falimari-I Protective afforestation in ha. 2 27300 2 0.22 0.33 0 0.55 16 330 Boulder pitching in M2 65 858 10 0.39 0.14 0.03 0.56 24 140 Crop demo (paddy) in ha. 4 15000 4 0.24 0.36 0 0.60 32 360 23 Falimari-II Boulder revetment in Rm 65 2024 20 0.92 0.33 0.07 1.32 24 330
24 Charjogipara Boulder spur in RM 200 2900 75 4.06 1.45 0.29 5.80 32 1450
Sub Total: 338.5 22.03 10.99 1.43 34.44 388 9540 Year wise Total: 824 29.28 21.05 1.63 51.96 2135 18390 Name of Watershed: Selai Gadadhar C: 3rd year Financial Year: 2011-12 Financial Target: 51.96 Lakhs. Sl. No.
Name of Micro Watershed
Name of Villages Name of Schemes No. Unit Cost (Rs. In
Lakhs)
Area to be
benefitted
Estimated Cost No. of Benefici
ary
No. of Manda
ys.
M W O T 1 Selai MWS
1 Selairpar-I Boulder spur at Selai river 30 rm 2900 60 0.61 0.21 0.05 0.87 60 210
2 Geramari-I
Earthen embankment without core wall (in RM) 1500 200 60 0.6 2.4 0 3.00 200 2400
3 Geramari-III
Boulder revetment at Selai river in Rm 430 2024 55 6.09 2.17 0.44 8.7 50 2170
4
Shyamcharnerkuti
Cons. Of irrigation channel in rm 1200 96 60 0.23 0.92 0 1.15 150 920
5 Dampur II Boulder revetment in Rm 350 2024 3 4.95 1.77 0.36 7.08 16 1770
6 Shyamcharnerkuti-I
Earthen embankment without core wall (in RM) 1500 200 40 0.6 2.4 0 3.00 150 2400
7 Bhromottar Selairpar Horticulture Plantation in ha. 3 18500 3 0.22 0.33 0 0.55 12 330
Sub Total: 281 13.3 10.2 0.85 24.35 638 10200

72
2
Gadadhar MWS 8
Khudimari-II
Cons. Of irrigation channel in rm 1510 96 75 0.29 1.16 0 1.45 100 1160
9 Bhelakoba
RCC Checkdam in m3 20 35500 210 4.26 2.48 0.36 7.10 100 2480
Sub total:- 130 5.70 4.31 0.45 10.45 200 4310 3
Tiamari MWS 10
Beguntali
Earthen embankment without core wall (in RM) 1500 200 100 0.6 2.4 0 3.00 200 2400
11 Asharikandi Drainage channel In RM 2533 120 100 0.46 2.43 0.15 3.04 100 2430
12 Geramari-VI
Protective Afforestation in ha. 1 27300 1 0.11 0.16 0 0.27 12 160 Earthen Checkdam in m3 1000 122 50 0.24 0.98 0 1.22 56 980
13 Tiamari II
E/ embank. without core wall (in RM) 1250 200 35 0.4 1.6 0 2 200 1160 Protective Afforestation in ha. 2 27300 2 0.22 0.33 0 0.55 24 330
14 Falimari-II
Graded Bundh with core wall in rm 1000 480 40 0.96 3.84 0 4.8 80 3840 Boulder Pitching in m2 266 858 50 1.6 0.57 0.11 2.28 64 570
Sub total:- 378 4.59 12.31 0.26 17.16 736 11870 Year wise Total:- 789 23.59 26.82 1.56 51.96 1574 26380 Name of Watershed: Selai Gadadhar C: 4th year Financial Year: 2012-13 Financial Target: 51.96 Lakhs. Sl. No.
Name of Micro Watershed
Name of Villages Name of Schemes No. Unit Cost (Rs. In
Lakhs)
Area to be
benefitted
Estimated Cost No. of Beneficiary
No. of Manda
ys.
M W O T 1 Selai MWS 1 Geramar
i -III E/ embank. without core wall (in RM)
1000 200 40 0.30 1.60 0.10 2.00 70 1600
2 Shyamsaraner kuti -III
Protective afforestation (In Ha)
3 27300 3 0.33 0.49 0.82 18 490
3 Shyamsaraner kuti -II
Protective afforestation (In Ha)
2 27300 2 0.22 0.33 0.55 12 330
4 Shyamsaraner kuti
Boulder Revetment (In RM)
490 2024 65 7.00 2.90 0.10 10.00 60 2900
5 Sajuarkhuti
Nulla band with provision of slab culvert (In RM)
1000 627 60 3.13 3.14 6.27 100 3140
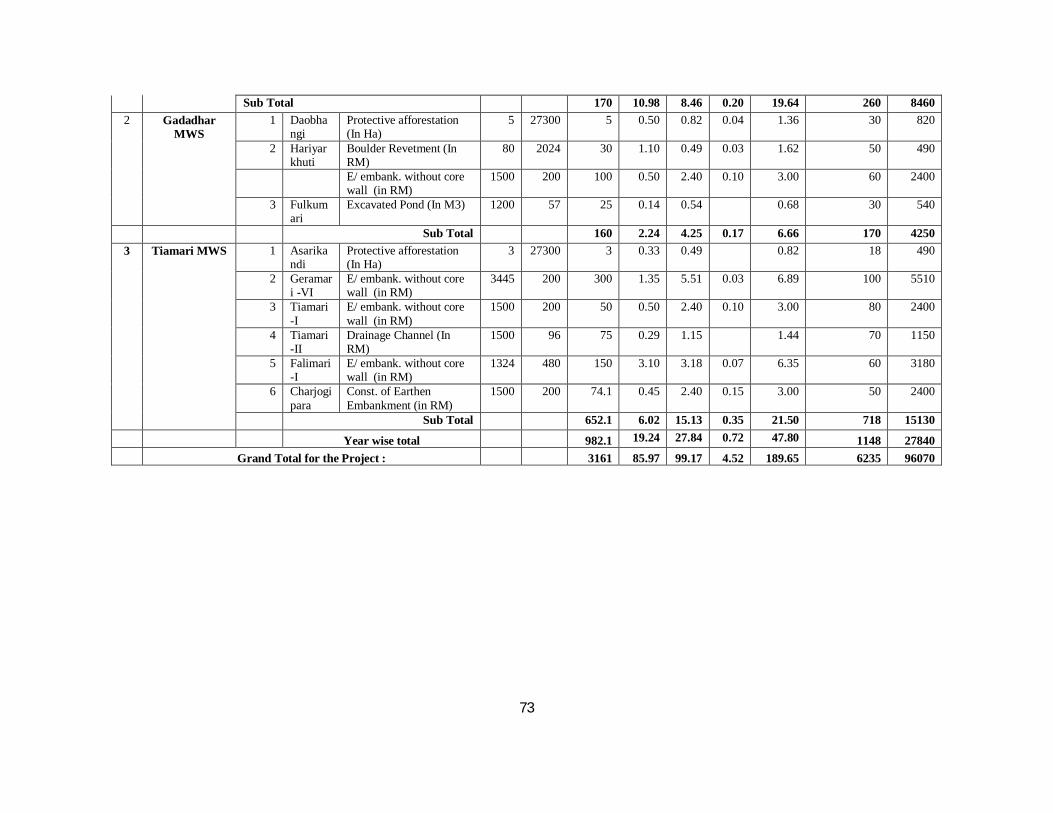
73
Sub Total 170 10.98 8.46 0.20 19.64 260 8460 2
Gadadhar MWS
1 Daobhangi
Protective afforestation (In Ha)
5 27300 5 0.50 0.82 0.04 1.36 30 820
2 Hariyarkhuti
Boulder Revetment (In RM)
80 2024 30 1.10 0.49 0.03 1.62 50 490
E/ embank. without core wall (in RM)
1500 200 100 0.50 2.40 0.10 3.00 60 2400
3 Fulkumari
Excavated Pond (In M3) 1200 57 25 0.14 0.54 0.68 30 540
Sub Total 160 2.24 4.25 0.17 6.66 170 4250 3
Tiamari MWS 1 Asarikandi
Protective afforestation (In Ha)
3 27300 3 0.33 0.49 0.82 18 490
2 Geramari -VI
E/ embank. without core wall (in RM)
3445 200 300 1.35 5.51 0.03 6.89 100 5510
3 Tiamari -I
E/ embank. without core wall (in RM)
1500 200 50 0.50 2.40 0.10 3.00 80 2400
4 Tiamari -II
Drainage Channel (In RM)
1500 96 75 0.29 1.15 1.44 70 1150
5 Falimari-I
E/ embank. without core wall (in RM)
1324 480 150 3.10 3.18 0.07 6.35 60 3180
6 Charjogipara
Const. of Earthen Embankment (in RM)
1500 200 74.1 0.45 2.40 0.15 3.00 50 2400
Sub Total 652.1 6.02 15.13 0.35 21.50 718 15130
Year wise total 982.1 19.24 27.84 0.72 47.80 1148 27840 Grand Total for the Project : 3161 85.97 99.17 4.52 189.65 6235 96070

74
Table DPR 9: Village wise GPS Point
DISTRICT: DHUBRI PROJECT: SELAI GADADHAR IWMP Sl. No.
Name of village Name of Schemes Physical target
GPS STATIONS
LATITUDE LONGITUDE ALTITUDE 1 2 3 4 5 6 7
SELAI MWS
1 Selairpar Pt-I
1. Boulder Spur at Selai River
30 rm. 26007/13.5// 89059/24.5// 2. Protective Afforestation 0.40 ha. 3. Crop Demonstration (Paddy) 1.5 ha.
2 Geramari I
1. Irrigation Channel at Ghuguland
2000 rm. 26007/29.7// 90001/23.7// 2. Earthen Embankment Without Core Wallimg at Selai river bank
1500 rm.
3. Crop Demonstration (vegetables)
1.5 ha.
3 Geramari II
1. Earthen Embankment Without Core Wallimg at Rowa Beel bank
1000 rm. 2606/35// 89059/59.6//
2. Crop demonstration (Paddy)
5 ha.
4 Geramari III 1. RTP at Selai river 430 rm. 2606/12.9// 89059/26.1// 2. Earthen Embankment Without Core Walling
1000 rm.
5 Shyamcharanerkuti-III 1. Earthen Embankment Without Core Walling
2000 rm. 2607/37.2// 89059/28.6// 2. Protective Afforestation 3.0 ha.
6 Shyamcharnerkuti-II
1. Const. of Channel 1200 rm. 2607/13.7// 89059/7.3// 2. Protective Afforestation 2.0 ha. 3.Crop Demonstration (Vegetables)
2 ha.
4. Crop demonstration (Paddy)
5 ha.
7 Dampur-II 1. Boulder Revetment 350 rm 2607/48.1// 9000/43.6//
8 Shyamcharanerkuti-I
1. Eathen Embankment at Village
1500 rm 2607/2.09// 89058/40.9// 2. Boulder Revetment 494 rm 3.Crop Demonstration (Vegetables)
3 ha.
9 Sajurkutti
1. Nalla Bund (with provision of slab culvert)
1000 rm. 2606/29.7// 89058/47.2// 2. Crop demonstration (Paddy)
5 ha.
3. Crop demonstration (Potato/ Veg)
1 ha.
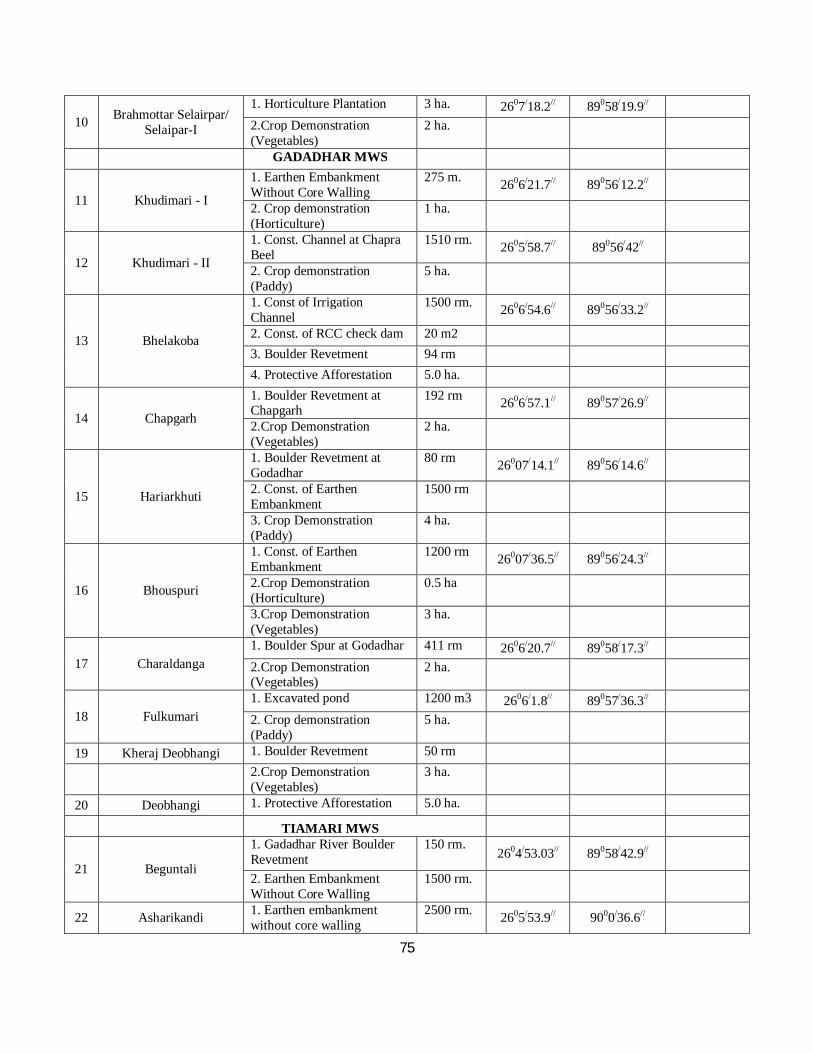
75
10 Brahmottar Selairpar/ Selaipar-I
1. Horticulture Plantation 3 ha. 2607/18.2// 89058/19.9// 2.Crop Demonstration (Vegetables)
2 ha.
GADADHAR MWS
11 Khudimari - I
1. Earthen Embankment Without Core Walling
275 m. 2606/21.7// 89056/12.2// 2. Crop demonstration (Horticulture)
1 ha.
12 Khudimari - II
1. Const. Channel at Chapra Beel
1510 rm. 2605/58.7// 89056/42// 2. Crop demonstration (Paddy)
5 ha.
13 Bhelakoba
1. Const of Irrigation Channel
1500 rm. 2606/54.6// 89056/33.2// 2. Const. of RCC check dam 20 m2 3. Boulder Revetment 94 rm 4. Protective Afforestation 5.0 ha.
14 Chapgarh
1. Boulder Revetment at Chapgarh
192 rm 2606/57.1// 89057/26.9// 2.Crop Demonstration (Vegetables)
2 ha.
15 Hariarkhuti
1. Boulder Revetment at Godadhar
80 rm 26007/14.1// 89056/14.6// 2. Const. of Earthen Embankment
1500 rm
3. Crop Demonstration (Paddy)
4 ha.
16 Bhouspuri
1. Const. of Earthen Embankment
1200 rm 26007/36.5// 89056/24.3// 2.Crop Demonstration (Horticulture)
0.5 ha
3.Crop Demonstration (Vegetables)
3 ha.
17 Charaldanga 1. Boulder Spur at Godadhar 411 rm 2606/20.7// 89058/17.3// 2.Crop Demonstration (Vegetables)
2 ha.
18 Fulkumari 1. Excavated pond 1200 m3 2606/1.8// 89057/36.3// 2. Crop demonstration (Paddy)
5 ha.
19 Kheraj Deobhangi 1. Boulder Revetment 50 rm
2.Crop Demonstration (Vegetables)
3 ha.
20 Deobhangi 1. Protective Afforestation 5.0 ha. TIAMARI MWS
21 Beguntali
1. Gadadhar River Boulder Revetment
150 rm. 2604/53.03// 89058/42.9//
2. Earthen Embankment Without Core Walling
1500 rm.
22 Asharikandi 1. Earthen embankment without core walling
2500 rm. 2605/53.9// 9000/36.6//
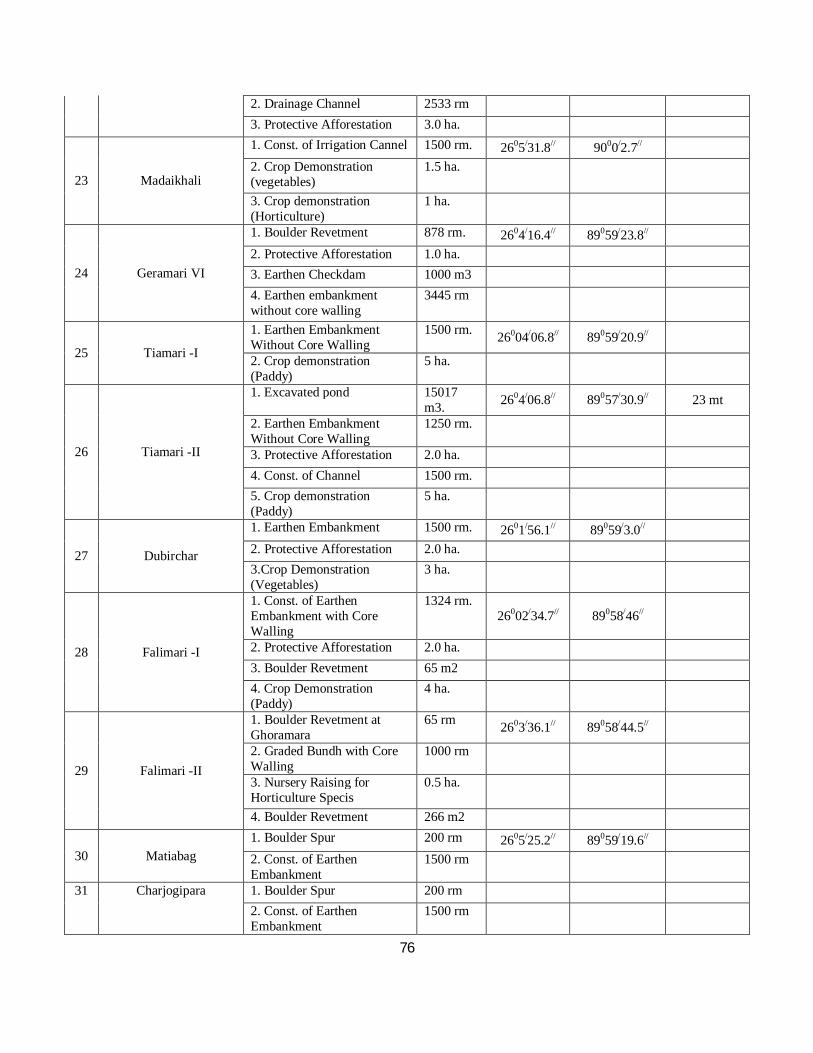
76
2. Drainage Channel 2533 rm 3. Protective Afforestation 3.0 ha.
23 Madaikhali
1. Const. of Irrigation Cannel 1500 rm. 2605/31.8// 9000/2.7// 2. Crop Demonstration (vegetables)
1.5 ha.
3. Crop demonstration (Horticulture)
1 ha.
24 Geramari VI
1. Boulder Revetment 878 rm. 2604/16.4// 89059/23.8// 2. Protective Afforestation 1.0 ha. 3. Earthen Checkdam 1000 m3 4. Earthen embankment without core walling
3445 rm
25 Tiamari -I
1. Earthen Embankment Without Core Walling
1500 rm. 26004/06.8// 89059/20.9// 2. Crop demonstration (Paddy)
5 ha.
26 Tiamari -II
1. Excavated pond 15017 m3. 2604/06.8// 89057/30.9// 23 mt
2. Earthen Embankment Without Core Walling
1250 rm.
3. Protective Afforestation 2.0 ha. 4. Const. of Channel 1500 rm. 5. Crop demonstration (Paddy)
5 ha.
27 Dubirchar
1. Earthen Embankment 1500 rm. 2601/56.1// 89059/3.0// 2. Protective Afforestation 2.0 ha. 3.Crop Demonstration (Vegetables)
3 ha.
28 Falimari -I
1. Const. of Earthen Embankment with Core Walling
1324 rm. 26002/34.7// 89058/46//
2. Protective Afforestation 2.0 ha. 3. Boulder Revetment 65 m2 4. Crop Demonstration (Paddy)
4 ha.
29 Falimari -II
1. Boulder Revetment at Ghoramara
65 rm 2603/36.1// 89058/44.5// 2. Graded Bundh with Core Walling
1000 rm
3. Nursery Raising for Horticulture Specis
0.5 ha.
4. Boulder Revetment 266 m2
30 Matiabag 1. Boulder Spur 200 rm 2605/25.2// 89059/19.6// 2. Const. of Earthen Embankment
1500 rm
31 Charjogipara 1. Boulder Spur 200 rm 2. Const. of Earthen Embankment
1500 rm
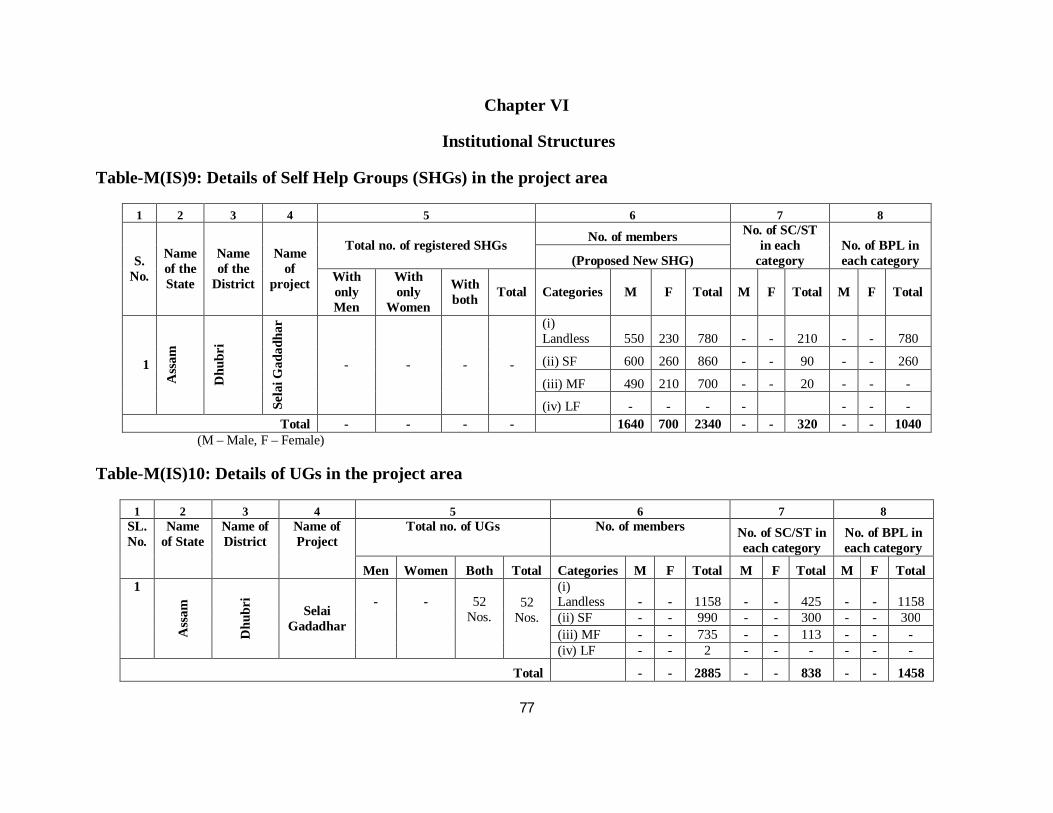
77
Chapter VI
Institutional Structures
Table-M(IS)9: Details of Self Help Groups (SHGs) in the project area
1 2 3 4 5 6 7 8
S. No.
Name of the State
Name of the
District
Name of
project
Total no. of registered SHGs No. of members No. of SC/ST in each
category No. of BPL in each category (Proposed New SHG)
With only Men
With only
Women
With both Total Categories M F Total M F Total M F Total
1
Ass
am
Dhu
bri
Sela
i Gad
adha
r
- - - -
(i) Landless 550 230 780 - - 210 - - 780
(ii) SF 600 260 860 - - 90 - - 260
(iii) MF 490 210 700 - - 20 - - -
(iv) LF - - - - - - - Total - - - - 1640 700 2340 - - 320 - - 1040
(M – Male, F – Female)
Table-M(IS)10: Details of UGs in the project area
1 2 3 4 5 6 7 8 SL. No.
Name of State
Name of District
Name of Project
Total no. of UGs No. of members No. of SC/ST in each category
No. of BPL in each category
Men Women Both Total Categories M F Total M F Total M F Total 1
Ass
am
Dhu
bri
Selai Gadadhar
-
-
52
Nos. 52
Nos.
(i) Landless - - 1158 - - 425 - - 1158 (ii) SF - - 990 - - 300 - - 300 (iii) MF - - 735 - - 113 - - - (iv) LF - - 2 - - - - - -
Total - - 2885 - - 838 - - 1458
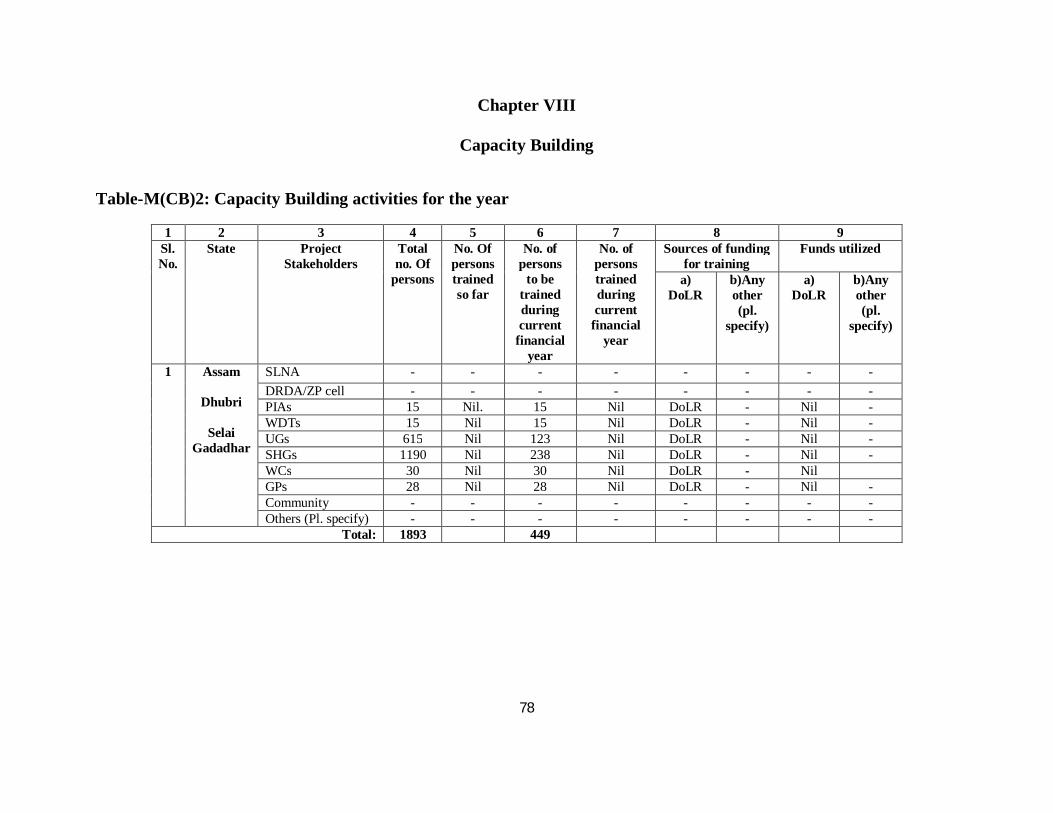
78
Chapter VIII
Capacity Building
Table-M(CB)2: Capacity Building activities for the year
1 2 3 4 5 6 7 8 9 Sl. No.
State Project Stakeholders
Total no. Of
persons
No. Of persons trained so far
No. of persons
to be trained during current
financial year
No. of persons trained during current
financial year
Sources of funding for training
Funds utilized
a) DoLR
b)Any other (pl.
specify)
a) DoLR
b)Any other (pl.
specify)
1 Assam
Dhubri
Selai Gadadhar
SLNA - - - - - - - - DRDA/ZP cell - - - - - - - - PIAs 15 Nil. 15 Nil DoLR - Nil - WDTs 15 Nil 15 Nil DoLR - Nil - UGs 615 Nil 123 Nil DoLR - Nil - SHGs 1190 Nil 238 Nil DoLR - Nil - WCs 30 Nil 30 Nil DoLR - Nil GPs 28 Nil 28 Nil DoLR - Nil - Community - - - - - - - - Others (Pl. specify) - - - - - - - -
Total: 1893 449
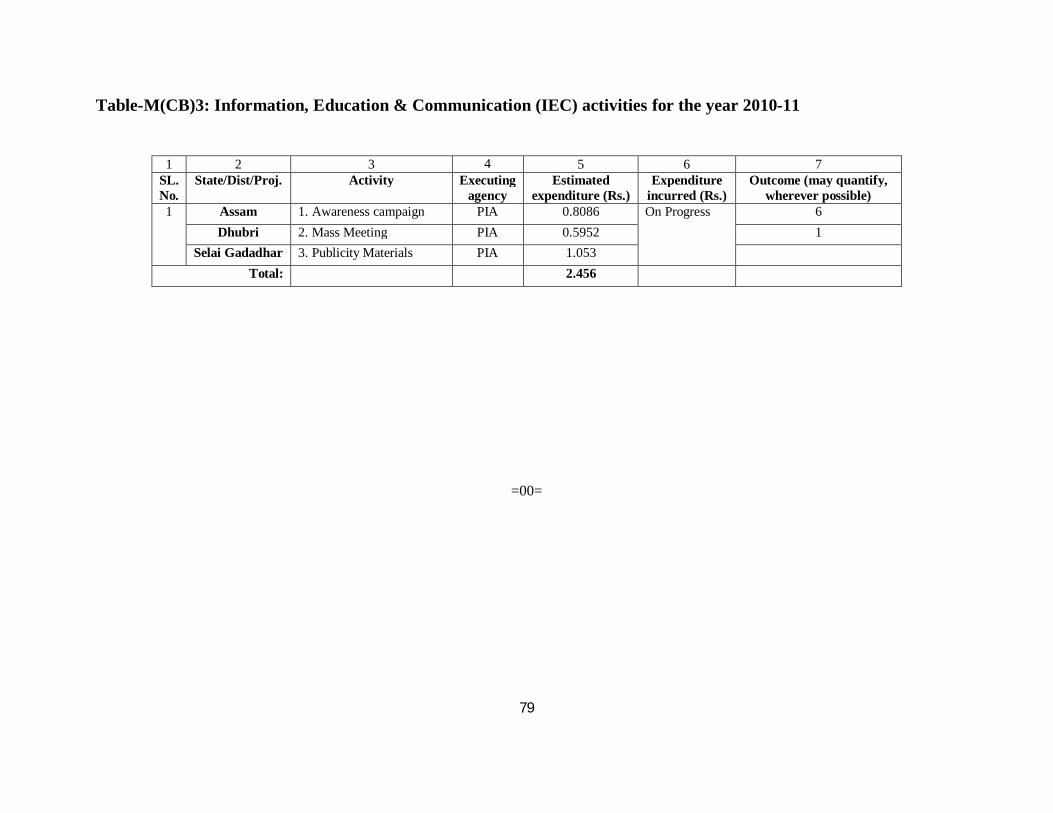
79
Table-M(CB)3: Information, Education & Communication (IEC) activities for the year 2010-11
1 2 3 4 5 6 7 SL. No.
State/Dist/Proj. Activity Executing agency
Estimated expenditure (Rs.)
Expenditure incurred (Rs.)
Outcome (may quantify, wherever possible)
1 Assam 1. Awareness campaign PIA 0.8086 On Progress 6 Dhubri 2. Mass Meeting PIA 0.5952 1
Selai Gadadhar 3. Publicity Materials PIA 1.053 Total: 2.456
=00=
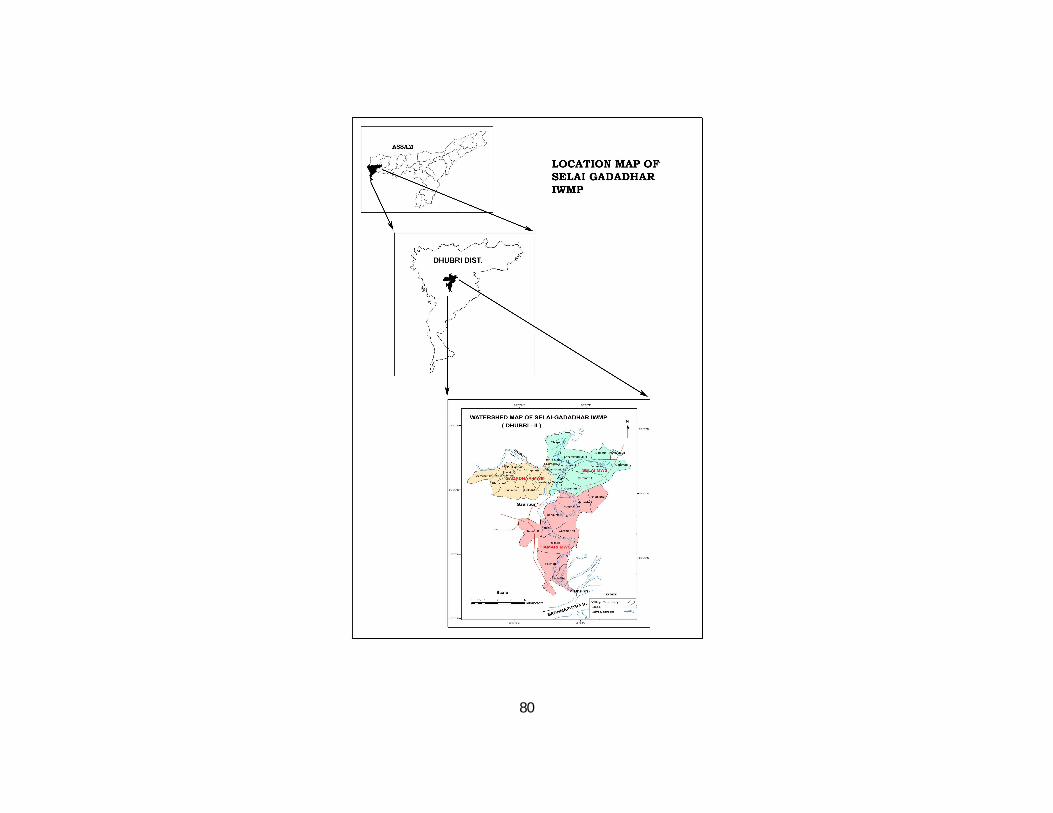
80
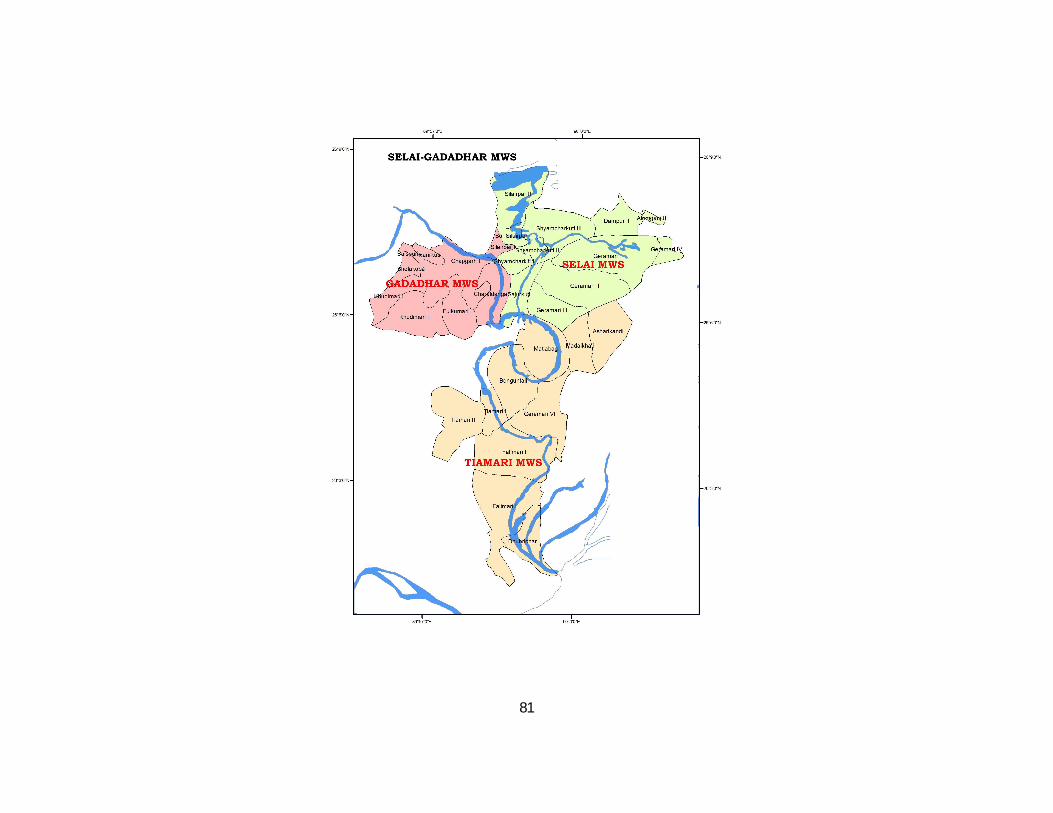
81

82
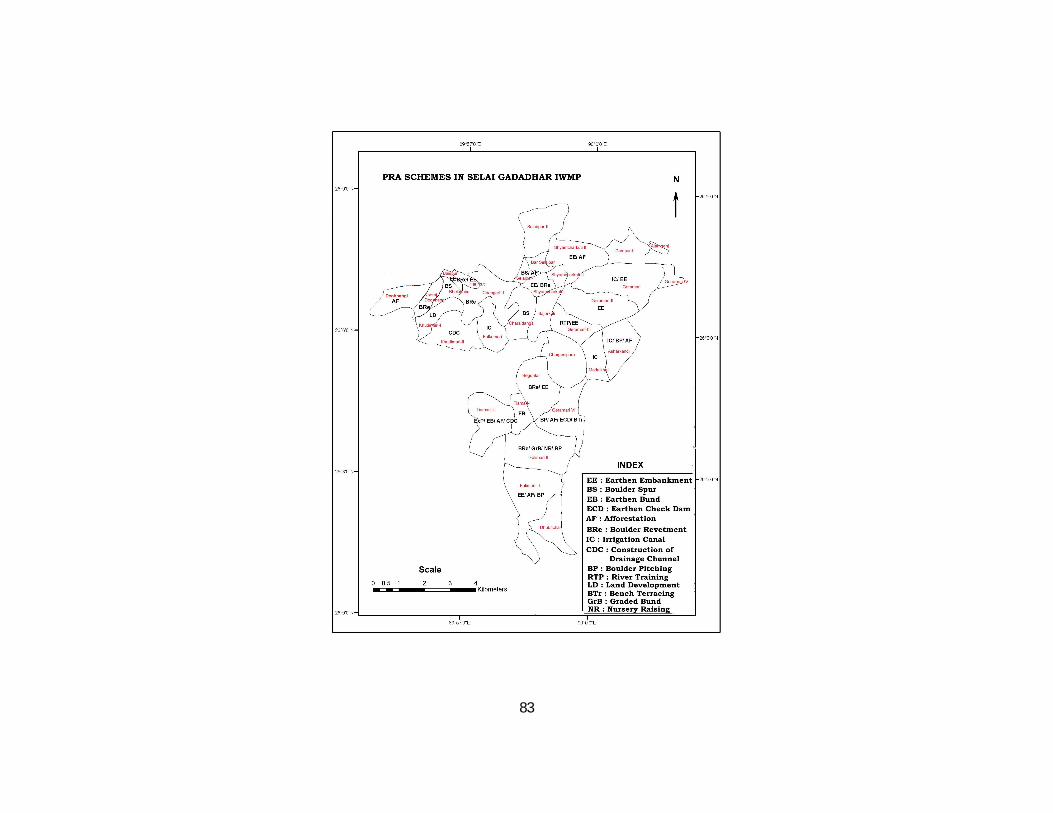
83