
DETAILED PROJECT REPORT ON INVESTMENT GRADE ENERGY AUDIT …
101
DETAILED PROJECT REPORT ON INVESTMENT GRADE ENERGY AUDIT (Municipal Council Yamuna Nagar) PREPARED FOR Bureau of Energy Efficiency PREPARED BY REVIEWED BY Pranat Engineers Pvt. Ltd. 28, Rishabh Vihar, Karkardooma, DELHI-110092 Phones : 22372828, 22373565 Fax: 22375994 E-mail: [email protected]
Transcript of DETAILED PROJECT REPORT ON INVESTMENT GRADE ENERGY AUDIT …

DETAILED PROJECT REPORT ON
INVESTMENT GRADE ENERGY AUDIT (Municipal Council Yamuna Nagar)
PREPARED FOR
Bureau of Energy Efficiency
PREPARED BY REVIEWED BY
Pranat Engineers Pvt. Ltd. 28, Rishabh Vihar, Karkardooma, DELHI-110092 Phones : 22372828, 22373565 Fax: 22375994 E-mail: [email protected]
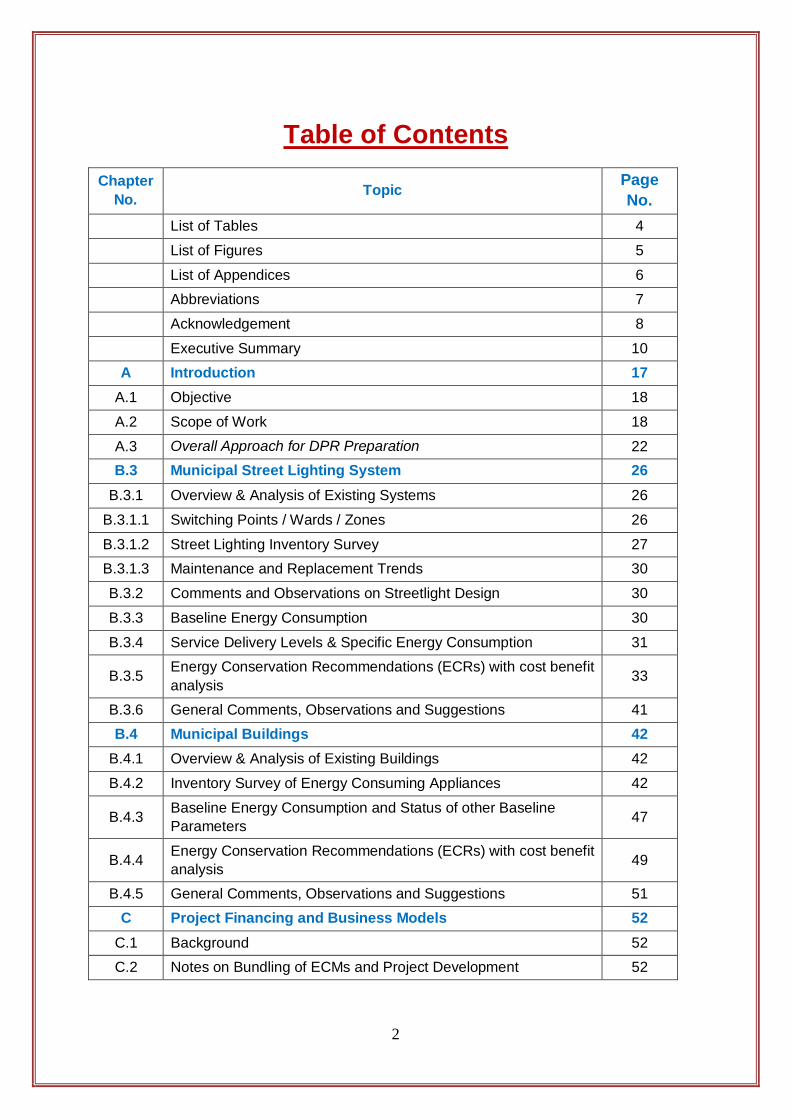
Table of Contents Chapter
No. Topic Page No.
List of Tables 4
List of Figures 5
List of Appendices 6 Abbreviations 7
Acknowledgement 8
Executive Summary 10 A Introduction 17
A.1 Objective 18
A.2 Scope of Work 18
A.3 Overall Approach for DPR Preparation 22 B.3 Municipal Street Lighting System 26
B.3.1 Overview & Analysis of Existing Systems 26
B.3.1.1 Switching Points / Wards / Zones 26
B.3.1.2 Street Lighting Inventory Survey 27 B.3.1.3 Maintenance and Replacement Trends 30
B.3.2 Comments and Observations on Streetlight Design 30
B.3.3 Baseline Energy Consumption 30
B.3.4 Service Delivery Levels & Specific Energy Consumption 31
B.3.5 Energy Conservation Recommendations (ECRs) with cost benefit analysis 33
B.3.6 General Comments, Observations and Suggestions 41 B.4 Municipal Buildings 42
B.4.1 Overview & Analysis of Existing Buildings 42
B.4.2 Inventory Survey of Energy Consuming Appliances 42
B.4.3 Baseline Energy Consumption and Status of other Baseline Parameters 47
B.4.4 Energy Conservation Recommendations (ECRs) with cost benefit analysis 49
B.4.5 General Comments, Observations and Suggestions 51 C Project Financing and Business Models 52
C.1 Background 52 C.2 Notes on Bundling of ECMs and Project Development 52
2
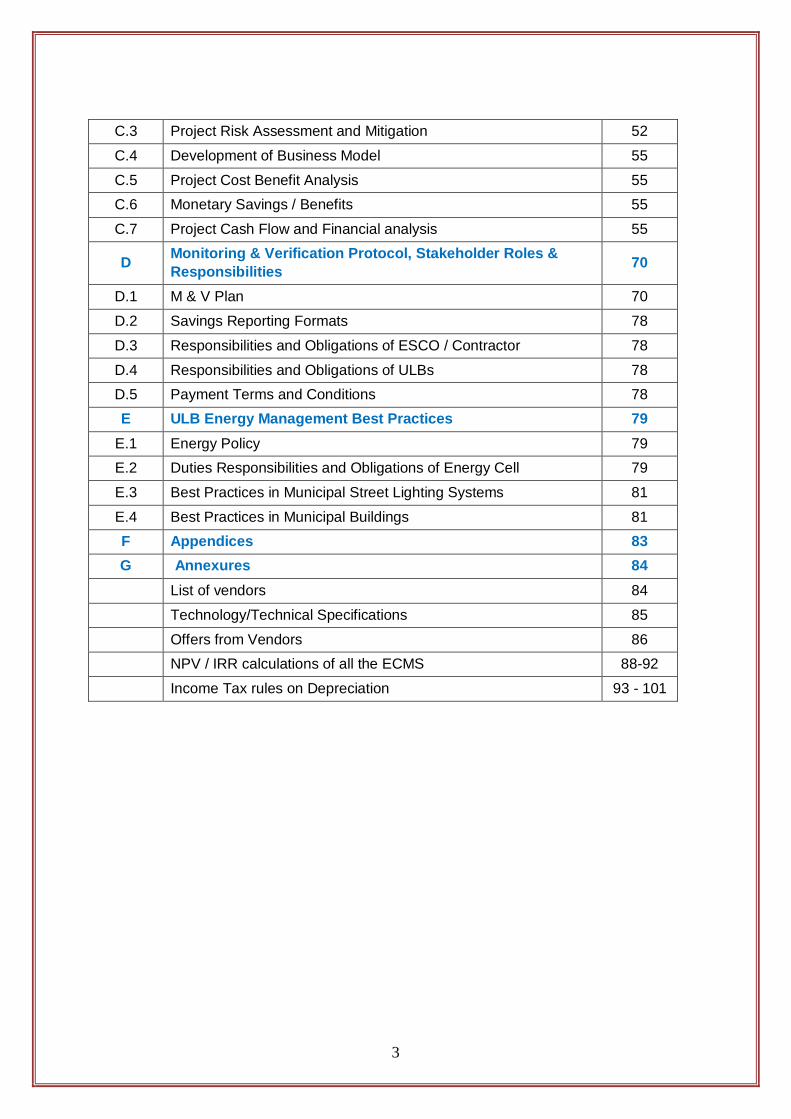
C.3 Project Risk Assessment and Mitigation 52
C.4 Development of Business Model 55
C.5 Project Cost Benefit Analysis 55 C.6 Monetary Savings / Benefits 55
C.7 Project Cash Flow and Financial analysis 55
D Monitoring & Verification Protocol, Stakeholder Roles & Responsibilities 70
D.1 M & V Plan 70
D.2 Savings Reporting Formats 78
D.3 Responsibilities and Obligations of ESCO / Contractor 78
D.4 Responsibilities and Obligations of ULBs 78 D.5 Payment Terms and Conditions 78 E ULB Energy Management Best Practices 79
E.1 Energy Policy 79 E.2 Duties Responsibilities and Obligations of Energy Cell 79
E.3 Best Practices in Municipal Street Lighting Systems 81
E.4 Best Practices in Municipal Buildings 81 F Appendices 83 G Annexures 84
List of vendors 84
Technology/Technical Specifications 85
Offers from Vendors 86 NPV / IRR calculations of all the ECMS 88-92
Income Tax rules on Depreciation 93 - 101
3

5
10
15
20
25
30
35
List of Tables Table No. Title Page No.
1 Annual Energy consumption & annual billing amount 11 2 Pre ECM & Post ECM 12 3 Brief Segment Wise energy consumption 14 4 Brief Segment Wise energy consumption in SL though LED as option II 15
Activity schedule of IGA of Yamuna Nagar 22 6 Zone wise switching point Detail 27 7 Switching point wise installed kW 28 8 Fixture category wise installed kW 29 9 Load reduction chart after implementation 29
Annual kWH consumption season wise 31 11 Road category illumination as per standard IS 1944 32
12 A&B Recommendation 1 for street light (option I & II) 33-34 13 A&B Recommendation 2 for street light (option I & II) 35-36
14 Recommendation 3 for street light 37 Recommendation 4 for street light 38
16 A&B Recommendation 5 for street light 39-40 17 List of building in Yamuna Nagar 42 18 Building Inventory Detail 46 19 Recommendation 6 for street light 50
Recommendation 7 for street light 51 21 Assumption table of ESP of Yamuna Nagar (option-I) 56 22 Estimated expenditures for IRR calculation (option-I) 57 23 ESP detail of all the ECM of Yamuna Nagar (option-I) 58 24 Input values of ESP of Yamuna Nagar (option-I) 59
ESP for ESCO mode (option-I) 61 26 ESP for ULB mode (option-I) 62 27 Assumption table of ESP of Yamuna Nagar (option-II) 63 28 Estimated expenditures for IRR calculation (option-II) 63 29 Input values of ESP of Yamuna Nagar (option-II) 64
ESP detail of all the ECM of Yamuna Nagar (option-II) 65 31 ESP for ESCO mode (option-II) 66 32 ESP for ULB mode (option-II) 68
33 A&B NPV/IRR table of ECM 1 (Option I & Option II) 88 34 A&B NPV/IRR table of ECM 2 (Option I & Option II) 89
NPV/IRR table of ECM 3 90 36 NPV/IRR table of ECM 4 90
37 A&B NPV/IRR table of ECM 5 (Option I & Option II) 91 38 NPV/IRR table of ECM 6 92 39 NPV/IRR table of ECM 7 92
4
1
2
34
5
678
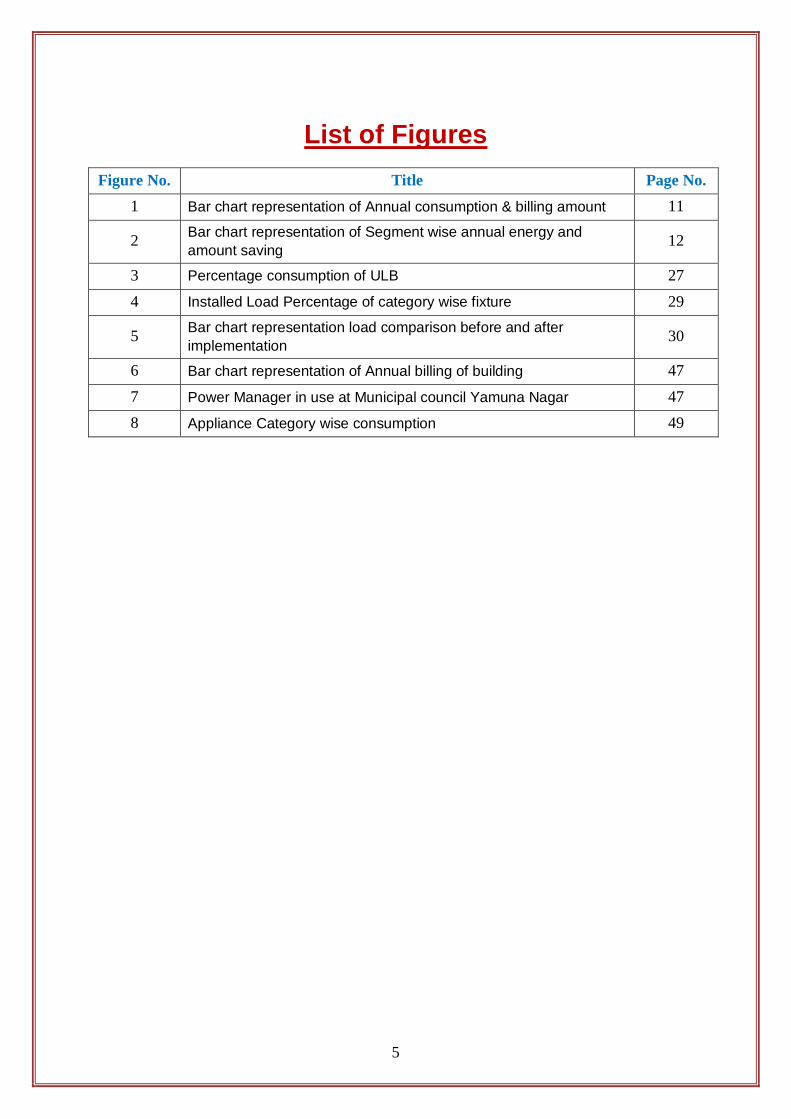
List of Figures Figure No. Title Page No.
Bar chart representation of Annual consumption & billing amount 11 Bar chart representation of Segment wise annual energy and amount saving 12
Percentage consumption of ULB 27 Installed Load Percentage of category wise fixture 29 Bar chart representation load comparison before and after implementation 30
Bar chart representation of Annual billing of building 47
Power Manager in use at Municipal council Yamuna Nagar 47
Appliance Category wise consumption 49
5

List of Appendices Appendix
No. Title PageNo.
B/3/1 Switching Point wise Lighting Fixture Details and Installed kW
Enclosed in Last
B/3/2 Switching Point wise Illumination Measurement B/3/3 Switching Point wise Service Delivery & SEC B/3/4 Switching Point wise Monthly Energy Bill Summary B/4/1 Municipal Buildings B/4/2 Municipal Buildings – Inventory of Energy Consuming Appliances B/4/3 Municipal Buildings – Energy Bill Summary (HT Supply) B/4/4 Municipal Buildings – Energy Bill Summary (LT Supply)
6

ABBREVIATIONS
BEE : Bureau of Energy Efficiency
BEP : Best Efficiency Point
CER : Certified Emission Reports
DPR : Detailed Project Report
DSM : Demand Side Management
ECM : Energy Conservation Measures
ESCO : Energy Servicing Company
GHG : Green House Gas
HVAC : Heating Ventilation and Air Conditioning
IRR : Internal Rate of Return
LD : Liquidated Damage
LT : Low Tension
M&V : Measurement and Verification
MU : Million Units
NGO : Non Government Organization
PPP : Public Private Partnership
R&M : Repair & Maintenance
UNFCCC : United Nations Framework Convention on Climate Change
YMC : Yamuna Nagar Municipal Council
ULB : Urban Local Body
ESCO : Energy Service Company
ESP : Energy saving project
SL : Street Light
7

ACKNOWLEDGEMENT We express our sincere gratitude to the Bureau of Energy Efficiency, Ministry of Power for
giving the opportunity to be a part of this ‘MuDSM Programme’ and present the findings and
recommendations. We thankfully acknowledge the support and guidance provided by all
concerned officials during the conduct of this exercise.
Ministry of Power Shri Devendra Singh - Joint Secretary
Ms. Rita Acharya - Director - EC
Bureau of Energy Efficiency Dr. Ajay Mathur - Director General
Shri Saurabh Kumar - Secretary
Shri Sandeep Garg - Energy Economist
Shri Tarun Kumar - Project Engineer
We are also thankful to the Municipal Council, Yamuna Nagar for their positive support in
undertaking this intricate task of system mapping and Investment Grade audit of two segments ,
viz . Municipal street lighting and municipal buildings (the other two segments of water
treatment/pumping and sewage treatment/pumping are not there at municipal council, Yamuna
Nagar). The field studies would not have been completed on time without their interaction and
timely support. We are grateful for their co-operation during field studies and provision of data
for the study.
Municipal Council, Yamuna Nagar Shri K.K. Jain - I/C Executive Officer
Shri R.D.Diman - Municipal Engineer
Shri Hari Krishan - Light Inspector
to express our appreciation for the support and inputs provided by M/s TUV SUD South Asia
Pvt. Ltd. and their entire team.
8

M/s TUV SUD South Asia Pvt. Ltd. Shri Bratin Roy - General Manager, Environmental Engineering
Shri Shatanshu Shekhar - Product Manager
Shri Jayakrishnan Nair - Energy Auditor
Shri Tejpal Gupta - Engineer
Last but not the least; we are thankful to all officers and employees of the Municipalities with whom we interacted during the field studies for their wholehearted support in undertaking measurements and eagerness to assess the system / equipment efficiencies and saving potential. The willingness of these key personnel to participate in the MuDSM programme and acknowledge the call for energy efficiency is more than half the issues resolved for a Municipal DSM effort.
For Pranat Engineers Pvt. Ltd.,
(Akash Jain) Director
9

Executive Summary 1. Objective of MuDSM programme
The Mission of the MuDSM programme is to improve the overall energy efficiency of the
ULBs thus leading to sustainable energy and cost reductions, in all the four energy
consuming segments namely Water, Sewage, Street lighting, and Buildings. However, for
Municipal Council, Yamuna Nagar only two segments, viz. street lighting and buildings are
applicable.
The IGA is conducted with the following Objectives:
Detailed study of the intended segment of Buildings and Streetlights including historical
and present energy performance trends, and specific energy consumption.
Creation of a database giving broad data on existing infrastructure and system maps of
each of the segments in various ULBs
Quantification of Energy Losses, and Energy Saving Potential.
Creation of a database of Baseline Energy Measurements for reference during post-
implementation measurements and verification.
Presentation of Energy Efficiency Measures as Bankable Projects (which will be
implemented through ESCO model in a later phase of the MuDSM project)
2. Brief Overview of the Segments
Street Lighting
Street lighting at Yamuna Nagar is controlled by its municipal council. However, it has given
a contract for its maintenance and operation to outside contractor. The entire street lighting
of the city is divided into four zones. There are 5 high masts in the city and each is having 6
fixtures. In each fixture, there are 2 lamps of 400 W HPSV. Besides these, there are several
street light poles having 40 W FTL, 150 W & 400W HPSV lights. The total installed load on
street lighting is around 435.06 KW and the burnt out percentage at the time conduct of IGA
was 15.86 % which seems to be satisfactory in comparison of others and indicates street
lighting maintenance is good. The operation of switching ON and OFF is manual and done
by contractor.
10

Buildings There is one building at Municipal Council. There is one single phase LT connection for all
the five buildings. One 3 Phase LT connection is servicing for the building. The total installed
load for building is 11.358 Kw and the total built up area of the building is 2200 sq.m. There
is a double storied building. There is no air conditioner at any of the building and having one
DG set.
3. Energy consumption patterns for the ULB
Overall Annual Energy Consumption for ULB – 12,76,663 Units
Segment wise Annual Energy Consumption for Yamuna Nagar Municipal council
S. No. Sector Annual Energy consumption (Lakh KWh)
Annual billing amount in (Lakh)
Annual Energy
(%)
1 Street Lights 11.87 56.54 93%
2 Buildings 0.88 4.22 7%
Total 12.76 60.76 100 Table No. 1: Annual Energy consumption and Annual Billing amount
0
1000000
2000000
3000000
4000000
5000000
6000000
Street Light Building
Annual Consumption Annual Billing amount
Figure No. 1: Representation of Annual Energy consumption and Billing amount
11

Pre ECM & Post ECM S. No. Sector Annual
Energy consumption(Lakh KWh)
Annual Energy consumption after implementation(Lakh KWh)
Annual Energy saving
Annual amount Saving(Lakh)
1 Street Lights 11.87 8.31 3.56 16.94
2 Buildings 0.88 0.86 0.02 0.094
Total 12.75 9.17 3.58 17.03
Table No. 2 - PRE ECM AND POST ECM segment wise detail
2000000
1500000
1000000
500000
0
355984.27
1694485
2000 9433
Street Light Building
Annual Energy Saving Annual Amount Saving
Figure No. 2- Representation of segment wise annual energy and amount saving
Significant Energy Indices (Segment wise)
o Per Capita kWh consumption for Street lighting – 6.26 Units
o kWh / annum/Installed kW for Street lighting – 985.8 ( Range 60.2 - 8922)
o Average Street lighting Service levels (lux) for Major and Minor Streets – 5.07
( Range 0.68-28.21)
o kWh / annum/ Lux for Street lighting – 2080( Range 44.61 - 21610)
o Overall Energy Efficiency Index of Municipal Buildings (kWh / sq. mtr. / annum) -9.573
12

4. Brief Segment wise Summary of Parameters studied
Street Lights
All electrical parameters like voltage, Power factor, Kw, KVA, current, KVAR and THD of
voltage as well as current were measured at all switching points. The operating hours is also
an important parameter impacting energy consumption of street lights but there is no record
of operating hours. The average operating hours as informed by ULB officials for three
different seasons have been considered as such. The lux levels, which indicate outputs of
street lights, have also been measured. No static factors like weather or occupancy are
applicable to street lights.
Buildings
The energy consumption of the buildings is very small and the metered energy data is the
only way to assess annual energy consumption. Here also all electrical parameters like
Voltage, Power factor, Kw, THD, current, KVA, KVAR etc were measured for both the
electrical connections. As use of air conditioners is zero hence the weather effect is not so
significant. Occupancy variation is also not significant. However, measurements of lux levels
and power demand of major appliances were measured.
13

14
5. A. Brief Segment wise abstract on Energy Conservation Measures identified, Bundling of ECMs and Project Development
Sr. No. ECM Description Estimate of Energy
Saving Potential Estimate of Costs Cost benefit Analysis
Annual Savings (kWh)
Rs. (In Lacs)
Investment (Rs. In Lacs)
Annual Repair & Maint. Costs (Rs. In Lacs)
Total Recurring Cost (Rs. In Lacs)
Simple Payback Period
IRR (%) Notes on Feasibility
ECMs for BUILDINGS ECMs with Negligible Investment
1 Replacement of Resistance type regulator 968 0.04 0.07 NIL NIL 1.85 44.65 Feasible
ECMs with Medium Investment
2 Replacement of T8 (40W) Lamps 1,014 0.04 0.11 0.005 0.005 2.95 31.72 Feasible
ECMs for Street Light ECMs with Negligible Investment
3 Improvement in design of High mast 1,686 0.08 0.05 NIL NIL 0.62 160.50 Feasible
ECMs with Medium Investment
4 Replacement of 400W HPSV 31317 1.49 1.35 0.06 1.41 1.05 95.30 Feasible ECMs with Major Investment
5 Replacement of T12 (40W) Lamp 3,57,495 17.01 22.26 1.11 23.37 1.63 60.29 Feasible
6 Replacement of 150W HPSV 6,02,001 28.65 55.30 2.76 58.06 2.72 34.98 Feasible 7 Use of automation system 174556.14 8.30 16.50 1.25 NIL 2.34 41.45 Feasible
Table No. 3 - Brief Segment-wise Energy consumption
15
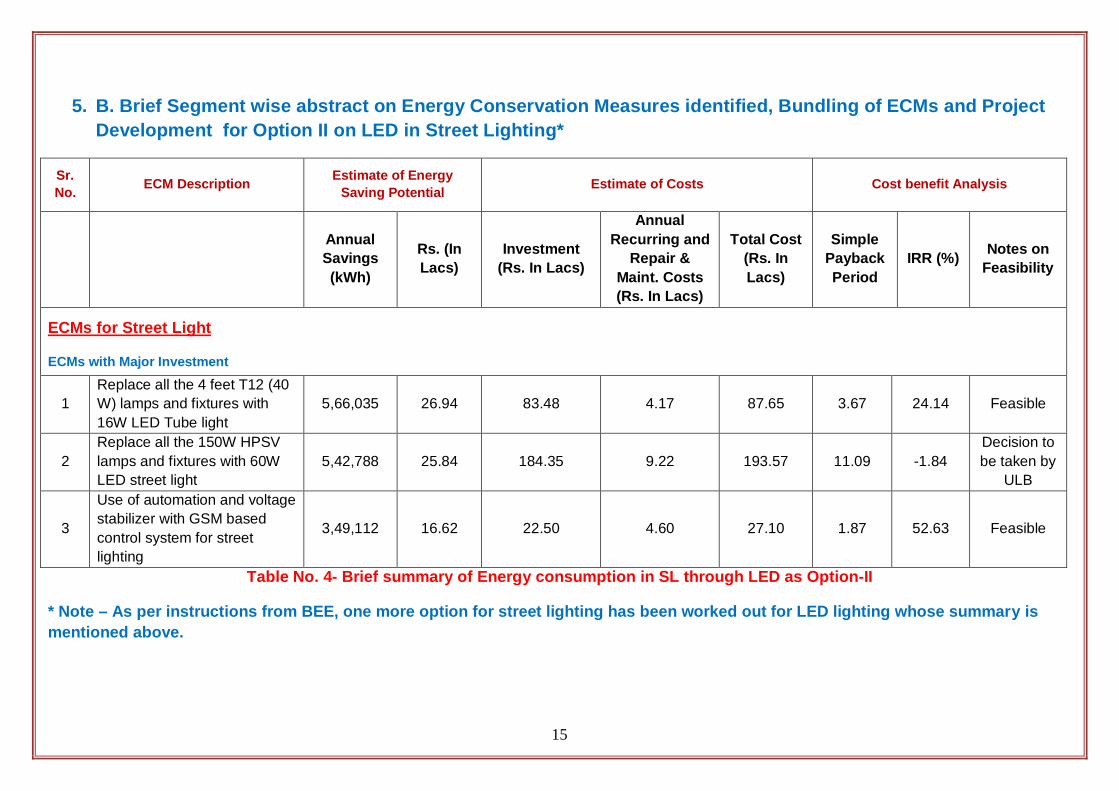
5. B. Brief Segment wise abstract on Energy Conservation Measures identified, Bundling of ECMs and Project Development for Option II on LED in Street Lighting*
Sr. No. ECM Description Estimate of Energy
Saving Potential Estimate of Costs Cost benefit Analysis
Annual Savings (kWh)
Rs. (In Lacs)
Investment (Rs. In Lacs)
Annual Recurring and
Repair & Maint. Costs (Rs. In Lacs)
Total Cost (Rs. In Lacs)
Simple Payback Period
IRR (%) Notes on Feasibility
ECMs for Street Light
ECMs with Major Investment
1 Replace all the 4 feet T12 (40 W) lamps and fixtures with 16W LED Tube light
5,66,035 26.94 83.48 4.17 87.65 3.67 24.14 Feasible
2 Replace all the 150W HPSV lamps and fixtures with 60W LED street light
5,42,788 25.84 184.35 9.22 193.57 11.09 -1.84 Decision to be taken by
ULB
3
Use of automation and voltage stabilizer with GSM based control system for street lighting
3,49,112 16.62 22.50 4.60 27.10 1.87 52.63 Feasible
Table No. 4- Brief summary of Energy consumption in SL through LED as Option-II
* Note – As per instructions from BEE, one more option for street lighting has been worked out for LED lighting whose summary is mentioned above.
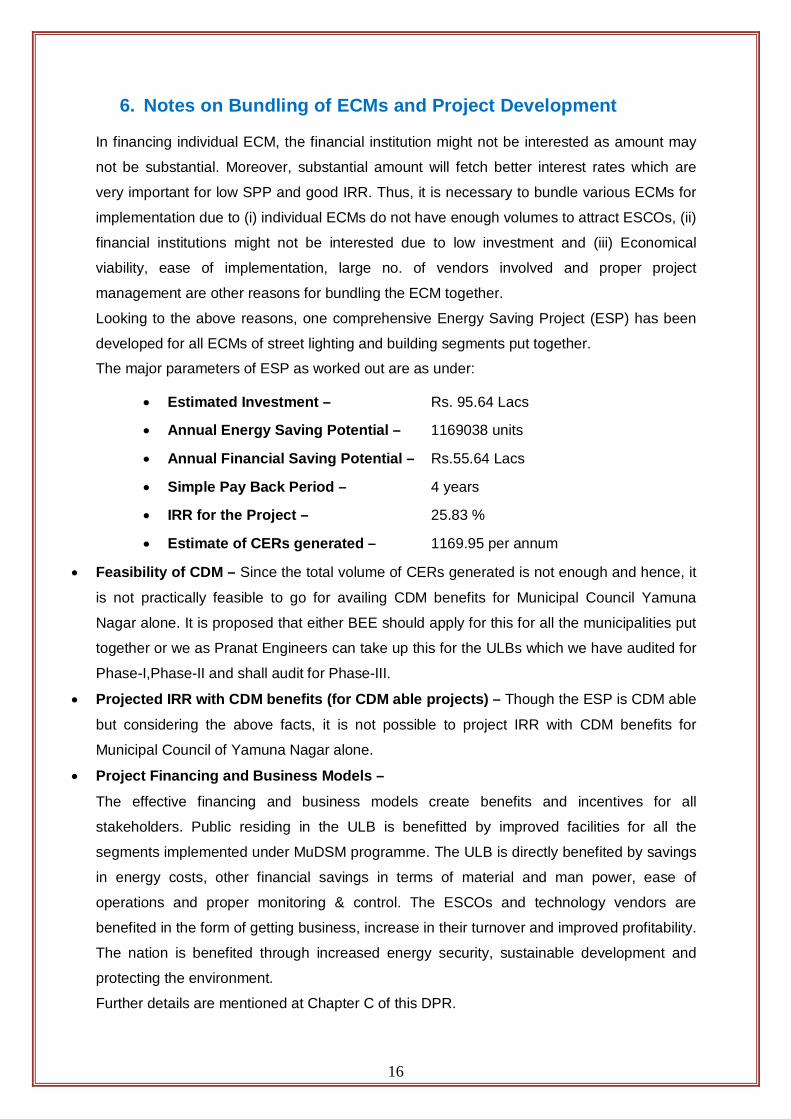
6. Notes on Bundling of ECMs and Project Development
In financing individual ECM, the financial institution might not be interested as amount may
not be substantial. Moreover, substantial amount will fetch better interest rates which are
very important for low SPP and good IRR. Thus, it is necessary to bundle various ECMs for
implementation due to (i) individual ECMs do not have enough volumes to attract ESCOs, (ii)
financial institutions might not be interested due to low investment and (iii) Economical
viability, ease of implementation, large no. of vendors involved and proper project
management are other reasons for bundling the ECM together.
Looking to the above reasons, one comprehensive Energy Saving Project (ESP) has been
developed for all ECMs of street lighting and building segments put together.
The major parameters of ESP as worked out are as under:
Estimated Investment – Rs. 95.64 Lacs
Annual Energy Saving Potential – 1169038 units
Annual Financial Saving Potential – Rs.55.64 Lacs
Simple Pay Back Period – 4 years
IRR for the Project – 25.83 %
Estimate of CERs generated – 1169.95 per annum
Feasibility of CDM – Since the total volume of CERs generated is not enough and hence, it
is not practically feasible to go for availing CDM benefits for Municipal Council Yamuna
Nagar alone. It is proposed that either BEE should apply for this for all the municipalities put
together or we as Pranat Engineers can take up this for the ULBs which we have audited for
Phase-I,Phase-II and shall audit for Phase-III.
Projected IRR with CDM benefits (for CDM able projects) – Though the ESP is CDM able
but considering the above facts, it is not possible to project IRR with CDM benefits for
Municipal Council of Yamuna Nagar alone.
Project Financing and Business Models –
The effective financing and business models create benefits and incentives for all
stakeholders. Public residing in the ULB is benefitted by improved facilities for all the
segments implemented under MuDSM programme. The ULB is directly benefited by savings
in energy costs, other financial savings in terms of material and man power, ease of
operations and proper monitoring & control. The ESCOs and technology vendors are
benefited in the form of getting business, increase in their turnover and improved profitability.
The nation is benefited through increased energy security, sustainable development and
protecting the environment.
Further details are mentioned at Chapter C of this DPR.
16

A. Introduction It is not surprising that electricity consumption in municipal sector is increasing steadily over
the last few years. Municipal corporation must not only consider financial & resource security
benefit from DSM measures, but also need to recognize impact on environment created by
burning of fossil fuels.
DSM measures have a key role in eliminating power shortage. There is need to address
these issues on priority through integrated and comprehensive approach and by adopting
latest techniques and technologies with active participation of all stakeholders.
Municipal bodies often lack sufficient institutional capacity to develop practical approach for
maximizing efficiency, even after recognizing the potential benefits. Urban Local Bodies
(ULBs) have to develop proper approach & proper model to identify energy efficiency
projects & implementation strategy for the efficient energy management. The goal of energy
management must be on provision of services like drinking water & street lights with the
least cost and least environmental effect.
The major energy loads in a municipality are typically the water pumping systems, street
lighting, sewage treatment and handling, and electricity distribution. Municipal buildings such
as offices, hospitals, schools also contribute to the high municipal energy bills. Therefore,
the following systems would be targeted during the municipal energy efficiency audit:
a. Municipal Buildings
b. Street Lighting
In order to take this concept forward and to measure the actual savings in power
consumption, it is necessary to first establish a base line of energy consumption, which
would act as a reference point.
Thus, as a first step it would be necessary to undertake the energy audit of the ULBs. The
energy audit would involve studying configuration of the existing systems and its operations
and the consumption and cost of electricity. Based on the energy audit, appropriate projects
can be recommended that would lead to reduction in energy consumption. A cost benefit
analysis would also be presented, which would enable the ULBs to decide whether or not to
implement the recommended energy efficiency solution.
As the name implies, an Investment Grade Audit (IGA) is the process of conducting a
detailed energy audit to quantify the savings potential, and translating the technical findings
into financial terms, and present it as a bankable project capable of securing a loan. The
report would contain comprehensive information related to energy use by the municipality
and provide clarity on the baseline and assessment of savings once the project is
implemented.
17
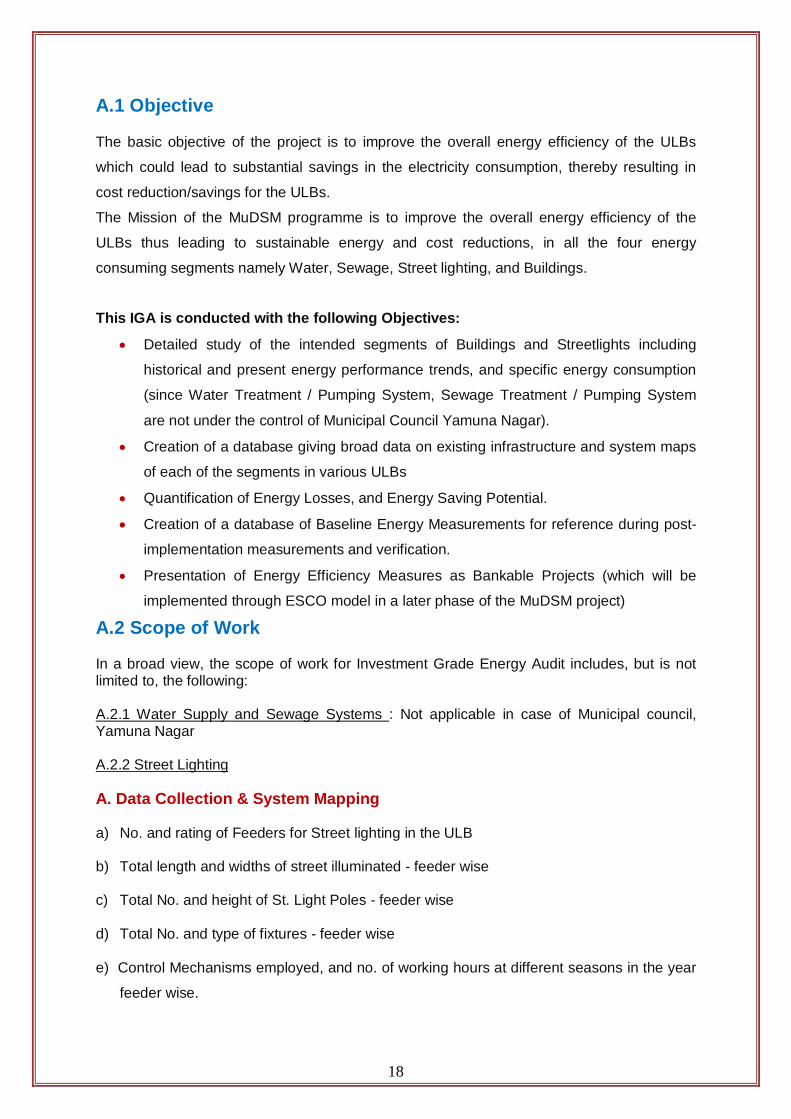
A.1 Objective
The basic objective of the project is to improve the overall energy efficiency of the ULBs
which could lead to substantial savings in the electricity consumption, thereby resulting in
cost reduction/savings for the ULBs.
The Mission of the MuDSM programme is to improve the overall energy efficiency of the
ULBs thus leading to sustainable energy and cost reductions, in all the four energy
consuming segments namely Water, Sewage, Street lighting, and Buildings.
This IGA is conducted with the following Objectives:
Detailed study of the intended segments of Buildings and Streetlights including
historical and present energy performance trends, and specific energy consumption
(since Water Treatment / Pumping System, Sewage Treatment / Pumping System
are not under the control of Municipal Council Yamuna Nagar).
Creation of a database giving broad data on existing infrastructure and system maps
of each of the segments in various ULBs
Quantification of Energy Losses, and Energy Saving Potential.
Creation of a database of Baseline Energy Measurements for reference during post-
implementation measurements and verification.
Presentation of Energy Efficiency Measures as Bankable Projects (which will be
implemented through ESCO model in a later phase of the MuDSM project)
A.2 Scope of Work
In a broad view, the scope of work for Investment Grade Energy Audit includes, but is not limited to, the following:
A.2.1 Water Supply and Sewage Systems : Not applicable in case of Municipal council, Yamuna Nagar
A.2.2 Street Lighting
A. Data Collection & System Mapping
a) No. and rating of Feeders for Street lighting in the ULB
b) Total length and widths of street illuminated - feeder wise
c) Total No. and height of St. Light Poles - feeder wise
d) Total No. and type of fixtures - feeder wise
e) Control Mechanisms employed, and no. of working hours at different seasons in the year
feeder wise.
18

B. Measurements & Analysis a) General study of HT & LT electrical power distribution system and to carry out actual
measurement of the electrical parameters like voltage, current, active / reactive power,
power factor etc. using calibrated instruments and find out any energy conservation
possibilities therein.
b) To review actual loading and load distribution on transformer and to assess possibilities
of energy saving.
c) To review the voltage levels in street lighting systems, and suggest mechanisms for
voltage optimization.
d) To review rating and location of capacitor and suggest power factor improvement
scheme, if required and to carry out the harmonics analysis study and suggesting
measures to mitigate it if required.
e) Feeder wise Monitoring & Measurement of Electrical Energy Consumption (KWH &
KVAH).
f) Measurement of the lux level at different positions of the road. Along the pole, the lux
level should be measured under light fittings, middle of the road and both edges of the
road. Between two poles, the lux level should be measured towards verge, middle of the
road and both edges of the road.
g) Providing a list of energy efficient street light manufacturers / suppliers.
h) Analysis of the reduction in Electrical Energy Consumption (KWH & KVAH) due to
energy efficient lighting without compromising the present lux level based on technical
parameters like power factor, lumen / watt, CIE Color Rendering Index, reduction of lux
level with use, distance between two poles, angle of the fixture in which the light is to be
mounted
i) Suggest retrofits where appropriate, with the best energy efficient lighting from among
various options like LED, Metal halides, CFL, TL-5 etc.
A.2.3 Municipal Buildings A. Data Collection & System Mapping a) No. of Buildings owned by the municipality, or where the energy cost is borne by the
municipality, including schools, hospitals etc.
b) No. of Municipal Buildings selected for the study and reasons for the selection (note:
selection to be made on factors like Energy Consumption level, Purpose /Utility of
Buildings, presence of energy consuming utilities like HVAC systems, Utilization etc.)
c) Total connected load of the individual Buildings
19

d) Electricity Consumption in the selected Buildings - Monthly Average KWh
e) Maximum Demand of the individual Buildings
f) Electricity bills for past 3 yrs. to be collected and studied / summarized for indicators like
month wise Unit Consumption, Power Factor, Max Demand, Unit cost, Rebates and
Penalties availed / levied for each billing period, as per local Tariff Rules of the State /
Supply Utility. (Note: Electricity bills for the past 12 months required at a minimum)
g) Inventory including capacity ratings of all equipments like Transformers, Lighting
Transformers, Water Storage and Pumping, HVAC system, DG Sets etc.
h) Electrical Single Line Diagram
i) Floor Mapping of buildings, with details of electrical fittings like lighting fixtures, location
of ACs, Fan-Coil Units, AHUs etc.
j) Floor / Work Area wise inventory of lighting fixtures with details of type, wattage and
Control Mechanism
k) Sketch / Line Diagram, and Design Details of Chillers, Chilled and Cooling Water
Pumping Systems, Cooling Towers etc.
l) Condition of DG, its installed capacity, %loading, SEGR and status of maintenance
practice.
B. Measurements & Analysis A. ELECTRICAL & INSTRUMENTATION SYSTEM AND PLANT OPERATION i) General study of HT & LT electrical power distribution system and to carry out actual
measurement of the electrical parameters like voltage, current, active / reactive power,
power factor etc. using calibrated instruments and find out any energy conservation
possibilities therein.
ii) To review actual loading and load distribution on transformer and to assess possibilities
of energy saving.
iii) To review rating and location of capacitor and suggest power factor improvement
scheme, if required and to carry out the harmonics analysis study and suggesting
measures to mitigate it if required.
iv) Load profile at LT mains should be prepared for at least 24 hours so that variation and
problem of power quality can be addressed.
v) Study of electrical services to construct demand profile by measurement & analysis of
daily load variations at mains of services
vi) To note and prepare a document showing various name plates and other important
technical details and to collect missing information from manufacturer or to establish
various technical parameters while measurement for various equipment like pump,
motor, compressor etc is being done.
20

vii) Measurements of operating parameters for individual motors, and a simultaneous study
of operating parameters of the driven equipment.
viii) Identifying improper facilities/ installations, and possibility of implementing best practices
by the concerned department. Identifying the possibilities of energy saving by
modification in plant machinery / equipment without deteriorating the plant results.
ix) Study and review the pattern of energy consumption of various water distribution stations,
water treatment plants, drainage pumping stations, sewage treatment plants & other
facilities and find out the areas of energy conservation possibilities.
x) Study and review the pattern of energy consumption of various equipments like air
conditioning units, water heaters, various lighting luminaires, fans etc. and find out areas
of energy conservation possibilities.
xi) Determination and Study of Specific Energy Consumption of major utilities like Air
conditioning plants, Chillers, Air compressors, being used in the Treatment plants and
Pumping Stations etc.
b) Sub-metering of major energy consuming systems and monitoring of system operating
characteristics.
c) Study and review the pattern of energy consumption of various equipments like air
conditioning units, water heaters, various lighting luminaries, fans etc. and find out areas
of energy conservation possibilities.
d) Determination and Study of Specific Energy Consumption of major utilities like Air
Conditioning Plants, Chillers, Air Compressors, being used in the Buildings.
e) Identifying opportunities to refine and/or expand the energy monitoring capability of
Building Management System (BMS) where applicable.
f) Understanding the operating characteristics of all energy consuming systems, in the
building, and also situations that cause load profile variations on both an annual and
daily basis.
A.2.4 General
Having gone through various measurement and results and studying whole system in
details, consultant has to suggest energy saving measures in following ways:
• Without investment measures
• Negligible investment measures.
• Investment measures
A.2.5 Baseline Measurements
Energy baseline parameters may include but is not limited to the following, as appropriate:
21

Any of the measurements and observations made during the IGA by the consultant may be
identified as Energy Baseline parameters.
In general, baseline parameter measurements / observations should be logged over a
sufficient and feasible duration during the IGA. (Eg. Simultaneous Power, Pressure and Flow
measurements of Pumps to be logged for an hour at a minimum, Streetlight Feeder Power
consumption Parameters like KWh, KVA, pf to be logged, for the entire operating hours for 1
day at a minimum).
Over and above the measurements and observations made, all efforts should be made to
collect Historical data wherever available with MUNICIPALITY. These may include, but is not
limited to:
Historical monthly Averages (eg. over the past 36 or 12 months, whichever is higher) for:
• Hours of Operation and Temperature settings etc. in each season, for Building systems \
equipment in like Air Conditioning Units etc.
• Hours of Operation in each season for Street Lighting
A.3 Overall Approach for DPR Preparation
The data including inventories of equipments in respect of both energy segments has been
collected and variables affecting performance of the energy systems have been measured
and analyzed for identification of ECMs. Energy Saving Projects (ESPs) have been
developed by bundling ECMs after consultations with Technology vendors and prospective
ESCOs.
The sequence of main activities in preparation of this DPR as carried out in the year
2009-10 is shown below:-
S. No. Month/Activity Oct Nov Dec Jan Feb
1 Visit to ULB 2 Preparation of Schedule 3 Data collection & system mapping 4 Field measurement 5 Analysis of data 6 Identification of ECMs
7 Documentation for data uploading & Uploading of Data
8 Consultation with vendors 9 Development of ESPs
10 Preparation of Draft DPR Table No 5 :- Activity schedule for IGA of Yamuna Nagar
22
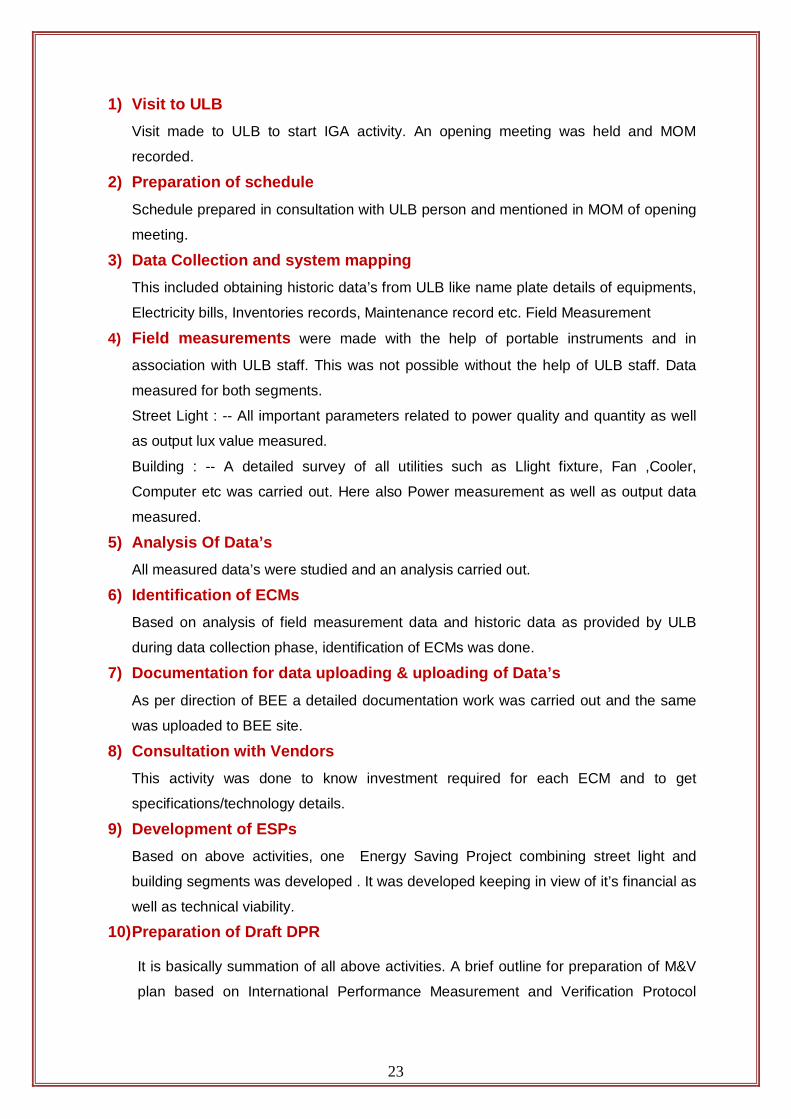
1) Visit to ULB Visit made to ULB to start IGA activity. An opening meeting was held and MOM
recorded.
2) Preparation of schedule Schedule prepared in consultation with ULB person and mentioned in MOM of opening
meeting.
3) Data Collection and system mapping This included obtaining historic data’s from ULB like name plate details of equipments,
Electricity bills, Inventories records, Maintenance record etc. Field Measurement
4) Field measurements were made with the help of portable instruments and in
association with ULB staff. This was not possible without the help of ULB staff. Data
measured for both segments.
Street Light : -- All important parameters related to power quality and quantity as well
as output lux value measured.
Building : -- A detailed survey of all utilities such as Llight fixture, Fan ,Cooler,
Computer etc was carried out. Here also Power measurement as well as output data
measured.
5) Analysis Of Data’s All measured data’s were studied and an analysis carried out.
6) Identification of ECMs Based on analysis of field measurement data and historic data as provided by ULB
during data collection phase, identification of ECMs was done.
7) Documentation for data uploading & uploading of Data’s As per direction of BEE a detailed documentation work was carried out and the same
was uploaded to BEE site.
8) Consultation with Vendors This activity was done to know investment required for each ECM and to get
specifications/technology details.
9) Development of ESPs Based on above activities, one Energy Saving Project combining street light and
building segments was developed . It was developed keeping in view of it’s financial as
well as technical viability.
10)Preparation of Draft DPR
It is basically summation of all above activities. A brief outline for preparation of M&V
plan based on International Performance Measurement and Verification Protocol
23

(IPMVP) EVO 10000-1: 2009 published by Efficiency Valuation Organization (EVO)
has also been included in the DPR. The best practices on energy management as
relevant to the energy segments of the ULBs have also been included.
All the above activities were carried out by following team:
1. Shri R.K.Khilnani, BEE Certified Auditor and Team Leader
2. Shri Akash Jain, Director & Electrical Engineer
3. Shri Somesh Mittal, Electrical Engineer
4. Shri Brij Deo Prasad, Electrical Supervisor
5. Shri H.S.Negi, Electrical Supervisor
Sh. A.K.Jain, General Manager and BEE certified Energy Manager has helped in preparing the final DPR only
24

B.1 Water Treatment and Pumping Systems This segment is not there within the purview of Municipal Council, Yamuna Nagar and hence not within the scope of work.
B.2 Sewage Water Treatment and Pumping Systems This segment is not there within the purview of Municipal Council, Yamuna Nagar and hence not within the scope of work.
25
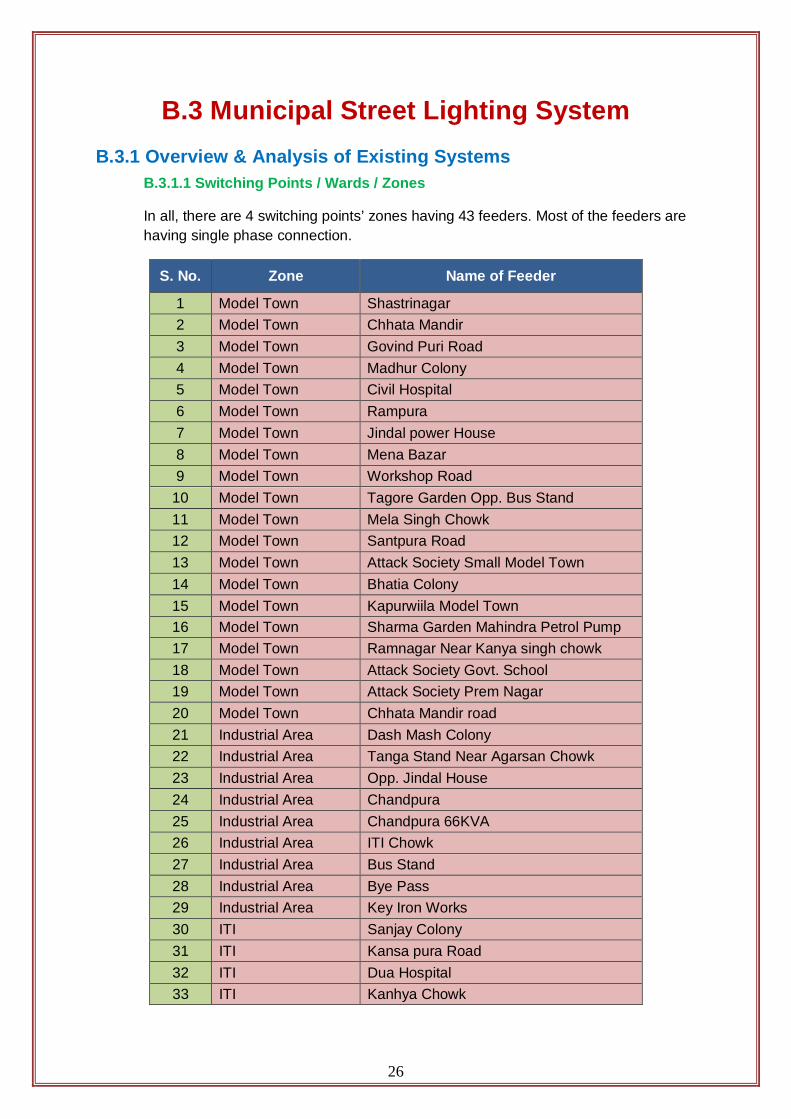
B.3 Municipal Street Lighting System B.3.1 Overview & Analysis of Existing Systems
B.3.1.1 Switching Points / Wards / Zones
In all, there are 4 switching points’ zones having 43 feeders. Most of the feeders are having single phase connection.
S. No. Zone Name of Feeder
1 Model Town Shastrinagar 2 Model Town Chhata Mandir 3 Model Town Govind Puri Road 4 Model Town Madhur Colony 5 Model Town Civil Hospital 6 Model Town Rampura 7 Model Town Jindal power House 8 Model Town Mena Bazar 9 Model Town Workshop Road
10 Model Town Tagore Garden Opp. Bus Stand 11 Model Town Mela Singh Chowk 12 Model Town Santpura Road 13 Model Town Attack Society Small Model Town 14 Model Town Bhatia Colony 15 Model Town Kapurwiila Model Town 16 Model Town Sharma Garden Mahindra Petrol Pump 17 Model Town Ramnagar Near Kanya singh chowk 18 Model Town Attack Society Govt. School 19 Model Town Attack Society Prem Nagar 20 Model Town Chhata Mandir road 21 Industrial Area Dash Mash Colony 22 Industrial Area Tanga Stand Near Agarsan Chowk 23 Industrial Area Opp. Jindal House 24 Industrial Area Chandpura 25 Industrial Area Chandpura 66KVA 26 Industrial Area ITI Chowk 27 Industrial Area Bus Stand 28 Industrial Area Bye Pass 29 Industrial Area Key Iron Works 30 ITI Sanjay Colony 31 ITI Kansa pura Road 32 ITI Dua Hospital 33 ITI Kanhya Chowk
26

34 Sub.Divn. I Gulab Nagar 35 Sub.Divn. I Camp Colony 36 Sub.Divn. I Veena Nagar 37 Sub.Divn. I Old Hamida Colony 38 Sub.Divn. I Anand Colony 39 Sub.Divn. I Khajoori Road 40 Sub.Divn. I Patel Nagar 41 Sub.Divn. I Kunwara Chatt 42 Sub.Divn. I VishwaKarma Chowk 43 Sub.Divn. I Morni park
Table No. 6: Zone wise switching point detail
B.3.1.2 Street Lighting Inventory Survey
Total No. of fixture in ULB: 4969
150W HPSV 400W HPSV 40 W TFL
1229 30 3710
400W HPSV 150W HPSV 1%
25%
40W TFL 74%
Figure 3: Percentage consumption of ULB as per inventory
Switching Point wise installed kW
S. No. Name of Feeder Installed kW
1 Shastrinagar 12.978 2 Chhata Mandir 7.596 3 Govind Puri Road 13.212 4 Madhur Colony 12.24 5 Civil Hospital 14.382 6 Rampura 9.594
27

10
15
20
25
30
35
40
7 Jindal power House 9.54 8 Mena Bazar 4.824 9 Workshop Road 8.802
Tagore Garden Opp. Bus Stand 16.65 11 Mela Singh Chowk 5.976 12 Santpura Road 16.362 13 Attack Society Small Model Town 16.92 14 Bhatia Colony 13.932
Kapurwiila Model Town 16.704 16 Sharma Garden Mahindra Petrol Pump 8.604 17 Ramnagar Near Kanya singh chowk 8.496 18 Attack Society Govt. School 6.282 19 Attack Society Prem Nagar 27.396
Chhata Mandir road 7.002 21 Dash Mash Colony 12.366 22 Tanga Stand Near Agarsan Chowk 19.458 23 Opp. Jindal House 16.416 24 Chandpura 5.544
Chandpura 66KVA 0.36 26 ITI Chowk 6.3 27 Bus Stand 18.9 28 Bye Pass 17.226 29 Key Iron Works 0
Sanjay Colony 0 31 Kansa pura Road 4.32 32 Dua Hospital 2.088 33 Kanhya Chowk 3.762 34 Gulab Nagar 11.16
Camp Colony 12.294 36 Veena Nagar 12.06 37 Old Hamida Colony 11.718 38 Anand Colony 6.84 39 Khajoori Road 15.282
Patel Nagar 6.102 41 Kunwara Chatt 12.672 42 VishwaKarma Chowk 2.7 43 Morni park 0
Table No. 7: Switching point wise installed kW Switching Point wise Fixture details and Installed kW can also be seen at Appendix B/3/1
28

Fixture category wise installed kW -:
S. No. Existing Fitting Installed Load (kW) Percentage of Load
1 FTL40W 200.34 46%
2 HPSV 400W 13.20 3%
3 HPSV150W 221.22 51%
Total 434.76 100% Table No. 8: Fixture category wise installed kW
HPSV 400W 3%
HPSV 150W 51%
FTL 40W 46%
Figure No.4: Percentage fixture category wise installed kW
o Reduction of Load after installation with energy efficient fittings
S. No. Existing Fitting No. of Fixture Installed
Load (kW) Proposed Fitting Proposed Load (kW)
1 FTL40W 3710 200.34 28W-T5 111.3
2 HPSV 400W 30 13.20 3x36W CFL
FLOOD Light 5.4
3 HPSV150W 1229 221.22 4x14W-T5 71.28
Total 434.76 193.13
Table No.9: Load Reduction Chart after implementation
29

200.34
111.3
13.2 5.4
221.22
71.28
0
50
100
150
200
250
FTL 40W HPSV 400W HPSV 150W
Existing Load (kW) Proposed Load (kW)
Figure No.5: Bar chart of Load Comparison Before and after implementation
Appendix B/3/1 Switching Point wise Fixture details and Installed kW
B.3.1.3 Maintenance and Replacement Trends: Records not readily available
B.3.2 Comments and Observations on Streetlight Design o The street lights have been mounted on street light poles as well as on HT/LT electric
line poles. At some places it was mounted on building structures as well. There is no
standard practice for fixture fixing except few are where new fixture was installed.
o There is no uniformity of lighting. At some place it is highly scattered. Uniformity is
observed at street lights which have been recently installed.
o Only few main roads are having poles at centre verge and rest all area whether it is
main road or side road, all poles are at sides only.
o Pole span varies from 15 Mt to 45 Mt. But in average it is 30 Mt.
o Height of the pole in street light is 9 mt.
B.3.3 Baseline Period, Energy Consumption, and other Baseline Parameters
Baseline Period considered during IGA studies: Mar.08-Jun.09
Annual kWh consumption of Streetlight
o Based on Measurements and extrapolation to the actual operating hrs: 7.59
Lakh KWh
o Based on billing data: 11.87 Lakh KWh
o Power tariff for the street light segment is Rs. 4.76/units
o Annual kWh consumption season wise shown below
30

31
Type of Fitting
Installed Fixture
Total load (kW)
Working hours per day Annual Energy consumption
Summer Winter Monsoon Summer Winter Monsoon FTL40W 3710 200.34 10 11 11 244.41 264.44 271.06
400W MH 30 13.2 10 11 11 16.10 17.42 17.85 HPSV150W 1229 221.22 10 11 11 269.88 292.01 299.31
Table No. 10 Annual kWH consumption Season wise Note: Assuming 122 days working of street light in summer season (i.e. March – June), 123 days
working of street Light in Monsoon season (i.e. July – October) and 120 days working of Street Light
in Winter season (i.e. November – February)
B.3.4 Service Delivery Levels & Specific Energy Consumption Notes on methodology of data collection, measurements and study
Field measurement was carried out by portable meters. It was connected and all necessary data related to power quality and quantity measurement was recorded. Recording time was between five minutes to half an hour depending upon requirement.
Explanatory notes and analysis of service delivery levels, eg. Road Category wise Avg. Services Delivery levels (lux)
There is lot of variation observed at some feeder or ward light density is too high where as at some place it is very low.
Please refer to Appendix B/1/2 Switching Point wise Illumination Measurement
Also refer to Appendix B/1/3 Switching Point wise Service Delivery Levels & SEC
The Lux level and the Category of the road is defined under IS 1944. The detail is given below in the table:
Per Capita kWh consumption for Street lighting – 6.26 Units
kWh / annum/Installed kW for Street lighting – 985.8 ( Range 60.2 - 8922)
Average Street lighting Service levels (lux) for Major and Minor Streets – 5.07
( Range 0.68 - 28.21)
kWh / annum/ Lux for Street lighting – 2080 ( Range 44.61 - 21610)

CLASSIFI CATION
OF LIGHTING INSTALLA
TION
TYPE OF ROAD
AVERAGE LEVEL OF
ILLUMINATI ON ON ROAD
SURFACE
RATIO MINIMUM/ AVERAGE ILLUMINAT
ION
TRANSVERSE UNIFORMITY
RATIO = (MinILLUMINATION/
Max ILLUMINATION)
TYPE OF LUMINAIRE
Preferred Permitte d
(1) (2) (3)lux (4) (5) (6) (7)
Group A1 Important traffic routes carrying
fast traffic 30 0.4 33 cut-off semi -cut
off
Group A2
Other main roads carrying mixed
traffic , like main city streets , arterial roads
,throughways etc
15 0.4 33 cut-off semi -cut off
Group B1
Secondary roads with considerable traffic like principle local traffic routes , shopping streets ,
etc
8 0.3 20 cut-off or semi cut
off
not -cut off
Group B2 Secondary roads with light traffic 4 0.3 20
cut-off or semi cut
off
not -cut off
Table No. 11: Road Category Illumination as per standard IS 1944
32

B.3.5 Energy Conservation Recommendations (ECRs) with cost benefit analysis
As per instructions received from BEE, one more option for using LED in street lighting has also been considered wherever feasible.
ECM No. 1/B-3 (Option-I):
A. Title Recommendation : Replace all single 40W FTL with 28W-T5 with electronic ballast
Description of Existing B. system :
At many places single fitting of 40W FTL with electromagnetic ballast are in use. The average pole span is 30 mtrs. and pole height is 9.0 mtrs.
C. Recommendation : These should be replaced with 28W-T5 with electronic ballast.
D. Energy Saving Calculation
Average power consumption of single 40W FTL with electromagnetic ballast
: 54 W
Average power consumption of single 28W-T5 fitting with electronic ballast
: 30 W
Average power saving after replacement of 28WT5 : 24 W
Average working hour per day : 11 hrs.
Average No. of working days : 365 days
Approximate No. of fixture : 3710
E. Cost Benefit Calculation Annual Energy Saving potential : 357495.60 units Power tariff : Rs. 4.76 per unit Annual Cost Saving : Rs. 1701679.06 Cost of Single fitting : Rs. 600 per fitting Total investment cost : Rs. 2226000 Total R & M cost : Rs. 111300 (5% of Investment cost) Total recurring cash flow : Rs. 222600 (10% of Investment Cost) Annual Net Saving : Rs. 1367779.06 Simple Payback Period : 1.63 years Net NPV : Rs. 4912729 IRR % : 60.29
Vendor Information : Please see annexure Product Information : Please see annexure
Table No 12 A- Recommendation 1 for Street Light (Option – I)
33

ECM No. 1/B3 (Option - II)
A. Title Recommendation : Replace all single 40W FTL with 16 W LED tube light.
B. Description of Existing system :
At many places single fitting of 40W FTL with electromagnetic ballast are in use. The average pole span is 30 mtrs. and pole height is 9.0 mtrs.
C. Recommendation : These should be replaced with 16 W LED tubular Street light
D. Energy Saving Calculation
Average power consumption of 40 W FTL with electromagnetic ballast : 54 W
Average power consumption of 16 W LED Street light : 16 W
Average power saving after replacement with 16 W LED Street light : 38 W
Average working hour per day : 11 hrs.
Average No. of working days : 365 days
Approximate no. of fixtures : 3710
E. Cost Benefit Calculation Annual Energy Saving potential : 5,66,035 units Power tariff : Rs. 4.76 per unit Annual Cost Saving : Rs.26,94,327/-Cost of Single fitting of LED : Rs. 2,250/- per fitting
Total investment cost : Rs. 83,47,500/-
Total R & M cost on LED : Rs. 4,17,375 (5% of Investment cost) Total recurring cost on LED : NIL Annual Net Saving : Rs.22,76,952/-Simple Payback Period : 3.67 years Net NPV : Rs. 40,33,738/-IRR % : 24.14%
Vendor Information : Please see annexure Product Information : Please see annexure
Table No 12 B - Recommendation 1 for Street Light (option-II)
34

ECM No. 2/B3 (Option-I):
A. Title Recommendation : Replace all 150W HPSV Lamp with 4x14W-T5 with electronic ballast
B. Description of Existing system :
At many places 150W HPSV with electromagnetic ballast are in use. The average pole span is 30 mtrs. and pole height is 9.0 mtrs.
C. Recommendation : These should be replaced with 4x14W-T5 with electronic ballast.
D. Energy Saving Calculation
Average power consumption of 150W HPSV with electromagnetic ballast : 180 W
Average power consumption of 4x14W-T5 with electronic ballast : 58 W
Average power saving after replacement with 4x14W T5 : 122 W
Average working hour per day : 11 hrs.
Average No. of working days : 365 days
Approximate No. of fixture : 1229
E. Cost Benefit Calculation Annual Energy Saving potential : 602001.07 units Power tariff : Rs. 4.76 per unit Annual Cost Saving : Rs. 2865525.09 Cost of Single fitting : Rs. 4500 per fitting Total investment cost : Rs. 5530500 Total R & M cost : Rs. 276525 (5% of Investment cost) Total recurring cash flow : Rs. 553050 (10% of Investment Cost) Annual Net Saving : Rs. 2035950.09 Simple Payback Period : 2.72 years Net NPV : Rs. 53,33,100 IRR % : 34.98
Vendor Information : Please see annexure Product Information : Please see annexure
Table No 13 A- Recommendation 2 for Street Light (Option – I)
35

ECM No. 2/B3 (Option - II)
A. Title Recommendation : Replace all 150W HPSV street light with 60 W LED Street light
B. Description of Existing system :
At many places 150W HPSV with electromagnetic ballast are in use. The average pole span is 30 mtrs. and pole height is 9.0 mtrs.
C. Recommendation : These should be replaced with 60 W LED Street light
D. Energy Saving Calculation
Average power consumption of 150W HPSV with electromagnetic ballast : 180 W
Average power consumption of 60 W LED Street light : 70 W
Average power saving after replacement with 60 W LED Street light : 110 W
Average working hour per day : 11 hrs.
Average No. of working days : 365 days
Approximate No. of fixture : 1229
E. Cost Benefit Calculation Annual Energy Saving potential : 542788 units Power tariff : Rs. 4.76 per unit Annual Cost Saving : Rs. 25,83,671/-Cost of Single fitting of LED : Rs. 15,000/- per fitting Total investment cost : Rs. 1,84,35,000/-Total R & M cost on LED : Rs. 9,21,750 (5% of Investment cost) Total recurring cost on LED : NIL Annual Net Saving : Rs. 16,61,921/-Simple Payback Period : 11.09 years Net NPV : Rs. -80,75,693/-IRR % : -1.84 %
Vendor Information : Please see annexure Product Information : Please see annexure
Table No 13 B- Recommendation 2 for Street Light (Option- II)
36

ECM No. 3/B3:
A. Title of Recommendation : Replace all the 400W HPSV lamps and fixtures with 5x36W CFL fixtures
B. Description of Existing System and its operation :
At many place 400W HPSV fixtures with choke consumption (40 W) are being used. The average pole span is 30 mtrs. and pole height is 9.0 mtrs.
C. Description of Proposed system and its operation :
These should be replaced with 5x36W CFL flood light with electronic choke fixture.
D. Energy Saving Calculations Energy consumption of a normal 400W HPSV Lamp = 440watts
Energy consumption of a 5x36W CFL fixture having electronic choke = 180 watts
Energy saving per single Lamp replacement = 260 watts
Approximate nos. of 400 W HPSV fixtures = 30
Average use per day = 11 hrs Average use in days of the year = 365 days of the year E. Cost Benefits Annual Energy Saving Potential = 260 X 30 X 11 X 365 / 1000 units
= 31,317 units Annual Cost Savings @ Rs. 4.76/-per unit = Rs. 1,49,068.92/-
Investment @ Rs. 4,500/- per fitting = Rs. 1,35,000 /- for all 30 fittings
Repair & Maintenance Cost @ 5% per annum of investment cost = Rs. 6,750/- per annum
Other Intermittent or recurring Cash Flow @ 10% per annum on replacement
= Rs. 13,500/- for all 30 fittings Net financial savings per annum = Rs. 1,28,818.92/-Simple Payback period = 1.04 years IRR = 95.30% NPV = Rs. 5,29,335/-Details of Technology / Specifications Please see annexure
Equipment vendor Please see annexure Table No 14 - Recommendation 3 for Street Light
37

ECM No. 4/B-3:
A. Title of Recommendation : Improve designing of high masts
B. Description of Existing System and its operation :
There are 5 high masts at Yamuna Nagar but most of them are poorly designed in following ways: (i) More directions have been covered than required (ii) street light poles are there where high mast light is reaching (iii) Angle of fittings is not okay (iv) somewhere there is more light than required
C. Description of Proposed system and its operation :
Each high mast should be designed as per the need of its site. Accordingly, all the high masts will be modified to suit the actual needs.
D. Energy Saving Calculations Total no. of high mast at Yamuna Nagar = 5
Average use per day = 11 hrs Average use in days of the year = 365 days of the year
Total electricity consumption of 5 high masts having 6 lamps each of 250 W MH with improved choke as per ECM no. 3/B-3
= =
280X6X5X 11X365/1000 units 33,726 units
Estimated Saving due to modification of high masts @ 5 %
E. Cost Benefits Annual Energy Saving Potential = 5 % of 33,726 units
= 1,686 units
Annual Cost Savings @Rs 4.76/- unit = Rs. 8025.36/-Investment on modification of high masts (one time only), mostly labour only
= Rs. 5,000/- @ Rs. 1,000/- each high mast
Repair & Maintenance Cost = No extra cost due to modification
Other Intermittent or recurring Cash Flow = No extra cost due to modification Net financial savings per annum = Rs. 8025.36/-
Simple Payback period = 0.62 years
IRR = 160.50%
NPV = Rs. 36,023/-Details of Technology / Specifications Please See Annexure
Equipment vendor Please see Annexure Table No 15 - Recommendation 4 for Street Light
38

ECM No. 5/B-3 (Option-I):
A. Title of Recommendation : Use of automation system for street lighting
B. Description of Existing System and its operation
: Presently, all street lights are being switched ON & switched OFF manually.
C. Description of Proposed system and its operation
: Automation will be done for entire street lighting. Timer based controls will be used for auto switching of street light. Also, there will be single/three phase energy meter, contactor, relays etc in the control panel. One control panel will be there for around 100 light poles/fittings.
D. Energy Saving Calculations
Annual existing energy consumption for entire street light on the basis of fixture installation
= =
( 54 x 3710 + 180 x 1229 + 440 x 30 ) X 11 X 365/1000 units 17,45,561.4 units
Estimated Saving after implementation of automation system
@ = 10 % of annual energy consumption
1,74,556.14 units
E. Cost Benefits Annual Energy Saving Potential = 1,74,556.14 units Annual Cost Savings @Rs 4.76/-unit
= Rs. 8,30,887.22/-
Total load on street light after implementation all the recommendations mentioned in this DPR
= = = 187 kW
Total no. of panel required for entire street lighting
= 50 of 6 KVA (per 100 fixture single 6 kVA panel is required)
Cost of each panel = Rs. 25,000/- for 6 KVA Control panel
Total cost of all 50 panel = Rs. (50 x 25,000) Rs. 12,50,000/-
Cost for making proper distribution of load on street lighting and misc. works (one time cost only)
= Rs. 1,50,000/-
Repair & Maintenance Cost @ =
10 % on cost of panel Rs. 1,25,000/-
Net financial savings per annum = Rs. 7,05,887.22/-Simple Payback period = 2.33 years IRR = 41.41%
NPV = Rs. 20,87,875/-
Details of Technology / Specifications Please see annexure
Equipment vendor Please see annexure Table No 16 A - Recommendation 5 for Street Light (Option- I)
39

ECM No. 5/B3 (Option - II)
A. Title of Recommendation : Use of automation and voltage stabilizer with GSM
based control system for street lighting
B. Description of Existing System and its operation
: Presently, entire street lights are being switched ON & switched OFF manually and there is no voltage stabilizer.
C. Description of Proposed system and its operation
: Automation will be done for entire street lighting. Timer based controls along with voltage stabilizer will be used for auto switching of street light. Also, there will be single/three phase energy meter, contactor, relays, GSM based control etc in the control panel. One control panel will be there for around 100 light poles/fittings.
D. Energy Saving Calculations Annual existing energy consumption for entire street light on the basis of fixture installation
= =
( 54 x 3710 + 180 x 1229 + 440 x 30 ) X 11 X 365/1000 units 17,45,561.4 units
Estimated Saving after implementation of automation system
@ =
20 % of annual energy consumption
3,49,112 units
E. Cost Benefits Annual Energy Saving Potential = 3,49,112 units Annual Cost Savings @Rs 4.76/-unit
= Rs. 16,61,773
Total load on street light after implementation all the recommendations mentioned in this DPR
= = = 187 kW
Total no. of panel required for entire street lighting
= 50 of 6 KVA (per 100 fixture single 6kVA panel is required)
Cost of each panel = Rs. 42,000/- for 6 KVA Control panel
Total cost of all 50 panel = Rs. (50 x 42,000) Rs. 21,00,000/-
Cost for making proper distribution of load on street lighting and misc. works (one time cost only)
= Rs. 1,50,000/-
Repair & Maintenance Cost @ =
10 % on cost of panel Rs. 2,10,000/-
Annual GSM hiring charges for 50 control panels @Rs. 5,000/- point
= Rs.2, 50,000/-
Net financial savings per annum = Rs. 12,01,773/-Simple Payback period = 1.87 years IRR = 52.63%
NPV = Rs. 40,53,826/-
Details of Technology / Specifications Please see annexure
Equipment vendor Please see annexure Table No 16 B - Recommendation 5 for Street Light (option –II)
40
B.3.6 General Comments, Observations and Suggestions
Based on the observations made by the audit team as well as per the discussions held with
municipal council staff, and some vendors during the course of conducting audit, following
suggestions/comments/observations are made to improve the general working conditions
street lighting at municipal council. Municipal Council management is advised to take a note
of these for implementation to the extent possible:
1. A proper schedule should be maintained for the cleaning of light fittings to remove dirt
and entrapped insects. This will improve the lux levels substantially.
41
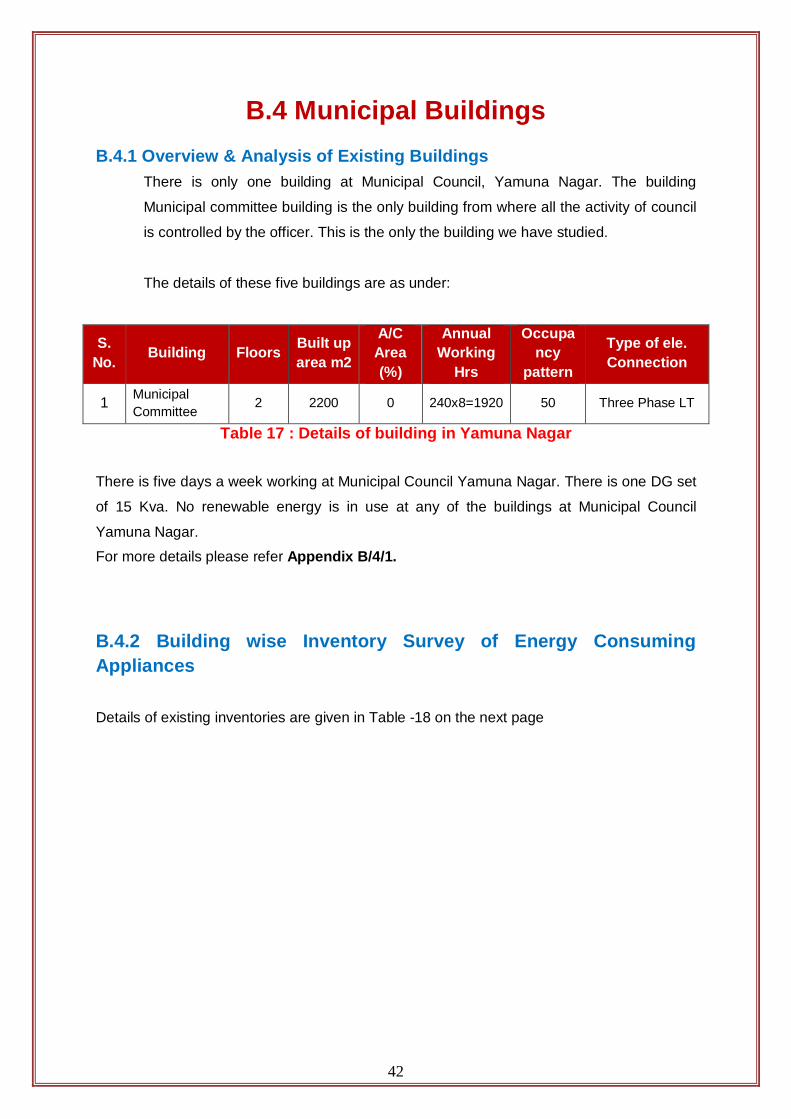
B.4 Municipal Buildings B.4.1 Overview & Analysis of Existing Buildings
There is only one building at Municipal Council, Yamuna Nagar. The building
Municipal committee building is the only building from where all the activity of council
is controlled by the officer. This is the only the building we have studied.
The details of these five buildings are as under:
S. No. Building Floors Built up
area m2
A/C Area (%)
Annual Working
Hrs
Occupa ncy
pattern
Type of ele. Connection
1 Municipal Committee
2 2200 0 240x8=1920 50 Three Phase LT
Table 17 : Details of building in Yamuna Nagar
There is five days a week working at Municipal Council Yamuna Nagar. There is one DG set
of 15 Kva. No renewable energy is in use at any of the buildings at Municipal Council
Yamuna Nagar.
For more details please refer Appendix B/4/1.
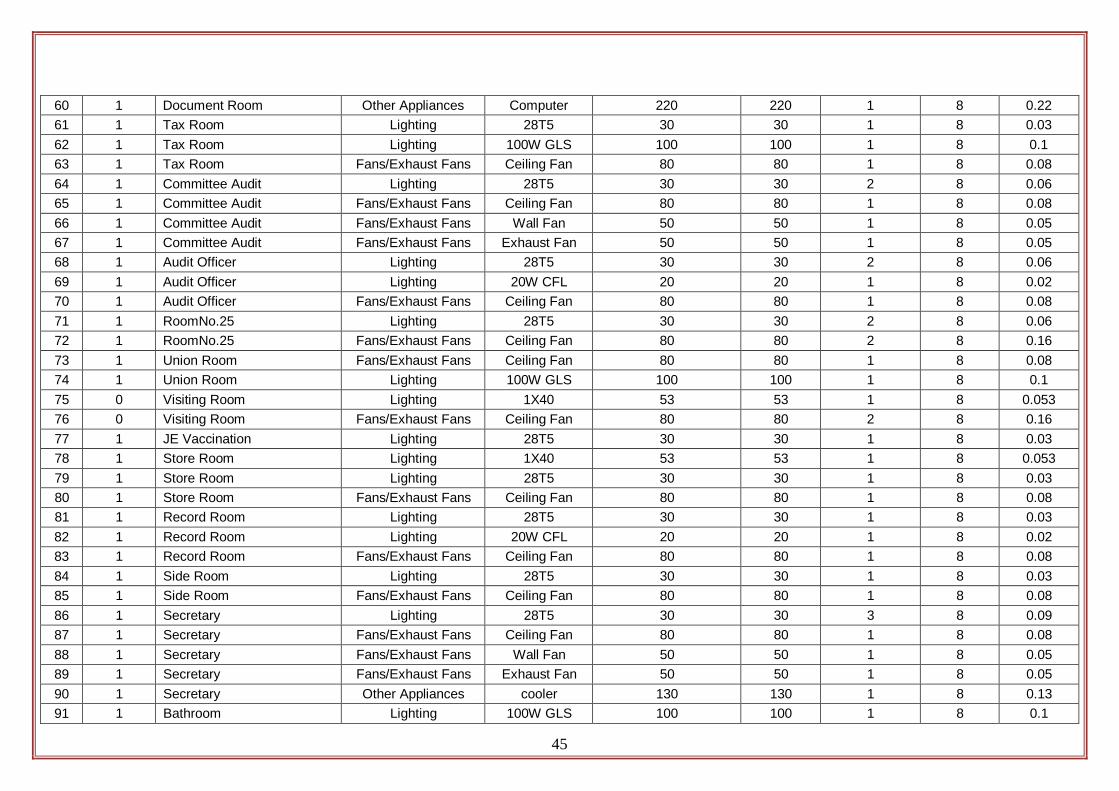
B.4.2 Building wise Inventory Survey of Energy Consuming Appliances
Details of existing inventories are given in Table -18 on the next page
42

43
Building Name & Location / Address: Municipal Committee
Sr. No. Floor Location / Room
description Appliance Category Appliance
Capacity
Wattage (W)
No. of Appliances
Working Hours
Installed Load (kW)
(Mention Value and Units eg. 2 TR for
Window AC, Lit for Geysers etc.)
1 0 Executive Officer Lighting 3X36 FTL 150 150 2 8 0.3 2 0 Executive Officer Lighting 8W DL 8 8 4 8 0.032 3 0 Executive Officer Lighting 23 W CFL 23 23 1 8 0.023 4 0 Executive Officer Fans/Exhaust Fans Ceiling Fan 80 80 1 8 0.08 5 0 Executive Officer Fans/Exhaust Fans Wall Fan 50 50 1 8 0.05 6 0 Executive Officer Fans/Exhaust Fans Exhaust Fan 50 50 1 8 0.05 7 0 Gallery Lighting 28T5 30 30 1 8 0.03 8 0 Gallery Fans/Exhaust Fans Exhaust Fan 50 50 1 8 0.05 9 0 Bathroom Lighting 28T5 30 30 1 8 0.03 10 0 Bathroom Fans/Exhaust Fans Exhaust Fan 50 50 1 8 0.05 11 0 Pardan Room Lighting 3X36 FTL 150 150 2 8 0.3 12 0 Pardan Room Lighting 8W DL 8 8 4 8 0.032 13 0 Pardan Room Fans/Exhaust Fans Ceiling Fan 80 80 1 8 0.08 14 0 Pardan Room Fans/Exhaust Fans Wall Fan 50 50 1 8 0.05 15 0 Pardan Room Fans/Exhaust Fans Exhaust Fan 50 50 1 8 0.05 16 0 Room No. 10 Lighting 28T5 30 30 2 8 0.06 17 0 Room No. 10 Lighting 23W CFL 23 23 1 8 0.023 18 0 Room No. 10 Fans/Exhaust Fans Ceiling Fan 80 80 1 8 0.08 19 0 Room No. 10 Cooler Cooler 130 130 1 8 0.13 20 0 Room No. 3 Lighting 28T5 30 30 1 8 0.03 21 0 Room No. 3 Lighting 23W CFL 23 23 1 8 0.023 22 0 Room No. 3 Fans/Exhaust Fans Ceiling Fan 80 80 1 8 0.08 23 0 Room No. 3 Computer Computer 220 220 1 8 0.22 24 0 Room No. 4 Lighting 28T5 30 30 1 8 0.03 25 0 Room No. 4 Fans/Exhaust Fans Ceiling Fan 80 80 1 8 0.08 26 0 Room No.5 Lighting 28T5 30 30 1 8 0.03 27 0 Room No.5 Fans/Exhaust Fans Ceiling Fan 80 80 1 8 0.08

44
28 0 RoomNo. 6 Lighting 28T5 30 30 2 8 0.06 29 0 RoomNo. 6 Fans/Exhaust Fans Ceiling Fan 80 80 1 8 0.08 30 0 RoomNo. 6 Other Appliances Cooler 130 130 1 8 0.13 31 0 RoomNo. 6 Other Appliances Computer 220 220 1 8 0.22 32 0 Room No.7(M.E.) Lighting 28T5 30 30 2 8 0.06 33 0 Room No.7(M.E.) Fans/Exhaust Fans Ceiling Fan 80 80 1 8 0.08 34 0 Room No.7(M.E.) Fans/Exhaust Fans Wall Fan 50 50 1 8 0.05 35 0 Bathroom Lighting 15W CFL 15 15 1 8 0.015 36 0 Bathroom Fans/Exhaust Fans Exhaust Fan 50 50 1 8 0.05 37 0 Computer Room Lighting 28T5 30 30 2 8 0.06 38 0 Computer Room Fans/Exhaust Fans Ceiling Fan 80 80 1 8 0.08 39 0 Room No.8 Lighting 28T5 30 30 2 8 0.06 40 0 Room No.8 Fans/Exhaust Fans Ceiling Fan 80 80 1 8 0.08 41 0 Room No.9 Lighting 28T5 30 30 1 8 0.03 42 0 Room No.9 Fans/Exhaust Fans Ceiling Fan 80 80 1 8 0.08 43 0 Room No.11 Lighting 28T5 30 30 1 8 0.03 44 0 Room No.11 Fans/Exhaust Fans Ceiling Fan 80 80 1 8 0.08 45 0 Room No.26 Lighting 28T5 30 30 5 8 0.15 46 0 Room No.26 Lighting 30WDL 45 45 3 8 0.135 47 0 Room No.26 Fans/Exhaust Fans Ceiling Fan 80 80 7 8 0.56 48 1 Safai Bivhak Lighting 28T5 30 30 3 8 0.09 49 1 Safai Bivhak Lighting 30W CFL 30 30 1 8 0.03
1 Safai Bivhak Fans/Exhaust Fans Ceiling Fan 80 80 3 8 0.24 1 RoomNo.22 Lighting 28T5 30 30 2 8 0.06 1 RoomNo.22 Lighting 200W GLS 200 200 1 8 0.2 1 RoomNo.22 Fans/Exhaust Fans Ceiling Fan 80 80 1 8 0.08 1 RoomNo. 23 Lighting 28T5 30 30 4 8 0.12 1 RoomNo. 23 Lighting 200W GLS 200 200 1 8 0.2 1 RoomNo. 23 Fans/Exhaust Fans Ceiling Fan 80 80 3 8 0.24 1 RoomNo. 23 Fans/Exhaust Fans Exhaust Fan 50 50 1 8 0.05 1 Document Room Lighting 1X40 53 53 1 8 0.053 1 Document Room Fans/Exhaust Fans Ceiling Fan 80 80 1 8 0.08
50 51 52 53 54 55 56 57 58 59
45
60 1 Document Room Other Appliances Computer 220 220 1 8 0.22 61 1 Tax Room Lighting 28T5 30 30 1 8 0.03 62 1 Tax Room Lighting 100W GLS 100 100 1 8 0.1 63 1 Tax Room Fans/Exhaust Fans Ceiling Fan 80 80 1 8 0.08 64 1 Committee Audit Lighting 28T5 30 30 2 8 0.06 65 1 Committee Audit Fans/Exhaust Fans Ceiling Fan 80 80 1 8 0.08 66 1 Committee Audit Fans/Exhaust Fans Wall Fan 50 50 1 8 0.05 67 1 Committee Audit Fans/Exhaust Fans Exhaust Fan 50 50 1 8 0.05 68 1 Audit Officer Lighting 28T5 30 30 2 8 0.06 69 1 Audit Officer Lighting 20W CFL 20 20 1 8 0.02 70 1 Audit Officer Fans/Exhaust Fans Ceiling Fan 80 80 1 8 0.08 71 1 RoomNo.25 Lighting 28T5 30 30 2 8 0.06 72 1 RoomNo.25 Fans/Exhaust Fans Ceiling Fan 80 80 2 8 0.16 73 1 Union Room Fans/Exhaust Fans Ceiling Fan 80 80 1 8 0.08 74 1 Union Room Lighting 100W GLS 100 100 1 8 0.1 75 0 Visiting Room Lighting 1X40 53 53 1 8 0.053 76 0 Visiting Room Fans/Exhaust Fans Ceiling Fan 80 80 2 8 0.16 77 1 JE Vaccination Lighting 28T5 30 30 1 8 0.03 78 1 Store Room Lighting 1X40 53 53 1 8 0.053 79 1 Store Room Lighting 28T5 30 30 1 8 0.03 80 1 Store Room Fans/Exhaust Fans Ceiling Fan 80 80 1 8 0.08 81 1 Record Room Lighting 28T5 30 30 1 8 0.03
1 Record Room Lighting 20W CFL 20 20 1 8 0.02 1 Record Room Fans/Exhaust Fans Ceiling Fan 80 80 1 8 0.08 1 Side Room Lighting 28T5 30 30 1 8 0.03 1 Side Room Fans/Exhaust Fans Ceiling Fan 80 80 1 8 0.08 1 Secretary Lighting 28T5 30 30 3 8 0.09 1 Secretary Fans/Exhaust Fans Ceiling Fan 80 80 1 8 0.08 1 Secretary Fans/Exhaust Fans Wall Fan 50 50 1 8 0.05 1 Secretary Fans/Exhaust Fans Exhaust Fan 50 50 1 8 0.05 1 Secretary Other Appliances cooler 130 130 1 8 0.13 1 Bathroom Lighting 100W GLS 100 100 1 8 0.1
82 83 84 85 86 87 88 89 90 91

46
92 1 Street Light Departure Room Lighting 28T5 30 30 2 8 0.06 93 1 Street Light Departure Room Lighting 2X40 106 106 1 8 0.106 94 1 Street Light Departure Room Fans/Exhaust Fans Ceiling Fan 80 80 2 8 0.16 95 1 Room No.15 Lighting 28T5 30 30 2 8 0.06 96 1 Room No.15 Fans/Exhaust Fans Ceiling Fan 80 80 1 8 0.08 97 1 Gallery Fans/Exhaust Fans Ceiling Fan 80 80 1 8 0.08 98 1 Stairs Lighting 28T5 30 30 1 8 0.03 99 0 Outdoor Lighting 2X36 86 86 2 8 0.172
100 0 Outdoor Lighting 150W sodium 200 200 1 8 0.2 101 0 Outdoor Lighting 1X40 53 53 1 8 0.053 102 0 Outdoor Lighting 100W GLS 100 100 2 8 0.2 103 0 Outdoor Fans/Exhaust Fans Ceiling Fan 80 80 1 8 0.08 104 0 Outdoor Other Appliances cooler 130 130 1 8 0.13 105 0 Outdoor Other Appliances freidge 165 365 1 8 0.365
0 Hall Lighting 28T5 30 30 10 8 0.3 0 Hall Fans/Exhaust Fans Ceiling Fan 80 80 10 8 0.8 0 Entrance Lighting 28T5 30 30 4 8 0.12 0 Entrance Fans/Exhaust Fans Ceiling Fan 80 80 1 8 0.08 0 Entrance Other Appliances water Cooler 300 300 1 8 0.3
Table 18: Building Inventory Details
106 107 108 109 110

B.4.3 Baseline Period, Energy Consumption, and status of other Baseline Parameters
Specify the Baseline Period considered during IGA studies: (May ’08 to Sep ’09)
Annual Energy Consumption of Municipal Building;
Municipal committee building: 21,061 kWh ( Annual avg. May 08 – Sept.09)
Details of energy usage: (Ref: Appendix B/4/1)
Annual energy consumption (kWh/annum): 21,061KWh
Seasonal variation of Energy Consumption
Power tariff is Rs. 4.76/unit
Municipal Committee Building
0
5000
10000
15000
20000
May July September November January March
Energy Consumption Billing Amount
Figure No.6: Bar chart representation of annual billing of building
Figure no.7 – Power Manager in use at Municipal Council Yamuna Nagar
47

Demand scenario: LT supplies for buildings up to 12 KW load have no demand
surcharge.
Energy Performance Index :
Main Office: 9.573 KWh / M2 / year
Service wise energy consumption for lighting, HVAC, and other major services:
The service wise consumption of energy is shown in following graphics:-
Other appliances Lightning
6% System 50%
Fan/Exhaust Fan/cooler
44%
Figure No.8: Appliance Category wise consumption
48
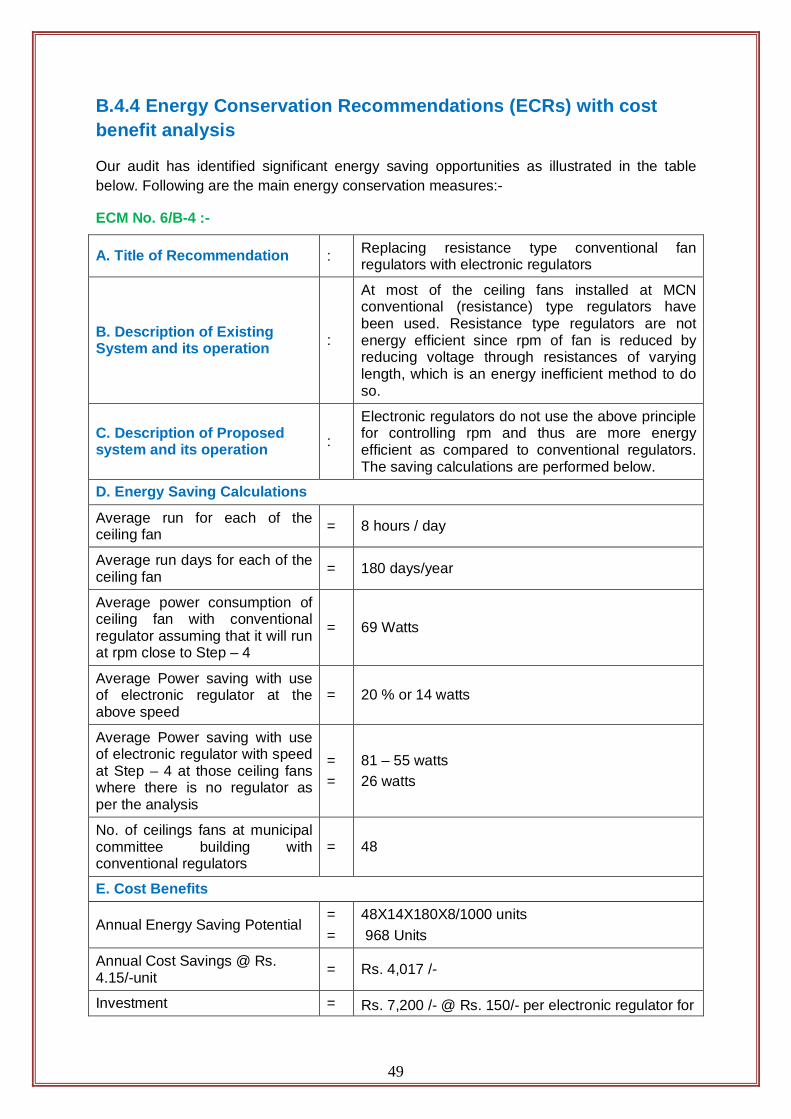
B.4.4 Energy Conservation Recommendations (ECRs) with cost benefit analysis
Our audit has identified significant energy saving opportunities as illustrated in the table below. Following are the main energy conservation measures:-
ECM No. 6/B-4 :-
A. Title of Recommendation : Replacing resistance type conventional fan regulators with electronic regulators
B. Description of Existing System and its operation :
At most of the ceiling fans installed at MCN conventional (resistance) type regulators have been used. Resistance type regulators are not energy efficient since rpm of fan is reduced by reducing voltage through resistances of varying length, which is an energy inefficient method to do so.
C. Description of Proposed system and its operation :
Electronic regulators do not use the above principle for controlling rpm and thus are more energy efficient as compared to conventional regulators. The saving calculations are performed below.
D. Energy Saving Calculations
Average run for each of the ceiling fan = 8 hours / day
Average run days for each of the ceiling fan = 180 days/year
Average power consumption of ceiling fan with conventional regulator assuming that it will run at rpm close to Step – 4
= 69 Watts
Average Power saving with use of electronic regulator at the above speed
= 20 % or 14 watts
Average Power saving with use of electronic regulator with speed at Step – 4 at those ceiling fans where there is no regulator as per the analysis
= =
81 – 55 watts 26 watts
No. of ceilings fans at municipal committee building with conventional regulators
= 48
E. Cost Benefits
Annual Energy Saving Potential = =
48X14X180X8/1000 units 968 Units
Annual Cost Savings @ Rs. 4.15/-unit = Rs. 4,017 /-
Investment = Rs. 7,200 /- @ Rs. 150/- per electronic regulator for
49

48 regulators
Repair and Maintenance Costs @ 10% of investment Rs. 720/-
Other intermittent or recurring cash flows NIL
Net annual saving = Rs. 3,297/-
Simple Payback period = 2.18 years
IRR 44.65%
NPV Rs.10,204/-
Details of Technology/ Specifications Please see annexure
Equipment vendors Please see annexure Table No 19 - Recommendation no 6 for Building
ECM No. 7/B-4 :-
A. Title of Recommendation : Replace all the 4 feet T-8 (40W) & T-12 (36 W) lamps and fixtures with 4 ft T5 (28 W) lamp and fixtures.
B. Description of Existing System and its operation : At many places, 4 feet T-8 & T-12 with magnetic
choke (14 W) are being used.
C. Description of Proposed system and its operation : These should be replaced with 4 feet T-5 tube
fixture of 28 watt having electronic choke.
D. Energy Saving Calculations
Average Energy consumption of a normal 4 feet T-8 & T-12 with magnetic choke
= 52 watts
Energy consumption of a 4 feet T-5 having electronic choke = 28 watts
Energy saving per single tube replacement = 24 watts
Approximate nos. of 4 feet T-8 &T-12 fixtures in use = 22
Average use per day = 8 hrs
No. of working days in a year = 240 days
E. Cost Benefits
Annual Energy Saving Potential = =
24X22X240X8/1000 units 1,014 units
Annual Cost Savings @Rs. 4.15/-per unit = Rs 4,208/-
Investment @ Rs. 500/- per fitting
= Rs. 11,000/- for 22 fittings
50

Repair and Maintenance Costs @ 5% of investment cost Rs. 550/-
Other intermittent or recurring cash flows @
5% of investment Rs. 550/-
Net annual saving = Rs.3,108 /-
Simple Payback period = 3.54 years
IRR = 25.29%
NPV = Rs.5,858/-
Details of Technology / Equipment vendors Please see annexure
Table No. 20:- Recommendation No. 7 for Building
B.4.5 General Comments, Observations and Suggestions
Based on the observations made by the audit team as well as per the discussions held with
municipal council staff, and some vendors during the course of conducting audit, following
suggestions/comments/observations are made to improve the general working conditions as
well as comfort/maintenance/hygiene level at buildings of municipal council. Municipal
Council management is advised to take a note of these for implementation to the extent
possible:
1. Whenever any new/additional electrical load is to be added in the system, it should be
checked whether the existing cable and switch gears can take the extra load.
2. A proper preventive maintenance schedule should be prepared for all the important
equipments and the same should be adhered to.
3. Only electronic chokes should be bought in future.
4. A proper schedule should be maintained for the cleaning of light fittings to improve the
lux levels.
5. Whenever new Tubular Florescent Lights, refrigerators, window/split air conditioners,
water coolers, electric motors, pumps etc are to be purchased; then, only energy efficient
appliances should be bought which have been given highest star (5 star) rating by the
BEE to save energy.
6. Two 100 W filament lamps are in use at buildings of MCN and these are highly
inefficient. These should be replaced with 23 W retrofit CFL. The cost of these CFLs is
also very less and this can be done by the ULB from their own funds.
51

C. Project Financing and Business Models C.1 Background
An Investment Grade Audit (IGA) is the process of conducting a detailed energy audit to
quantify the savings potential, to translate the technical findings into financial terms, to
present it as a bankable DPR capable of securing a loan, to develop the business models for
financing the Mu DSM projects and to make M&V plans.
The effective financing and business models create benefits and incentives for all
stakeholders. The ULB is directly benefited by savings in energy costs. The ESCOs and
technology vendors are benefited in the form of business promotion. The nation is benefited
through energy sustainability and the environmental concerns are also addressed.
As the individual ECMs do not have volume enough to attract ESCOs, the ECMs have to be
bundled, keeping in mind the economical viability and portfolios generally dealt with by
various vendors.
C.2 Notes on Bundling of ECMs and Project Development
As the works related to PF improvement capacitor banks are generally undertaken by pump
vendors or contractors dealing with pumps, it is proposed to bundle ECMs for PFC
capacitors with those for pumps. Similarly the ECMs for replacement of lights in buildings
and automatic controllers of street lights shall be clubbed with the ECM for replacement of
street lights as street light vendors and electrical contractors undertake such works.
Accordingly various ECMs described have been clubbed to result in to following energy
saving projects (ESPs):-
S. No. Project
Energy Savings
(Lakh KWh)
Fin Savings
(Lakh Rs)
Imp. Costs (Lakh Rs)
IRR % SPP (Years)
1 ESP- Street Light & Building
10.69 44.23 97.55 30.29 4
C.3 Project Risk Assessment and Mitigation
Various risks in energy saving projects outlined below need to be deliberated upon before
venturing in to ESPs.
52

Financial Risks
Interest Rates: As the Govt. incentives for energy efficiency (EE) are likely to
increase with time, finance for EE projects is likely to be available at the existing
rates of interest. Thus it is not a major risk.
Energy Prices: The change in energy prices can affect the financial savings. It can
be addressed by freezing the existing prices or applying a suitable formula in all
saving calculations.
Construction costs: The construction costs include material and labour involved for
the project. A steep rise in these costs may make the project unviable. The ULB may
have to address this risk under contract provisions.
M&V costs: These costs depend upon the rigour in M&V activities which need to be
specified as per context and practical considerations like costs as percentage of
annual savings.
Costs due to delay: This can be addressed by inserting suitable clauses on
compensation for the delay and also on escalation charges in the performance
contract.
Costs due to changes: A change in the installation by the users may affect the
savings, though no major change is anticipated. A clause in the performance contract
can address this issue.
Operational Risks Operating Hours: As a change in operating hours can affect the savings scenario, it
is essential that any change in operating hours is avoided. This should be spelt out in
the MV plan and contract documents.
Loads: As the ESPs pertain to pumping and street lighting installations and not
buildings, there is no situation where loads can be changed by users. Hence this risk
is almost non-existent in respect of these projects.
Water Table: The annual fall in water table level can affect the savings and needs to
be documented in the performance contract and the M&V plan. However, practical
considerations need to be kept in mind.
Water Levels: As the changes in water levels in the sumps of sewage installations
are likely to be similar during baseline and reporting periods, there is no significant
effect and no major risk.
Weather: As the ESPs pertain to pumps and street lights only and not buildings, the
changes in weather/climate do not have any significant effect on savings over a long
period.
53

User Participation: As no participation of users is involved in these ESPs, this factor
has no effect.
Resistance from Public: As no ECM in the proposed ESPs has any adverse effect
on the general public or a group of persons, no resistance to these ECMs is
anticipated.
Performance Risks
Equipment performance: The risk associated with equipment performance is
invariably borne by the ESCO who gets an overriding power in the selection of
equipments. The performance contract, therefore, needs to be drafted accordingly
and should contain a clause for ensuring a minimum efficiency of equipments
included in the scope and a clause to deal with a situation in which performance is
below expectation.
Operation & Maintenance: The responsibility for operating the equipments should
be specified in the performance contract. This depends upon the type of equipment
installed. The party operating the equipments shall be responsible for preventive
maintenance also. However, the responsibility for repairs and maintenance is
generally with the ESCO. Suitable clauses need to be incorporated in the
performance contract.
Theft/Damage: Such risks are generally borne by the ULB. Suitable clauses need to
be put in the performance contract to cover all kinds of situations. Insurance covers
can address this risk.
Project Risks Contract Document Development: The ESPs are to be implemented through
ESCO route and the ULB has to take action for drafting of performance contract
documents and for award of the contract to the ESCO who did the IGA or to some
other ESCO. As this involves lot of decision making, support from BEE can be
valuable input to reduce the ULB’s risk.
Supervision of work: The completion of the work in time and as per specifications
requires that the quality and progress be monitored by project authorities of the
ULB.
Contractual Risks The contract clauses for damages for delay/failure can be invoked to address these risks.
54

M&V Risks The M&V plan containing roles/responsibilities of the ULB and the ESCO should be
incorporated in the contract.
C.4 Project Finance and Development of Business Model Fixed fees based turnkey consultancy contracts and saving based performance contracts
are two standard procedures for implementing ESPs. In fixed fees based turnkey
consultancy contract the ULB arranges the project finance either from its own resources or
from financial institutions and enters in to a contract with an energy consultant/ESCO for
turnkey execution of the ESP including design, procurement and commissioning. Though the
consultant gives no guarantee for energy savings and gets fixed fee irrespective of savings,
he bears all technical and equipment performance risk.
In case of savings based performance contracts there are two models. In the first one, called
the guaranteed savings, the finance is arranged by the ULB and certain minimum savings
are guaranteed by the ESCO who makes up the shortfall if the savings are below the
guaranteed savings. This is a preferred model as the cost of finance is low and the savings
are guaranteed. In the second model, called the shared savings, the funds are arranged by
the ESCO and the ULB shares the savings generated by the project. Thus the entire risk is
with the ESCO but the costs of finance and the project are high. The ULB has to decide on
the choice of business model to be followed in implementing the ESPs.
C.5 Project Cost Benefit Analysis Any proposed Business model must have a sound Financial Model, designed to allow for
sensitivity analysis of key project variables & assumptions. A detailed cost benefit analysis
for each project proposal is already mentioned in Table no.
C.6 Monetary Savings / Benefits Savings in energy costs resulting primarily from energy savings are the main monetary
benefits to the ULB. Reduction in operating costs of street lights due to automatic controls is
additional benefit. The reduction in repairs/maintenance expenses because of new pumps
and street lights is also an additional benefit which has not been monetized.
C.7 A. Project Cash Flow and Financial Analysis Since, identified ECMs in Street lighting and Building segments are similar in nature and
hence bundling of ECMs as been done in order to develop projects with sufficient volume of
savings to make the project viable and attractive, to all stakeholders including financers and
ESCO players with sufficient technical expertise to undertake performance contracting and
one Energy Saving Project (ESP) has been made as placed on next page:
Assumptions for working out IRR:-
55

o The IRRs for various ECMs have been worked out for an estimated minimum life cycle of 10 years.
o The IRR for the project has also been worked out for a period of 10 years.
o The costs include all contingent costs.
o The annual savings are based on current energy prices.
o Annual maintenance costs and other cash outflow have been deducted from the annual savings to arrive at net savings and applied in cash flow analysis to arrive at NPV and IRR.
o Discount rate of 12% has been assumed for determining NPV.
Other details about the assumptions made are mentioned in the table as under:
Assumptions Unit Value Tariff Cost
Tariff Rs/kWh 4.76 Tariff Escalation Rate per year Rs/kWh 0.20
Capital Cost Excise Duty % 6% VAT % 12.5% Transportation Cost % 5% Erection Cost % 5%
Interest & Debt Interest Rate % 12% Equity as a % of total costs % 40%
Recurring Cost Corporate Tax % 34% Manpower Cost Escalation % 5% Repair & Maintenance Cost % 10% Repair & Maintenance Cost Escalation % 3% Depreciation Rate % 30% Calibration Cost of M&V Equipment % 2% Escalation in Calibration Cost of M&V Equipment % 2%
ESCO Mode Investment made by ULB % 0% Investment made by ESCO % 100% Savings Shared by ESCO % 80%
ULB Mode Investment made by ESCO % 0% Investment made by ULB % 100% Savings Shared by ULB % 100%
Table -21: Assumptions for IRR calculation
56
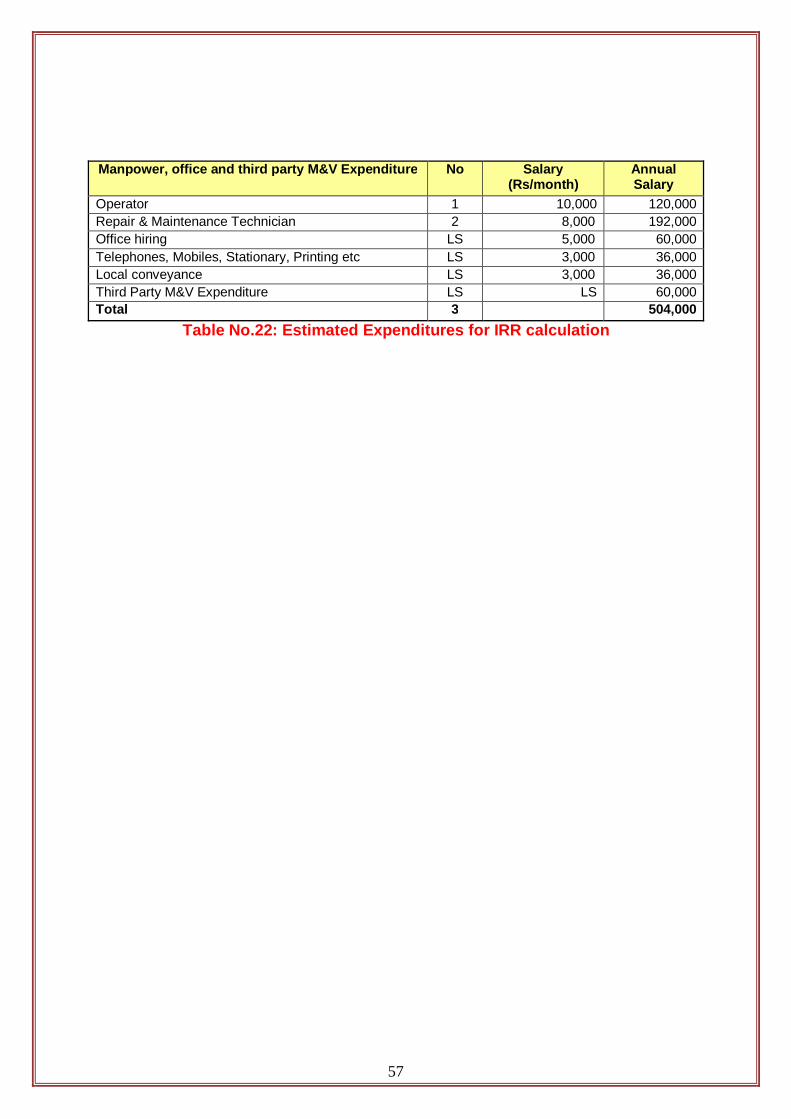
Manpower, office and third party M&V Expenditure No Salary (Rs/month)
Annual Salary
Operator 1 10,000 120,000 Repair & Maintenance Technician 2 8,000 192,000 Office hiring LS 5,000 60,000 Telephones, Mobiles, Stationary, Printing etc LS 3,000 36,000 Local conveyance LS 3,000 36,000 Third Party M&V Expenditure LS LS 60,000 Total 3 504,000
Table No.22: Estimated Expenditures for IRR calculation
57
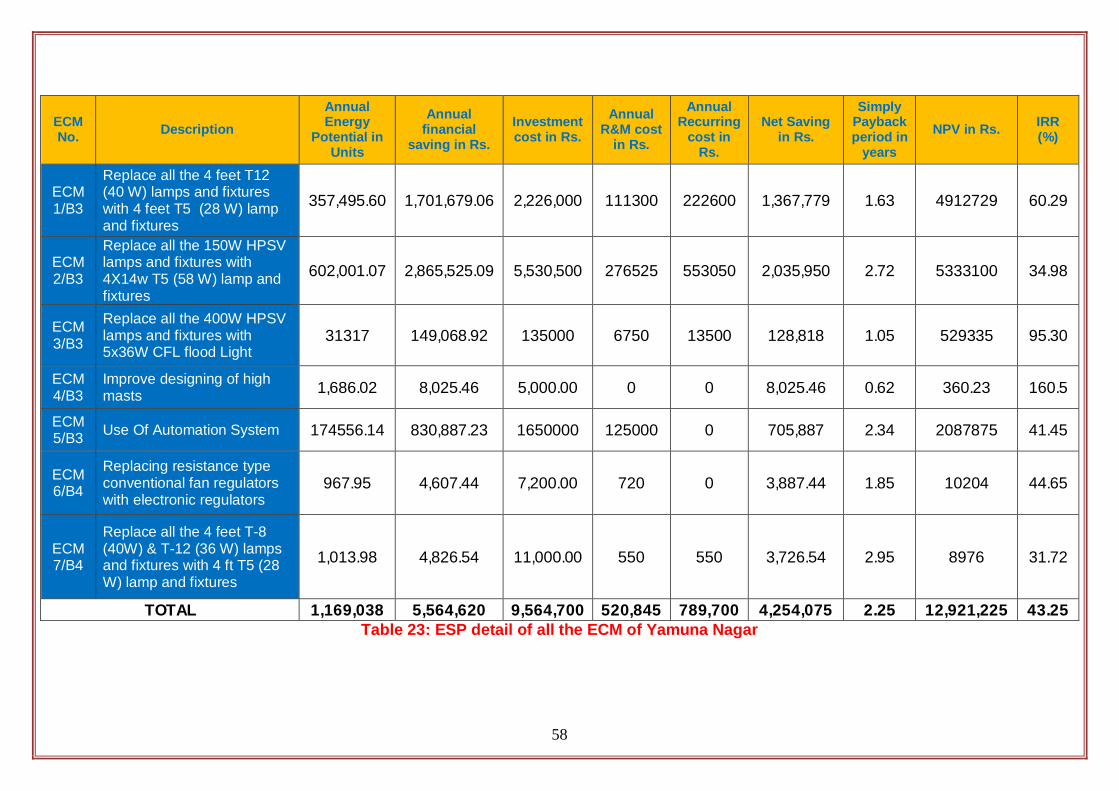
58
ECM No. Description
Annual Energy
Potential in Units
Annual financial
saving in Rs. Investment cost in Rs.
Annual R&M cost
in Rs.
Annual Recurring
cost in Rs.
Net Saving in Rs.
Simply Payback period in
years NPV in Rs. IRR
(%)
ECM 1/B3
Replace all the 4 feet T12 (40 W) lamps and fixtures with 4 feet T5 (28 W) lamp and fixtures
357,495.60 1,701,679.06 2,226,000 111300 222600 1,367,779 1.63 4912729 60.29
ECM 2/B3
Replace all the 150W HPSV lamps and fixtures with 4X14w T5 (58 W) lamp and fixtures
602,001.07 2,865,525.09 5,530,500 276525 553050 2,035,950 2.72 5333100 34.98
ECM 3/B3
Replace all the 400W HPSV lamps and fixtures with 5x36W CFL flood Light
31317 149,068.92 135000 6750 13500 128,818 1.05 529335 95.30
ECM 4/B3
Improve designing of high masts 1,686.02 8,025.46 5,000.00 0 0 8,025.46 0.62 360.23 160.5
ECM 5/B3 Use Of Automation System 174556.14 830,887.23 1650000 125000 0 705,887 2.34 2087875 41.45
ECM 6/B4
Replacing resistance type conventional fan regulators with electronic regulators
967.95 4,607.44 7,200.00 720 0 3,887.44 1.85 10204 44.65
ECM 7/B4
Replace all the 4 feet T-8 (40W) & T-12 (36 W) lamps and fixtures with 4 ft T5 (28 W) lamp and fixtures
1,013.98 4,826.54 11,000.00 550 550 3,726.54 2.95 8976 31.72
TOTAL 1,169,038 5,564,620 9,564,700 520,845 789,700 4,254,075 2.25 12,921,225 43.25 Table 23: ESP detail of all the ECM of Yamuna Nagar

ESP for STREETLIGHT & BUILDING
Parameters Unit Value No. of Equipment / Retrofit No 9,564,700
No. of M&V Equipment No 394,149
Parameters Unit Value Bare cost of Equipment/Retrofit Rs 7,275,023
Excise Duty Rs 436,501 Vat Rs 963,941
Transportation Cost Rs 433,773 Erection Cost Rs 455,462
Total Capital Cost Rs 9,564,700
Parameters Unit Value Bare cost of M&V Equipment Rs 300,000
Excise Duty Rs 18,000 Vat Rs 39,750
Transportation Cost Rs 17,888 Erection Cost Rs 18,782
Total Capital Cost Rs 394,419
Parameters Unit Value Annual kWh Saving kWh/annum 1,169,038
Table No. 24 Input Values of ESP of Yamuna Nagar
59
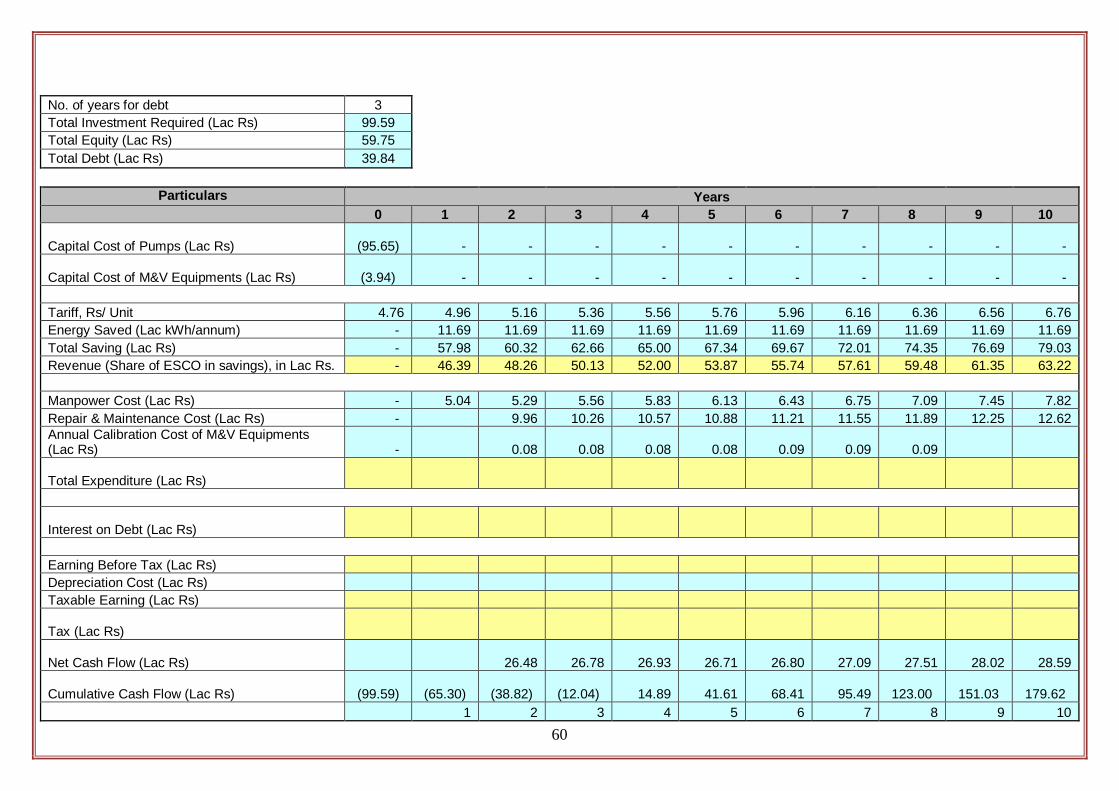
60
No. of years for debt 3 Total Investment Required (Lac Rs) 99.59 Total Equity (Lac Rs) 59.75 Total Debt (Lac Rs) 39.84
Particulars Years 0 1 2 3 4 5 6 7 8 9 10
Capital Cost of Pumps (Lac Rs)
(95.65) - - - - - - - - - -
Capital Cost of M&V Equipments (Lac Rs)
(3.94) - - - - - - - - - -
Tariff, Rs/ Unit 4.76 4.96 5.16 5.36 5.56 5.76 5.96 6.16 6.36 6.56 6.76 Energy Saved (Lac kWh/annum) - 11.69 11.69 11.69 11.69 11.69 11.69 11.69 11.69 11.69 11.69 Total Saving (Lac Rs) - 57.98 60.32 62.66 65.00 67.34 69.67 72.01 74.35 76.69 79.03 Revenue (Share of ESCO in savings), in Lac Rs. - 46.39 48.26 50.13 52.00 53.87 55.74 57.61 59.48 61.35 63.22
Manpower Cost (Lac Rs) - 5.04 5.29 5.56 5.83 6.13 6.43 6.75 7.09 7.45 7.82 Repair & Maintenance Cost (Lac Rs) - 9.96 10.26 10.57 10.88 11.21 11.55 11.89 12.25 12.62 Annual Calibration Cost of M&V Equipments (Lac Rs) - 0.08 0.08 0.08 0.08 0.09 0.09 0.09
Total Expenditure (Lac Rs) -
Interest on Debt (Lac Rs) - - - - - - - -
Earning Before Tax (Lac Rs) -Depreciation Cost (Lac Rs) -Taxable Earning (Lac Rs) -
Tax (Lac Rs) -
Net Cash Flow (Lac Rs)
Cumulative Cash Flow (Lac Rs)
0.09 0.09
(5.04)
(15.33)
(15.89)
(16.48)
(17.09)
(17.73)
(18.39)
(19.07)
(19.79)
(20.53)
(4.78)
(3.59)
(1.20)
36.57 29.34 33.04 35.52 36.78 38.01 39.22 40.41 41.57 42.69 29.88 20.91 14.64 10.25 7.17 5.02 3.52 2.46 1.72 1.21
6.69 8.43 18.40 25.27 29.60 32.99 35.71 37.95 39.84 41.49
(2.27)
(2.86)
(6.25)
(8.59)
(10.06)
(11.21)
(12.14)
(12.90)
(13.54)
(14.10)
(99.59)
34.29 26.48 26.78 26.93 26.71 26.80 27.09 27.51 28.02 28.59
(99.59)
(65.30)
(38.82)
(12.04)
14.89 41.61 68.41 95.49 123.00
151.03
179.62
1 2 3 4 5 6 7 8 9 10

61
Project IRR 25.83% Payback in Years 4
Debt Calculations Particulars Years
1 2 3 4 5 6 7 8 9 10 Debt (Lac Rs) 39.84 39.84 19.92 0.00 0.00 0.00 0.00 0.00 0.00 0.00 Repayments (Lac Rs) 0.00 19.92 19.92 0.00 0.00 0.00 0.00 0.00 0.00 0.00 Closing Debt (Lac Rs) 39.84 19.92 0.00 0.00 0.00 0.00 0.00 0.00 0.00 0.00 Average Debt (Lac Rs) 39.84 29.88 9.96 0.00 0.00 0.00 0.00 0.00 0.00 0.00 Interest Cost (Lac Rs) 4.78 3.59 1.20 0.00 0.00 0.00 0.00 0.00 0.00 0.00
Table No.25 : ESP for ESCO Mode
No. of years for debt 8 Total Investment Required (Lac Rs) 99.59 Total Equity (Lac Rs) 59.75 Total Debt (Lac Rs) 39.84
Particulars Years 0 1 2 3 4 5 6 7 8 9 10
Capital Cost of Pumps (Lac Rs) (95.65) Capital Cost of M&V Equipments (Lac Rs) Tariff, Rs/ Unit Energy Saved (Lac kWh/annum) Total Saving (Lac Rs) Revenue (Share of ESCO in savings), in Lac Rs.
Manpower Cost (Lac Rs)
Repair & Maintenance Cost (Lac Rs)
Annual Calibration Cost of M&V Equipments (Lac Rs)
(3.94)
4.76 4.96 5.16 5.36 5.56 5.76 5.96 6.16 6.36 6.56 6.76 1.69 11.69 11.69 11.69 11.69 11.69 11.69 11.69 1.69 11.69
57.98 60.32 62.66 65.00 67.34 69.67 72.01 74.35 76.69 79.03
57.98 60.32 62.66 65.00 67.34 69.67 72.01 74.35 76.69 79.03
5.04
5.29
5.56
5.83
6.13
6.43
6.75
7.09
7.45
7.82
9.96
10.26
10.57
10.88
11.21
11.55
11.89
12.25
12.62
0.08
0.08
0.08
0.08
0.09
0.09
0.09
0.09
0.09

Total Expenditure (Lac Rs) (5.04) (15.33) (15.89) (16.48) (17.09) (17.73) (18.39) (19.07) (19.79) (20.53)
Interest on Debt (Lac Rs) (4.78) (4.44) (3.76) (3.07) (2.39) (1.71) (1.02) (0.34) - -
Earning Before Tax (Lac Rs) 48.16 40.55 43.01 45.44 47.85 50.24 52.60 54.94 56.90 58.50
Depreciation Cost (Lac Rs) 29.88 20.91 14.64 10.25 7.17 5.02 3.52 2.46 1.72 1.21
Taxable Earning (Lac Rs) 18.29 19.64 28.37 35.20 40.68 45.22 49.09 52.48 55.18 57.29 Tax (Lac Rs) - - - - - - - - - -
Net Cash Flow (Lac Rs) (99.59) 48.16 40.55 43.01 45.44 47.85 50.24 52.60 54.94 56.90 58.50
Cumulative Cash Flow (Lac Rs) (99.59) (51.43) (10.87) 32.14 77.58 125.43 175.67 228.28 283.21 340.12 398.62
1 2 3 4 5 6 7 8 9 10
Project IRR 45.15%
Payback in Years 3
Debt Calculations
Particulars Years 1 2 3 4 5 6 7 8 9 10
Debt (Lac Rs) 39.84 39.84 34.15 28.45 22.76 17.07 11.38 5.69 0.00 0.00 Repayments (Lac Rs) 0.00 5.69 5.69 5.69 5.69 5.69 5.69 5.69 0.00 0.00 Closing Debt (Lac Rs) 39.84 34.15 28.45 22.76 17.07 11.38 5.69 0.00 0.00 0.00 Average Debt (Lac Rs) 39.84 36.99 31.30 25.61 19.92 14.23 8.54 2.85 0.00 0.00 Interest Cost (Lac Rs) 4.78 4.44 3.76 3.07 2.39 1.71 1.02 0.34 0.00 0.00
Table No. 26 : For ULB Mode
62

C.7 B. Project Cash Flow and Financial Analysis for Option II on LED for street Lighting As per instructions received from BEE, one more option has been considered with use of LED
in street lighting wherever feasible and accordingly, its casj flow and financial analysis are
mentioned below:
Assumptions Unit Value Tariff Cost
Tariff Rs/kWh 4.76 Tariff Escalation Rate per year Rs/kWh 0.20
Capital Cost Excise Duty % 4% VAT % 12.5% Transportation Cost % 2% Erection Cost % 1%
Interest & Debt Interest Rate % 12% Equity as a % of total costs % 60%
Recurring Cost Corporate Tax % 34% Manpower Cost Escalation % 5% Repair & Maintenance Cost % 5% Repair & Maintenance Cost Escalation % 3% Depreciation Rate % 30% Calibration Cost of M&V Equipment % 2% Escalation in Calibration Cost of M&V Equipment % 2%
ESCO Mode Investment made by ULB % 0% Investment made by ESCO % 100% Savings Shared by ESCO % 95%
ULB Mode Investment made by ESCO % 0% Investment made by ULB % 100% Savings Shared by ULB % 100% Table no. 27- Assumption table of ESP of Yamuna Nagar (option-II)
Manpower, office and third party M&V Expenditure No Salary (Rs/month)
Annual Salary
Operator 1 10,000 1,20,000 Repair & Maintenance Technician 2 8,000 1,92,000 Office hiring LS 5,000 60,000 Telephones, Mobiles, Stationary, Printing etc LS 3,000 36,000 Local conveyance LS 3,000 36,000 Third Party M&V Expenditure LS LS 60,000 Total 3 5,04,000
Table no. 28 - Estimated expenditures for IRR calculation (option-II)
63

Parameters Unit Value No. of Equipment / Retrofit No 2,90,32,500 No. of M&V Equipment No 3,59,828
Parameters Unit Value Bare cost of Equipment/Retrofit Rs 2,42,05,338 Excise Duty Rs 9,93,226 Vat Rs 32,27,983 Transportation Cost Rs 4,35,778 Erection Cost Rs 2,94,876 Total Capital Cost Rs 2,90,32,500
Parameters Unit Value Bare cost of M&V Equipment Rs 3,00,000 Excise Duty Rs 12,000 Vat Rs 39,000 Transportation Cost Rs 5,265 Erection Cost Rs 3,563 Total Capital Cost Rs 3,59,828
Parameters Unit Value Annual kWh Saving kWh/annum 14,57,935
Table no. 29- Input values of ESP of Yamuna Nagar (option-II)
64

65
Table no. 30 – ESP details of all the ECMs for Option II on LED for street Lighting
ECM No. Description
Annual Energy Saving
Potential in Units
Annual financial saving in
Rs.
Investment cost in Rs.
Annual R&M cost
in Rs.
Annual Recurring
cost in Rs.
Net Saving in Rs.
Simply Payback period
in years NPV in Rs. IRR (%)
ECM 1/B3 (Option II)
Replace all the 4 feet T12 (40 W) lamps and fixtures with 16W LED Tube light
5,66,035 26,94,327 83,47,500 417375 0 22,76,952 3.67 4033738 24.14
ECM 2/B3 (Option II)
Replace all the 150W HPSV lamps and fixtures with 60W LED street light
5,42,788 25,83,671 1,84,35,000 921750 0 16,61,921 11.09 -8075693 -1.84
ECM 5/B3 (Option II)
Use of automation and voltage stabilizer with GSM based control system for street lighting
3,49,112 16,61,773 2250000 210000 250000 12,01,773 1.87 4053826 52.63
TOTAL 14,57,935 69,39,771 2,90,32,500 15,49,125 2,50,000 51,40,646

66
Table no. 31 – ESCO mode
No. of years for debt 3
Total Investment Required (Lac Rs) 293.92
Total Equity (Lac Rs) 176.35
Total Debt (Lac Rs) 117.57
Particulars Years
0 1 2 3 4 5 6 7 8 9 10
Capital Cost in SL (Lac Rs)
(290.32) - - - - - - - - - -
Capital Cost of M&V Equipments (Lac Rs)
(3.60) - - - - - - - - - -
Tariff, Rs/ Unit 4.76 4.96 5.16 5.36 5.56
5.76
5.96
6.16
6.36
6.56
6.76
Energy Saved (Lac kWh/annum) - 14.58 14.58 14.58 14.58
14.58
14.58
14.58
14.58
14.58
14.58
Total Saving (Lac Rs) - 72.31 75.23 78.15 81.06
83.98
86.89
89.81 92.72 95.64 98.56 Revenue (Share of ESCO in savings), in Lac Rs. -
Manpower Cost (Lac Rs) -
Repair & Maintenance Cost (Lac Rs) -Annual Calibration Cost of M&V Equipments (Lac Rs) -
Total Expenditure (Lac Rs) -
Interest on Debt (Lac Rs) - - - - - - - -
68.70 71.47 74.24 77.01 79.78
82.55
85.32
88.09
90.86
93.63
5.04 5.29 5.56 5.83 6.13
6.43
6.75
7.09
7.45
7.82
14.70 15.14 15.59 16.06
16.54
17.04
17.55
18.07
18.62
0.07 0.07 0.07 0.08
0.08
0.08
0.08
0.08
0.08
(5.04)
(20.06)
(20.77)
(21.50)
(22.26)
(23.05)
(23.87)
(24.72)
(25.60)
(26.52)
(14.11)
(10.58)
(3.53)

67
Earnings Before Tax (Lac Rs) - 49.55 40.83 49.94 55.51
57.52
59.50
61.45
63.37
65.26
67.11
Depreciation Cost (Lac Rs) - 88.18 61.72 43.21 30.24
21.17
14.82
10.37
7.26
5.08
3.56
Taxable Earning (Lac Rs) -
(38.63)
(20.90) 6.74 25.26
36.35
44.68
51.07
56.11
60.17
63.55
Tax (Lac Rs) - - -
(2.29)
(8.59)
(12.35)
(15.19)
(17.36)
(19.07)
(20.45)
(21.60)
Net Cash Flow (Lac Rs)
(293.92) 49.55 40.83 47.65 46.92
45.16
44.31
44.09
44.30
Cumulative Cash Flow (Lac Rs)
Project IRR Payback in Years
Debt (Lac Rs) 117.57 117.57 58.78 0.00 0.00 0.00 0.00 0.00 0.00 0.00 Repayments (Lac Rs) 0.00 58.78 58.78 0.00 0.00 0.00 0.00 0.00 0.00 0.00 Closing Debt (Lac Rs) 117.57 58.78 0.00 0.00 0.00 0.00 0.00 0.00 0.00 0.00 Average Debt (Lac Rs) 117.57 88.18 29.39 0.00 0.00 0.00 0.00 0.00 0.00 0.00 Interest Cost (Lac Rs) 14.11 10.58 3.53 0.00 0.00 0.00 0.00 0.00 0.00 0.00
44.80 45.51
(293.92) (244.37) (203.55) (155.89) (108.97) (63.81) (19.50) 24.59
68.89
113.69
159.20
1 2 3 4 5 6
7
8
9
10
8.84%
7
Debt Calculations Particulars Years
1 2 3 4 5 6 7 8 9 10

Table no. 32 – ULB mode
No. of years for debt 8
Total Investment Required (Lac Rs) 293.92
Total Equity (Lac Rs) 176.35
Total Debt (Lac Rs) 117.57
Particulars Years 0 1 2 3 4 5 6 7 8 9 10
Capital Cost of Pumps (Lac Rs) (290.32)
Capital Cost of M&V Equipments (Lac Rs) (3.60)
Tariff, Rs/ Unit 4.76 4.96 5.16 5.36 5.56 5.76 5.96 6.16 6.36 6.56 6.76
Energy Saved (Lac kWh/annum) 14.58 14.58 14.58 14.58 14.58 14.58 14.58 14.58 14.58 14.58
Total Saving (Lac Rs) 72.31 75.23 78.15 81.06 83.98 86.89 89.81 92.72 95.64 98.56
Revenue (Share of ESCO in savings), in Lac Rs. 72.31 75.23 78.15 81.06 83.98 86.89 89.81 92.72 95.64 98.56
Manpower Cost (Lac Rs) 5.04 5.29 5.56 5.83 6.13 6.43 6.75 7.09 7.45 7.82
Repair & Maintenance Cost (Lac Rs) 14.70 15.14 15.59 16.06 16.54 17.04 17.55 18.07 18.62 Annual Calibration Cost of M&V Equipments (Lac Rs) 0.07 0.07 0.07 0.08 0.08 0.08 0.08 0.08 0.08
Total Expenditure (Lac Rs) (5.04) (20.06) (20.77) (21.50) (22.26) (23.05) (23.87) (24.72) (25.60) (26.52)
Interest on Debt (Lac Rs) (14.11) (13.10) (11.09) (9.07) (7.05) (5.04) (3.02) (1.01) - -
68

Earning Before Tax (Lac Rs) 53.17 42.07 46.29 50.49 54.66 58.80 62.92 67.00 70.04 72.04
Depreciation Cost (Lac Rs) 88.18 61.72 43.21 30.24 21.17 14.82 10.37 7.26 5.08 3.56
Taxable Earning (Lac Rs) (35.01) (19.66) 3.09 20.25 33.49 43.98 52.54 59.73 64.95 68.48 Tax (Lac Rs) - - - - - - - - - -
Net Cash Flow (Lac Rs) (293.92) 53.17 42.07 46.29 50.49 54.66 58.80 62.92 67.00 70.04 72.04
Cumulative Cash Flow (Lac Rs) (293.92) (240.76) (198.69) (152.40) (101.91) (47.24) 11.56 74.47 141.47 211.51 283.54
1 2 3 4 5 6 7 8 9 10
Project IRR 13.27%
Payback in Years 6
Debt Calculations Particulars Years
1 2 3 4 5 6 7 8 9 10 Debt (Lac Rs) 117.57 117.57 100.77 83.98 67.18 50.39 33.59 16.80 0.00 0.00 Repayments (Lac Rs) 0.00 16.80 16.80 16.80 16.80 16.80 16.80 16.80 0.00 0.00 Closing Debt (Lac Rs) 117.57 100.77 83.98 67.18 50.39 33.59 16.80 0.00 0.00 0.00 Average Debt (Lac Rs) 117.57 109.17 92.38 75.58 58.78 41.99 25.19 8.40 0.00 0.00 Interest Cost (Lac Rs) 14.11 13.10 11.09 9.07 7.05 5.04 3.02 1.01 0.00 0.00
69
D. Measurement & Verification Protocol, Stakeholder Roles & Responsibilities D.1 M & V Plan An IPMVP compliant M&V plan for each of the ECMs is mentioned below. ECMs which are of similar nature have been clubbed together to avoid the repetition. All relevant topics including baseline energy, independent variables, interactive effects, static factors etc have been covered in each plan and cross references have been provided wherever required to give references.
All M&V plans mentioned on subsequent pages are IPMVP adherent since:
(i) The person responsible for approving the M&V Plan and for making sure that the M&V Plan is followed for the duration of the reporting period has been identified and he is Executive Officer of the ULB.
(ii) M&V Plans have been developed which:
clearly state the version number of the IPMVP edition and Volume being followed,
use terminology consistent with the definitions in the version of IPMVP cited,
include all information mentioned in the M&V Plan,
will be approved by all parties interested in adherence with IPMVP, and
is consistent with the Principles of M&V
(iii) These will be followed during the contract period.
(iv) M&V reports will be prepared as per the requirement of IPMVP
70

ECM No. 1 to ECM No. 3 and ECM No. 7:- Replacement of energy inefficient lighting with energy efficient lighting.
Description
ECM No.1/B-3 – Replace all the 4 feet T12 (40 W) lamps and fixtures with 4 foot T5 (28 W) lamp and fixtures ECM No 2/B-3 – Replace all the 150W HPSV lamps and 125 W MV lamps with 4X14W T5 (60 W) lamp and fixtures ECM No.3/B-3 – Replace all the 400 W HPSV lamps and fixtures with 5 x 36 W CFL lamp and fixtures ECM no. 7/B-4 – Replace all the 4 feet T12 (40/36 W) lamps and fixtures with 4 ft T5 (28 W) lamp and fixtures
ECM Intent These ECM aim to reduce energy consumption and thereby reducing energy costs by replacing lights with high efficacy lights.
Commissioning Procedure to verify successful implementation of ECM
Inspection and testing of installed light along with measurement of power and lux levels (9 point method for street lights and 12 point measurement for high masts where lux levels at three circles, viz. inner circle, middle circle and outer circle are taken by properly covering entire circular area covered by high mast at 90° apart).
Selected IPMVP Option (IPMVP Volume I EVO 10000-1:2009)
Retrofit Isolation: Key Parameter Measurement Option B of IPMVP Volume I (EVO 10000-1:2009) shall be used to determine savings from the engineering calculation of baseline and reporting period from short term or continuous measurement of key operating parameters and estimated values of other parameters. Here, routine and non-routine adjustments will be made as required. The parameters to be measured are power consumed by fixtures and operating hours. A suitable sampling based measurement method would be finalized prior to signing of performance contract.
Measurement Boundary
Key parameter (power) and operating hours are determined based on measurements in isolation for the retrofit, i.e. for the entire quantity of streetlights being replaced. Thus the measurement boundary encompasses the entire quantity of streetlights which are being replaced
Static Factor
There are two static factors: 1. No. of lamps for each type. It has agreed that it will be
responsibility of ULB to inform ESCO about any increase or decrease in no. of lamps in any category and the date of such increase/decrease will be considered for calculating savings.
2. Availability of power for the entire street light duration. Since, it is neither in control of ULB nor in the control of ESCO and this will greatly affect the energy savings and thereby affect the viability of these ECMs. Hence, this shall be assumed that power is available throughout the street light operational hours even if it is not.
Interactive Effect
There is no interactive effect for these ECMs. Not even for ECM nos. 7 as there are no air conditioners in the buildings where energy efficient lights will be retrofitted and will generate less heat as compared with old lights.
Independent Variable
Voltage is independent variable as it affects the power consumption substantially. Thus, voltage will also be measured while measuring the power consumption in base line as well as reporting period.
71

Baseline: Period, Energy and Conditions
Period just before retrofitting the lights will be the baseline period and power consumption along with voltage will be measured on the required sample size.
Reporting Period The reporting period for this ECM shall be equal to the payback period or performance contract period whichever is longer.
Basis for Adjustment
Voltage at the time of measuring power consumption will be taken into account for adjustment while taking power measurement for existing as well as retrofit light fitting. Any non-routine adjustment corresponding to change in the inventory of installed fixtures during the reporting period will also be made. The method of making the adjustments would be clearly defined and referenced in the performance contract. Similarly, the burnt out percentage will be found out as per agreed frequency in the reporting period and its annual average shall be considered while making energy saving calculations for each category of lamps.
Analysis Procedure
The saving analysis shall be based upon before and after installation energy measurement. The frequency for taking such measurements will be every quarter and the measurement noted will be applicable for next three months period. Operating hours will be the time set at timers each month for reporting period.
Energy Prices
The tariff schedule as applicable from time to time shall be applied for determining energy cost. The entire tariff schedule shall be applied rather than using marginal energy cost if it is found feasible to reduce contract demand after implementing these ECMs.
Budget It would be Rs. 40,000/- for the entire contract period and has been included in the project implementation cost.
Resource Requirements Calibrated instruments like Power Analyzer, lux meter along with qualified engineers and technicians.
Specifications of Metering & Monitoring Devices
Power Analyzer & Lux meter of reputed make having proper calibration certificates with 1% accuracy will be used.
Monitoring Responsibilities
This will be joint responsibility of ULB and ESCO for determining the savings from the measured data before and after implementation of ECM in the presence of third party representative.
Expected accuracy All measuring instrument should be of accuracy class 1.0 or better. At least 90% accuracy is expected in the overall analysis
Reporting Formats The format for reporting savings shall include all data including actual energy consumption, voltage, tariff schedules as per existing tariff, estimated operating hours and computed savings.
Quality assurance Measurements will be taken jointly to have transparency in the system.
72

ECM No. 5 :- Use of Automation for street lighting
Description Presently, all street lights are being switched ON & switched OFF manually.
ECM Intent
The ECM aims to reduce energy consumption and costs by installing control panels for automation of entire street lighting. These panels will have timer based controls so there will be auto switching for entire street light. Energy saving will come from reduction in operation hours as compared to manual operation.
Commissioning Procedure to verify successful implementation of ECM
Inspection and testing of installed panels to see that lighting gets switched ON & OFF automatically as per set time at timers.
Selected IPMVP Option (IPMVP Volume I EVO 10000-1:2009)
Retrofit Isolation: Key Parameter Measurement Option A of IPMVP Volume I (EVO 10000-1:2009) shall be used to determine savings from the engineering calculation of baseline and reporting period from short term or continuous measurement of key operating parameters and estimated values. Here, routine and non-routine adjustments will be made as required. Key parameters to be measured are power for base line period and operational hours for reporting period. The parameter to be estimated is operational hours for baseline period for each month of the complete baseline period of one year.
Measurement Boundary
Since key parameters are determined in isolation for the given control panel and entire lights and hence measurement boundary is the control panels being installed and entire lights whether they are retrofitted or not as power saving will be calculated for entire street lights .
Static Factor
There are two static factors: 1. No. of lamps for each type. It has agreed that it will be
responsibility of ULB to inform ESCO about any increase or decrease in no. of lamps in any category and the date of such increase/decrease will be considered for calculating savings.
2. Availability of power for the entire street light duration. Since, it is neither in control of ULB nor in the control of ESCO and this will greatly affect the energy savings and thereby affect the viability of these ECMs. Hence, this shall be assumed that power is available throughout the street light operational hours even if it is not.
Interactive Effect There is no interactive effect for this ECM.
Independent Variable Voltage is independent variable as it affects the power consumption substantially. Thus, voltage will also be measured while measuring the power consumption in base line period.
Baseline: Period, Energy and Conditions
Operational hours for which lights remained ON just before retrofitting the lights will be measured and shall be considered for that month. Average time for which lights used to remain ON for remaining 11 months will be estimated after talking to operators and people living around street lighting.
Reporting Period
The reporting period for this ECM shall be equal to the payback period or performance contract period whichever is longer. Frequency of measurement will be once just before retrofitting the lights for base line period, every fortnight for finding out burnt out in reporting period.
Basis for Adjustment Voltage prevailing during baseline period (just before retrofitting) will be measured and power consumption adjusted accordingly. Similarly, burnt out percentage for reporting period shall also be
73

considered while calculating energy savings.
Analysis Procedure
The saving analysis shall be based on time period before and after installation of control panel. Engineering calculations will be done to calculate on total load on each control panel and thus can be done with the help of measurement taken for baseline measurements for first five ECM on retrofitting light fittings. The only parameter to be measured is operating hours and it would be taken as per the time set at the timers of each panel which is varied each month. The power measurement will be considered for the baseline period and the burn out will be considered prevailing for the reporting period for each category of lamps.
Energy Prices
The tariff schedule as applicable from time to time shall be applied for determining energy cost. The entire tariff schedule shall be applied rather than using marginal energy cost if it is found feasible to reduce contract demand after implementing these ECMs from 5 to 9.
Budget It would be Rs. 25,000/- for the entire contract period and has been included in the project implementation cost.
Resource Requirements Only qualified engineers will be required to see the performance of auto timers.
Specifications of Metering & Monitoring Devices
The timers installed at automation panels will be sealed and made tamper proof. The accuracy of these timers shall be +/- 5 minutes from the set time.
Monitoring Responsibilities
This will be joint responsibility of ULB and ESCO for determining the savings from the measured data before and after implementation of ECM in the presence of third party representative.
Expected accuracy All measuring instrument should be of accuracy class 1.0 or better. At least 90% accuracy is expected in the overall analysis
Reporting Formats The format for reporting savings shall include all data including actual energy consumption, voltage, tariff schedules as per existing tariff, estimated operating hours and computed savings.
Quality assurance Measurements will be taken jointly to have transparency in the system.
74

ECM No. 4:- Improve designing of high masts
Description There are 5 high masts at Yamuna Nagar but most of them are poorly designed as (i) More directions have been covered than required, (ii) street light poles are there where high mast light is reaching, (iii) Angle of fittings is not okay and (iv) somewhere there is more light than required.
ECM Intent The ECM aims to reduce energy consumption and costs by designing each high mast as per the need of its site. Accordingly, all the high masts will be modified to suit the actual needs.
Commissioning Procedure to verify successful implementation of ECM
Inspection and testing of installed light fixtures
Selected IPMVP Option (IPMVP Volume I EVO 10000-1:2009)
Retrofit Isolation: Key Parameter Measurement Option A of IPMVP Volume I (EVO 10000-1:2009) shall be used to determine savings from the engineering calculation of baseline and reporting period from short term or continuous measurement of key operating parameters and estimated values. Here, routine and non-routine adjustments as required.
Measurement Boundary Since key parameters are determined in isolation for the given equipment and for the given time and hence measurement boundary is not applicable.
Baseline: Period, Energy and Conditions
As there is no historic data hence baseline will be before and after installation energy measurement.
Reporting Period The reporting period for this ECM shall be equal to the payback period. Basis for Adjustment As required.
Analysis Procedure The saving analysis shall be based upon before and after installation energy measurement.
Energy Prices The existing tariff schedule shall be made applicable for the reporting period.
Budget Included in the project implementation cost.
Resource Requirements Instruments like Energy meter, lux meter along with qualified engineers. Specifications of Metering & Monitoring Devices
Energy meter & Lux meter of reputed make having proper calibration certificates
Monitoring Responsibilities
This will be joint responsibility of ULB and ESCO for determining the savings from the measured data before and after implementation of ECM in the presence of third party representative.
Expected accuracy All measuring instrument should have class 1.0 accuracy. At least 90% accuracy is expected in the overall analysis
Reporting Formats The format for reporting savings shall include all data including actual energy consumption, minimum billable consumption, tariff schedules as per existing tariff and computed savings.
Quality assurance Only approved make/ISI marked products will be purchased and key quality parameters will be checked for a few samples before installation.
75

ECM No. 6:- Replacing resistance type conventional fan regulators with electronic regulators
Description
At most of the ceiling fans installed at MCS conventional (resistance) type regulators have been used. Resistance type regulators are not energy efficient since rpm of fan is reduced by reducing voltage through resistances of varying length, which is an energy inefficient method to do so.
ECM Intent
The ECM aims to reduce energy consumption and costs by installing electronic regulators. Electronic regulators do not use the above principle for controlling rpm and thus are more energy efficient as compared to conventional regulators.
Commissioning Procedure to verify successful implementation of ECM
Inspection and testing of installed electronic regulators
Selected IPMVP Option (IPMVP Volume I EVO 10000-1:2009)
Retrofit Isolation: Key Parameter Measurement Option A of IPMVP Volume I (EVO 10000-1:2009) shall be used to determine savings from the engineering calculation of baseline and reporting period from short term or continuous measurement of key operating parameters and estimated values. Here, routine and non-routine adjustments as required. Power consumption of individual fans would be measured being the key parameter. The operating hours will be estimated. The step at which fan is normally operated on yearly basis will also be estimated. An adequate sampling plan for measurement of wattage would be developed and agreed upon prior to signing of performance contract depending upon the confidence level and precision required.
Measurement Boundary Since key parameters are determined in isolation for the given fan regulators and hence measurement boundary is the ceiling fan on which regulator is being replaced.
Static Factor
There are several static factors: 1. No. of fans having conventional regulators. It has agreed that
it will be responsibility of ULB to inform ESCO about any increase or decrease in no. of fans with conventional regulators and the date of such increase/decrease will be considered for calculating savings.
2. Availability of power for the entire operational duration. Since, it is neither in control of ULB nor in the control of ESCO and this will greatly affect the energy savings and thereby affect the viability of this ECM. Hence, this shall be assumed that power is available throughout the operational hours even if it is not.
3. No. of working days in the whole year and no. of working hours for a working day. It has agreed that it will be responsibility of ULB to inform ESCO about any change in no. of working days in a year and no. of working hours per day and date of such a change will be considered for calculating savings.
Interactive Effect There is no interactive effect for this ECM since there are no air conditioners in the buildings where these fan regulators are installed.
Independent Variable
Voltage is independent variable as it affects the power consumption substantially. However, since power will be measured just before and after retrofitting and will be completed within a very short span and therefore, it is assumed that voltage will be the same in baseline as well as reporting period. Similarly, frequency is another independent variable which will affect the rpm of fan and we are measuring power consumption in
76

baseline and reporting conditions on the same rpm. However, since rpm will be measured just before and after retrofitting and will be completed within a very short span and therefore, here also it can be assumed that frequency will be the same while measuring rpm in baseline as well as reporting period.
Baseline: Period, Energy and Conditions
Baseline period will be just before implementation of ECM. Energy consumption and voltage will be measured just before the implementation of ECM as per agreed sampling plan and estimated operating hours.
Reporting Period The reporting period for this ECM shall be equal to the payback period or contract period whichever is longer. Frequency of measurement will be yearly.
Basis for Adjustment Voltage at the time of measuring power consumption will be taken into account for adjustment while taking power measurement for existing as well as retrofit electronic regulator.
Analysis Procedure
The speeds at all steps of a conventional regulator along with power measurements will taken using a distance (infra red based) tachometer. Now the conventional regulator will be replaced with stepless electronic regulator and power measurements will be taken on the fan speeds as noted during baseline tests. The difference between the two will be saving in power. The saving analysis shall be based upon before and after installation energy measurement. The frequency for taking such measurements will be annual and the measurement noted will be applicable for the complete year. Operating hours will be estimated after talking to staff working in those rooms and shall be assumed same for baseline as well as reporting period.
Energy Prices
The tariff schedule as applicable from time to time shall be applied for determining energy cost. The entire tariff schedule shall be applied rather than using marginal energy cost if it is found feasible to reduce contract demand after implementing various ECMs.
Budget It would be Rs. 10,000/- for the entire contract period and has been included in the project implementation cost.
Resource Requirements Calibrated instruments like Power analyzer, non-contact tachometer along with qualified engineers.
Specifications of Metering & Monitoring Devices
Power Analyzer and non-contact tachometer of reputed make having proper calibration certificates
Monitoring Responsibilities
This will be joint responsibility of ULB and ESCO for determining the savings from the measured data before and after implementation of ECM in the presence of third party representative.
Expected accuracy All measuring instrument should have class 1.0 accuracy. At least 90% accuracy is expected in the overall analysis
Reporting Formats
The format for reporting savings including load, tariff schedules, fan speeds and inventory details applicable for few selected fans and computed savings for this ECM has been annexed in the DPR.
Quality assurance Measurements will be taken jointly to have transparency in the system.
77

D.2 Savings Reporting Formats
The formats for saving reports are already covered in previous sections. It is, however,
reiterated that all the relevant billed data (for taking latest tariff) along with observed and
measured data, operating hours considered in the respective ECMs shall be included in the
format which shall be prescribed in performance contract prior to implementation.
D.3 Responsibilities and Obligations of ESCO
Though the responsibilities for monitoring are covered in previous section, the detailed
responsibilities of the ECSO shall depend upon the business model adopted by the
municipality for implementing the ECMs. In case of performance contract based on shared
saving model, the ESCO shall be responsible for financing, implementing, operating,
maintaining, training, reporting and handing over the project on completion. In case of
performance contract based on guaranteed savings model, the ESCO shall be responsible for
implementing, operating, maintaining, training, reporting and handing over the project on
completion. In case of fixed fee based turnkey consultancy contract also, the ESCO or the
consultant shall be responsible for all these activities as prescribed in the contract.
D.4 Responsibilities and Obligations of ULBs
Providing administrative support and copies of utility bills and other relevant data is the main
responsibility of the ULB. The contract would specify the ULB responsibilities in detail
regarding administrative support and periodic payments.
D.5 Suggested Payment and Other Terms of Contract
In case of fixed fee based turnkey consultancy contract, a provision for advance payment as
mobilization charges in the contract can result in reduced costs and fast execution. Payment
for the work in progress can be made as per some yardstick agreed mutually. The payment
terms should include payment within one week of submission of deliverables as specified in
the contract. Similar provisions for payments can be made in case of guaranteed savings
based performance contracts also. A time of one month for payment to be made by the ESCO
to the municipality, if the savings are below the guaranteed savings, is considered workable.
Payment of bonus payment to the ESCO, if the savings are more than the guaranteed
savings, can be helpful in smooth implementation of the project.
In case of shared savings based performance contract, the suggested percentage of savings
to be shared by ESCO is 70-80% which can be specified in the contract documents after
consultative meetings.
State Govt. should give the Guarantee for timely release of payment to the ESCO on agreed
rates.
78

E. ULB Energy Management Best Practices Any successful energy management programme needs the total support of top management.
Top management should give energy efficiency due importance along with their other
organizational objectives. To establish energy management programme an organization should
appoint Energy manager, form a dedicated energy cell and institute an energy policy. Thus top
management shall make a commitment to allocate manpower and funds to achieve continuous
improvement. The other important requirements are a well charted plan, an effective monitoring
system and adequate technical ability for analyzing and implementing energy saving options.
E.1 Energy Policy Energy policy provides the foundation for setting performance goals and integrating energy
management into an organization’s culture and operations. It formalizes top management
support and articulates the organization’s commitment to energy efficiency, for employees, the
community and other stakeholders. An energy policy typically includes:
1. Declaration of top management’s commitment to, and senior and middle management’s
involvement in, energy management.
2. Statement of policy
3. Statement of objectives, separated into short term and long term goals.
A sample Energy Policy suiting to energy scenario of Municipal Corporation YAMUNA NAGAR
is placed on next page for Guidance to Energy Cell.
E.2 Duties Responsibilities and Obligations of Energy Cell The tasks of energy cell are executing energy management activities across different parts of
the organization and ensuring integration of best practices.
Decisions affecting energy use are made every day by employees at all levels in an ULB.
Creating an energy cell helps to integrate energy management activities in an ULB. In addition
to planning and implementing specific improvements, the energy cell measures and tracks
energy performance and communicates with management, employees and other stakeholders.
Energy cell can encourage communications and the sharing of ideas between various
departments in an ULB. It can serve to obtain agreements on energy conservation projects,
which affect more than one department. It can provide a stronger voice to the top management
than a single energy manager normally could.
The frequency of team meetings depend on the importance of energy costs in the overall cost
structure of the company and what projects are in progress at any time. Normally a monthly
meeting is usual, so that monthly production and energy consumptions may be reviewed
together by the cell. This review would include a comparison of actual performance against
previously set targets and budget figures, as well as against previous months. Other items for
79

the agenda should be a review of the status of energy conservation investments in progress or
planned.
The responsibilities, duties and obligations of energy cell can be summarized as below:
Responsibilities
• Prepare an annual activity plan and present to management concerning financially attractive
investments to reduce energy costs
• Obtain management’s consent about the mandate and task of the cell.
• Initiate activities to improve monitoring and process control to reduce energy costs.
• Prepare information material and conduct internal workshops about the topic for other staff.
• Establish a methodology how to accurately calculate the specific energy consumption of
various services of the ULB.
• Develop and manage training programme for energy efficiency at operating levels.
• Co-ordinate nomination of management personnel to external programs.
• Co-ordinate implementation of energy audit/efficiency improvement projects through external
agencies.
• Establish and/or participate in information exchange with other energy cells of the ULBs
through top management.
Duties
• Report to BEE, state govt. and state level designated agency the information regard to the
energy consumed and action taken on the recommendation of the accredited energy auditor,
as per BEE Format whenever asked by them.
• Establish an improved data recording, collection and analysis system to keep track of energy
consumption.
• Provide support to Accredited Energy Audit Firm, in case retained by the ULB, for the
conduct of energy audit
• Prepare a scheme for efficient use of energy and its conservation and implement such
scheme keeping in view of the economic stability of the investment.
Obligations
Organize meetings as per agreed schedule.
Keep track of energy consumption on monthly basis, compare with norms/targets and report
to management in case of any abnormality.
Coordinate with BEE, SDA and others on all energy related matters.
80

E.3 Best Practices Municipal Street Lighting Systems
A schedule is prepared for cleaning of street lights and it is ensured that cleaning is
carried out as per schedule. The cleaning of street lights improves the lux levels by
removing the dirt from the lamp/reflector and insects trapped within the fittings are also
removed.
A complain register is maintained at the office where all the complaints regarding street
light are maintained with a specific complaint number. The date, time and mode of
receipt of complaint along with complainant details are recorded at the time of receiving
the complaint. When this complaint is given to concerned person for attending it then the
details of person and date & time are also noted. Ultimately when the complaint is
attended then again the date and time are noted and thus closing of the complaint takes
place. This register is monitored by the lighting in-charge/inspector every day to keep a
track of things.
E.4 Best Practices Municipal Buildings
Whenever any new/additional electrical load is to be added in the system, it is checked
whether the existing cable and switch gears can take the extra load. Moreover, the
present load on all the three phases is checked and balanced. Additional load is put on
the phase least loaded in such a way that it does not lead to unbalancing.
There is total ban on purchase of 40 W tube rod, resistance type ceiling fan regulator
and filament lamps. In case, any one buys these items, then, the bill is not passed by
the competent authority. In place of these, 36 W tube rods, electronic regulator and CFL
are purchased.
Whenever new Tubular Florescent Lights, refrigerators, window/split air conditioners,
water coolers, electric motors, pumps etc are purchased; then, only energy efficient
appliances are bought which have been given highest star (5 star) rating by the BEE to
save energy.
81

MUNICIPAL CORPORATION, YAMUNA NAGAR
ENERGY POLICY
We, at Municipal Corporation YAMUNA NAGAR, are committed to optimally utilize various forms of energy in a cost effective manner to effect conservation of energy resources.
To accomplish this we will :
Measure, Monitor and control the consumption of various forms of energy through an effective Energy Management System.
Adopt appropriate energy conservation technologies.
Use energy efficient appliances.
Make energy conservation a mass movement with the involvement of all staff.
Switch off lights/fans and all other appliances when not required.
Reduce Energy Consumption in each segment by 5 % every year by 2011.
Date Municipal Commissioner
82

F. Appendices
List of appendices has been put at page No. 6 of this DPR. Its soft copy has been kept in a separate file. Being bulky its hard copy has not been included in this
DPR.
83

G. Annexures
List of Vendors
1. For Servo Voltage Stabilizer
Sl No Name Address
01 M/S Kakatia Energy System Ltd 3-6-272, NVK Towers
Himayath Nagar Hyderabad -500029
02 M/S Alien Energy Pvt. Ltd
8/122, Karan Gali, Vishwas Nagar
Delhi-110032
Mobile 09810250203
+91 11 2237 2828: 2237 3565
03 Conzerv System Pvt. Ltd.
87, First Floor, Ind Dev Colony
Mehrauli Road, Gurgaon- 122 001
+91 124 4268965 : 4268899
2. For various luminaries, electronic chokes, electronic fan regulators etc.
M/S Alien Energy Pvt. Ltd., 8/122, Karan Gali, Vishwas Nagar Delhi-110032 Mobile: 09810250203 011-2237 2828, 2237 3565
84

Technology/Technical Specifications
1. Servo Voltage Stabilizer
Technical Specifications
1. Protection : IP 65 2. Body : Metallic with Powder Coated paint 3. Rating : starts from 3 KVA to 9 KVA in single/double/three phase 4. Incoming Voltage : 150 to 270 Volts 5. Auto-tripping: The panel trips when incoming voltage is more or less than this range 6. Timer : Digital, micro-processor based with a least count of 1 minute
85

Offers from Vendors
1. Offer from M/S Alien Energy Pvt. Ltd. for Servo Voltage Stabilizer
Prices
a. Rs. 25,000/- for 3 KVA single phase b. Rs. 42,000/- for 3 KVA two phase c. Rs. 7,000/-per KVA for each phase (For Example – A 3 KVA 3 Phase panel will
cost Rs. 54,000/-)
These prices are inclusive of all (even installation cost also).
2. Offer in the form of price list from M/S Alien Energy Pvt. Ltd. For lumenaires and other products is placed on next pages
86

87
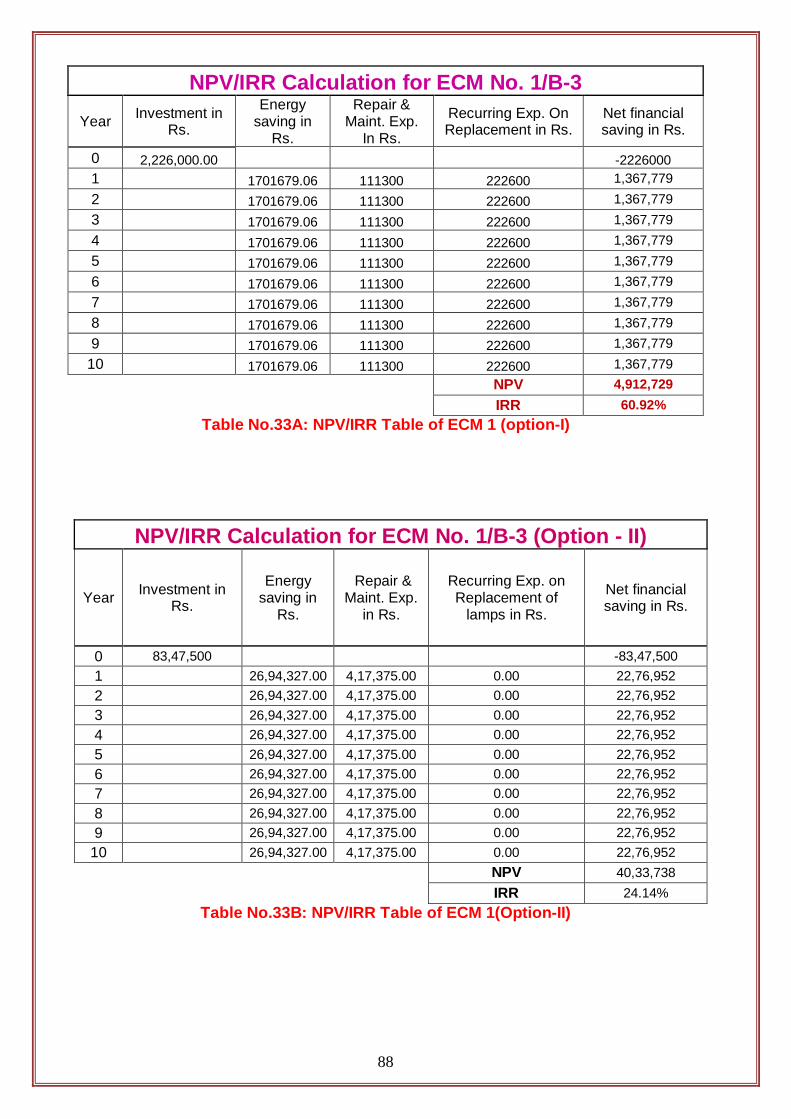
NPV/IRR Calculation for ECM No. 1/B-3 Year Investment in
Rs.
Energy saving in
Rs.
Repair & Maint. Exp.
In Rs.
Recurring Exp. On Replacement in Rs.
Net financial saving in Rs.
0 2,226,000.00 -2226000 1 1701679.06 111300 222600 1,367,779 2 1701679.06 111300 222600 1,367,779 3 1701679.06 111300 222600 1,367,779 4 1701679.06 111300 222600 1,367,779 5 1701679.06 111300 222600 1,367,779 6 1701679.06 111300 222600 1,367,779 7 1701679.06 111300 222600 1,367,779 8 1701679.06 111300 222600 1,367,779 9 1701679.06 111300 222600 1,367,779
10 1701679.06 111300 222600 1,367,779 NPV 4,912,729 IRR 60.92%
Table No.33A: NPV/IRR Table of ECM 1 (option-I)
NPV/IRR Calculation for ECM No. 1/B-3 (Option - II)
Year Investment in Rs.
Energy saving in
Rs.
Repair & Maint. Exp.
in Rs.
Recurring Exp. on Replacement of
lamps in Rs.
Net financial saving in Rs.
0 83,47,500 -83,47,500 1 26,94,327.00 4,17,375.00 0.00 22,76,952 2 26,94,327.00 4,17,375.00 0.00 22,76,952 3 26,94,327.00 4,17,375.00 0.00 22,76,952 4 26,94,327.00 4,17,375.00 0.00 22,76,952 5 26,94,327.00 4,17,375.00 0.00 22,76,952 6 26,94,327.00 4,17,375.00 0.00 22,76,952 7 26,94,327.00 4,17,375.00 0.00 22,76,952 8 26,94,327.00 4,17,375.00 0.00 22,76,952 9 26,94,327.00 4,17,375.00 0.00 22,76,952
10 26,94,327.00 4,17,375.00 0.00 22,76,952 NPV 40,33,738 IRR 24.14%
Table No.33B: NPV/IRR Table of ECM 1(Option-II)
88
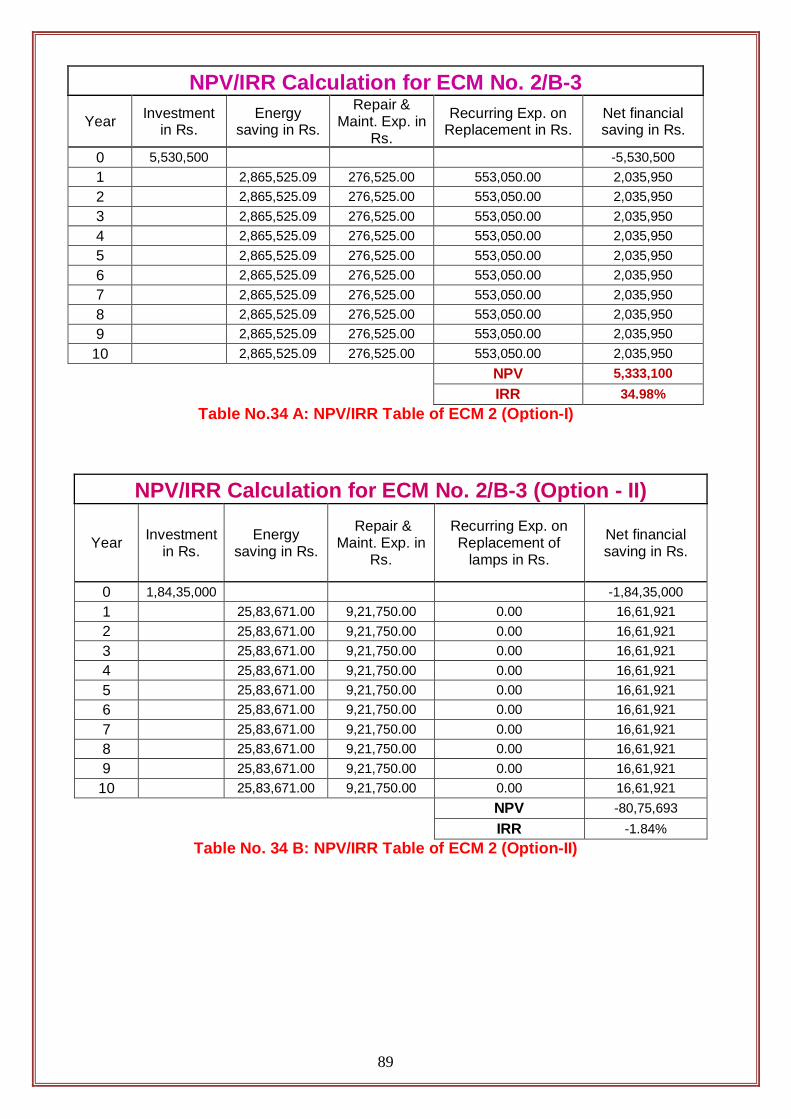
NPV/IRR Calculation for ECM No. 2/B-3 Year Investment
in Rs. Energy
saving in Rs.
Repair & Maint. Exp. in
Rs.
Recurring Exp. on Replacement in Rs.
Net financial saving in Rs.
0 5,530,500 -5,530,500 1 2,865,525.09 276,525.00 553,050.00 2,035,950 2 2,865,525.09 276,525.00 553,050.00 2,035,950 3 2,865,525.09 276,525.00 553,050.00 2,035,950 4 2,865,525.09 276,525.00 553,050.00 2,035,950 5 2,865,525.09 276,525.00 553,050.00 2,035,950 6 2,865,525.09 276,525.00 553,050.00 2,035,950 7 2,865,525.09 276,525.00 553,050.00 2,035,950 8 2,865,525.09 276,525.00 553,050.00 2,035,950 9 2,865,525.09 276,525.00 553,050.00 2,035,950
10 2,865,525.09 276,525.00 553,050.00 2,035,950 NPV 5,333,100 IRR 34.98%
Table No.34 A: NPV/IRR Table of ECM 2 (Option-I)
NPV/IRR Calculation for ECM No. 2/B-3 (Option - II)
Year Investment in Rs.
Energy saving in Rs.
Repair & Maint. Exp. in
Rs.
Recurring Exp. on Replacement of
lamps in Rs.
Net financial saving in Rs.
0 1,84,35,000 -1,84,35,000 1 25,83,671.00 9,21,750.00 0.00 16,61,921 2 25,83,671.00 9,21,750.00 0.00 16,61,921 3 25,83,671.00 9,21,750.00 0.00 16,61,921 4 25,83,671.00 9,21,750.00 0.00 16,61,921 5 25,83,671.00 9,21,750.00 0.00 16,61,921 6 25,83,671.00 9,21,750.00 0.00 16,61,921 7 25,83,671.00 9,21,750.00 0.00 16,61,921 8 25,83,671.00 9,21,750.00 0.00 16,61,921 9 25,83,671.00 9,21,750.00 0.00 16,61,921
10 25,83,671.00 9,21,750.00 0.00 16,61,921 NPV -80,75,693 IRR -1.84%
Table No. 34 B: NPV/IRR Table of ECM 2 (Option-II)
89
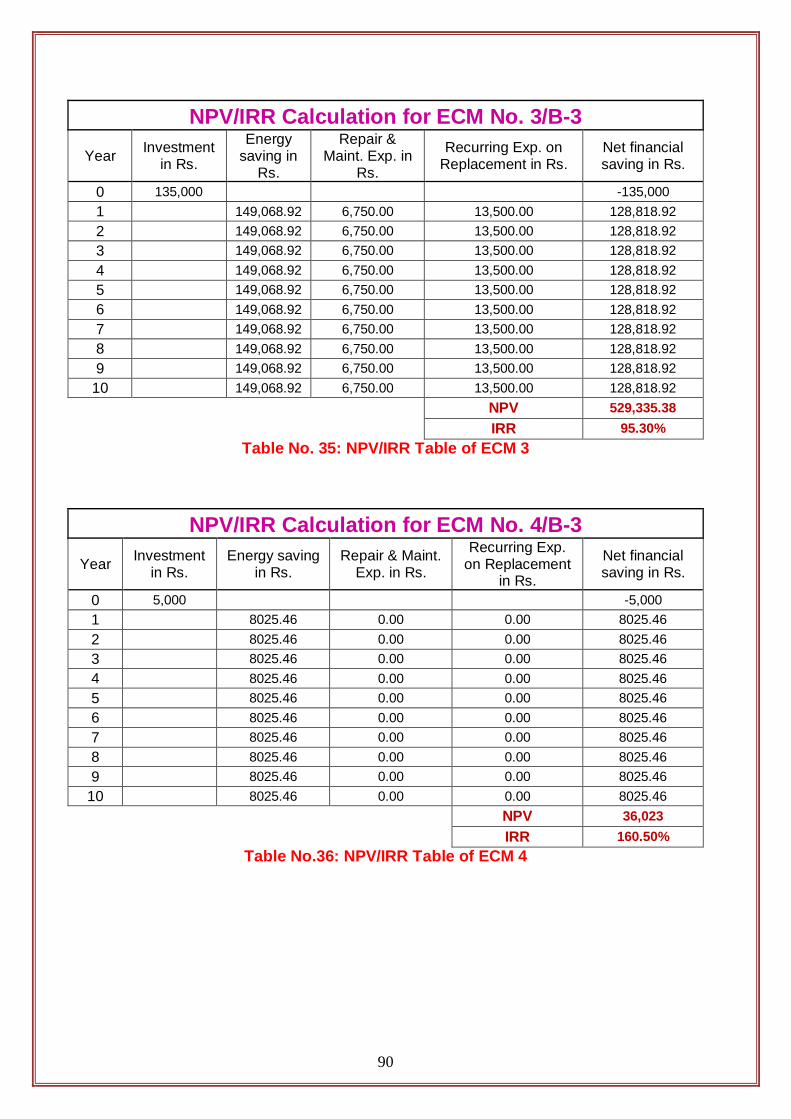
NPV/IRR Calculation for ECM No. 3/B-3 Year Investment
in Rs.
Energy saving in
Rs.
Repair & Maint. Exp. in
Rs.
Recurring Exp. on Replacement in Rs.
Net financial saving in Rs.
0 135,000 -135,000 1 149,068.92 6,750.00 13,500.00 128,818.92 2 149,068.92 6,750.00 13,500.00 128,818.92 3 149,068.92 6,750.00 13,500.00 128,818.92 4 149,068.92 6,750.00 13,500.00 128,818.92 5 149,068.92 6,750.00 13,500.00 128,818.92 6 149,068.92 6,750.00 13,500.00 128,818.92 7 149,068.92 6,750.00 13,500.00 128,818.92 8 149,068.92 6,750.00 13,500.00 128,818.92 9 149,068.92 6,750.00 13,500.00 128,818.92
10 149,068.92 6,750.00 13,500.00 128,818.92 NPV 529,335.38 IRR 95.30%
Table No. 35: NPV/IRR Table of ECM 3
NPV/IRR Calculation for ECM No. 4/B-3 Year Investment
in Rs. Energy saving
in Rs. Repair & Maint.
Exp. in Rs.
Recurring Exp. on Replacement
in Rs.
Net financial saving in Rs.
0 5,000 -5,000 1 8025.46 0.00 0.00 8025.46 2 8025.46 0.00 0.00 8025.46 3 8025.46 0.00 0.00 8025.46 4 8025.46 0.00 0.00 8025.46 5 8025.46 0.00 0.00 8025.46 6 8025.46 0.00 0.00 8025.46 7 8025.46 0.00 0.00 8025.46 8 8025.46 0.00 0.00 8025.46 9 8025.46 0.00 0.00 8025.46
10 8025.46 0.00 0.00 8025.46 NPV 36,023 IRR 160.50%
Table No.36: NPV/IRR Table of ECM 4
90
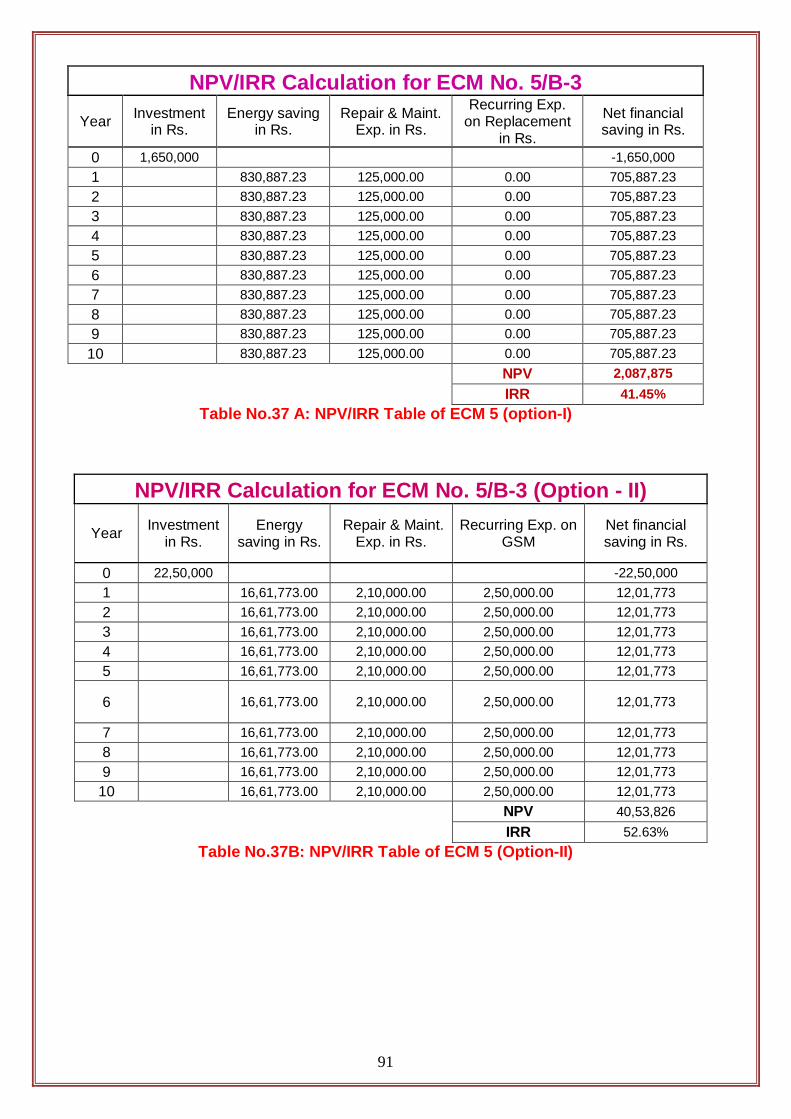
NPV/IRR Calculation for ECM No. 5/B-3 Year Investment
in Rs. Energy saving
in Rs. Repair & Maint.
Exp. in Rs.
Recurring Exp. on Replacement
in Rs.
Net financial saving in Rs.
0 1,650,000 -1,650,000 1 830,887.23 125,000.00 0.00 705,887.23 2 830,887.23 125,000.00 0.00 705,887.23 3 830,887.23 125,000.00 0.00 705,887.23 4 830,887.23 125,000.00 0.00 705,887.23 5 830,887.23 125,000.00 0.00 705,887.23 6 830,887.23 125,000.00 0.00 705,887.23 7 830,887.23 125,000.00 0.00 705,887.23 8 830,887.23 125,000.00 0.00 705,887.23 9 830,887.23 125,000.00 0.00 705,887.23
10 830,887.23 125,000.00 0.00 705,887.23 NPV 2,087,875 IRR 41.45%
Table No.37 A: NPV/IRR Table of ECM 5 (option-I)
NPV/IRR Calculation for ECM No. 5/B-3 (Option - II)
Year Investment in Rs.
Energy saving in Rs.
Repair & Maint. Exp. in Rs.
Recurring Exp. on GSM
Net financial saving in Rs.
0 22,50,000 -22,50,000 1 16,61,773.00 2,10,000.00 2,50,000.00 12,01,773 2 16,61,773.00 2,10,000.00 2,50,000.00 12,01,773 3 16,61,773.00 2,10,000.00 2,50,000.00 12,01,773 4 16,61,773.00 2,10,000.00 2,50,000.00 12,01,773 5 16,61,773.00 2,10,000.00 2,50,000.00 12,01,773
6 16,61,773.00 2,10,000.00 2,50,000.00 12,01,773
7 16,61,773.00 2,10,000.00 2,50,000.00 12,01,773 8 16,61,773.00 2,10,000.00 2,50,000.00 12,01,773 9 16,61,773.00 2,10,000.00 2,50,000.00 12,01,773
10 16,61,773.00 2,10,000.00 2,50,000.00 12,01,773 NPV 40,53,826 IRR 52.63%
Table No.37B: NPV/IRR Table of ECM 5 (Option-II)
91

NPV/IRR Calculation for ECM No. 6/B-4 Year Investment
in Rs.
Energy saving in
Rs.
Repair & Maint. Exp. in Rs.
Recurring Exp. on Replacement
in Rs.
Net financial saving in Rs.
0 7,200 -7,200 1 4,017.00 720.00 0.00 3,297.00 2 4,017.00 720.00 0.00 3,297.00 3 4,017.00 720.00 0.00 3,297.00 4 4,017.00 720.00 0.00 3,297.00 5 4,017.00 720.00 0.00 3,297.00 6 4,017.00 720.00 0.00 3,297.00 7 4,017.00 720.00 0.00 3,297.00 8 4,017.00 720.00 0.00 3,297.00 9 4,017.00 720.00 0.00 3,297.00
10 4,017.00 720.00 0.00 3,297.00 NPV 10,204 IRR 44.65%
Table No.38: NPV/IRR Table of ECM 6
NPV/IRR Calculation for ECM No. 7/B-4 Ye ar
Investmen t in Rs.
Energy saving in Rs.
Repair & Maint. Exp. in Rs.
Recurring Exp. on Replacement in Rs.
Net financial saving in Rs.
0 11,000.00 -11,000.00 1 4,826.00 550.00 550.00 3,726.00 2 4,826.00 550.00 550.00 3,726.00 3 4,826.00 550.00 550.00 3,726.00 4 4,826.00 550.00 550.00 3,726.00 5 4,826.00 550.00 550.00 3,726.00 6 4,826.00 550.00 550.00 3,726.00 7 4,826.00 550.00 550.00 3,726.00 8 4,826.00 550.00 550.00 3,726.00 9 4,826.00 550.00 550.00 3,726.00
10 4,826.00 550.00 550.00 3,726.00 NPV 8,976 IRR 31.72%
Table No.39: NPV/IRR Table of ECM 7
92

Income Tax Rules on Claiming Depreciation 1[NEW APPENDIX I
[Effective from assessment year 2006-07 onwards]
[See rule 5]
TABLE OF RATES AT WHICH DEPRECIATION IS ADMISSIBLE
Block of assets Depreciation
allowance as
percentage
of written
down value
1 2
PART A
TANGIBLE ASSETS
I. Building [See Notes 1 to 4 below this Table]
(1) Buildings which are used mainly for residential purposes except hotels and boarding houses
(2) Buildings other than those used mainly for residential purposes and not covered by sub-items (1) above and (3) below
(3) Buildings acquired on or after the 1st day of September, 2002 for installing machinery and plant forming part of water supply project or water treatment system and which is put to use for the purpose of business of providing infrastructure facilities under clause (i) of sub-section (4) of section 80-IA
(4) Purely temporary erections such as wooden structures
5
10
100
100
II. Furniture and fittings 10
Furniture and fittings including electrical fittings
[See Note 5 below this Table]
III. Machinery and Plant
(1) Machinery and plant other than those covered by sub-items (2), (3) and (8) below : 15
(2) Motor cars, other than those used in a business of running them on hire, acquired or put to use on or after the 1st day of April, 1990 15
(3) (i) Aeroplanes - Aeroengines
(ii) Motor buses, motor lorries and motor taxis used in a business of running them on hire
(iii) Commercial vehicle which is acquired by the assessee on or after the 1st day of October, 1998, but before the 1st day of April, 1999 and is put to use for any period before the 1st day of April, 1999 for the purposes of business or profession in
15
15
40
30
40
93
accordance with the third proviso to clause (ii) of sub-section (1) of section 32 [See Note 6 below this Table]
(iv) New commercial vehicle which is acquired on or after the 1st day of October, 1998, but before the 1st day of April, 1999 in replacement of condemned vehicle of over 15 years of age and is put to use for any period before the 1st day of April, 1999 for the purposes of business or profession in accordance with the third proviso to clause (ii) of sub-section (1) of section 32 [See Note 6 below this Table]
(v) New commercial vehicle which is acquired on or after the 1st day of April, 1999 but before the 1st day of April, 2000 in replacement of condemned vehicle of over 15 years of age and is put to use before the 1st day of April, 2000 for the purposes of business or profession in accordance with the second proviso to clause (ii) of sub-section (1) of section 32 [See Note 6 below this Table]
(vi) New commercial vehicle which is acquired on or after the 1st day of April, 2001 but before the 1st day of April, 2002 and is put to use before the 1st day of April, 2002 for the purposes of business or profession [See Note 6 below this Table]
1a[(via) New commercial vehicle which is acquired on or after the 1st day of January, 2009 but before the 1b[1st day of October, 2009] and is put to use before 1b[1st day of October, 2009] for the purposes of business or profession [See paragraph 6 of the Notes below this Table]
(vii) Moulds used in rubber and plastic goods factories
(viii) Air pollution control equipment, being—
(a) Electrostatic precipitation systems
(b) Felt-filter systems
(c) Dust collector systems
(d) Scrubber-counter current/venturi/packed bed/cyclonic scrubbers
(e) Ash handling system and evacuation system
(ix) Water pollution control equipment, being—
(a) Mechanical screen systems
(b) Aerated detritus chambers (including air compressor)
(c) Mechanically skimmed oil and grease removal systems
(d) Chemical feed systems and flash mixing equipment
(e) Mechanical flocculators and mechanical reactors
60
60
50
50]
30
100
100
94
(f) Diffused air/mechanically aerated activated sludge systems
(g) Aerated lagoon systems
(h) Biofilters
(i) Methane-recovery anaerobic digester systems
(j) Air floatation systems
(k) Air/steam stripping systems
(l) Urea Hydrolysis systems
(m) Marine outfall systems
(n) Centrifuge for dewatering sludge
(o) Rotating biological contractor or bio-disc
(p) Ion exchange resin column
(q) Activated carbon column
(x) (a) Solidwaste, control equipment being -caustic/lime/ chrome/mineral/cryolite recovery systems
(b) Solidwaste recycling and resource recovery systems
(xi) Machinery and plant, used in semi-conductor industry covering all Integrated Circuits (ICs) (excluding hybrid integrated circuits) ranging from Small Scale Integration (SSI) to Large Scale Integration/Very Large Scale Integration (LSI/VLSI) as also discrete semi-conductor devices such as diodes, transistors, thyristors, triacs, etc., other than those covered by entries (viii), (ix) and (x) of this sub-item and sub-item (8) below.
(xia) Life saving medical equipment, being—
(a) D.C. Defibrillators for internal use and pace makers
(b) Haemodialysors
(c) Heart lung machine
(d) Cobalt Therapy Unit
(e) Colour Doppler
(f) SPECT Gamma Camera
(g) Vascular Angiography System including Digital Subtraction Angiography
100
30
40
95

(h) Ventilator used with anaesthesia apparatus
(i) Magnetic Resonance Imaging System
(j) Surgical Laser
(k) Ventilator other than those used with anaesthesia
(l) Gamma knife
(m) Bone Marrow Transplant Equipment including silastic long standing intravenous catheters for chemotherapy
(n) Fibre optic endoscopes including, Paediatric resectoscope/audit resectoscope, Peritoneoscopes, Arthoscope, Microlaryngoscope, Fibreoptic Flexible Nasal Pharyngo Bronchoscope, Fibreoptic Flexible Laryngo Bronchoscope, Video Laryngo Bronchoscope and Video Oesophago Gastroscope, Stroboscope, Fibreoptic Flexible Oesophago Gastroscope
(o) Laparoscope (single incision)
(4) Containers made of glass or plastic used as re-fills
(5) Computers including computer software (See Note 7 below this Table)
(6) Machinery and plant, used in weaving, processing and garment sector of textile industry, which is purchased under TUFS on or after the 1st day of April, 2001 but before the 1st day of April, 2004 and is put to use before the 1st day of April, 2004 [See Note 8 below this Table]
(7) Machinery and plant, acquired and installed on or after the 1st day of September, 2002 in a water supply project or a water treatment system and which is put to use for the purpose of business of providing infrastructure facility under clause (i) of sub-section (4) of section 80-IA [See Notes 4 and 9 below this Table]
(8) (i) Wooden parts used in artificial silk manufacturing machinery
(ii) Cinematograph films - bulbs of studio lights
(iii) Match factories - Wooden match frames
(iv) Mines and quarries :
(a) Tubs winding ropes, haulage ropes and sand stowing pipes 100
50
60
50
100
96
100

80
(b) Safety lamps
(v) Salt works - Salt pans, reservoirs and condensers, etc., made of earthy, sandy or clayey material or any other similar material
(vi) Flour mills - Rollers
(vii) Iron and steel industry - Rolling mill rolls
(viii) Sugar works – Rollers
(ix) Energy saving devices, being—
A. Specialised boilers and furnaces :
(a) Ignifluid/fluidized bed boilers
(b) Flameless furnaces and continuous pusher type furnaces 80
(c) Fluidized bed type heat treatment furnaces
(d) High efficiency boilers (thermal efficiency higher than 75 per cent in case of coal fired and 80 per cent in case of oil/gas fired boilers)
B. Instrumentation and monitoring system for monitoring energy flows
(a) Automatic electrical load monitoring systems
(b) Digital heat loss meters
(c) Micro-processor based control systems
(d) Infra-red thermography
(e) Meters for measuring heat losses, furnace oil flow, steam flow, electric energy and power factor meters
(f) Maximum demand indicator and clamp on power meters
(g) Exhaust gases analyzer
(h) Fuel oil pump test bench
C. Waste heat recovery equipment:
(a) Economisers and feed water heaters
(b) Recuperators and air pre-heaters
(c) Heat pumps
97
80
80
80

(d) Thermal energy wheel for high and low temperature waste heat recovery
D. Co-generation systems:
(a) Back pressure pass out, controlled extraction, extraction-cum-condensing turbines for co-generation along with pressure boilers
(b) Vapour absorption refrigeration systems
(c) Organic rankine cycle power systems
(d) Low inlet pressure small steam turbines
E. Electrical equipment:
(a) Shunt capacitors and synchronous condenser systems
(b) Automatic power cut-off devices (relays) mounted on individual motors
(c) Automatic voltage controller
(d) Power factor controller for AC motors
(e) Solid state devices for controlling motor speeds
(f) Thermally energy-efficient stenters (which require 800 or less kilocalories of heat to evaporate one
kilogram of water)
(g) Series compensation equipment
(h) Flexible AC Transmission (FACT) devices -Thyristor controlled series compensation equipment
(i) Time of Day (ToD) energy meters
(j) Equipment to establish transmission highways for National Power Grid to facilitate transfer of surplus power of one region to the deficient region
(k) Remote terminal units/intelligent electronic devices, computer hardware/software, router/bridges, other required equipment and associated communication systems for supervisory control and data acquisition
systems, energy management systems and distribution management systems for
98
80
80

80
power transmission systems
(l) Special energy meters for Availability Based Tariff (ABT)
F. Burners:
(a) 0 to 10 per cent excess air burners
(b) Emulsion burners
(c) Burners using air with high pre-heat temperature (above 300°C)
G. Other equipment :
(a) Wet air oxidation equipment for recovery of chemicals and heat
(b) Mechanical vapour recompressors
(c) Thin film evaporators
(d) Automatic micro-processor based load demand controllers
(e) Coal based producer gas plants
(f) Fluid drives and fluid couplings
(g) Turbo charges/super-charges
(h) Sealed radiation sources for radiation processing plants
(x) Gas cylinders including valves and regulators
(xi) Glass manufacturing concerns - Direct fire glass melting furnaces
(xii) Mineral oil concerns:
(a) Plant used in field operations (above ground) Returnable packages
(b) Plant used in field operations (below ground), but not including kerbside pumps including underground tanks and fittings used in field operations (distribution) by mineral oil concerns
(xiii) Renewable energy devices being —
(a) Flat plate solar collectors
(b) Concentrating and pipe type solar collectors
(c) Solar cookers
(d) Solar water heaters and systems
(e) Air/gas/fluid heating systems
(f) Solar crop driers and systems
80
60
60
60
99
80

(g) Solar refrigeration, cold storages and air conditioning systems
(h) Solar steels and desalination systems
(i)Solar power generating systems
(j) Solar pumps based on solar-thermal and solar-photovoltaic conversion
(k) Solar-photovoltaic modules and panels for water pumping and other applications
(l) Wind mills and any specially designed devices which run on wind mills
(m) Any special devices including electric generators and pumps running on wind energy
(n) Biogas-plant and biogas-engines
(o) Electrically operated vehicles including battery powered
or fuel-cell powered vehicles
(p) Agricultural and municipal waste conversion devices producing energy
(q) Equipment for utilising ocean waste and thermal energy
(r) Machinery and plant used in the manufacture of any of the above sub-items
(9) (i) Books owned by assessees carrying on a profession—
(a) Books, being annual publications
(b) Books, other than those covered by entry (a) above
(ii) Books owned by assessees carrying on business in runninglending libraries
IV. Ships
(1) Ocean-going ships including dredgers, tugs, barges, survey launches and other similar ships used mainly for dredging purposes and fishing vessels with wooden hull
(2) Vessels ordinarily operating on inland waters, not covered by sub-item
(3) Vessels ordinarily operating on inland waters being speed boats [See Note 10 below this Table]
100
60
100
20
20
20
PART B
100

25
INTANGIBLE ASSETS
Know-how, patents, copyrights, trademarks, licences, franchises or any other business or commercial rights of similar nature
Notes:
1. “Buildings” include roads, bridges, culverts, wells and tubewells.
2. A building shall be deemed to be a building used mainly for residential purposes, if the built up floor area thereof used for residential purposes is not less than sixty-six and two-third per cent of its total built-up floor area and shall include any such building in the factory premises.
3. In respect of any structure or work by way of renovation or improvement in or in relation to a building referred to in Explanation 1 of clause (ii) of sub-section (1) of section 32, the percentage to be applied will be the percentage specified against sub-item (1) or (2) of item 1 as may be appropriate to the class of building in or in relation to which the renovation or improvement is effected. Where the structure is constructed or the work is done by way of extension of any such building, the percentage to be applied would be such percentage as would be appropriate, as if the structure or work constituted a separate building.
4. Water treatment system includes system for desalination, demineralisation and purification of water.
5. “Electrical fittings” include electrical wiring, switches, sockets, other fittings and fans, etc.
6. “Commercial vehicle” means “heavy goods vehicle”, “heavy passenger motor vehicle”, “light motor vehicle”, “medium goods vehicle” and “medium passenger motor vehicle” but does not include “maxi-cab”, “motor-cab”, “tractor” and “road-roller”. The expressions “heavy goods vehicle”, “heavy passenger motor vehicle”, “light motor vehicle”, “medium goods vehicle”, “medium passenger motor vehicle”, “maxi-cab”, “motor-cab”, “tractor” and “road-roller” shall have the meanings respectively assigned to them in section 2 of the Motor Vehicles Act, 1988 (59 of 1988).2
7. “Computer software” means any computer program recorded on any disc, tape, perforated media or other information storage device.
8. “TUFS” means Technology Upgradation Fund Scheme announced by the Government of India in the form of a Resolution of the Ministry of Textiles vide No. 28/1/99-CTI of 31-3-1999.
9. Machinery and plant includes pipes needed for delivery from the source of supply of raw water to the plant and from the plant to the storage facility.
10. “Speed boat” means a motor boat driven by a high speed internal combustion engine capable of propelling the boat at a speed exceeding 24 kilometres per hour in still water and so designed that when running at a speed, it will plane, i.e., its bow will rise from the water.]
101