DETAILED NUMERICAL INVESTIGATION OF …ctflab.mae.cornell.edu/papers/Desjardins, Pitsch. 2010....
26
Atomization and Sprays 20(4), 311–336 (2010) DETAILED NUMERICAL INVESTIGATION OF TURBULENT ATOMIZATION OF LIQUID JETS O. Desjardins 1,* & H. Pitsch 2 1 Department of Mechanical Engineering, University of Colorado at Boulder, Boulder, Colorado 80309 2 Department of Mechanical Engineering, Stanford University, Stanford, California 94305 * Address all correspondence to O. Desjardins E-mail: [email protected] Original Manuscript Submitted: 02/11/2009; Final Draft Received: 08/3/2010 A detailed numerical investigation of turbulent liquid jets in quiescent air is conducted, with the focus on the processes leading to liquid atomization. Spectral refinement of the interface is employed to provide an accurate description of the phase interface, even at the subcell level. The ghost fluid method is used to handle the different material properties of the phases and the surface tension force in a sharp manner. A temporally evolving turbulent planar jet is simulated for several values of the Reynolds and Weber numbers, and statistics are extracted. Direct visualization of the flow structures allows one to lay out a clear picture of the atomization process. Early interface deformation is caused by turbulent eddies that carry enough kinetic energy to overcome surface tension forces. Then, liquid protrusions are stretched out into ligaments that rupture following Rayleigh’s theory or due to aerodynamic forces. This numerical study provides a wealth of much-needed detailed information on the turbulent atomization process, which is invaluable to large eddy simulation modeling. KEY WORDS: primary atomization, turbulence, DNS, incompressible flow, level set, ghost fluid, planar jet 1. INTRODUCTION 1.1 Background and Motivation Atomization, or the process by which a coherent liquid disintegrates into droplets, is a fundamental topic of fluid mechanics and has numerous engineering, environmen- tal, as well as pharmaceutical applications. Among the many engineering applications, the atomization of liquid fuels that occurs in energy conversion devices is of great importance because it governs the size of fuel droplets, their subsequent evaporation rate, and therefore will af- fect the homogeneity of the mixture. As a consequence, fuel atomization will have far-reaching repercussions on many different aspects of the combustion process, such as pollutant formation. To improve the design of energy conversion devices through computational methods, pre- dictive models for atomization have to be provided. Fig- ure 1 shows a sketch of the liquid atomization process. Although models are available for the so-called secondary atomization, (i.e., the breakup of small liquid drops or structures into smaller droplets), the description of pri- mary atomization (i.e., the disintegration of a coherent liquid core into drops) is not as mature, and few models are available to describe this phenomenon. This repre- sents one of the main bottlenecks in numerical modeling of combustion devices today. Many reasons explain why primary atomization re- mains such a challenging topic. First, the complex flows associated with liquid breakup involve turbulence, surface 1044–5110/10/$35.00 c 2010 by Begell House, Inc. 311
Transcript of DETAILED NUMERICAL INVESTIGATION OF …ctflab.mae.cornell.edu/papers/Desjardins, Pitsch. 2010....
Atomization and Sprays20(4), 311–336 (2010)
DETAILED NUMERICAL INVESTIGATION OFTURBULENT ATOMIZATION OF LIQUID JETS
O. Desjardins1,∗ & H. Pitsch2
1Department of Mechanical Engineering, University of Colorado at Boulder, Boulder, Colorado803092Department of Mechanical Engineering, Stanford University, Stanford, California 94305
∗Address all correspondence to O. Desjardins E-mail: [email protected]
Original Manuscript Submitted: 02/11/2009; Final Draft Received: 08/3/2010
A detailed numerical investigation of turbulent liquid jets in quiescent air is conducted, with the focus on the processesleading to liquid atomization. Spectral refinement of the interface is employed to provide an accurate description of thephase interface, even at the subcell level. The ghost fluid method is used to handle the different material properties ofthe phases and the surface tension force in a sharp manner. A temporally evolving turbulent planar jet is simulatedfor several values of the Reynolds and Weber numbers, and statistics are extracted. Direct visualization of the flowstructures allows one to lay out a clear picture of the atomization process. Early interface deformation is caused byturbulent eddies that carry enough kinetic energy to overcome surface tension forces. Then, liquid protrusions arestretched out into ligaments that rupture following Rayleigh’s theory or due to aerodynamic forces. This numericalstudy provides a wealth of much-needed detailed information on the turbulent atomization process, which is invaluableto large eddy simulation modeling.
KEY WORDS: primary atomization, turbulence, DNS, incompressible flow, level set, ghost fluid, planarjet
1. INTRODUCTION
1.1 Background and Motivation
Atomization, or the process by which a coherent liquiddisintegrates into droplets, is a fundamental topic of fluidmechanics and has numerous engineering, environmen-tal, as well as pharmaceutical applications. Among themany engineering applications, the atomization of liquidfuels that occurs in energy conversion devices is of greatimportance because it governs the size of fuel droplets,their subsequent evaporation rate, and therefore will af-fect the homogeneity of the mixture. As a consequence,fuel atomization will have far-reaching repercussions onmany different aspects of the combustion process, such
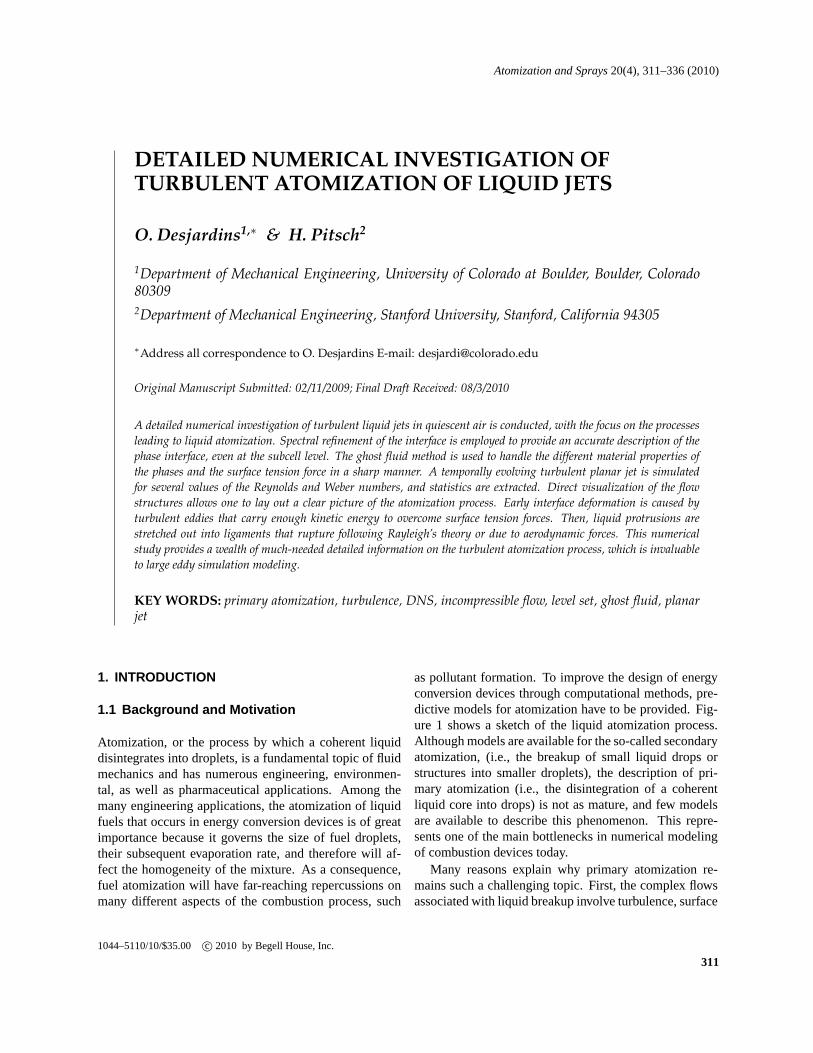
as pollutant formation. To improve the design of energyconversion devices through computational methods, pre-dictive models for atomization have to be provided. Fig-ure 1 shows a sketch of the liquid atomization process.Although models are available for the so-called secondaryatomization, (i.e., the breakup of small liquid drops orstructures into smaller droplets), the description of pri-mary atomization (i.e., the disintegration of a coherentliquid core into drops) is not as mature, and few modelsare available to describe this phenomenon. This repre-sents one of the main bottlenecks in numerical modelingof combustion devices today.
Many reasons explain why primary atomization re-mains such a challenging topic. First, the complex flowsassociated with liquid breakup involve turbulence, surface
1044–5110/10/$35.00 c© 2010 by Begell House, Inc.
311
312 Desjardins & Pitsch
Dilute spraySecondary atomization
Liquid core
Primary atomization
FIG. 1: Schematics of the atomization process of a liquid jet.
tension effects, and potentially large density ratios. Then,the difficulty associated with modeling is due to the im-portance of small liquid scales in combustion systems:modeling primary atomization means modeling a processby which mass and energy are transferred from the largeliquid scales to small liquid structures. In this process, theinterest is mostly in the size distribution of small liquidscales, which determines the evaporation rate. Primaryatomization and the subsequent secondary breakup mightnot follow a cascade process, where new structures areproduced only on the largest scales. Furthermore, the pro-duction of large-scale structures might not be in equilib-rium with small droplet evaporation, because of the longtime scales involved. These observations differ greatlyfrom standard Kolmogorov theory-based turbulence mod-eling.
Although a consensus has been reached in identify-ing the mechanisms behind certain atomization problems,many fundamental aspects of primary atomization remainpoorly understood to this day. Hence, numerous questionsremain, such as what mechanisms govern the turbulentatomization of liquid jets in quiescent air, or whether acoherent liquid core can be found in realistic liquid injec-tion applications. Also, it is unclear whether the classicalunderstanding of a primary liquid breakup followed by asecondary breakup is appropriate. To all these questions,numerical simulations can provide much needed answers,provided the numerical algorithms are made sufficientlyreliable.
1.2 Previous Work
1.2.1 Experimental Work
A large body of experimental work exists on the topicof atomization. Because numerical modeling is so lim-
ited and because the theory behind atomization is com-plex, experiments have been the main means of studyin this field. However, many challenges are also lim-iting the progress in experimental understanding of thephysics of atomization. Indeed, the dispersed liquid phaselimits optical access to the liquid core, and the scalesinvolved in these flows are typically very small. Asa result, experiments often aim at gathering statisticaldata on the droplets that result from the atomization pro-cess, instead of looking at the initial phase of the liquidbreakup (Smallwood and Gulder, 2000).
However, for numerous simpler two-phase flow prob-lems, such as droplet splashing, binary drop collision,or single-droplet breakup, abundant detailed experimen-tal work has been published. For example, the issueof how a single droplet undergoes secondary breakuphas been carefully analyzed by Chou and Faeth (1998).Droplet splashing and the well-known milk crown phe-nomenon have been studied extensively as well [see, e.g.,Yarin (2006) for a review on the topic]. Binary drop colli-sions have been visualized and classified, for example, byAshgriz and Poo (1990). Such problems are of great inter-est for they are likely to play a role in the complex processof liquid atomization. However, they can be seen as sec-ondary because they rely on the assumption that dropletsare already present in the system.
On the topic of how these droplets are initially gener-ated (i.e., primary atomization itself), much less experi-mental studies are available. A specific topic on whicha precise theory is available is the case of air-blast atom-ization (i.e., atomization caused by a fast coflowing gasstream). In this configuration, the mechanisms leadingto drop formation have been clearly identified by Hopfin-ger, Villermaux, and coworkers [see, e.g., Lasheras andHopfinger (2000), Marmottant and Villermaux (2004),
Atomization and Sprays

Numerical Investigation of Turbulent Atomization 313
Villermaux (2007)]. They suggested that the interface isfirst subject to a Kelvin-Helmholtz instability, leading toa longitudinal wave being formed on the surface of thejet. Then, as this wave grows, it undergoes a secondaryinstability of Rayleigh-Taylor type. This leads to the gen-eration of bulges at the top of the wave crest. These liq-uid bulges are then picked up by the fast coflowing gasand stretched into thin ligaments that ultimately undergoRayleigh breakup and droplet formation. However, theseinvestigations were limited to laminar flows, as well ashigh-density ratios.
Concerning the issue of high-speed liquid injection in aquiescent environment, experiments have yet to provide acomplete picture of the atomization mechanisms. A seriesof studies by Faeth et al. (1995) and Sallam et al. (2002)have shed some light on the complex phenomena that takeplace at the surface of the liquid jet by using pulsed shad-owgraphs. Their results suggest that the turbulence ofthe liquid field is of crucial importance in the develop-ment of the interfacial structures. Moreover, they wereable to provide models for the breakup length, the on-set of turbulent breakup, and the resulting droplet veloc-ity. However, most of these correlations where obtainedfor high-density ratios (on the order of 1000), in whichcase they observed that aerodynamics forces had little im-pact on the liquid structures. On the contrary, Wu andFaeth (1993) suggested that, for a density ratio of<500,aerodynamic effects start to influence the breakup. Be-cause most engineering applications involve significantlysmaller density ratios (on the order of 40 for diesel injec-tion, 100 for aircraft engines), it is expected that aerody-namic forces should be essential in the atomization pro-cess in many practical combustion devices. In this case,breakup was found to be enhanced, leading to smallerdroplets, and secondary breakup was found to merge withprimary atomization. Note that the idea that aerodynamicforces can contribute to the breakup of liquid jets orig-inates from classical work on non-turbulent atomizationby Levich (1992) and Taylor (1963).
Recently, novel techniques based on x-ray visualiza-tion have emerged, suggesting that significant progresswill be made in experimental visualization of turbulentatomization. Such x-ray visualization has been employedby Wang et al. (2008) to investigate the near-field gasolinedirect injection (GDI) process under realistic conditions.The assessment of the breakup mechanisms was beyondthe scope of their work; however they reported observingthe formation of membranes and related this fact to mech-anisms of air-blast atomization presented by Lasheras andHopfinger (2000). In the near future, these new tech-
niques should allow one to characterize more preciselythe coherent liquid core under engine conditions.
1.2.2 Numerical Work
Because primary atomization represents a challenge forexperimentalists, numerical modeling should provide amuch needed alternative. However, numerical studies ofprimary atomization have also been very sparse. To simu-late two-phase flows, various techniques have been de-veloped, which all enjoy some benefit and suffer fromlimitations. Because no clear gold standard has emergedon how to conduct a numerical simulation of complextwo-phase flows, the number of direct numerical studiesof primary atomization remains limited. Several key is-sues remain, such as the discontinuous nature of the flowproperties across the phase interface, the singularity ofthe surface tension forces, and the very large range ofscales involves in atomization. Thus far, all the simu-lations of turbulent primary atomization published havein common their severe underresolution. De Villiers andGosman (2004) and Bianchi et al. (2007; 2005) conductedlarge-eddy simulation (LES) of the diesel injection, butno subgrid scale (SGS) model for the interfacial physicswas employed. It is unlikely that such an approach couldprovide much information on the atomization process.Menard et al. (2007) simulated a similar problem with-out SGS models, but with significantly lower Reynoldsand Weber numbers. However, it is still unclear whethertheir simulation was properly resolved. Also, they reliedon upwinded schemes and numerical dissipation to en-sure the robustness of their simulations. Finally, Pan andSuga (2006) simulated laminar breakup in the Rayleighregime, but their simulations did not involve turbulent at-omization.
In parallel to these efforts, several numerical stud-ies aimed at understanding the linear stability of liquidjets through the solution of the Orr-Sommerfeld equation.Yecko et al. (2002) and Boeck and Zaleski (2005) pro-vided some detailed analysis of the numerous instabilitymodes, and their relative importance. Such studies arefundamental in the detailed understanding of the theoryof breakup; however, they are limited to the early desta-bilization of the liquid interface under the assumption ofa parallel flow and therefore cannot fully characterize themechanisms of turbulent atomization.
In summary, the fully turbulent breakup of a liquid jethas been considered only rarely, and never has it beensimulated using numerical methods designed for turbu-lence. To successfully tackle this problem, one must care-
Volume 20, Number 4, 2010

314 Desjardins & Pitsch
fully combine each of several key ingredients, includ-ing numerical methods capable of simulating turbulenceproperly, an accurate description of the gas-liquid inter-face, and a robust approach to handle the discontinuousmaterial properties between the two phases.
1.2.3 Modeling Work
An overview of past research on the topic of primary at-omization would be incomplete without an account ofconventional phenomenological models. The objectiveof such models is to reproduce statistically the main fea-tures of the atomization process with modest computa-tional requirements. Many different modeling strategieshave been proposed, based for example, on surface in-stabilities (Patterson and Reitz, 1998), drop shedding (Yiand Reitz, 2004), or cavitation (Kong et al., 1999). How-ever, these models replace the atomization process by theinjection of round liquid blobs directly at the nozzle exit,and therefore, they cannot be expected to provide accu-rate results close to the nozzle. In addition, such mod-els typically assume a main atomization mechanism thatmight not be adequate in all situations, suggesting thatfine-tuning the models against experiments might be nec-essary. Two novel strategies in phenomenological model-ing are also of interest and should be reported here. Theyattempt to bridge the existing gap between overly ex-pensive detailed simulations and oversimplified particle-based phenomenological models, while remaining practi-cally applicable. First, Gorokhovski (2001) proposed toperform stochastic modeling of primary atomization con-sidering the liquid jet depletion as a fragmentation cas-cade with scaling symmetry. Second, Vallet et al. (2001)proposed to solve a transport equation for the mean inter-face density in the context of Reynolds-averaged Navier-Stokes (RANS). These two approaches, along with someselected results, are reviewed in Gorokhovski and Her-rmann (2008) and seem promising.
1.3 Objectives
This work attempts to improve the understanding of pri-mary atomization through detailed numerical simulations.Numerical techniques have matured rapidly in the pastfew years, and the associated increase in computationalpower allow to perform fine simulations of complex tur-bulent problems. By carefully choosing the simulationparameters, turbulent atomization can be simulated, withreasonable confidence in the numerics. The choices made
here are detailed in Section 2. This work has several ob-jectives as follows:
• Establish numerical simulations has a realisticmeans of study of turbulent atomization
• Visualize primary atomization, and compare thecomputed results to available experimental observa-tions
• Identify key atomization mechanisms
• Analyze the effect of the jet Reynolds number
• Analyze the effect of the Weber number
• Investigate the statistics of a turbulent liquid jet
This work is considered a first step toward realistic ap-plications. The density ratio employed is similar to thatof Diesel injection. The Reynolds number is slightly re-duced compared to realistic injectors, however still of theright order of magnitude. The Weber number is reducedmanyfold in order to make the liquid structures tractableon a fixed mesh.
Naturally, all conclusions drawn in this paper are onlyvalid for the limited range of parameters explored here.Simulations at higher Reynolds and Weber numbers willneed to be conducted in order to generalize these find-ings. Needless to say, conducting direct numerical sim-ulation of primary atomization with realistic parameterswill remain out of computational reach for many years,but the information extracted from lower Reynolds andWeber number simulations should provide useful infor-mation to guide model development.
2. MATHEMATICAL FORMULATION
To simulate turbulent two-phase flows, the incompress-ible Navier-Stokes equations are introduced
∂u∂t
+u ·∇u = −1ρ∇p+
1ρ∇·(µ [∇u +∇uT
])+g (1)
whereu is the velocity field,ρ is the density,p is the pres-sure,g is the gravitational acceleration, andµ is the dy-namic viscosity. The continuity equation can be rewrittenin terms of the incompressibility constraint
∂ρ
∂t+∇ · (ρu) =
∂ρ
∂t+ u · ∇ρ = 0 (2)
The interfaceΓ separates the liquid from the gaseousphase. The material properties in each phase are constant,
Atomization and Sprays
Numerical Investigation of Turbulent Atomization 315
but differ between the phases. Thus, we writeρ = ρl
in the liquid phase andρ = ρg in the gas phase. Simi-larly, µ = µl in the liquid andµ = µg in the gas. At theinterfaceΓ, the jumps in material properties are written[ρ]Γ = ρl − ρg and[µ]Γ = µl − µg for the density andthe viscosity, respectively. Because the velocity field iscontinuous,[u]Γ = 0. However, the pressure displays ajump between the two phases that can be written
[p]Γ = σκ + 2 [µ]Γ nT · ∇u · n (3)
whereσ is the surface tension coefficient,κ is the inter-face curvature, andn is the interface normal.
3. NUMERICAL METHODOLOGY
3.1 Navier-Stokes Solver
The flow solver used in this work is NGA. This solverand the numerical methods it uses was extensively de-scribed in Desjardins et al. (2008a). This solver was orig-inally designed for direct numerical simulations (DNS)and large eddy simulations (LES) of complex, turbulent,reactive flows. Consequently, it is based on numericalmethods that are discretely mass, momentum, and en-ergy conserving, in order to avoid all numerical dissipa-tion that is known to be detrimental to the simulation ofturbulence (Desjardins et al., 2008a; Park et al., 2004).Although NGA allows for arbitrarily high spatial accu-racy, the current simulations are performed using second-order spatial discretization. The temporal integration isbased on the second-order accurate, semi-implicit itera-tive Crank-Nicolson scheme of Pierce and Moin (2001).These techniques have often been used with great successto conduct detailed numerical studies of various turbulentflows (Desjardins and Pitsch, 2006; Knudsen and Pitsch,2008, 2009; Wang, 2007).
3.2 Spectrally Refined Interface Approach
In order to avoid having to transport the discontinuousdensity field, Eq. (2) is replaced by a more convenientequation (i.e., the so-called level set equation), which al-lows one to track the interface location as an iso-contourG0 of a smooth functionG. By solving
∂G
∂t+ u · ∇G = 0 (4)
Various numerical techniques have been devised to solveEq. (4). Most importantly, a level set methodology re-quires an accurate transport of the interface location, even
at the smallest resolved scales. Also of great importanceis the capability of a level-set scheme to provide an ac-curate interfacial curvature. Recently, a spectrally refinedinterface (SRI) approach was developed (Desjardins et al.,2008b) that satisfies these two constraints by enabling asubcell resolution of the interface. By introducing a num-ber of collocation points in each grid cell, SRI providesa polynomial reconstruction of the level-set functionG.The resulting approach essentially removes mass conser-vation issues that are known to plague level-set methodsand provide excellent accuracy of the interface transporteven at the smallest resolved scales.
3.3 Ghost Fluid Method
The discontinuous material properties of the flow as wellas the singular surface tension force are treated using theghost fluid method (GFM) of Fedkiw et al. (1999). GFMenables an accurate description of the flow at the inter-face, by treating all discontinuities in a sharp manner.The idea behind this method is to use standard differenti-ation operators across discontinuous variables by extend-ing them using Taylor series expansions, and then to addthe jumps explicitly. This results in an efficient and ro-bust method that treats all the difficulties associated withtwo-phase flows with good accuracy. The results of sev-eral test cases in previous publications (Desjardins et al.,2008b; Desjardins and Pitsch, 2009) suggest that GFMprovides good accuracy even on very few (<10) gridpoints, for canonical problems such as Rayleigh breakup,Rayleigh-Taylor, or the decay of a standing wave. There-fore, this approach seems appropriate to handle the smallstructures that are expected in primary atomization.
4. TURBULENT PLANAR JET
4.1 Flow Configuration
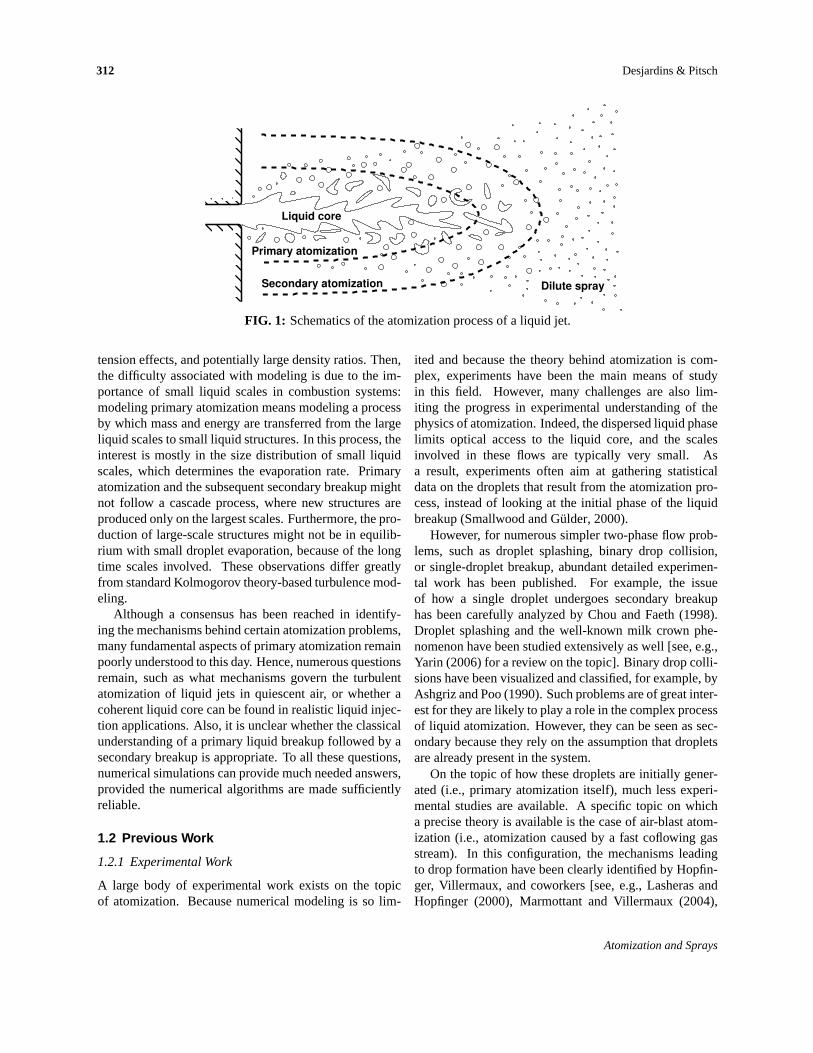
The flow considered in this section consists of a tempo-rally evolving planar liquid jet in quiescent air. Althoughmost realistic injection devices rely on round nozzles, thecomputational requirement of a planar jet simulation istypically lower because of the additional homogeneousperiodic direction. Naturally, some features of round liq-uid jets, such as Rayleigh instabilities, will be missingfrom the planar jet simulations; however, it is expectedthat most aspects of the flow will be identical. Figure 2shows a sketch of the flow configuration. The liquidjet is initially of height H, and its bulk velocity isU0.The computational domain is periodic in the streamwiseand spanwise directions,x andz, respectively, while in
Volume 20, Number 4, 2010
316 Desjardins & Pitsch
µ=µ ρ=ρg g
µ=µ ρ=ρg g
U0
µ=µ l ρ=ρl
H6H
4H
4H
FIG. 2: Schematics of the temporally evolving planar jet.
they direction, a symmetry condition is employed. The4H×6H×4H domain is discretized on a256×384×256uniform mesh, leading to∆x = ∆y = ∆z = H/64.The initial velocity is obtained from a precursor simula-tion of a periodic channel flow. This precursor simulationis conducted in a4H ×H × 4H domain, discretized on a256×192×256 mesh, using the liquid material properties.Once the flow is established (i.e., once the friction coeffi-cient reaches a constant value), the simulation is stoppedand the velocity field is recorded. This field is then in-terpolated on the jet mesh to initialize the velocity in theregion−H/2 < y < H/2, while the velocity outside ofthis region is set to zero. Even though the initial coexis-tence between a turbulent liquid and a still gas is a greatlysimplified representation of turbulent liquid injection, thepresence of realistic turbulence ensures that the planar jetdestabilizes and develops rapidly. Throughout this work,time t? will be nondimensionalized usingt = t?U0/H.
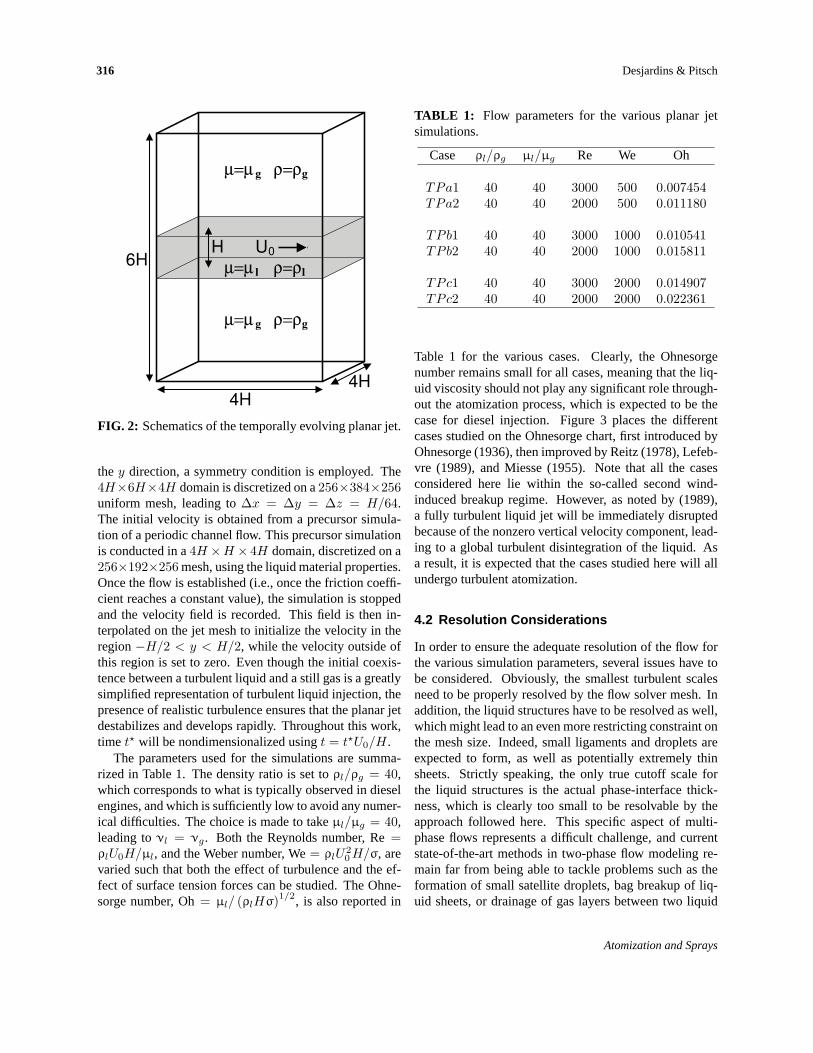
The parameters used for the simulations are summa-rized in Table 1. The density ratio is set toρl/ρg = 40,which corresponds to what is typically observed in dieselengines, and which is sufficiently low to avoid any numer-ical difficulties. The choice is made to takeµl/µg = 40,leading toνl = νg. Both the Reynolds number, Re=ρlU0H/µl, and the Weber number, We= ρlU
20 H/σ, are
varied such that both the effect of turbulence and the ef-fect of surface tension forces can be studied. The Ohne-sorge number, Oh= µl/ (ρlHσ)1/2, is also reported in
TABLE 1: Flow parameters for the various planar jetsimulations.
Case ρl/ρg µl/µg Re We Oh
TPa1 40 40 3000 500 0.007454TPa2 40 40 2000 500 0.011180
TPb1 40 40 3000 1000 0.010541TPb2 40 40 2000 1000 0.015811
TPc1 40 40 3000 2000 0.014907TPc2 40 40 2000 2000 0.022361
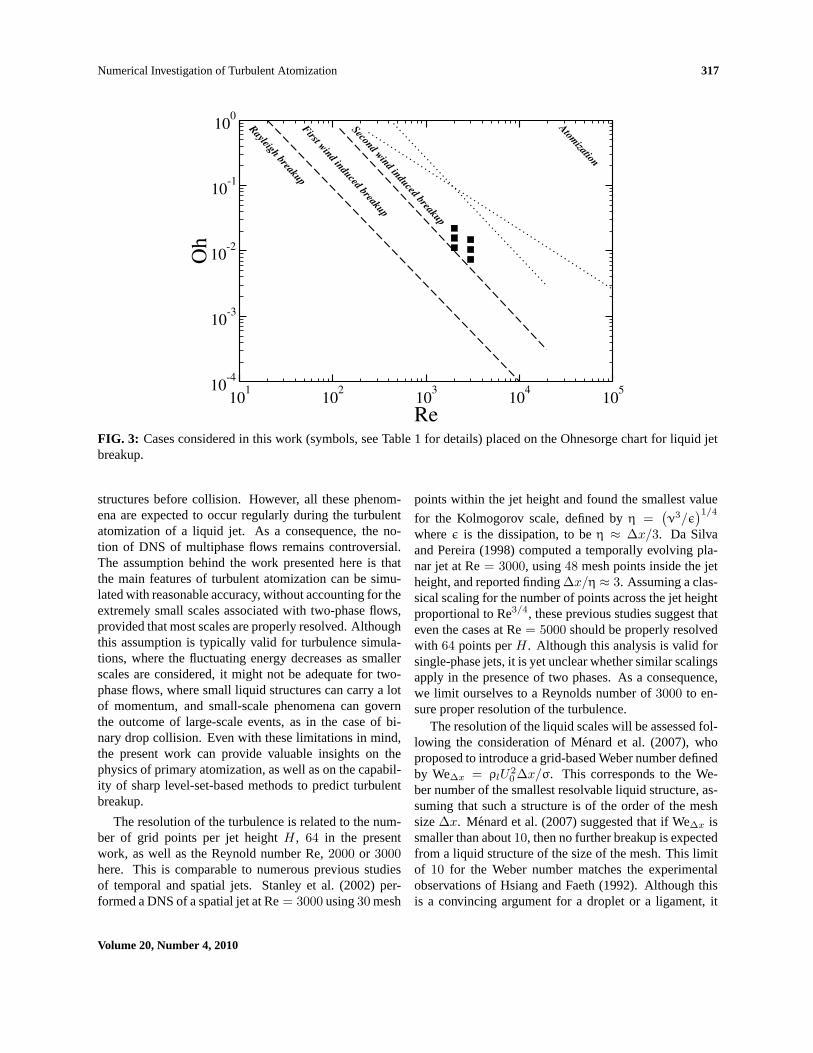
Table 1 for the various cases. Clearly, the Ohnesorgenumber remains small for all cases, meaning that the liq-uid viscosity should not play any significant role through-out the atomization process, which is expected to be thecase for diesel injection. Figure 3 places the differentcases studied on the Ohnesorge chart, first introduced byOhnesorge (1936), then improved by Reitz (1978), Lefeb-vre (1989), and Miesse (1955). Note that all the casesconsidered here lie within the so-called second wind-induced breakup regime. However, as noted by (1989),a fully turbulent liquid jet will be immediately disruptedbecause of the nonzero vertical velocity component, lead-ing to a global turbulent disintegration of the liquid. Asa result, it is expected that the cases studied here will allundergo turbulent atomization.
4.2 Resolution Considerations
In order to ensure the adequate resolution of the flow forthe various simulation parameters, several issues have tobe considered. Obviously, the smallest turbulent scalesneed to be properly resolved by the flow solver mesh. Inaddition, the liquid structures have to be resolved as well,which might lead to an even more restricting constraint onthe mesh size. Indeed, small ligaments and droplets areexpected to form, as well as potentially extremely thinsheets. Strictly speaking, the only true cutoff scale forthe liquid structures is the actual phase-interface thick-ness, which is clearly too small to be resolvable by theapproach followed here. This specific aspect of multi-phase flows represents a difficult challenge, and currentstate-of-the-art methods in two-phase flow modeling re-main far from being able to tackle problems such as theformation of small satellite droplets, bag breakup of liq-uid sheets, or drainage of gas layers between two liquid
Atomization and Sprays
Numerical Investigation of Turbulent Atomization 317
101
102
103
104
105
Re
10-4
10-3
10-2
10-1
100
Oh
Rayleigh breakup
First w
ind induced breakup
Second wind induced breakup
Atom
ization
FIG. 3: Cases considered in this work (symbols, see Table 1 for details) placed on the Ohnesorge chart for liquid jetbreakup.
structures before collision. However, all these phenom-ena are expected to occur regularly during the turbulentatomization of a liquid jet. As a consequence, the no-tion of DNS of multiphase flows remains controversial.The assumption behind the work presented here is thatthe main features of turbulent atomization can be simu-lated with reasonable accuracy, without accounting for theextremely small scales associated with two-phase flows,provided that most scales are properly resolved. Althoughthis assumption is typically valid for turbulence simula-tions, where the fluctuating energy decreases as smallerscales are considered, it might not be adequate for two-phase flows, where small liquid structures can carry a lotof momentum, and small-scale phenomena can governthe outcome of large-scale events, as in the case of bi-nary drop collision. Even with these limitations in mind,the present work can provide valuable insights on thephysics of primary atomization, as well as on the capabil-ity of sharp level-set-based methods to predict turbulentbreakup.
The resolution of the turbulence is related to the num-ber of grid points per jet heightH, 64 in the presentwork, as well as the Reynold number Re,2000 or 3000here. This is comparable to numerous previous studiesof temporal and spatial jets. Stanley et al. (2002) per-formed a DNS of a spatial jet at Re= 3000 using30 mesh
points within the jet height and found the smallest value
for the Kolmogorov scale, defined byη =(ν3/ε
)1/4
whereε is the dissipation, to beη ≈ ∆x/3. Da Silvaand Pereira (1998) computed a temporally evolving pla-nar jet at Re= 3000, using48 mesh points inside the jetheight, and reported finding∆x/η ≈ 3. Assuming a clas-sical scaling for the number of points across the jet heightproportional to Re3/4, these previous studies suggest thateven the cases at Re= 5000 should be properly resolvedwith 64 points perH. Although this analysis is valid forsingle-phase jets, it is yet unclear whether similar scalingsapply in the presence of two phases. As a consequence,we limit ourselves to a Reynolds number of3000 to en-sure proper resolution of the turbulence.
The resolution of the liquid scales will be assessed fol-lowing the consideration of Menard et al. (2007), whoproposed to introduce a grid-based Weber number definedby We∆x = ρlU
20 ∆x/σ. This corresponds to the We-
ber number of the smallest resolvable liquid structure, as-suming that such a structure is of the order of the meshsize∆x. Menard et al. (2007) suggested that if We∆x issmaller than about10, then no further breakup is expectedfrom a liquid structure of the size of the mesh. This limitof 10 for the Weber number matches the experimentalobservations of Hsiang and Faeth (1992). Although thisis a convincing argument for a droplet or a ligament, it
Volume 20, Number 4, 2010
318 Desjardins & Pitsch
does not apply easily to a liquid sheet, for which breakupcould still obviously occur. This brings us back to theprevious part of the discussion on what can realisticallybe resolved in complex two-phase flow simulations. Inour case, because the SRI approach provides subcell in-terfacial resolution, structures as small as∆x/p, wherepis the order of the polynomials used in the level-set func-tion reconstruction, should become tractable, at least inthe sense that they should be maintained and transported,even though the flow around them might not be prop-erly captured. This suggests that another Weber number,We∆x/p = ρlU
20 ∆x/(pσ), should be defined as well. For
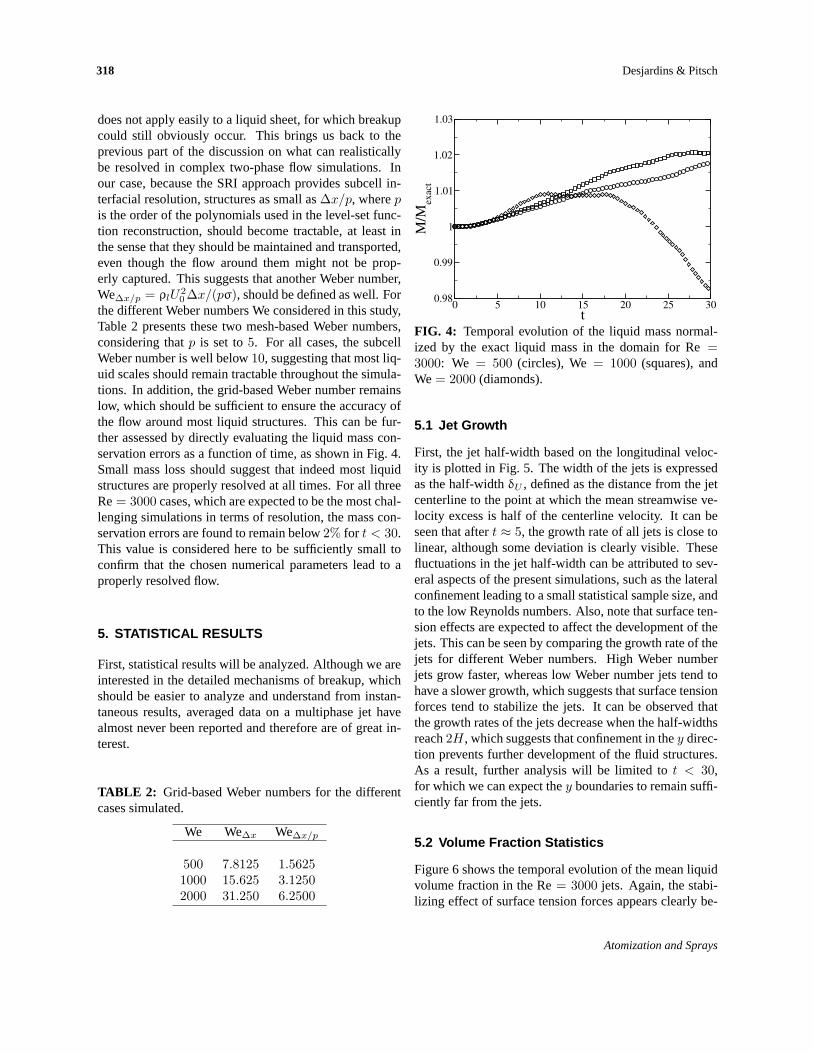
the different Weber numbers We considered in this study,Table 2 presents these two mesh-based Weber numbers,considering thatp is set to5. For all cases, the subcellWeber number is well below10, suggesting that most liq-uid scales should remain tractable throughout the simula-tions. In addition, the grid-based Weber number remainslow, which should be sufficient to ensure the accuracy ofthe flow around most liquid structures. This can be fur-ther assessed by directly evaluating the liquid mass con-servation errors as a function of time, as shown in Fig. 4.Small mass loss should suggest that indeed most liquidstructures are properly resolved at all times. For all threeRe= 3000 cases, which are expected to be the most chal-lenging simulations in terms of resolution, the mass con-servation errors are found to remain below2% for t < 30.This value is considered here to be sufficiently small toconfirm that the chosen numerical parameters lead to aproperly resolved flow.
5. STATISTICAL RESULTS
First, statistical results will be analyzed. Although we areinterested in the detailed mechanisms of breakup, whichshould be easier to analyze and understand from instan-taneous results, averaged data on a multiphase jet havealmost never been reported and therefore are of great in-terest.
TABLE 2: Grid-based Weber numbers for the differentcases simulated.
We We∆x We∆x/p
500 7.8125 1.56251000 15.625 3.12502000 31.250 6.2500
0 5 10 15 20 25 30
t
0.98
0.99
1
1.01
1.02
1.03
M/Mexact
FIG. 4: Temporal evolution of the liquid mass normal-ized by the exact liquid mass in the domain for Re=3000: We = 500 (circles), We= 1000 (squares), andWe = 2000 (diamonds).
5.1 Jet Growth
First, the jet half-width based on the longitudinal veloc-ity is plotted in Fig. 5. The width of the jets is expressedas the half-widthδU , defined as the distance from the jetcenterline to the point at which the mean streamwise ve-locity excess is half of the centerline velocity. It can beseen that aftert ≈ 5, the growth rate of all jets is close tolinear, although some deviation is clearly visible. Thesefluctuations in the jet half-width can be attributed to sev-eral aspects of the present simulations, such as the lateralconfinement leading to a small statistical sample size, andto the low Reynolds numbers. Also, note that surface ten-sion effects are expected to affect the development of thejets. This can be seen by comparing the growth rate of thejets for different Weber numbers. High Weber numberjets grow faster, whereas low Weber number jets tend tohave a slower growth, which suggests that surface tensionforces tend to stabilize the jets. It can be observed thatthe growth rates of the jets decrease when the half-widthsreach2H, which suggests that confinement in they direc-tion prevents further development of the fluid structures.As a result, further analysis will be limited tot < 30,for which we can expect they boundaries to remain suffi-ciently far from the jets.
5.2 Volume Fraction Statistics
Figure 6 shows the temporal evolution of the mean liquidvolume fraction in the Re= 3000 jets. Again, the stabi-lizing effect of surface tension forces appears clearly be-
Atomization and Sprays

Numerical Investigation of Turbulent Atomization 319
0 10 20 30 40 50 60
t
0
0.5
1
1.5
2
2.5
3δu/H
(a) Re= 2000
0 10 20 30 40 50 60
t
0
0.5
1
1.5
2
2.5
3
δu/H
(b) Re= 3000
FIG. 5: Time evolution of jet half-width: We= 500 (dotted line), We= 1000 (dashed line), and We= 2000 (solidline).
-3 -2 -1 0 1 2 3
y/H
0
0.2
0.4
0.6
0.8
1
1.2
Liq
uid
vo
lum
e f
racti
on
(a) We= 500
-3 -2 -1 0 1 2 3
y/H
0
0.2
0.4
0.6
0.8
1
1.2
Liq
uid
volu
me f
racti
on
(b) We= 1000
-3 -2 -1 0 1 2 3
y/H
0
0.2
0.4
0.6
0.8
1
1.2
Liq
uid
volu
me f
racti
on
(c) We= 2000
FIG. 6: Mean profiles of liquid volume fraction for the planar jets at different times for Re= 3000 and various Webernumbers. Arrows indicate increasing time (t = 1, 10, 20, 30).
Volume 20, Number 4, 2010
320 Desjardins & Pitsch
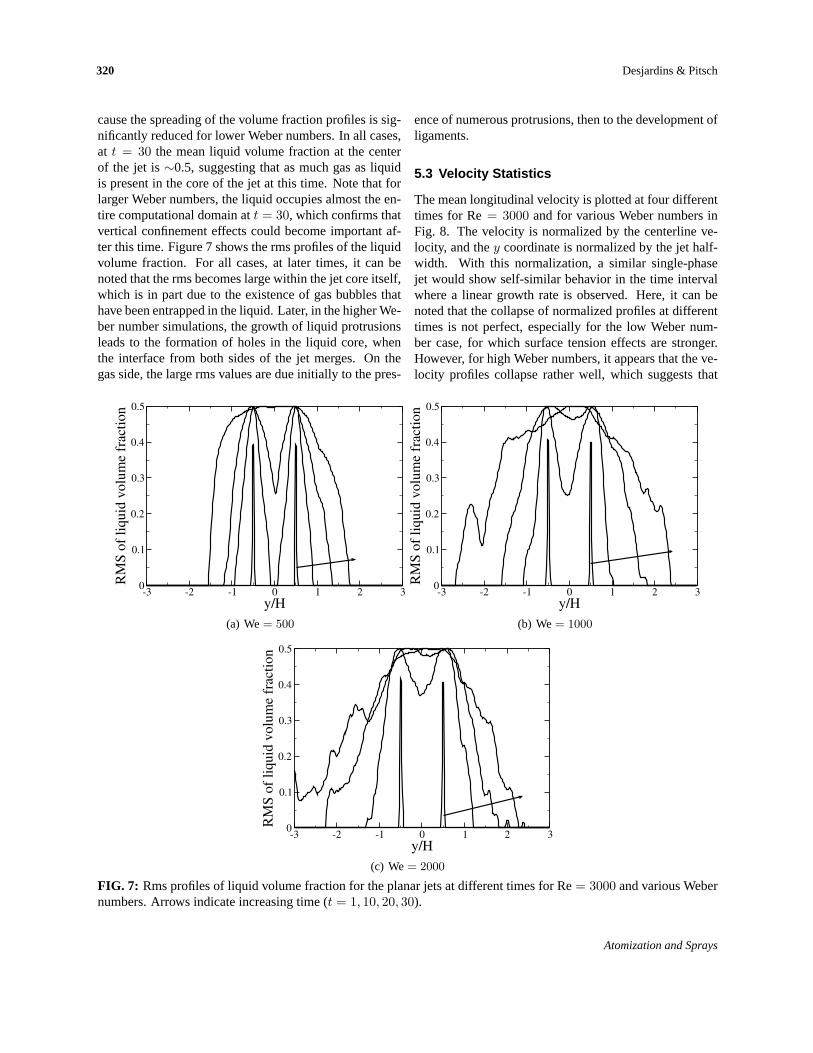
cause the spreading of the volume fraction profiles is sig-nificantly reduced for lower Weber numbers. In all cases,at t = 30 the mean liquid volume fraction at the centerof the jet is∼0.5, suggesting that as much gas as liquidis present in the core of the jet at this time. Note that forlarger Weber numbers, the liquid occupies almost the en-tire computational domain att = 30, which confirms thatvertical confinement effects could become important af-ter this time. Figure 7 shows the rms profiles of the liquidvolume fraction. For all cases, at later times, it can benoted that the rms becomes large within the jet core itself,which is in part due to the existence of gas bubbles thathave been entrapped in the liquid. Later, in the higher We-ber number simulations, the growth of liquid protrusionsleads to the formation of holes in the liquid core, whenthe interface from both sides of the jet merges. On thegas side, the large rms values are due initially to the pres-
ence of numerous protrusions, then to the development ofligaments.
5.3 Velocity Statistics
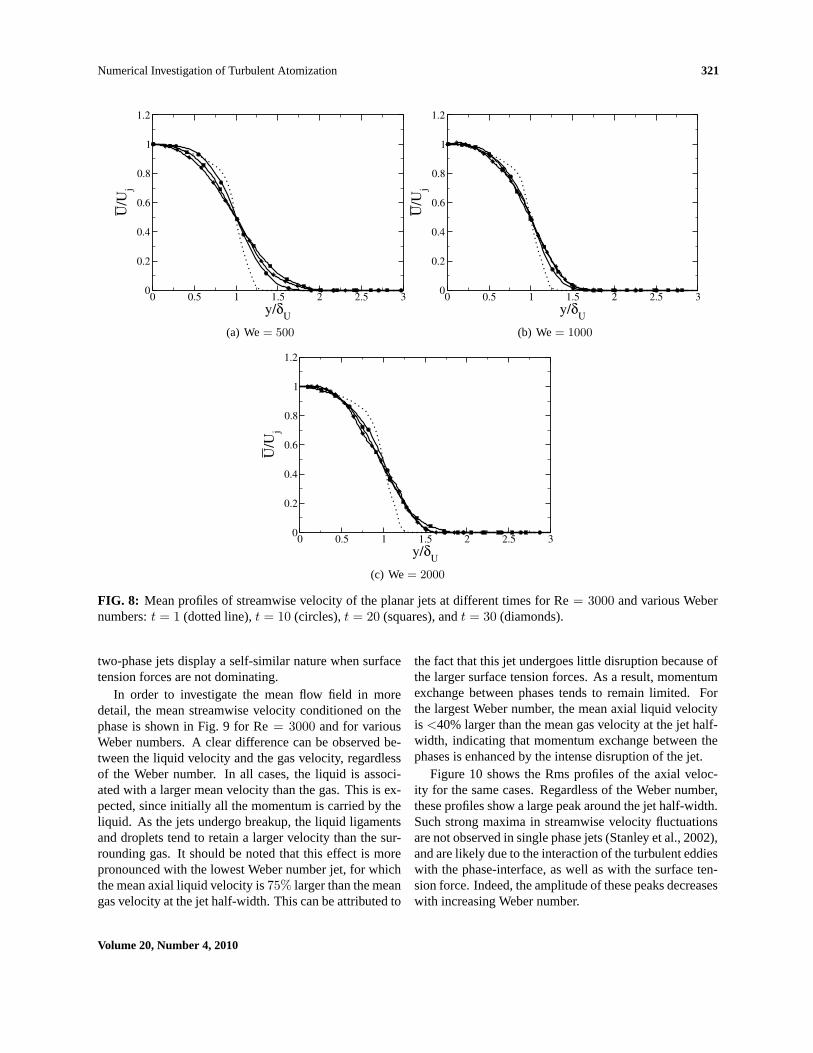
The mean longitudinal velocity is plotted at four differenttimes for Re= 3000 and for various Weber numbers inFig. 8. The velocity is normalized by the centerline ve-locity, and they coordinate is normalized by the jet half-width. With this normalization, a similar single-phasejet would show self-similar behavior in the time intervalwhere a linear growth rate is observed. Here, it can benoted that the collapse of normalized profiles at differenttimes is not perfect, especially for the low Weber num-ber case, for which surface tension effects are stronger.However, for high Weber numbers, it appears that the ve-locity profiles collapse rather well, which suggests that
-3 -2 -1 0 1 2 3
y/H
0
0.1
0.2
0.3
0.4
0.5
RM
S o
f li
quid
volu
me f
racti
on
(a) We= 500
-3 -2 -1 0 1 2 3
y/H
0
0.1
0.2
0.3
0.4
0.5
RM
S o
f li
quid
volu
me f
racti
on
(b) We= 1000
-3 -2 -1 0 1 2 3
y/H
0
0.1
0.2
0.3
0.4
0.5
RM
S o
f li
quid
volu
me f
racti
on
(c) We= 2000
FIG. 7: Rms profiles of liquid volume fraction for the planar jets at different times for Re= 3000 and various Webernumbers. Arrows indicate increasing time (t = 1, 10, 20, 30).
Atomization and Sprays
Numerical Investigation of Turbulent Atomization 321
0 0.5 1 1.5 2 2.5 3
y/δU
0
0.2
0.4
0.6
0.8
1
1.2U/Uj
(a) We= 500
0 0.5 1 1.5 2 2.5 3
y/δU
0
0.2
0.4
0.6
0.8
1
1.2
U/Uj
(b) We= 1000
0 0.5 1 1.5 2 2.5 3
y/δU
0
0.2
0.4
0.6
0.8
1
1.2
U/Uj
(c) We= 2000
FIG. 8: Mean profiles of streamwise velocity of the planar jets at different times for Re= 3000 and various Webernumbers:t = 1 (dotted line),t = 10 (circles),t = 20 (squares), andt = 30 (diamonds).
two-phase jets display a self-similar nature when surfacetension forces are not dominating.
In order to investigate the mean flow field in moredetail, the mean streamwise velocity conditioned on thephase is shown in Fig. 9 for Re= 3000 and for variousWeber numbers. A clear difference can be observed be-tween the liquid velocity and the gas velocity, regardlessof the Weber number. In all cases, the liquid is associ-ated with a larger mean velocity than the gas. This is ex-pected, since initially all the momentum is carried by theliquid. As the jets undergo breakup, the liquid ligamentsand droplets tend to retain a larger velocity than the sur-rounding gas. It should be noted that this effect is morepronounced with the lowest Weber number jet, for whichthe mean axial liquid velocity is75% larger than the meangas velocity at the jet half-width. This can be attributed to
the fact that this jet undergoes little disruption because ofthe larger surface tension forces. As a result, momentumexchange between phases tends to remain limited. Forthe largest Weber number, the mean axial liquid velocityis <40% larger than the mean gas velocity at the jet half-width, indicating that momentum exchange between thephases is enhanced by the intense disruption of the jet.
Figure 10 shows the Rms profiles of the axial veloc-ity for the same cases. Regardless of the Weber number,these profiles show a large peak around the jet half-width.Such strong maxima in streamwise velocity fluctuationsare not observed in single phase jets (Stanley et al., 2002),and are likely due to the interaction of the turbulent eddieswith the phase-interface, as well as with the surface ten-sion force. Indeed, the amplitude of these peaks decreaseswith increasing Weber number.
Volume 20, Number 4, 2010
322 Desjardins & Pitsch
0 0.5 1 1.5 2 2.5
y/δU
0
0.2
0.4
0.6
0.8
1
1.2U/Uj
(a) We= 500
0 0.5 1 1.5 2 2.5
y/δU
0
0.2
0.4
0.6
0.8
1
1.2
U/Uj
(b) We= 1000
0 0.5 1 1.5 2 2.5
y/δU
0
0.2
0.4
0.6
0.8
1
1.2
U/Uj
(c) We= 2000
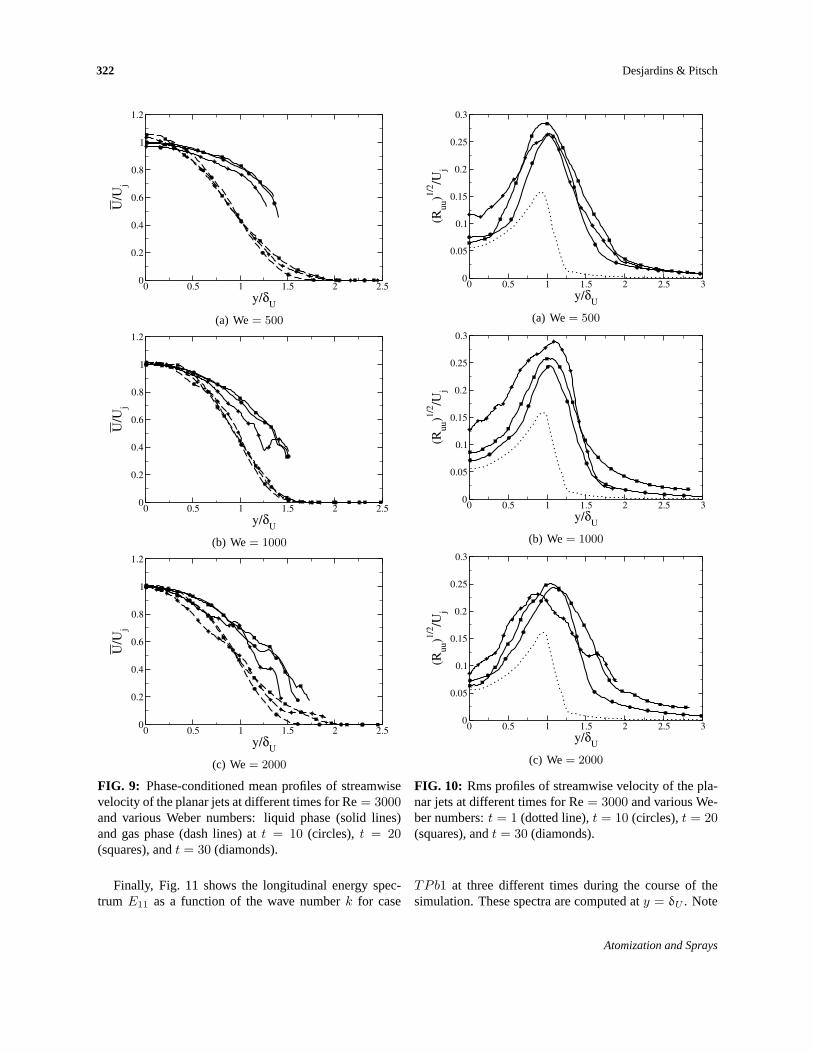
FIG. 9: Phase-conditioned mean profiles of streamwisevelocity of the planar jets at different times for Re= 3000and various Weber numbers: liquid phase (solid lines)and gas phase (dash lines) att = 10 (circles), t = 20(squares), andt = 30 (diamonds).
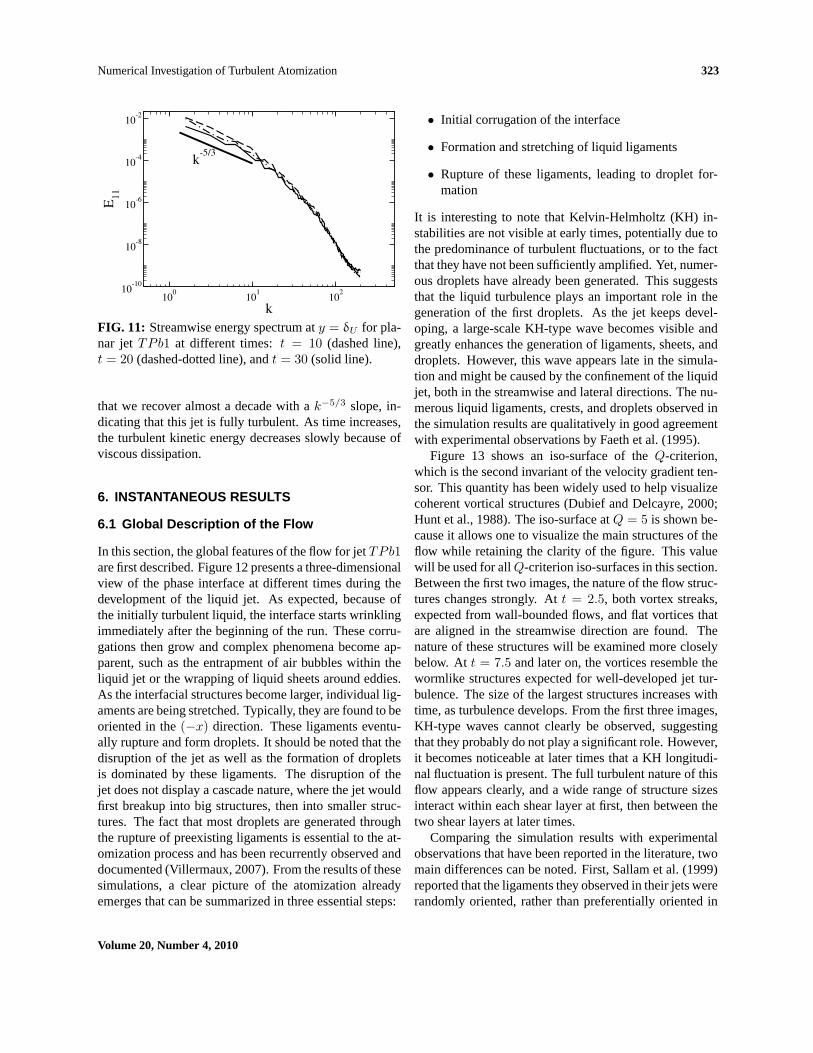
Finally, Fig. 11 shows the longitudinal energy spec-trum E11 as a function of the wave numberk for case
0 0.5 1 1.5 2 2.5 3
y/δU
0
0.05
0.1
0.15
0.2
0.25
0.3
(Ruu)1/2/Uj
(a) We= 500
0 0.5 1 1.5 2 2.5 3
y/δU
0
0.05
0.1
0.15
0.2
0.25
0.3
(Ruu)1/2/Uj
(b) We= 1000
0 0.5 1 1.5 2 2.5 3
y/δU
0
0.05
0.1
0.15
0.2
0.25
0.3
(Ruu)1/2/Uj
(c) We= 2000
FIG. 10: Rms profiles of streamwise velocity of the pla-nar jets at different times for Re= 3000 and various We-ber numbers:t = 1 (dotted line),t = 10 (circles),t = 20(squares), andt = 30 (diamonds).
TPb1 at three different times during the course of thesimulation. These spectra are computed aty = δU . Note
Atomization and Sprays
Numerical Investigation of Turbulent Atomization 323
100
101
102
k
10-10
10-8
10-6
10-4
10-2
E11
k-5/3
FIG. 11: Streamwise energy spectrum aty = δU for pla-nar jet TPb1 at different times:t = 10 (dashed line),t = 20 (dashed-dotted line), andt = 30 (solid line).
that we recover almost a decade with ak−5/3 slope, in-dicating that this jet is fully turbulent. As time increases,the turbulent kinetic energy decreases slowly because ofviscous dissipation.
6. INSTANTANEOUS RESULTS
6.1 Global Description of the Flow
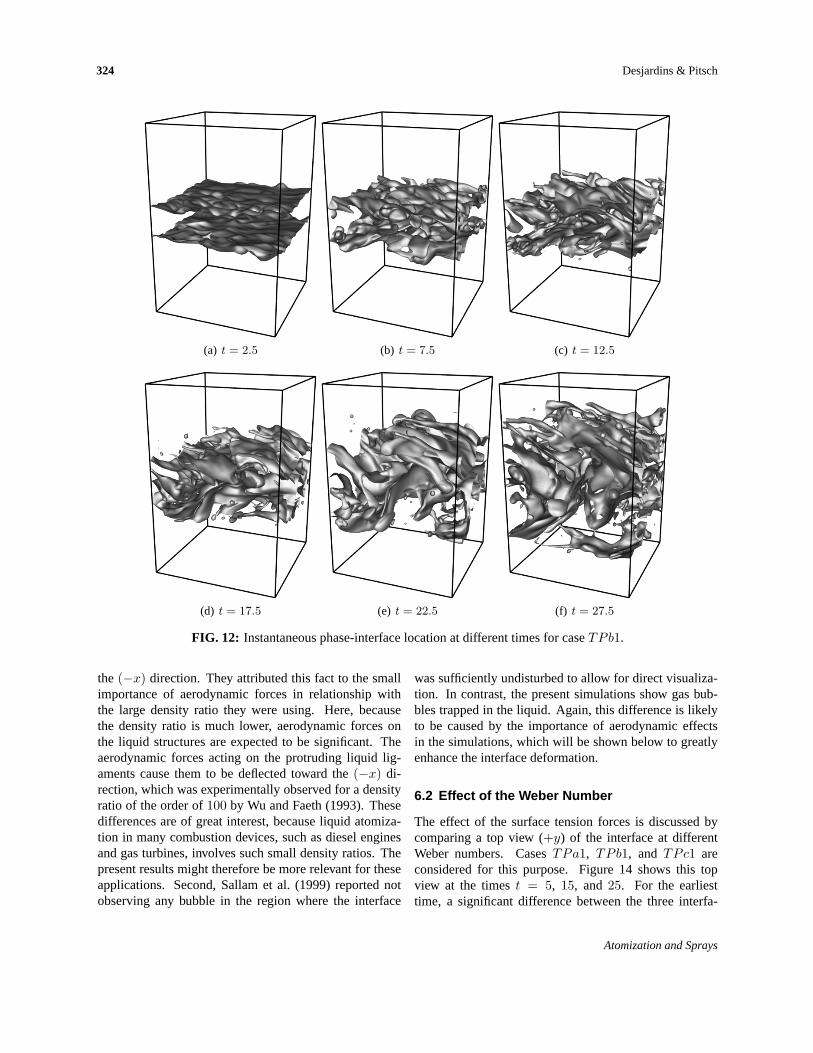
In this section, the global features of the flow for jetTPb1are first described. Figure 12 presents a three-dimensionalview of the phase interface at different times during thedevelopment of the liquid jet. As expected, because ofthe initially turbulent liquid, the interface starts wrinklingimmediately after the beginning of the run. These corru-gations then grow and complex phenomena become ap-parent, such as the entrapment of air bubbles within theliquid jet or the wrapping of liquid sheets around eddies.As the interfacial structures become larger, individual lig-aments are being stretched. Typically, they are found to beoriented in the(−x) direction. These ligaments eventu-ally rupture and form droplets. It should be noted that thedisruption of the jet as well as the formation of dropletsis dominated by these ligaments. The disruption of thejet does not display a cascade nature, where the jet wouldfirst breakup into big structures, then into smaller struc-tures. The fact that most droplets are generated throughthe rupture of preexisting ligaments is essential to the at-omization process and has been recurrently observed anddocumented (Villermaux, 2007). From the results of thesesimulations, a clear picture of the atomization alreadyemerges that can be summarized in three essential steps:
• Initial corrugation of the interface
• Formation and stretching of liquid ligaments
• Rupture of these ligaments, leading to droplet for-mation
It is interesting to note that Kelvin-Helmholtz (KH) in-stabilities are not visible at early times, potentially due tothe predominance of turbulent fluctuations, or to the factthat they have not been sufficiently amplified. Yet, numer-ous droplets have already been generated. This suggeststhat the liquid turbulence plays an important role in thegeneration of the first droplets. As the jet keeps devel-oping, a large-scale KH-type wave becomes visible andgreatly enhances the generation of ligaments, sheets, anddroplets. However, this wave appears late in the simula-tion and might be caused by the confinement of the liquidjet, both in the streamwise and lateral directions. The nu-merous liquid ligaments, crests, and droplets observed inthe simulation results are qualitatively in good agreementwith experimental observations by Faeth et al. (1995).
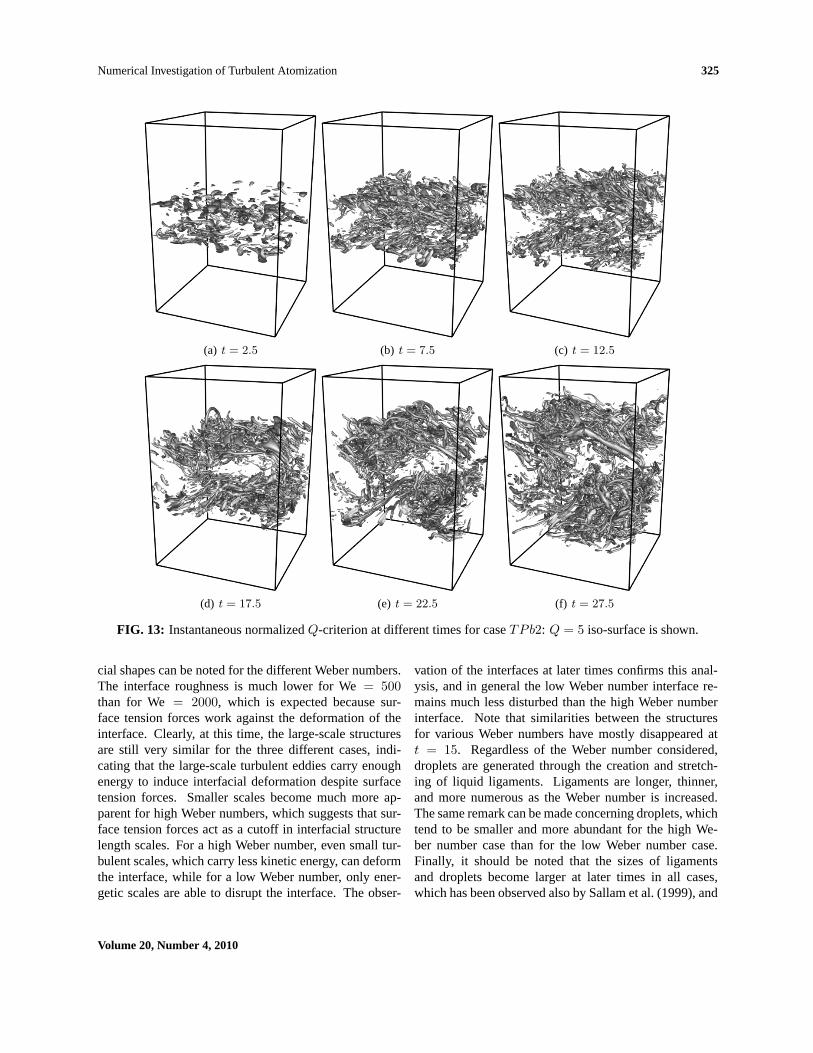
Figure 13 shows an iso-surface of theQ-criterion,which is the second invariant of the velocity gradient ten-sor. This quantity has been widely used to help visualizecoherent vortical structures (Dubief and Delcayre, 2000;Hunt et al., 1988). The iso-surface atQ = 5 is shown be-cause it allows one to visualize the main structures of theflow while retaining the clarity of the figure. This valuewill be used for allQ-criterion iso-surfaces in this section.Between the first two images, the nature of the flow struc-tures changes strongly. Att = 2.5, both vortex streaks,expected from wall-bounded flows, and flat vortices thatare aligned in the streamwise direction are found. Thenature of these structures will be examined more closelybelow. At t = 7.5 and later on, the vortices resemble thewormlike structures expected for well-developed jet tur-bulence. The size of the largest structures increases withtime, as turbulence develops. From the first three images,KH-type waves cannot clearly be observed, suggestingthat they probably do not play a significant role. However,it becomes noticeable at later times that a KH longitudi-nal fluctuation is present. The full turbulent nature of thisflow appears clearly, and a wide range of structure sizesinteract within each shear layer at first, then between thetwo shear layers at later times.
Comparing the simulation results with experimentalobservations that have been reported in the literature, twomain differences can be noted. First, Sallam et al. (1999)reported that the ligaments they observed in their jets wererandomly oriented, rather than preferentially oriented in
Volume 20, Number 4, 2010
324 Desjardins & Pitsch
(a) t = 2.5 (b) t = 7.5 (c) t = 12.5
(d) t = 17.5 (e) t = 22.5 (f) t = 27.5
FIG. 12: Instantaneous phase-interface location at different times for caseTPb1.
the (−x) direction. They attributed this fact to the smallimportance of aerodynamic forces in relationship withthe large density ratio they were using. Here, becausethe density ratio is much lower, aerodynamic forces onthe liquid structures are expected to be significant. Theaerodynamic forces acting on the protruding liquid lig-aments cause them to be deflected toward the(−x) di-rection, which was experimentally observed for a densityratio of the order of100 by Wu and Faeth (1993). Thesedifferences are of great interest, because liquid atomiza-tion in many combustion devices, such as diesel enginesand gas turbines, involves such small density ratios. Thepresent results might therefore be more relevant for theseapplications. Second, Sallam et al. (1999) reported notobserving any bubble in the region where the interface
was sufficiently undisturbed to allow for direct visualiza-tion. In contrast, the present simulations show gas bub-bles trapped in the liquid. Again, this difference is likelyto be caused by the importance of aerodynamic effectsin the simulations, which will be shown below to greatlyenhance the interface deformation.
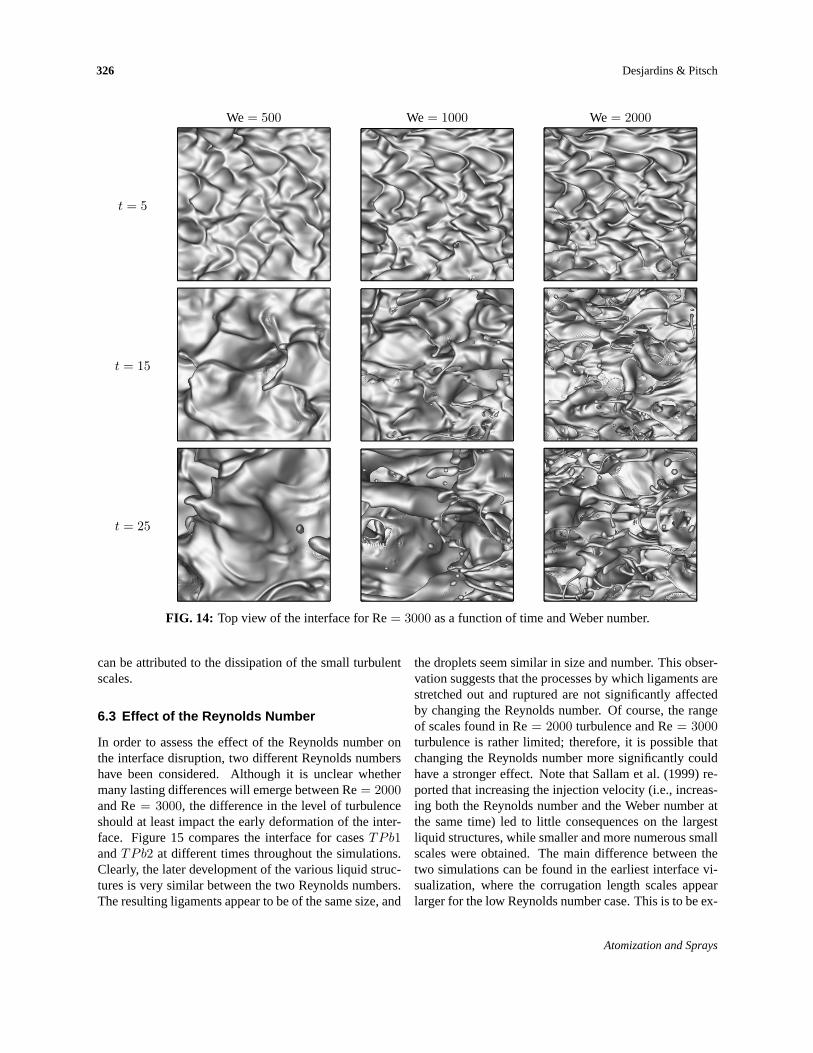
6.2 Effect of the Weber Number
The effect of the surface tension forces is discussed bycomparing a top view (+y) of the interface at differentWeber numbers. CasesTPa1, TPb1, and TPc1 areconsidered for this purpose. Figure 14 shows this topview at the timest = 5, 15, and25. For the earliesttime, a significant difference between the three interfa-
Atomization and Sprays
Numerical Investigation of Turbulent Atomization 325
(a) t = 2.5 (b) t = 7.5 (c) t = 12.5
(d) t = 17.5 (e) t = 22.5 (f) t = 27.5
FIG. 13: Instantaneous normalizedQ-criterion at different times for caseTPb2: Q = 5 iso-surface is shown.
cial shapes can be noted for the different Weber numbers.The interface roughness is much lower for We= 500than for We = 2000, which is expected because sur-face tension forces work against the deformation of theinterface. Clearly, at this time, the large-scale structuresare still very similar for the three different cases, indi-cating that the large-scale turbulent eddies carry enoughenergy to induce interfacial deformation despite surfacetension forces. Smaller scales become much more ap-parent for high Weber numbers, which suggests that sur-face tension forces act as a cutoff in interfacial structurelength scales. For a high Weber number, even small tur-bulent scales, which carry less kinetic energy, can deformthe interface, while for a low Weber number, only ener-getic scales are able to disrupt the interface. The obser-
vation of the interfaces at later times confirms this anal-ysis, and in general the low Weber number interface re-mains much less disturbed than the high Weber numberinterface. Note that similarities between the structuresfor various Weber numbers have mostly disappeared att = 15. Regardless of the Weber number considered,droplets are generated through the creation and stretch-ing of liquid ligaments. Ligaments are longer, thinner,and more numerous as the Weber number is increased.The same remark can be made concerning droplets, whichtend to be smaller and more abundant for the high We-ber number case than for the low Weber number case.Finally, it should be noted that the sizes of ligamentsand droplets become larger at later times in all cases,which has been observed also by Sallam et al. (1999), and
Volume 20, Number 4, 2010
326 Desjardins & Pitsch
We = 500 We = 1000 We = 2000
t = 5
t = 15
t = 25
FIG. 14: Top view of the interface for Re= 3000 as a function of time and Weber number.
can be attributed to the dissipation of the small turbulentscales.
6.3 Effect of the Reynolds Number
In order to assess the effect of the Reynolds number onthe interface disruption, two different Reynolds numbershave been considered. Although it is unclear whethermany lasting differences will emerge between Re= 2000and Re= 3000, the difference in the level of turbulenceshould at least impact the early deformation of the inter-face. Figure 15 compares the interface for casesTPb1andTPb2 at different times throughout the simulations.Clearly, the later development of the various liquid struc-tures is very similar between the two Reynolds numbers.The resulting ligaments appear to be of the same size, and
the droplets seem similar in size and number. This obser-vation suggests that the processes by which ligaments arestretched out and ruptured are not significantly affectedby changing the Reynolds number. Of course, the rangeof scales found in Re= 2000 turbulence and Re= 3000turbulence is rather limited; therefore, it is possible thatchanging the Reynolds number more significantly couldhave a stronger effect. Note that Sallam et al. (1999) re-ported that increasing the injection velocity (i.e., increas-ing both the Reynolds number and the Weber number atthe same time) led to little consequences on the largestliquid structures, while smaller and more numerous smallscales were obtained. The main difference between thetwo simulations can be found in the earliest interface vi-sualization, where the corrugation length scales appearlarger for the low Reynolds number case. This is to be ex-
Atomization and Sprays
Numerical Investigation of Turbulent Atomization 327
t = 5 t = 15 t = 25
Re= 2000
Re= 3000
FIG. 15: Top view of the interface for We= 1000 as a function of time and Reynolds number.
pected, considering that less energy is contained in smalleddies for the low Reynolds number case compared to thelarger Reynolds number case. Consequently, the early de-formation on the smaller scales of the interface is morelikely to take place on relatively larger length scales asthe Reynolds number is reduced.
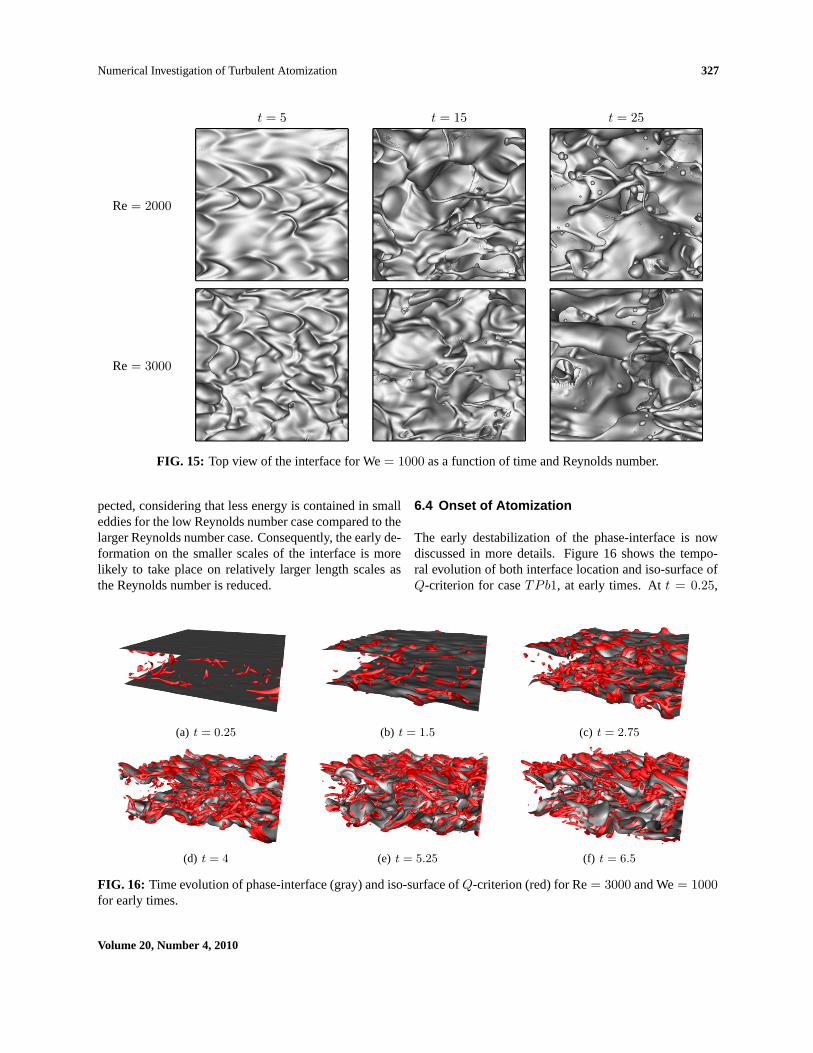
6.4 Onset of Atomization
The early destabilization of the phase-interface is nowdiscussed in more details. Figure 16 shows the tempo-ral evolution of both interface location and iso-surface ofQ-criterion for caseTPb1, at early times. Att = 0.25,
(a) t = 0.25 (b) t = 1.5 (c) t = 2.75
(d) t = 4 (e) t = 5.25 (f) t = 6.5
FIG. 16: Time evolution of phase-interface (gray) and iso-surface ofQ-criterion (red) for Re= 3000 and We= 1000for early times.
Volume 20, Number 4, 2010
328 Desjardins & Pitsch
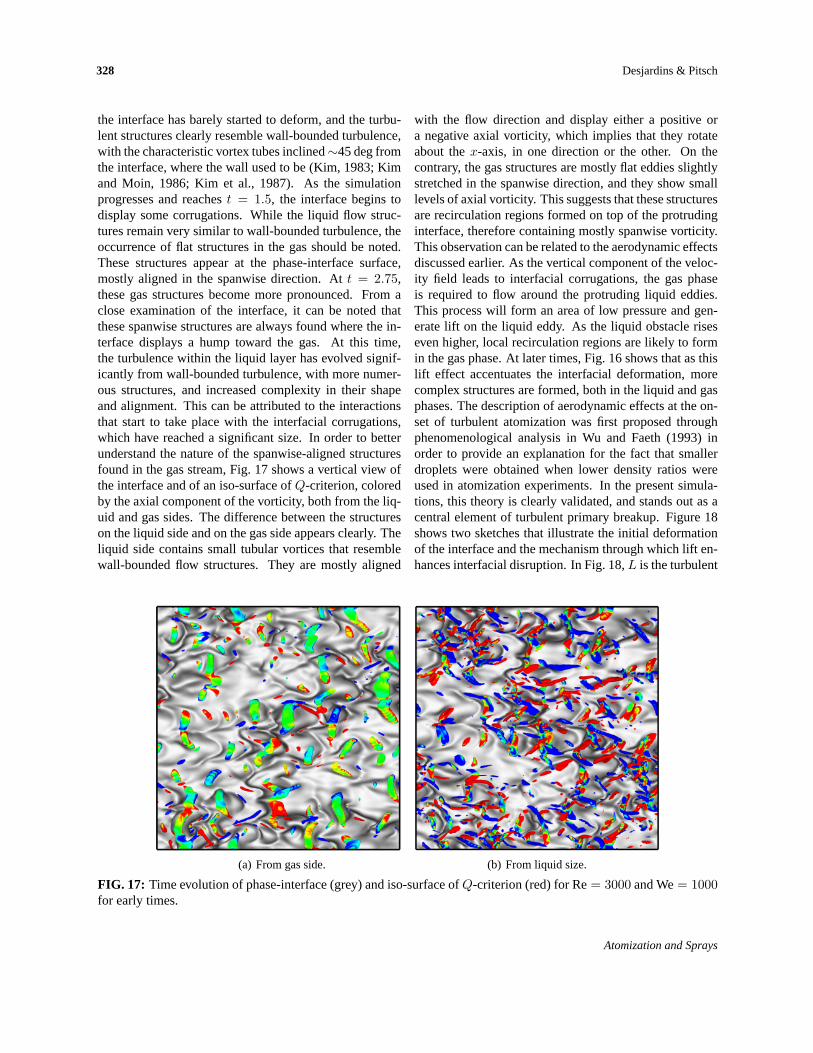
the interface has barely started to deform, and the turbu-lent structures clearly resemble wall-bounded turbulence,with the characteristic vortex tubes inclined∼45 deg fromthe interface, where the wall used to be (Kim, 1983; Kimand Moin, 1986; Kim et al., 1987). As the simulationprogresses and reachest = 1.5, the interface begins todisplay some corrugations. While the liquid flow struc-tures remain very similar to wall-bounded turbulence, theoccurrence of flat structures in the gas should be noted.These structures appear at the phase-interface surface,mostly aligned in the spanwise direction. Att = 2.75,these gas structures become more pronounced. From aclose examination of the interface, it can be noted thatthese spanwise structures are always found where the in-terface displays a hump toward the gas. At this time,the turbulence within the liquid layer has evolved signif-icantly from wall-bounded turbulence, with more numer-ous structures, and increased complexity in their shapeand alignment. This can be attributed to the interactionsthat start to take place with the interfacial corrugations,which have reached a significant size. In order to betterunderstand the nature of the spanwise-aligned structuresfound in the gas stream, Fig. 17 shows a vertical view ofthe interface and of an iso-surface ofQ-criterion, coloredby the axial component of the vorticity, both from the liq-uid and gas sides. The difference between the structureson the liquid side and on the gas side appears clearly. Theliquid side contains small tubular vortices that resemblewall-bounded flow structures. They are mostly aligned
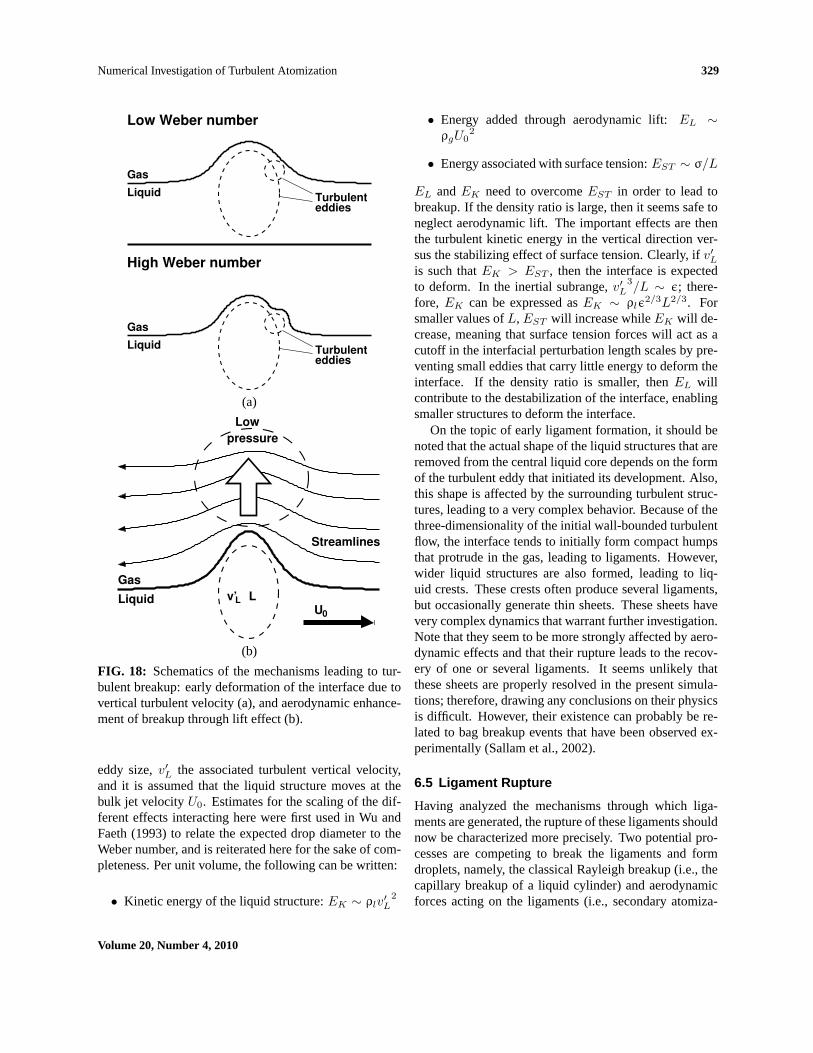
with the flow direction and display either a positive ora negative axial vorticity, which implies that they rotateabout thex-axis, in one direction or the other. On thecontrary, the gas structures are mostly flat eddies slightlystretched in the spanwise direction, and they show smalllevels of axial vorticity. This suggests that these structuresare recirculation regions formed on top of the protrudinginterface, therefore containing mostly spanwise vorticity.This observation can be related to the aerodynamic effectsdiscussed earlier. As the vertical component of the veloc-ity field leads to interfacial corrugations, the gas phaseis required to flow around the protruding liquid eddies.This process will form an area of low pressure and gen-erate lift on the liquid eddy. As the liquid obstacle riseseven higher, local recirculation regions are likely to formin the gas phase. At later times, Fig. 16 shows that as thislift effect accentuates the interfacial deformation, morecomplex structures are formed, both in the liquid and gasphases. The description of aerodynamic effects at the on-set of turbulent atomization was first proposed throughphenomenological analysis in Wu and Faeth (1993) inorder to provide an explanation for the fact that smallerdroplets were obtained when lower density ratios wereused in atomization experiments. In the present simula-tions, this theory is clearly validated, and stands out as acentral element of turbulent primary breakup. Figure 18shows two sketches that illustrate the initial deformationof the interface and the mechanism through which lift en-hances interfacial disruption. In Fig. 18,L is the turbulent
(a) From gas side. (b) From liquid size.
FIG. 17: Time evolution of phase-interface (grey) and iso-surface ofQ-criterion (red) for Re= 3000 and We= 1000for early times.
Atomization and Sprays
Numerical Investigation of Turbulent Atomization 329
Turbulenteddies
Turbulenteddies
Liquid
Gas
High Weber number
Liquid
Gas
Low Weber number
(a)
Low
pressure
Streamlines
Gas
LiquidU0
LLv’
(b)
FIG. 18: Schematics of the mechanisms leading to tur-bulent breakup: early deformation of the interface due tovertical turbulent velocity (a), and aerodynamic enhance-ment of breakup through lift effect (b).
eddy size,v′L the associated turbulent vertical velocity,and it is assumed that the liquid structure moves at thebulk jet velocityU0. Estimates for the scaling of the dif-ferent effects interacting here were first used in Wu andFaeth (1993) to relate the expected drop diameter to theWeber number, and is reiterated here for the sake of com-pleteness. Per unit volume, the following can be written:
• Kinetic energy of the liquid structure:EK ∼ ρlv′L
2
• Energy added through aerodynamic lift:EL ∼ρgU0
2
• Energy associated with surface tension:EST ∼ σ/L
EL andEK need to overcomeEST in order to lead tobreakup. If the density ratio is large, then it seems safe toneglect aerodynamic lift. The important effects are thenthe turbulent kinetic energy in the vertical direction ver-sus the stabilizing effect of surface tension. Clearly, ifv′Lis such thatEK > EST , then the interface is expectedto deform. In the inertial subrange,v′L
3/L ∼ ε; there-
fore, EK can be expressed asEK ∼ ρlε2/3L2/3. For
smaller values ofL, EST will increase whileEK will de-crease, meaning that surface tension forces will act as acutoff in the interfacial perturbation length scales by pre-venting small eddies that carry little energy to deform theinterface. If the density ratio is smaller, thenEL willcontribute to the destabilization of the interface, enablingsmaller structures to deform the interface.
On the topic of early ligament formation, it should benoted that the actual shape of the liquid structures that areremoved from the central liquid core depends on the formof the turbulent eddy that initiated its development. Also,this shape is affected by the surrounding turbulent struc-tures, leading to a very complex behavior. Because of thethree-dimensionality of the initial wall-bounded turbulentflow, the interface tends to initially form compact humpsthat protrude in the gas, leading to ligaments. However,wider liquid structures are also formed, leading to liq-uid crests. These crests often produce several ligaments,but occasionally generate thin sheets. These sheets havevery complex dynamics that warrant further investigation.Note that they seem to be more strongly affected by aero-dynamic effects and that their rupture leads to the recov-ery of one or several ligaments. It seems unlikely thatthese sheets are properly resolved in the present simula-tions; therefore, drawing any conclusions on their physicsis difficult. However, their existence can probably be re-lated to bag breakup events that have been observed ex-perimentally (Sallam et al., 2002).
6.5 Ligament Rupture
Having analyzed the mechanisms through which liga-ments are generated, the rupture of these ligaments shouldnow be characterized more precisely. Two potential pro-cesses are competing to break the ligaments and formdroplets, namely, the classical Rayleigh breakup (i.e., thecapillary breakup of a liquid cylinder) and aerodynamicforces acting on the ligaments (i.e., secondary atomiza-
Volume 20, Number 4, 2010
330 Desjardins & Pitsch
tion). The idea that primary and secondary breakupsmerge and interact together for low-density ratios hasbeen introduced previously (see, e.g., Faeth et al., 1995.Ranger and Nicholls (1969) and Hsiang and Faeth (1992)presented the mechanisms by which a droplet undergoessecondary atomization, and Wu and Faeth (1993) sug-gested that this process could affect liquid structures dur-ing primary atomization itself. It has already been clearlyestablished that the cases considered here are strongly af-fected by aerodynamic forces; therefore, it is likely thatthese forces will contribute to the rupture of the ligamentsthat they helped forming. Wu and Faeth (1993) provideda phenomenological formula for the ratio of the Rayleighbreakup time scaleτR to the aerodynamic breakup timescaleτA that is based on the distance from the injec-tion and the local turbulent Weber number. Followingthe work of Hsiang and Faeth (1992), the time scaleassociated with aerodynamic breakup of a liquid structureof size L moving atU0 in still gas can be expressed asτA =
√ρl/ρgL/U0. Similarly, Rayleigh breakup can
classically be characterized byτR =√
ρlL3/σ. Thesmallest time scale should correspond to the main mech-
anism by which ligament breakup occurs. The ratio ofthese time scales can be expressed byτA/τR = We−1/2
L,g ,where WeL,g = ρgU
20 L/σ is a Weber number based on
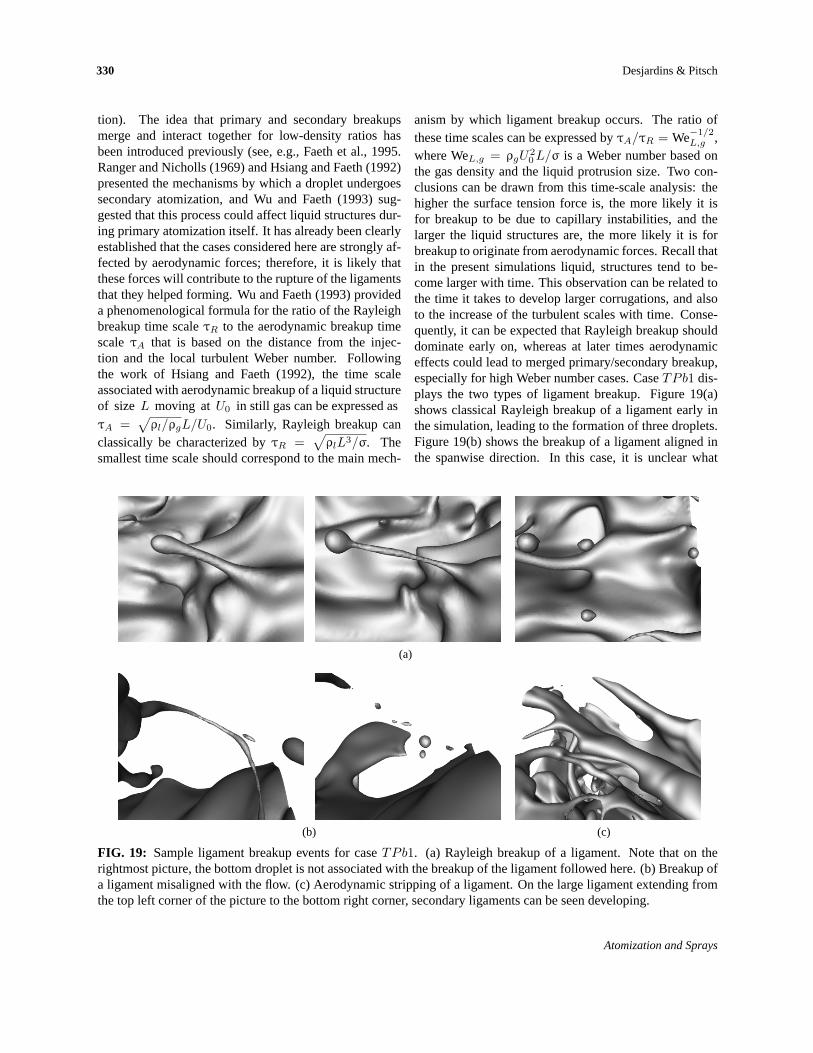
the gas density and the liquid protrusion size. Two con-clusions can be drawn from this time-scale analysis: thehigher the surface tension force is, the more likely it isfor breakup to be due to capillary instabilities, and thelarger the liquid structures are, the more likely it is forbreakup to originate from aerodynamic forces. Recall thatin the present simulations liquid, structures tend to be-come larger with time. This observation can be related tothe time it takes to develop larger corrugations, and alsoto the increase of the turbulent scales with time. Conse-quently, it can be expected that Rayleigh breakup shoulddominate early on, whereas at later times aerodynamiceffects could lead to merged primary/secondary breakup,especially for high Weber number cases. CaseTPb1 dis-plays the two types of ligament breakup. Figure 19(a)shows classical Rayleigh breakup of a ligament early inthe simulation, leading to the formation of three droplets.Figure 19(b) shows the breakup of a ligament aligned inthe spanwise direction. In this case, it is unclear what
(a)
(b) (c)
FIG. 19: Sample ligament breakup events for caseTPb1. (a) Rayleigh breakup of a ligament. Note that on therightmost picture, the bottom droplet is not associated with the breakup of the ligament followed here. (b) Breakup ofa ligament misaligned with the flow. (c) Aerodynamic stripping of a ligament. On the large ligament extending fromthe top left corner of the picture to the bottom right corner, secondary ligaments can be seen developing.
Atomization and Sprays
Numerical Investigation of Turbulent Atomization 331
the main mechanism for breakup is because aerodynamicforces acting on a ligament misaligned with the mean flowdirection should be intense. Finally, Fig. 19(c) shows aclear aerodynamic stripping of a large ligament, leadingto the creation of secondary bulges and ligaments.
6.6 Detailed Liquid Structures
6.6.1 Bubble Entrapment
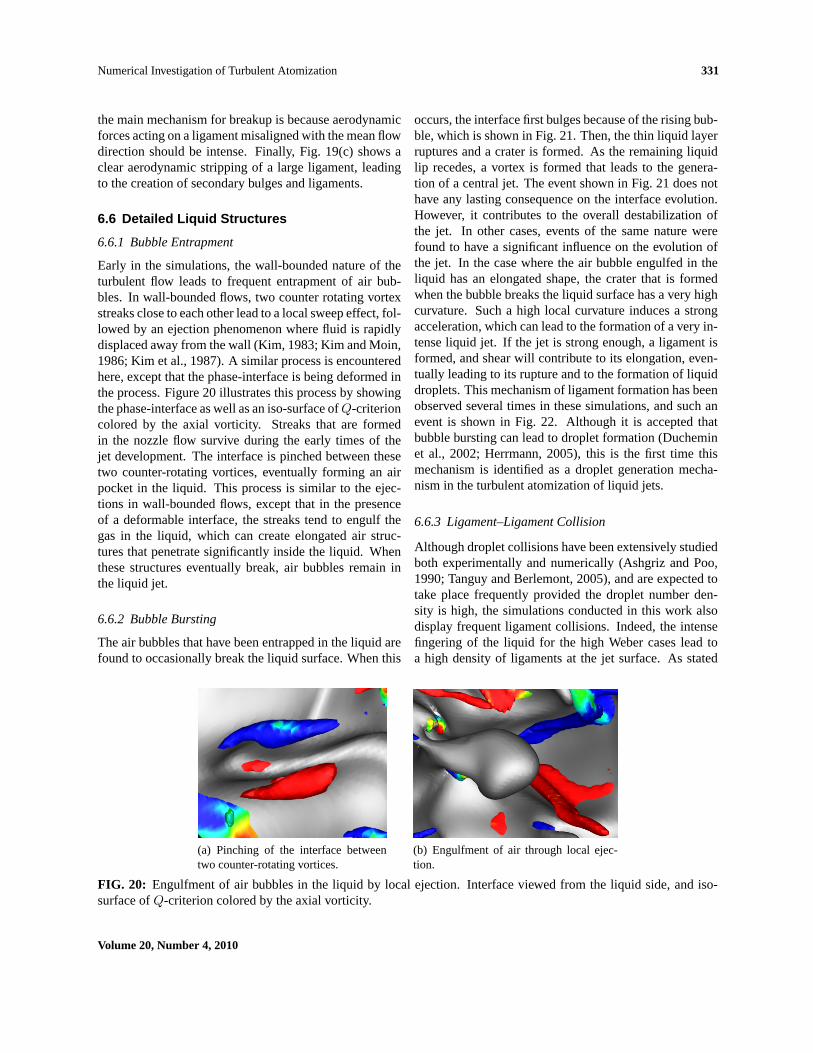
Early in the simulations, the wall-bounded nature of theturbulent flow leads to frequent entrapment of air bub-bles. In wall-bounded flows, two counter rotating vortexstreaks close to each other lead to a local sweep effect, fol-lowed by an ejection phenomenon where fluid is rapidlydisplaced away from the wall (Kim, 1983; Kim and Moin,1986; Kim et al., 1987). A similar process is encounteredhere, except that the phase-interface is being deformed inthe process. Figure 20 illustrates this process by showingthe phase-interface as well as an iso-surface ofQ-criterioncolored by the axial vorticity. Streaks that are formedin the nozzle flow survive during the early times of thejet development. The interface is pinched between thesetwo counter-rotating vortices, eventually forming an airpocket in the liquid. This process is similar to the ejec-tions in wall-bounded flows, except that in the presenceof a deformable interface, the streaks tend to engulf thegas in the liquid, which can create elongated air struc-tures that penetrate significantly inside the liquid. Whenthese structures eventually break, air bubbles remain inthe liquid jet.
6.6.2 Bubble Bursting
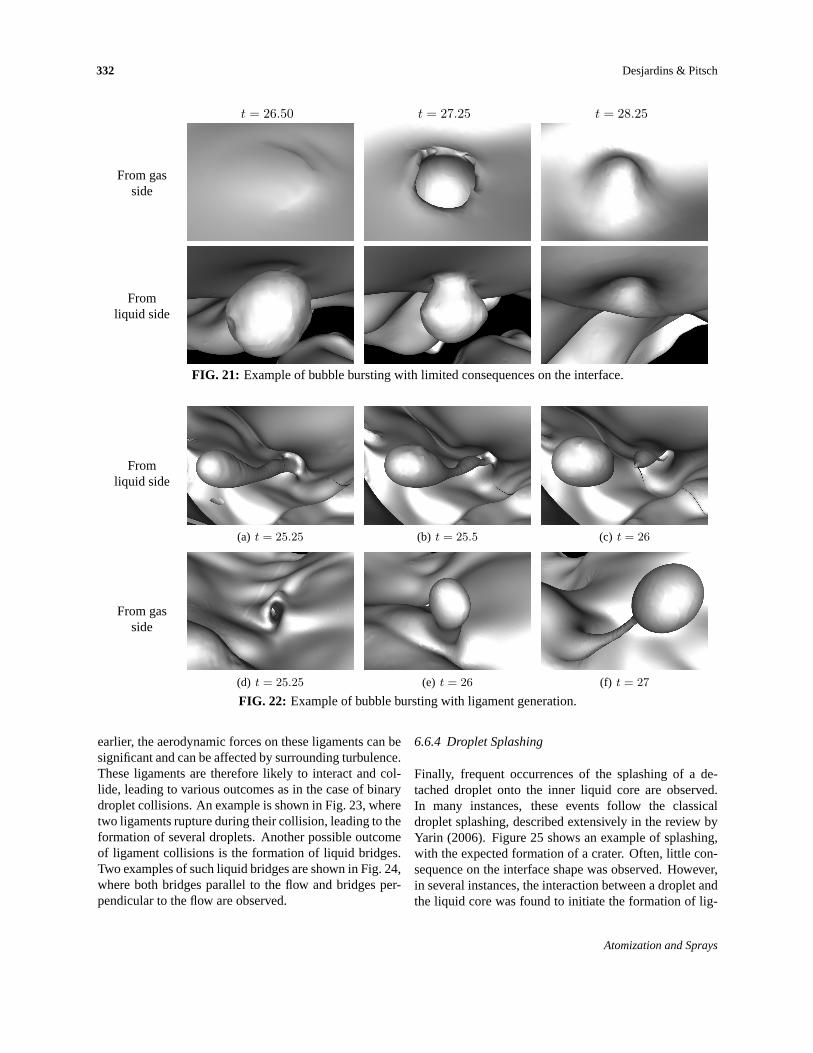
The air bubbles that have been entrapped in the liquid arefound to occasionally break the liquid surface. When this
occurs, the interface first bulges because of the rising bub-ble, which is shown in Fig. 21. Then, the thin liquid layerruptures and a crater is formed. As the remaining liquidlip recedes, a vortex is formed that leads to the genera-tion of a central jet. The event shown in Fig. 21 does nothave any lasting consequence on the interface evolution.However, it contributes to the overall destabilization ofthe jet. In other cases, events of the same nature werefound to have a significant influence on the evolution ofthe jet. In the case where the air bubble engulfed in theliquid has an elongated shape, the crater that is formedwhen the bubble breaks the liquid surface has a very highcurvature. Such a high local curvature induces a strongacceleration, which can lead to the formation of a very in-tense liquid jet. If the jet is strong enough, a ligament isformed, and shear will contribute to its elongation, even-tually leading to its rupture and to the formation of liquiddroplets. This mechanism of ligament formation has beenobserved several times in these simulations, and such anevent is shown in Fig. 22. Although it is accepted thatbubble bursting can lead to droplet formation (Ducheminet al., 2002; Herrmann, 2005), this is the first time thismechanism is identified as a droplet generation mecha-nism in the turbulent atomization of liquid jets.
6.6.3 Ligament–Ligament Collision
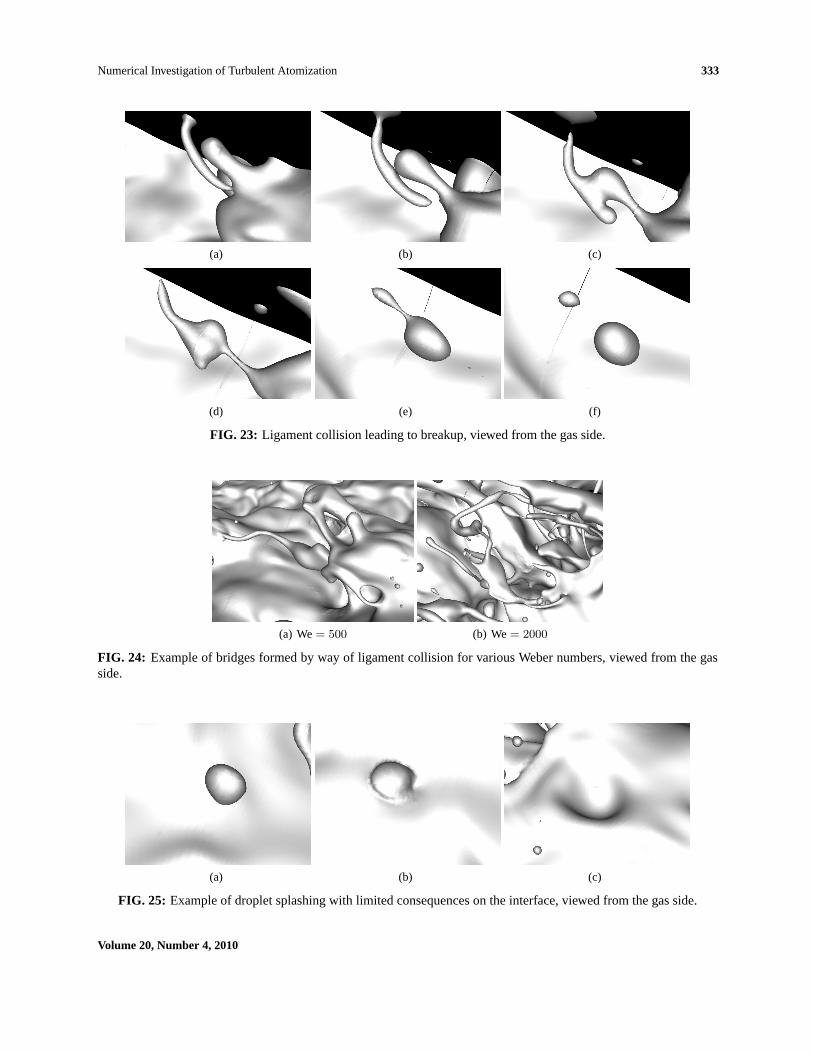
Although droplet collisions have been extensively studiedboth experimentally and numerically (Ashgriz and Poo,1990; Tanguy and Berlemont, 2005), and are expected totake place frequently provided the droplet number den-sity is high, the simulations conducted in this work alsodisplay frequent ligament collisions. Indeed, the intensefingering of the liquid for the high Weber cases lead toa high density of ligaments at the jet surface. As stated
(a) Pinching of the interface betweentwo counter-rotating vortices.
(b) Engulfment of air through local ejec-tion.
FIG. 20: Engulfment of air bubbles in the liquid by local ejection. Interface viewed from the liquid side, and iso-surface ofQ-criterion colored by the axial vorticity.
Volume 20, Number 4, 2010
332 Desjardins & Pitsch
t = 26.50 t = 27.25 t = 28.25
From gasside
Fromliquid side
FIG. 21: Example of bubble bursting with limited consequences on the interface.
Fromliquid side
(a) t = 25.25 (b) t = 25.5 (c) t = 26
From gasside
(d) t = 25.25 (e) t = 26 (f) t = 27
FIG. 22: Example of bubble bursting with ligament generation.
earlier, the aerodynamic forces on these ligaments can besignificant and can be affected by surrounding turbulence.These ligaments are therefore likely to interact and col-lide, leading to various outcomes as in the case of binarydroplet collisions. An example is shown in Fig. 23, wheretwo ligaments rupture during their collision, leading to theformation of several droplets. Another possible outcomeof ligament collisions is the formation of liquid bridges.Two examples of such liquid bridges are shown in Fig. 24,where both bridges parallel to the flow and bridges per-pendicular to the flow are observed.
6.6.4 Droplet Splashing
Finally, frequent occurrences of the splashing of a de-tached droplet onto the inner liquid core are observed.In many instances, these events follow the classicaldroplet splashing, described extensively in the review byYarin (2006). Figure 25 shows an example of splashing,with the expected formation of a crater. Often, little con-sequence on the interface shape was observed. However,in several instances, the interaction between a droplet andthe liquid core was found to initiate the formation of lig-
Atomization and Sprays
Numerical Investigation of Turbulent Atomization 333
(a) (b) (c)
(d) (e) (f)
FIG. 23: Ligament collision leading to breakup, viewed from the gas side.
(a) We= 500 (b) We= 2000
FIG. 24: Example of bridges formed by way of ligament collision for various Weber numbers, viewed from the gasside.
(a) (b) (c)
FIG. 25: Example of droplet splashing with limited consequences on the interface, viewed from the gas side.
Volume 20, Number 4, 2010
334 Desjardins & Pitsch
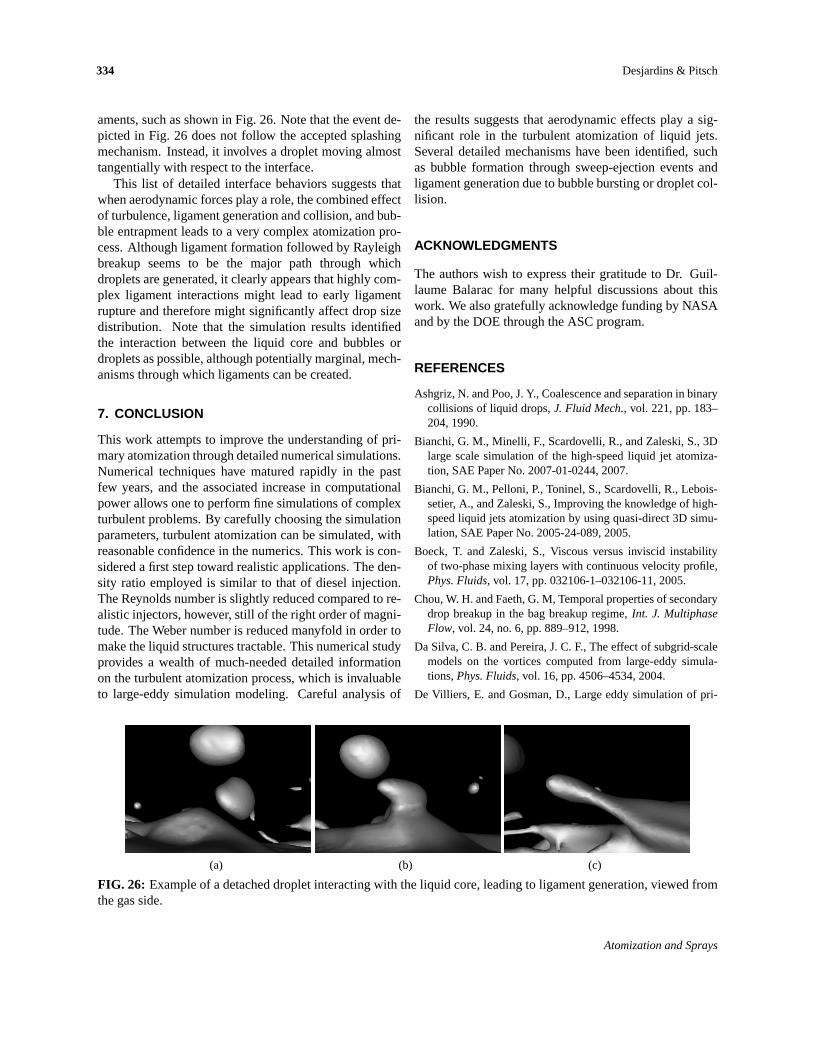
aments, such as shown in Fig. 26. Note that the event de-picted in Fig. 26 does not follow the accepted splashingmechanism. Instead, it involves a droplet moving almosttangentially with respect to the interface.
This list of detailed interface behaviors suggests thatwhen aerodynamic forces play a role, the combined effectof turbulence, ligament generation and collision, and bub-ble entrapment leads to a very complex atomization pro-cess. Although ligament formation followed by Rayleighbreakup seems to be the major path through whichdroplets are generated, it clearly appears that highly com-plex ligament interactions might lead to early ligamentrupture and therefore might significantly affect drop sizedistribution. Note that the simulation results identifiedthe interaction between the liquid core and bubbles ordroplets as possible, although potentially marginal, mech-anisms through which ligaments can be created.
7. CONCLUSION
This work attempts to improve the understanding of pri-mary atomization through detailed numerical simulations.Numerical techniques have matured rapidly in the pastfew years, and the associated increase in computationalpower allows one to perform fine simulations of complexturbulent problems. By carefully choosing the simulationparameters, turbulent atomization can be simulated, withreasonable confidence in the numerics. This work is con-sidered a first step toward realistic applications. The den-sity ratio employed is similar to that of diesel injection.The Reynolds number is slightly reduced compared to re-alistic injectors, however, still of the right order of magni-tude. The Weber number is reduced manyfold in order tomake the liquid structures tractable. This numerical studyprovides a wealth of much-needed detailed informationon the turbulent atomization process, which is invaluableto large-eddy simulation modeling. Careful analysis of
the results suggests that aerodynamic effects play a sig-nificant role in the turbulent atomization of liquid jets.Several detailed mechanisms have been identified, suchas bubble formation through sweep-ejection events andligament generation due to bubble bursting or droplet col-lision.
ACKNOWLEDGMENTS
The authors wish to express their gratitude to Dr. Guil-laume Balarac for many helpful discussions about thiswork. We also gratefully acknowledge funding by NASAand by the DOE through the ASC program.
REFERENCES
Ashgriz, N. and Poo, J. Y., Coalescence and separation in binarycollisions of liquid drops,J. Fluid Mech., vol. 221, pp. 183–204, 1990.
Bianchi, G. M., Minelli, F., Scardovelli, R., and Zaleski, S., 3Dlarge scale simulation of the high-speed liquid jet atomiza-tion, SAE Paper No. 2007-01-0244, 2007.
Bianchi, G. M., Pelloni, P., Toninel, S., Scardovelli, R., Lebois-setier, A., and Zaleski, S., Improving the knowledge of high-speed liquid jets atomization by using quasi-direct 3D simu-lation, SAE Paper No. 2005-24-089, 2005.
Boeck, T. and Zaleski, S., Viscous versus inviscid instabilityof two-phase mixing layers with continuous velocity profile,Phys. Fluids, vol. 17, pp. 032106-1–032106-11, 2005.
Chou, W. H. and Faeth, G. M, Temporal properties of secondarydrop breakup in the bag breakup regime,Int. J. MultiphaseFlow, vol. 24, no. 6, pp. 889–912, 1998.
Da Silva, C. B. and Pereira, J. C. F., The effect of subgrid-scalemodels on the vortices computed from large-eddy simula-tions,Phys. Fluids,vol. 16, pp. 4506–4534, 2004.
De Villiers, E. and Gosman, D., Large eddy simulation of pri-
(a) (b) (c)
FIG. 26: Example of a detached droplet interacting with the liquid core, leading to ligament generation, viewed fromthe gas side.
Atomization and Sprays
Numerical Investigation of Turbulent Atomization 335
mary Diesel spray atomization, SAE Paper No. 2004-01-0100, 2004.
Desjardins, O., Blanquart, G., Balarac, G., and Pitsch, H., Highorder conservative finite difference scheme for variable den-sity low Mach number turbulent flows,J. Comput. Phys., vol.227, no. 15, pp. 7125–7159, 2008a.
Desjardins, O., Moureau, V., and Pitsch, H., An accurate con-servative level set/ghost fluid method for simulating primaryatomization,J. Comput. Phys.,vol. 227, no. 18, pp. 8395–8416, 2008b.
Desjardins, O. and Pitsch, H., Modeling effect of spray evapora-tion on turbulent combustion,10th International Congress onLiquid Atomization and Spray Systems, Kyoto, Japan, 2006.
Desjardins, O. and Pitsch, H., A spectrally refined interface ap-proach for simulating multiphase flows,J. Comput. Phys.,vol. 228, no. 5, pp. 1658–1677, 2009.
Dubief, Y. and Delcayre, F., On coherent-vortex identification inturbulence,J. Turbul., vol. 1, pp. 1–22, 2000.
Duchemin, L., Popinet, S., Josserand, C., and Zaleski, S., Jetformation in bubbles bursting at a free surface,Phys. Fluids,vol. 14, no. 9, pp. 3000–3008, 2002.
Faeth, G. M., Hsiang, L. P., and Wu, P. K., Structure and breakupproperties of sprays,Int. J. Multiphase Flow, vol. 21, pp. 99–127, 1995.
Fedkiw, R., Aslam, T., Merriman, B., and Osher, S., A non-oscillatory Eulerian approach to interfaces in multimaterialflows (the ghost fluid method),J. Comput. Phys.,vol. 152,pp. 457–492, 1999.
Gorokhovski, M., The stochastic sub-grid-scale approach forspray atomization,Atomization and Sprays, vol. 11, pp. 505–519, 2001.
Gorokhovski, M. and Herrmann, M., Modeling primary atom-ization,Ann. Rev. Fluid Mech.,vol. 40, pp. 343–366, 2008.
Herrmann, M., Refined level set grid method for tracking in-terfaces,Annual Research Briefs, Center for Turbulence Re-search, Stanford, CA, 2005.
Hsiang, L. P. and Faeth, G. M., Near-limit drop deformation andsecondary breakup,Int. J. Multiphase Flow,vol. 18, no. 5,pp. 635–652, 1992.
Hunt, J. C. R., Wray, A. A., and Moin, P., Eddies, streams andconvergence zones in turbulent flows, Tech. Rep. No. CTR-S88. Center for Turbulence Research, 1988.
Kim, J., On the structure of wall-bounded turbulent flows,Phys.Fluids, vol. 26, pp. 2088–2097, 1983.
Kim, J. and Moin, P., The structure of the vorticity field in tur-bulent channel flow. II. Study of ensemble-averaged fields,J.Fluid Mech., vol. 162, pp. 339–363, 1986.
Kim, J., Moin, P., and Moser, R., Turbulence statistics in fullydeveloped channel flow at low Reynolds number,J. FluidMech., vol. 177, pp. 133–166, 1987.
Knudsen, E. and Pitsch, H., A dynamic model for the turbulentburning velocity for large eddy simulation of premixed com-bustion,Combust. Flame, vol. 154, no. 4, pp. 740–760, 2008.
Knudsen, E. and Pitsch, H., A general amelet transforma-tion useful for distinguishing between premixed and non-premixed modes of combustion,Combust. Flame, vol. 156,no. 3, pp. 678–696, 2009.
Kong, S. C., Senecal, P. K., and Reitz, R. D., Developments inspray modelling in Diesel and direct-injection gasoline en-gines, Oil Gas Sci. Tech. Rev. IFP, vol. 54, pp. 197–204,1999.
Lasheras, J. C. and Hopfinger, E. J., Liquid jet instability andatomization in a coaxial gas stream,Ann. Rev. Fluid. Mech.,vol. 32, pp. 275–308, 2000.
Lefebvre, A. H.,Atomization and Spray, Taylor and Francis,New York, 1989.
Levich, V. G., Physico-Chemical Hydrodynamics, Prentice-Hall, Englewood Cliffs, NJ, 1992.
Marmottant, P. and Villermaux, E., On spray formation,J. FluidMech., vol. 498, pp. 73–112, 2004.
Menard, T., Tanguy, S. and Berlemont, A., Coupling levelset/VOF/ghost uid methods: Validation and application to 3Dsimulation of the primary break-up of a liquid jet,Int. J. Mul-tiphase Flow, vol. 33, pp. 510–524, 2007.
Miesse, C. C., Correlation of experimental data on the disinte-gration of liquid jets,Ind. Eng. Chem.,vol. 47, pp. 1690–1701, 1955.
Ohnesorge, W., Formation of drops by nozzles and the breakupof liquid jets,Z. Angew. Math. Mech., vol. 16, pp. 355–358,1936.
Pan, Y. and Suga, K., A numerical study on the breakup processof laminar liquid jets into a gas,Phys. Fluids, vol. 18, pp.052101-1–052101-11, 2006.
Park, M., Yoo, J. Y., and Choi, H., Discretization errors in largeeddy simulation: On the suitability of centered and upwind-biased compact difference schemes,J. Comput. Phys., vol.198, pp. 580–616, 2004.
Patterson, M. A. and Reitz, R. D., Modeling the effects of fuelspray characteristics on Diesel engine combustion and emis-sions, SAE Tech. Paper No. 980131, 1998.
Pierce, C. D. and Moin, P., Progress-variable approach for largeeddy simulation of turbu- lent combustion, Tech. Rep. No.TF80, Flow Physics and Computation Division, Dept. Mech.Eng., Stanford University, 2001.
Ranger, A. A. and Nicholls, J. A., Aerodynamic shattering ofliquid drops,J. AIAA, vol. 7, pp. 285–290, 1969.
Reitz, R. D., Atomization and other breakup regimes of a liquidjet, PhD thesis, Princeton University, 1978.
Sallam, K. A., Dai, Z., and Faeth, G. M., Drop formation atthe surface of plane turbulent liquid jets in still gases,Int. J.
Volume 20, Number 4, 2010
336 Desjardins & Pitsch
Multiphase Flow, vol. 25, no. 6, pp. 1161–1180, 1999.
Sallam, K. A., Dai, Z., and Faeth, G. M., Liquid breakup atthe surface of turbulent round liquid jets in still gases,Int. J.Multiphase Flow, vol. 28, no. 3, pp. 427–449, 2002.
Smallwood, G. and Gulder, O, Views on the structure of tran-sient Diesel spray,Atomization and Sprays, vol. 10, pp. 355–386, 2000.
Stanley, S. A., Sarkar, S., and Mellado, J. P., A study of theflow-field evolution and mixing in a planar turbulent jet usingdirect numerical simulation,J. Fluid. Mech.,vol. 450, pp.377–407, 2002.
Tanguy, S. and Berlemont, A., Application of a level set methodfor simulation of droplet collisions,Int. J. Multiphase Flow,vol. 31, pp. 1015–1035, 2005.
Taylor, G. I., Cavitation of viscous uid in narrow passages,J.Fluid Mech., vol. 16, pp. 595–619, 1963.
Vallet, A., Burluka, A., and Borghi, R., Development of an Eu-lerian model for the atomization of a liquid jet,Atomizationand Sprays, vol. 11, pp. 619–642, 2001.
Villermaux, E., Fragmentation,Ann. Rev. Fluid. Mech., vol. 39,
pp. 419–446, 2007.
Wang, L. and Pitsch, H., Prediction of pollutant emissionsfrom industrial furnaces using large eddy simulation,5th U.S.Combustion Meeting, San Diego, 2007.
Wang, Y., Liu, X., Im, K.-S., Lee, W.-K., Wang, J., Fezzaa, K.,Hung, D. L. S., and Winkelman, J. R., Ultrafast x-ray studyof dense-liquid-jet ow dynamics using structure-tracking ve-locimetry,Nature Physics, vol. 4, pp. 305–309, 2008.
Wu, P. K. and Faeth, G. M., Aerodynamic effects on primarybreakup of turbulent liquids,Atomization and Sprays, vol. 3,no. 3, pp. 265–289, 1993.
Yarin, A. L., Drop impact dynamics: Splashing, spreading, re-ceding, bouncing...,Ann. Rev. Fluid. Mech., vol. 38, pp. 159–192, 2006.
Yecko, P., Zaleski, S., and Fullana, J.-M., Viscous modes in two-phase mixing layers,Phys. Fluids, vol. 14, pp. 4115–4122,2002.
Yi, Y. and Reitz, R. D., Modeling the primary break-up ofhigh-speed jets,Atomization and Sprays, vol. 14, pp. 53–80,2004.
Atomization and Sprays