DETAILED DESIGN REPORT - METU Ceng Demo Day … Design...DETAILED DESIGN REPORT RONGO RONGO ......
55
DETAILED DESIGN REPORT RONGO RONGO F. Aybike Avşaroğlu Esra Gariboğlu Osman Kaya Önder Kalacı
Transcript of DETAILED DESIGN REPORT - METU Ceng Demo Day … Design...DETAILED DESIGN REPORT RONGO RONGO ......

DETAILED DESIGN
REPORT
RONGO RONGO
F. Aybike Avşaroğlu
Esra Gariboğlu
Osman Kaya
Önder Kalacı

Table of Contents
1. Introduction
1.1. Problem Definition and Purpose of the Project
1.2. Scope
1.3. Definitions and Abbreviations
1.4. References
2. Overall Description
2.1. Product Perspective
2.2. Product Functions
2.3. User Characteristics
2.4. Constraints
2.5. Assumptions and Dependencies
2.6. Apportioning Requirements
3. Design Considerations
3.1. Design Assumptions, Dependencies and Constraints
3.2. Design Goals and Guidelines
4. Data Design
4.1. Data Description
4.1.1. Data Description of Sensor Nodes
4.1.2. Data Description of Gateway
4.1.3. Data Flow
4.1.4. Database Design
4.1.4.1. User Table
4.1.4.2. Greenhouse Table
4.1.4.3. ClusterData Table
4.1.4.4. Sensor
5. System Architecture
5.1. Architectural Design
5.2. Description of Components
5.2.1. Component 1: Sensor Network
5.2.1.1. Processing Narrative for Sensor Network
5.2.1.2. Sensor Network Interface Description
5.2.1.3. Sensor Network Processing Detail
5.2.1.4. Dynamic behavior of Sensor Network
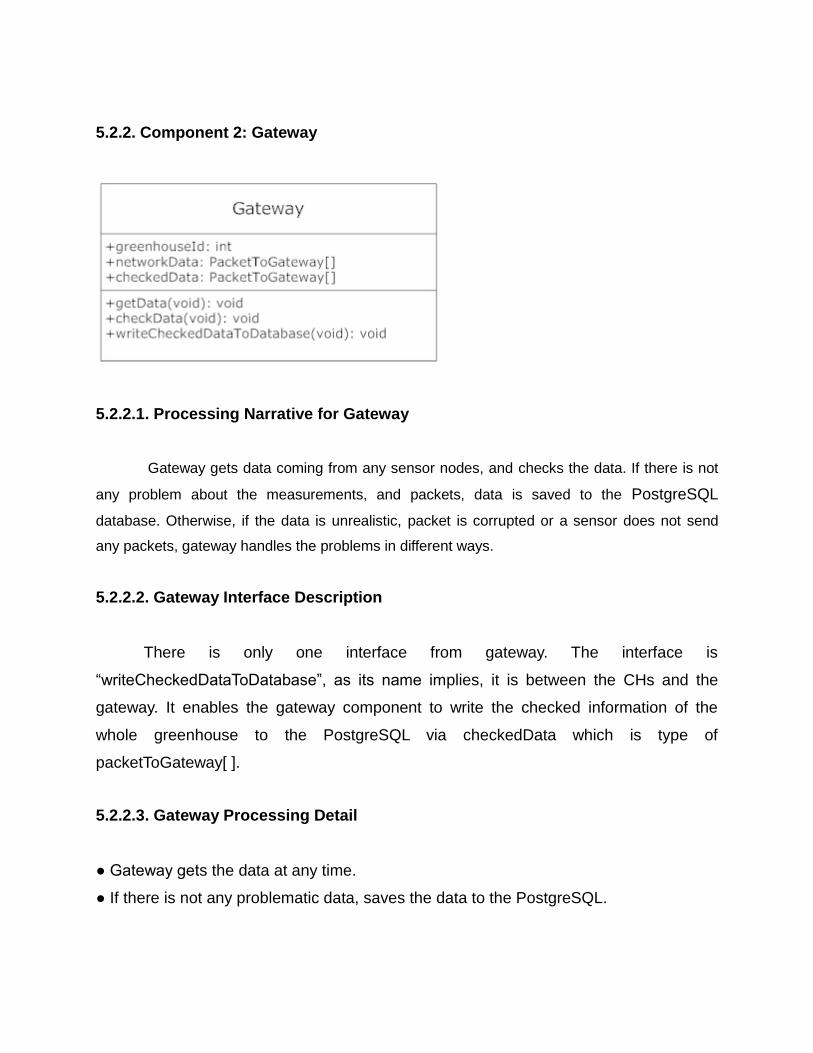
5.2.2. Component 2: Gateway
5.2.2.1. Processing Narrative for Gateway
5.2.2.2. Gateway Interface Description
5.2.2.3. Gateway Processing Detail
5.2.2.4. Dynamic behavior of Gateway
5.2.3. Component 3: Web Application
5.2.3.1. Processing Narrative for Web Application
5.2.3.2. Web Application Interface Description
5.2.2.3. Web Application Processing Detail
5.2.2.4. Dynamic behavior of Web Application
6. User Interface Design
6.1. Overview
6.2. Screen Images, Screen Objects and Actions
6.2.1. Login page
6.2.2. Selection Page
6.2.3. Main Page
6.2.4. Past Measurements
6.2.5. Graphical View of an Interval
6.2.6. States of the sensors
7. Detailed Design
7.1. Sensor Network
7.1.1. Star Topology
7.1.2. LEACH Protocol
7.2. Gateway
7.3. Web Application
8. Libraries and Tools
8.1. Libraries
8.1.1. Libraries for the Programming Sensor Nodes and Gateway

8.1.1.1. “mote.h”
8.1.1.2. Existing C Libraries
8.1.2. Libraries for Developing Web Application
8.1.2.1. java.sql Package
8.1.2.2. java.util Package
8.1.2.3. Java Servlet API
8.1.2.4. javax.swing
8.1.2.5. PostgreSQL.jar
8.2. Tools
8.2.1. NesC (Network Embedded Systems C)
8.2.2. NesC Compiler: ncc
8.2.3. Java
8.2.4. Javac
8.2.5. Mote-View
8.2.6. Moteworks
8.2.7. TOSSIM
8.2.8. Smart Draw
8.2.9. Sequence Diagram Editor
8.2.10. Microsoft Project Professional
9. Time Schedule
9.1. Gannt Chart for Term 1
9.2. Gannt Chart for Term 2
10. Conclusion

1. Introduction
1.1. Problem Definition and Purpose of the Project
Temperature, humidity, light and the level of the carbon dioxide are the most
important factors for the productivity, growth, and quality of a plant. By continuous
monitoring of these environmental variables, the grower can analyze the optimal
environmental conditions to achieve maximum crop productiveness, then the optimal
greenhouse climate adjustment can enable us to improve productivity and to achieve
remarkable energy savings.
In modern, big greenhouses, to make the automation system work properly,
several measurement points are required to trace down the local climate parameters in
its different parts. Using cabling for monitoring would make the measurement system
expensive, vulnerable, and also the measurement points are difficult to relocate. Due to
these facts, a Wireless Sensor Network (WSN), which consists of small-size wireless
sensor nodes with radio and sensors, is more cost efficient and practical option to build
the required greenhouse measurement system [3].
The purpose of the project is to construct a greenhouse monitoring system using
wireless sensor networks. The major goal of the project is to increase the productivity
and quality of the plants in a greenhouse without observing it whole day. The system
periodically measures the temperature, light and humidity levels inside the greenhouse,
the greenhouse manager can observe the measurements from the web simultaneously.
Moreover, when a critical change in one of the measurements occurs, the greenhouse
manager will be notified via e-mail and cell phone text message. By this way, the
greenhouse manager can interfere in the situation as soon as possible and may be able
to prevent possible damaging effects of the changes.

1.2. Scope
The first part of the project is protocol based on the star topology [4], the sensor
nodes do not communicate each other, and each sensor communicates with only the
gateway. The data packets are sent to the gateway by each node, and then the gateway
constructs them and sends data to the PostgreSQL database.
In the second part, which uses the LEACH protocol [2], firstly the sensor nodes
choose cluster heads, which they send their measurements. CHs do not make
measurement, they collect data, construct them (CHs clarify or ignore mistaken or
corrupted data), and send packets to the gateway. After a while the CHs should change
dynamically, which is the main point of the energy saving, the sensor nodes chooses
some other nodes as CHs. The gateway also checks the packets, construct the data,
then send them to the PostgreSQL database.
The web application is common in the two part of the project. User logs into the
web page, then see all the greenhouses belongs to his/her, chooses one of them. The
next page shows the latest measurements, user can choose past data, graphical view,
or the sensor nodes‟ states. User can display the measurements and averages of a
specific date, can see the graphics of an interval, and can see sensor nodes‟ health
status such as battery levels. About the measurements and ratio of the dead sensors,
there are different thresholds for different greenhouses, if the threshold is exceeded, the
user keeps informed about them via e-mail and/or SMS.
1.3. Definitions and Abbreviations
WSN: Wireless Sensor Network
GWSN: Greenhouse Wireless Sensor Network
CH: Cluster Head
LEACH: Low-Energy Adaptive Clustering Hierarchy
IEEE: Institute of Electrical and Electronics Engineering
TDMA: Time division multiple access

1.4. References
[1] IEEE Std 830-1998: IEEE Recommended Practice for Software
Requirements Specifications
[2] Heinzelman, WRH, Chandrakasan, AC, & Balakrishnan, HB. (2000).
Energy-efficient communication protocol for wireless microsensor
networks
[3] Ahonen, TA, Virrankoski, RV, & Elmusrati, ME. Greenhouse
monitoring with wireless sensor network.
[4] Greenhouse guide. (Referred 28 11 2010). [Online]. Available:
http://www.littlegreenhouse.com/guide.shtml
[5] M. Mancuso and F. Bustaffa, “A Wireless Sensors Network for
Monitoring Environmental Variables in a Tomato Greenhouse,”
presented at 6th IEEE International Workshop on Factory
Communication Systems in Torino, Italy, June 28-30, 2006
[6] USB Gateway Interface Data Sheet(Referred
29.11.2010)[Online].Available:
http://www.memsic.com/support/documentation/wireless-sensor-
networks/category/7-datasheets.html?download=144%3Amib520cb
[7] H. Liu, Z. Meng and S. Cui, “ A Wireless Sensor Network Prototype for
Environmental Monitoring in Greenhouses,” presented at Wireless
Communications, Networking and Mobile Computing 2007 (WiCom
2007), International Conference on 21-25 Sept. 2007 Page(s): 2344 –
2347.
[8] G. Montenegro and N. Kushalnagar, “Transmission of IPv6 Packets
over IEEE 802.15.4 Networks,” Internet-Draft, IETF, Septemper 2007.
[Online].

[9] PostgreSQL 9.1devel Documentation, The PostgreSQL Global
Development Group.[Online].Available:
http://developer.postgresql.org
2. Overall Description
2.1. Product Perspective
There are three major tasks to be accomplished in this project, namely
programming the sensor nodes, programming the gateway and informing the manager
of the greenhouse. All information is gathered from the sensor nodes and the manager
of the greenhouse is informed with the information at the gateway, via both a user
friendly web site and sending SMS.
Programming the Sensor Nodes:
Sensor nodes measure periodically the temperature, light and humidity levels
and send these measurements to the gateway. However, they should do these
measurements by wasting least possible energy. Thus, in this task power conservative
routing algorithms will be implemented for sensor networks [7].
Programming the Gateway:
Three major operations should be accomplished in this task. Firstly, fix the errors
in the data coming from the sensor nodes. Then, consolidate the data. Lastly, save the
data to the PostgreSQL database on the computer which the gateway is connected.
Develop a web application:
A user friendly interface to the greenhouse manager will be provided with this
application so that the manager will be able to see meaningful information about his/her

greenhouse simultaneously. The past information and the comparisons of them with the
current information can also be seen through this web application.
Figure 1 - Wireless Sensor Network
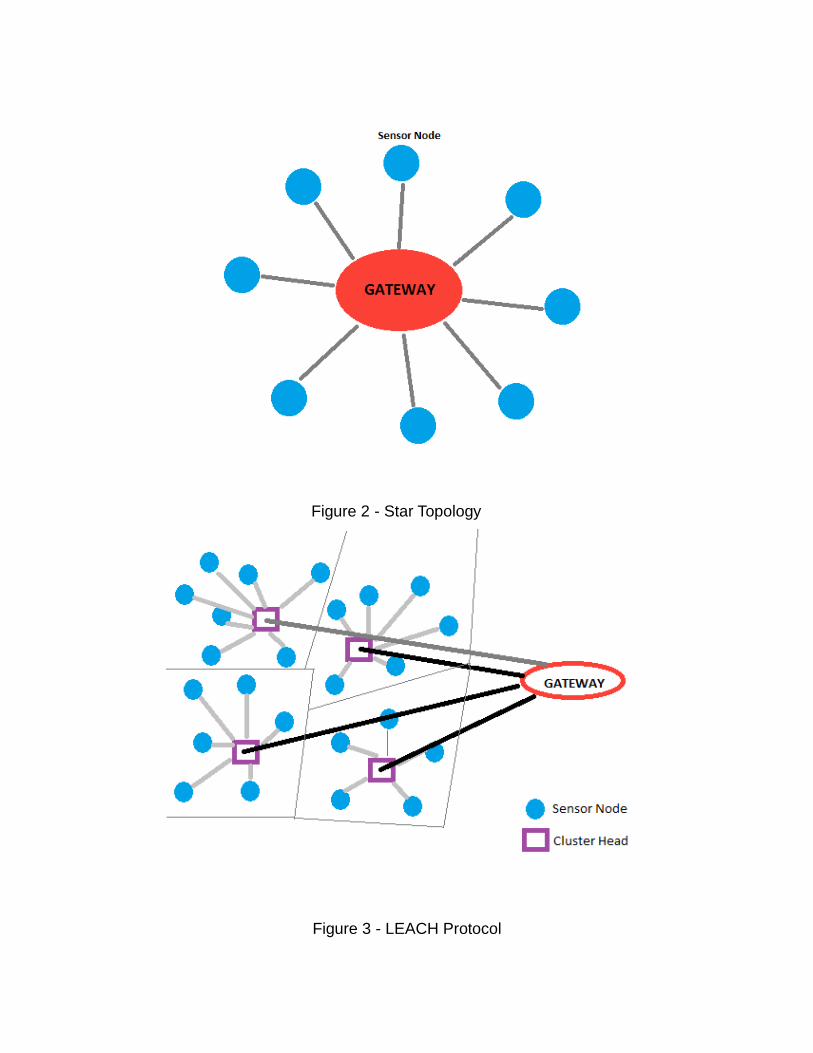
Figure 2 - Star Topology
Figure 3 - LEACH Protocol

2.2. Product Functions
● Accurately measuring the environment‟s temperature, light and humidity.
● Transmitting the measured data to the gateway.
● Evaluating the data and warning the user in an unexpected situation.
● Storing the collected data in the PostgreSQL database.
● Making it reachable through a user friendly website.
2.3. User Characteristics
The users are greenhouse managers who are supposed to know the optimal and
critical temperature, light and humidity levels for specific crops. Apart from that, basic
computer knowledge will be enough.
2.4. Constraints
A WSN consists of hundreds or maybe thousands of sensors which is an
important hardware constraint. We will only have 30 Processor/radio boards and 20
Sensor boards for this project so we will not be able to test our software with that much
of sensors but these are absolutely enough for proof of concept implementation.
2.6. Apportioning Requirements
Further enhancements to the LEACH protocol or an entire new protocol can be
developed after final product is done. Except from defined website, some design and
functionality for the website can be delayed.
3. Design Considerations
Sensor networks are large sets of small, inexpensive devices with hardware for
sensing and a radio for communication with the other sensors. Sensor networks are
being enabled by the convergence of several technologies at once. The advent of
cheap, low-power microprocessors and sensor technology has made it possible to

conceive of large networks which can together do what might be impossible or too
costly to do with fewer, more expensive nodes.
Many fundamental questions about wireless sensor networks remain
unsatisfactory. Among the questions considered in this area are: Is scheduling a better
way to control access in sensor networks? With what power should nodes in the
network transmit the data? Will nodes determine the transmission path themselves, and
if so, how?
Our wireless sensor network design uses a topology that aims to preserve
energy and provide an efficient algorithm to transmit data among sensors. Sensors will
in many cases face a short lifetime as a result of the limitations of battery technology,
and energy can be conserved by resolving the problem of elapsed time while
transmitting data. The result of applying this principle is that sensor architectures will be
optimized for two things: lasting a long time, and doing accurate measurements and
sending data through the shortest path concurrently.
We should optimize both lifetime and performance by applying the most efficient
way among sensors. For an energy-constrained node this way might be to choose the
path consuming least total energy. We aim to do this by building the leach topology but
there are dependencies and constraints that we will discuss in this section.
3.1. Design Assumptions, Dependencies and Constraints
In a sensor network, the nodes collaborate and interact with the environment; the
nodes know the data they carry. However, there are some dependencies and
constraints in a sensor network and we will discuss these in detail shortly.

Our first key requirement is reliability. In sensor networks, reliability refers not
only to the eventual delivery of data but also to the ability to detect physical phenomena
in the first place. The design of a sensor network is thus an important consideration.
A sensor network is not seen as a mere infrastructure for transporting data, but
the nodes are tasked with collaboratively monitoring and controlling the physical
environment. They have to process each other‟s data locally or while in transmission
toward some sink nodes and thus they have to know the data they forward. In the
problem of detection reliability, the main question is whether the events the network is
supposed to detect actually can be detected. A necessary prerequisite is that possible
event locations are covered by the sensing ranges of a number of sensors. The
required node density depends on the sensor‟s sensing ranges, the shape of the
sensing regions and environmental conditions.
The user wants to have credible information he can count on. Therefore, to
achieve information accuracy, multiple readings should be combined to eliminate noise
and detect abnormal data. On the other hand, too many similar sensor readings are a
waste of energy. We should handle this issue by applying the leach topology. Our
protocol must also comply with energy constraints and memory constraints of sensor
nodes.
LEACH partitions the nodes into clusters and in each cluster a dedicated node,
the cluster-head, is responsible for creating and maintaining a schedule; all the other
nodes of a cluster are non-cluster-heads. The CH aggregates the data of its members
and transmits it to the sink node. Since the sink is often far away, the CH must spend
significant energy for this transmission. For a non-CH it is typically much cheaper to
reach the CH than to transmit directly to the sink. In fact, with the exception of their time
slots, the non-CHs can spend their time in sleep state. The CH‟s role is energy
consuming since it is always switched on and is responsible for the long-range
transmissions. If a fixed node has this role, it would burn its energy quickly, and after it

died, all its members would be headless and thus useless. Therefore, this burden is
rotated among the nodes.
One last constraint is that memory limitation of sensors. Sensor networks can produce a
large volume of raw data. In wireless sensor networks, that mass of data is typically
aggregated in a large database, where it later processed, queried and searched. The
need for network processing necessitates that each sensor node act as a data
processing engine, an implementation of which is challenging on nodes that function
under tight CPU and memory constraints.
3.2. Design Goals and Guidelines
When sensor nodes are organized in clusters, they could use either single hop or
multi-hop mode of communication to send their data to their respective cluster heads.
We present a systematic cost-based analysis of only the single hop modes, and provide
results that could serve as guidelines to obtain the optimal performance. We determine
closed form expressions for the required number of cluster-heads and the required
battery energy of nodes. Our problem formulation also allows for the application to be
taken into account in the overall design problem through a data aggregation model.
4. Data Design
4.1. Data Description
This part of the document explains how the information domain of the system is
transformed into data structures. A data flow diagram is also included, however, a more
detailed data flow diagrams will be expanded in the detailed design report. Moreover,
the database that will be used in the web application component is thoroughly
explained.

4.1.1. Data Description of Sensor Nodes for Star Topology
In this part, the aim is to illustrate how the data is kept until it reaches to the
gateway. In this component, the data is kept on the sensor nodes. Below, all the fields of
the sensor nodes are described.
sensorId: Each sensor node will have a unique sensor id.
realTime: It keeps the time. The data is used to determine when the measurement is
made.
isCH: Its value is true if the sensor node is CH and false if it is non-CH. This field is
used in both modes.
sleepTime: It keeps how long a sensor node sleeps to sense the environment again.
dataToGateway: It keeps the data to be transmitted from sensor nodes to gateway.
4.1.2. Data Description of Sensor Nodes for LEACH
In this part, the aim is to illustrate how the data is kept until it reaches to the
gateway. In this component, the data is kept on the sensor nodes. The sensor nodes
could be in two different modes over time, thus some fields are used when the sensor
node is CH and some fields are used when the sensor node is non-CH. Below, all the
fields of the sensor nodes are described. It will be stated that which field is used when
the sensor node is acting as CH or non-CH, and the fields which are used in both
modes.
sensorId: Each sensor node will have a unique sensor id. This field is used in both
modes.
lastTimeElected: It keeps the last time a node is elected itself as a CH. It is one of the
data which is used for determination of each node to elect itself as CH in the next
election. The default value is -1. This field is used in both modes.

realTime: It keeps the time. The data is used to determine when the measurement is
made, and the next election time. Each sensor node, irrespective of its mode, must be
aware of the election time, thus, this field is used in both modes.
isCH: Its value is true if the sensor node is CH and false if it is non-CH. This field is
used in both modes.
electionPeriod: It keeps how long an election period is. It may be configured
depending on the application. This field is used in both modes.
totalNodeCount: It keeps how many sensor nodes are in the network. It is one of the
data which is used for each sensor node whether to elect itself as a CH in the next
election.
sleepTime: It keeps how long a non-CH sleeps to sense the environment again. This
field is used in non-CH mode.
dataToCH: It keeps the data packet to be transferred to CH‟s by each non-CH. The
packet is consisted of the sensed values of the sensor. This field is used in non-CH
mode.
CHId: It keeps which for each non-CH, which CH it sends the data in that period. The
field is set at every election for the non - CH‟s. This field is used in non-CH mode.
totalConnectedSensors: It keeps for each CH, how many non-CH has chosen that CH
as its CH. (i.e. how many non-CH will send its data in that period) . This field is used in
CH mode.
dataToGateway: It keeps the data to be transmitted from CHs to gateway. This field is
used in CH mode.
4.1.3. Data Description of Gateway
In this part, the aim is to illustrate how the data is kept until it is written to the
database.
greenHouseId: Each greenhouse will have a unique id. The id is important since the
data to be written from a greenhouse to the database must be identified properly.
networkData: It is the data coming from the CHs.
checkedData: It is the data that is further checked and to be written to the database.

4.1.4. Data Flow
The figure below briefly explains the data flow between the components.
4.1.5. Database Design
There is only one database in the system. This database contains 4 tables. The
first table, User, is used for storing user information. The table Greenhouse stores
averages of measurements in each greenhouse at each time interval. The Greenhouse
references User with Owner field. ClusterData table keeps the local measurement in a
cluster. Integrity constraints of ClusterData are that each ClusterId must be a SensorId
and GreenhouseId must be present in the Greenhouse. Sensor table keeps track of the
battery conditions of each sensor in all greenhouses.

Figure: ER Diagram of the database tables
4.1.5.1. User Table
This table keeps track of the users, the greenhouse owners. Each user has a
unique id and password. Moreover, all necessary communication information of the user
is kept.
Key Type Null Foreign
Key
References
UserId(PK) int no no no
UserName char[50] no no no
Password char[50] no no no
NotificationSettings int no no no
PhoneNumber char[20] yes no no
Email char[20] yes no no
Address char[100] yes no no
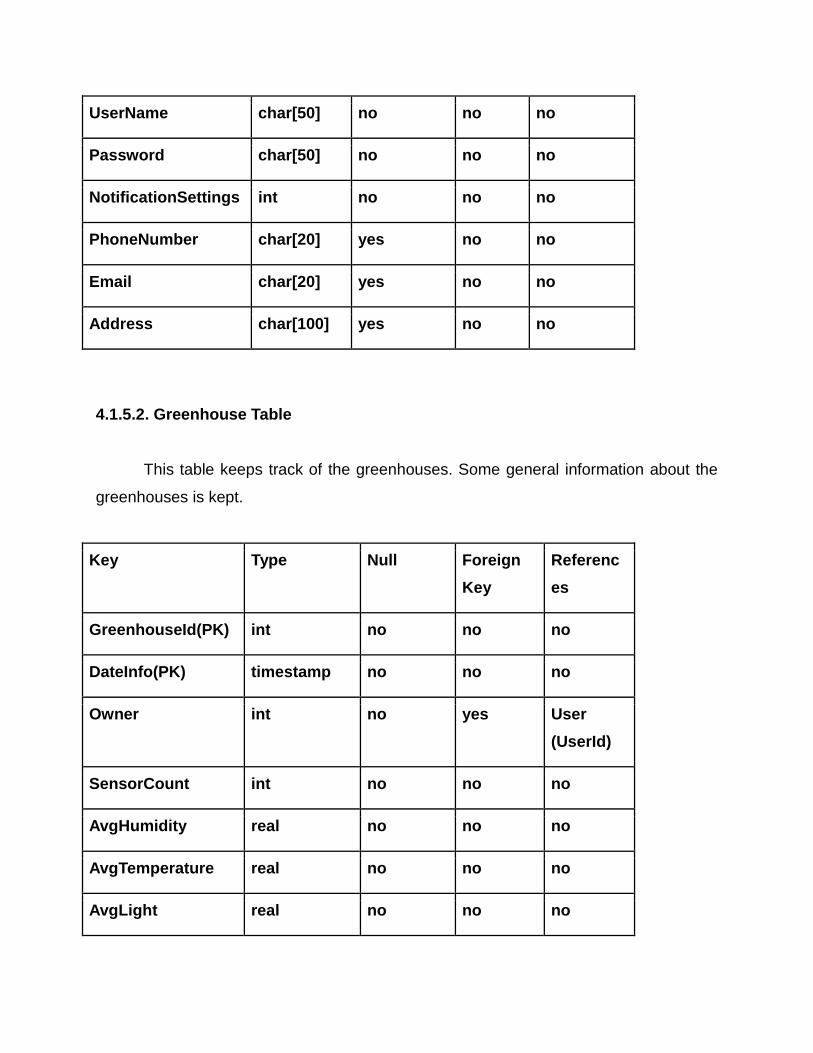
4.1.5.2. Greenhouse Table
This table keeps track of the greenhouses. Some general information about the
greenhouses is kept.
Key Type Null Foreign
Key
Referenc
es
GreenhouseId(PK) int no no no
DateInfo(PK) timestamp no no no
Owner int no yes User
(UserId)
SensorCount int no no no
AvgHumidity real no no no
AvgTemperature real no no no
AvgLight real no no no

4.1.5.3. ClusterData Table
This table keeps track of the data coming from the cluster heads. It helps to find
the light, temperature and humidity levels of regions in the greenhouse.
Key Type Null Foreign
Key
References
ClusterId(PK) int no yes Sensor(SensorId)
DateInfo(PK) timestamp no no no
GreenhouseId int no yes Greenhouse(GreenhouseId)
ClstrHumidity real yes no no
ClstrTemperature real yes no no
ClstrLight real yes no no
4.1.5.4. Sensor
This table keeps track of the sensor nodes. It keeps the battery level of each
individual sensor node.
Key Type Null Foreign Key References
SensorId(PK) int no no no
DateInfo(PK) timestamp no no no
GreenhouseId int no yes Greenhouse
(GreenhouseId)

BatteryLevel int no no no
5. System Architecture
5.1. Architectural Design
This section of the document aims to develop a modular system structure and
explain the relationships between the modules to achieve the complete functionality of
the system.
5.2. Description of Components
5.2.1. Component 1.1: Sensor Network for Star Topology

The below diagram shows a single sensor node and the associated data. The
sensor nodes are used to sense the environmental measurements and packaging.
PacketToGateway is used to transmit data from sensor nodes to gateway.
5.2.1.1. Processing Narrative for Sensor Network
In this component, the routing protocols are handled. The functionality of this
component is to transfer the sensed data to the gateway. The sensor nodes pack the
sensed data and send the packet to the gateway.
5.2.1.2. Sensor Network Interface Description
There is only one interface from sensor network. The interface is
“sendDataToGateway” which is between the sensor nodes and the gateway. It enables
the Sensor Network component to send the information gathered from the greenhouse
to the gateway via packetToGateway.
5.2.1.3. Sensor Network Processing Detail
● The sensors measure at regular intervals.
● Sends the data to the gateway.
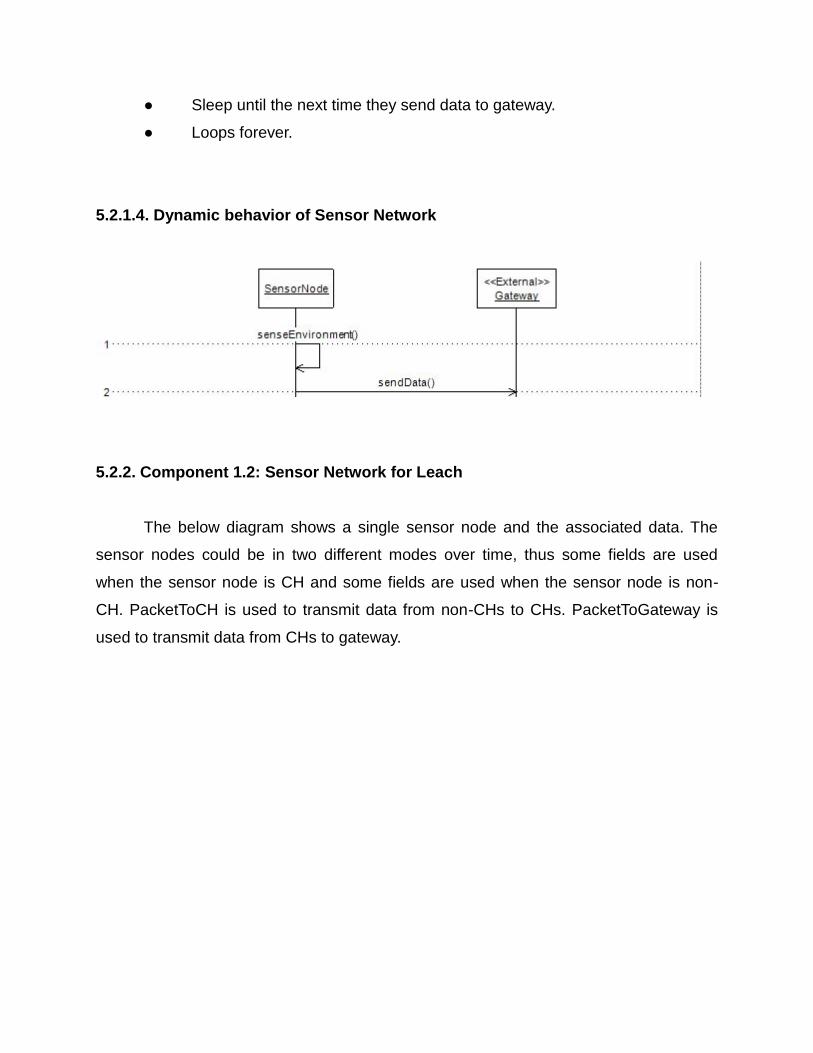
● Sleep until the next time they send data to gateway.
● Loops forever.
5.2.1.4. Dynamic behavior of Sensor Network
5.2.2. Component 1.2: Sensor Network for Leach
The below diagram shows a single sensor node and the associated data. The
sensor nodes could be in two different modes over time, thus some fields are used
when the sensor node is CH and some fields are used when the sensor node is non-
CH. PacketToCH is used to transmit data from non-CHs to CHs. PacketToGateway is
used to transmit data from CHs to gateway.

5.2.2.1. Processing Narrative for Sensor Network
In this component, the routing protocols are handled. The functionality of this
component is to transfer the sensed data to the gateway. The sensor nodes could be in
two different modes over time, CH and non-CH. Non-CH‟s send the sensed data to CHs
and CHs transmits the data to gateway.
5.2.2.2. Sensor Network Interface Description
There is only one interface from sensor network. The interface is
“sendDataToGateway”, as its name implies, it is between the CHs and the gateway. It
enables the Sensor Network component to send the information gathered from the
greenhouse to the gateway via packetToGateway.
5.2.2.3. Sensor Network Processing Detail
● Some of the sensor nodes elect themselves as CH for this round.

● Each node that elects itself a cluster-head for the current round broadcasts an
advertisement message to the rest of the nodes.
● Each non-CH decides the cluster to which it will belong for this round and informs the
CHs that it is a member of that cluster.
● Based on the number of nodes in the cluster, the CHs create a schedule telling each
sensor node when it can transmit.
● CHs send data to gateway.
● After a certain amount of time, which is determined a priori, the next round begins with
each node determining if it should be a CH for this round and advertising this
information.
● Loops forever.
5.2.2.4. Dynamic behavior of Sensor Network
5.2.2. Component 2: Gateway
5.2.2.1. Processing Narrative for Gateway
Gateway gets data coming from any sensor nodes, and checks the data. If there is not
any problem about the measurements, and packets, data is saved to the PostgreSQL
database. Otherwise, if the data is unrealistic, packet is corrupted or a sensor does not send
any packets, gateway handles the problems in different ways.
5.2.2.2. Gateway Interface Description
There is only one interface from gateway. The interface is
“writeCheckedDataToDatabase”, as its name implies, it is between the CHs and the
gateway. It enables the gateway component to write the checked information of the
whole greenhouse to the PostgreSQL via checkedData which is type of
packetToGateway[ ].
5.2.2.3. Gateway Processing Detail
● Gateway gets the data at any time.
● If there is not any problematic data, saves the data to the PostgreSQL.
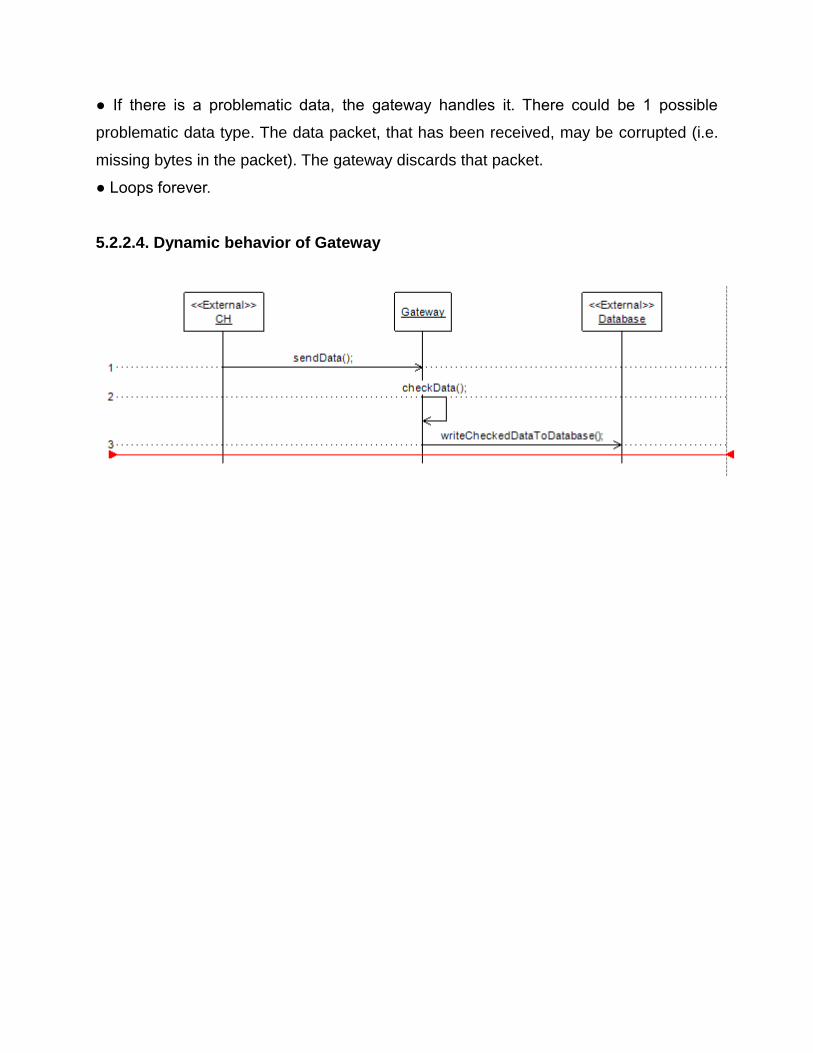
● If there is a problematic data, the gateway handles it. There could be 1 possible
problematic data type. The data packet, that has been received, may be corrupted (i.e.
missing bytes in the packet). The gateway discards that packet.
● Loops forever.
5.2.2.4. Dynamic behavior of Gateway

5.2.3. Component 3: Web Application
5.2.3.1. Processing Narrative for Web Application
Greenhouse managers can choose one of their greenhouses, and see the instant
measurements. Furthermore, the managers can see the past measurements, averages
and comparisons. If there is an abrupt change in the measurements (temperature,
humidity, light), manager would be informed via e-mail and/or SMS. User can view the
battery levels, signal qualities, percentage of erroneous packets of the sensor nodes.
Moreover, when the dead sensor nodes ratio exceeds a threshold, the manager is
informed via an e-mail and/or an SMS. The aim is to provide real-time greenhouse
environment observation to the managers.

5.2.3.2 Web Application Interface Description
There is one interface in the web application. The interface is in fact the user
interface, and it is widely covered in the section 6 of this document.
5.2.2.3. Web Application Processing Detail
● User shall log in to the main page with User ID and Password, to see his/her
greenhouse list.
● User shall click one of the greenhouses, then the new page loads, on which, instant
temperature, humidity and lightening measurements are shown.
● User shall enter a date, and see the average measurements for the date, can make
some comparisons.
● User shall check the health statuses of the sensor nodes, such as their battery levels,
signal qualities.
● User is informed via an e-mail and/or an SMS when the ratio of dead sensor nodes
exceeds a threshold.
5.2.2.4. Dynamic behavior of Web Application

6. User Interface Design
6.1. Overview
Greenhouse managers can perceive their greenhouses‟ conditions regarding to
both immediate data and past data. After logging in, they choose one of their
greenhouses, and see the instant measurements. In this page the manager can choose
to see detailed measurements, past measurements, graphical representation of
conditions, and states of the sensors (their battery levels and signal qualities). If there is
an abrupt change in the measurements (temperature, humidity, light), and when the
dead sensor nodes ratio exceeds a threshold, manager would be informed via e-mail
and/or SMS. The aim is to provide real-time greenhouse environment observation to the
managers.
6.2. Screen Images, Screen Objects and Actions
6.2.1. Login page

Firstly, the user accesses the “Login Page” as shown above. After entering a valid and
matching „User Name‟ and „Password‟, the user clicks the „Login‟ button, then directed to the
next page, which is “Selection Page” to select one of his/her greenhouses.
6.2.2. Selection Page
In this page, the user chooses one of the greenhouses from the combo box, then clicks
„Enter‟ button and directed to the “Main Page” which is shown in the next section.

6.2.3. Main Page
In the “Main Page” user can see the immediate data, which is average of the
measurements coming from all sensors at that time. Moreover, at the top of the page,
the user can see the average of the whole day up until that time. In this page the user
can choose to see past measurements, graphical view of an interval or states of the
sensor nodes.

6.2.4. Past Measurements
After selecting “Past Measurements” in the main page, in this section, the user enters
an past date, clicks „Go‟ button, then see the average measurements of the day and the
measurements in hourly intervals, and then the user can go back to the “Main page”.
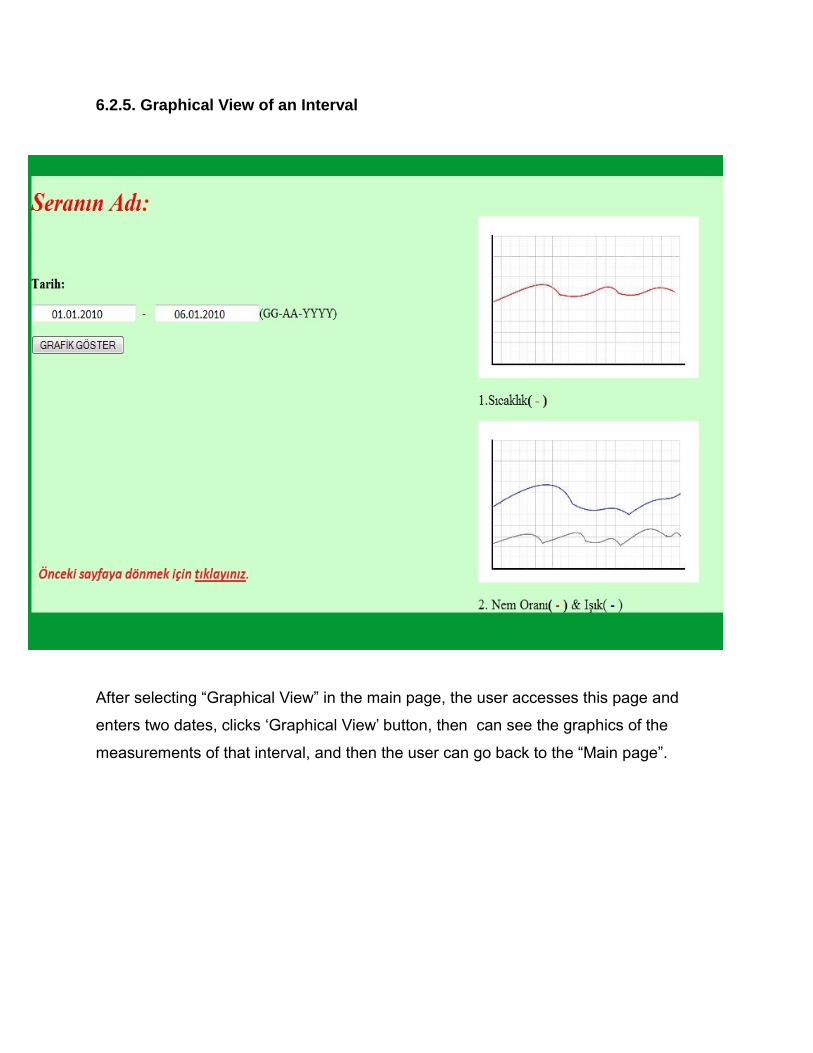
6.2.5. Graphical View of an Interval
After selecting “Graphical View” in the main page, the user accesses this page and
enters two dates, clicks „Graphical View‟ button, then can see the graphics of the
measurements of that interval, and then the user can go back to the “Main page”.

6.2.6. States of the sensors
After selecting “States of the sensors” in the main page, the user enters sees the battery
life of each sensor node, and then the user can go back to the “Main page”.
7. Detailed Design
In this section, details of each design component. These details include attribute descriptions
for identification, processing and data. In our project, we have three major components, namely,
Sensor Network, Gateway and Web Application.
7.1. Sensor Network
In this project, we are going to implement two different network protocols. We will start with
the Star topology based protocol and then we will go on with the LEACH protocol.
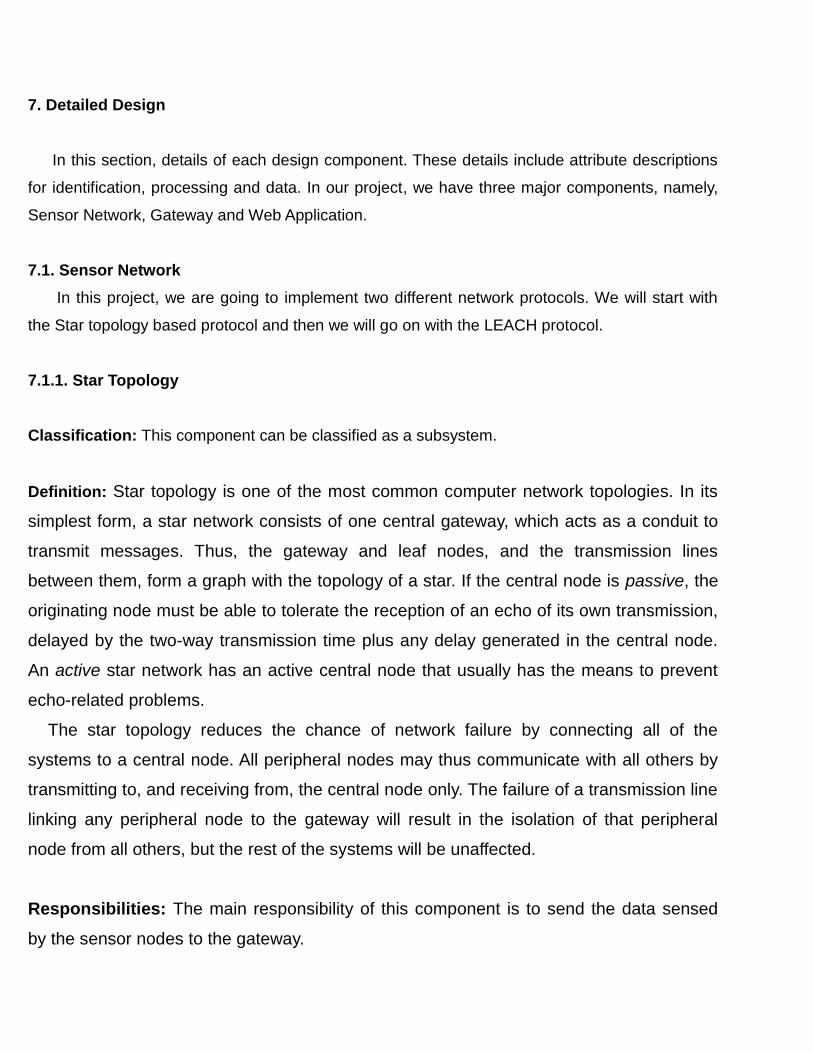
7.1.1. Star Topology
Classification: This component can be classified as a subsystem.
Definition: Star topology is one of the most common computer network topologies. In its
simplest form, a star network consists of one central gateway, which acts as a conduit to
transmit messages. Thus, the gateway and leaf nodes, and the transmission lines
between them, form a graph with the topology of a star. If the central node is passive, the
originating node must be able to tolerate the reception of an echo of its own transmission,
delayed by the two-way transmission time plus any delay generated in the central node.
An active star network has an active central node that usually has the means to prevent
echo-related problems.
The star topology reduces the chance of network failure by connecting all of the
systems to a central node. All peripheral nodes may thus communicate with all others by
transmitting to, and receiving from, the central node only. The failure of a transmission line
linking any peripheral node to the gateway will result in the isolation of that peripheral
node from all others, but the rest of the systems will be unaffected.
Responsibilities: The main responsibility of this component is to send the data sensed
by the sensor nodes to the gateway.

Constraints: The most important constraint of this component is the energy consumption.
Since energy consumption will inevitably require maintenance, this component must be
power conservative. Another important constraint of this component is the high
dependence of the system on the functioning of the gateway. If the gateway or the
computer connected to gateway is broken, the whole system goes down. The
performance and scalability of the network depends on the capabilities of the gateway.
Network size is limited by the number of connections that can be made to the gateway.
Moreover, since all the sensor nodes will send their data directly to the gateway, we
cannot distribute the sensor nodes in a wide area.
Composition: The network in a star topology can be thought as composition of distinct
sensor nodes. Each node does the same job. The details of the processing of the sensor
nodes are explained in the processing part.
Uses/Interactions: The network component is a separate subsystem which is consistent
on its own space. It measures the data, does some processing and sends this processed
data to gateway. Therefore, it only interacts with the gateway subsystem. Since the
component pre-processes the measured data the side effects are removed, resulting the
other components work on stable states.
Resources: Each sensor node is consisted of three parts, radio board, sensor board and
battery. Each sensor node uses its own processor and memory. Since the sensor nodes
are some kind of embedded devices, they have very limited resources. Thus, the code
working on them should be as simple as possible. Radio boards can transmit signals in a
300m radius area(when there is no obstacles such as a wall or tree). Batteries used are
6V lithium-carbon batteries, which we try to maximize the lifetime of it. There are no race
conditions and/or deadlock situations since each sensor node has a single thread working on
them.
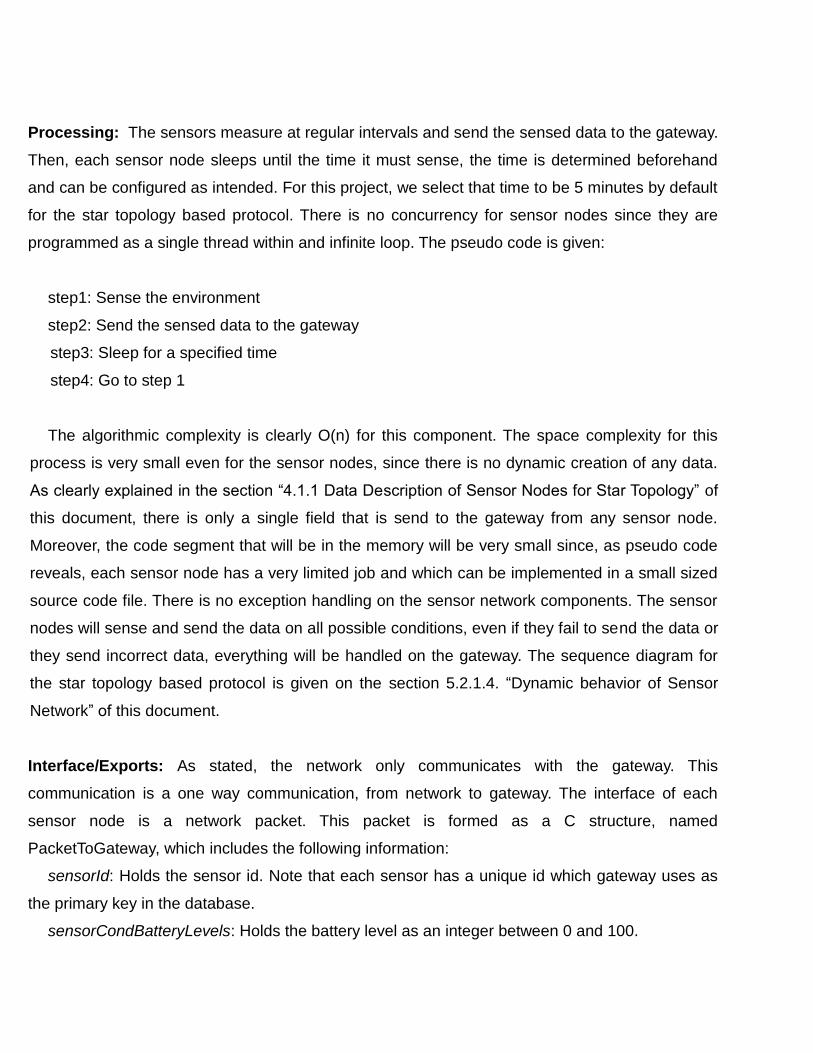
Processing: The sensors measure at regular intervals and send the sensed data to the gateway.
Then, each sensor node sleeps until the time it must sense, the time is determined beforehand
and can be configured as intended. For this project, we select that time to be 5 minutes by default
for the star topology based protocol. There is no concurrency for sensor nodes since they are
programmed as a single thread within and infinite loop. The pseudo code is given:
step1: Sense the environment
step2: Send the sensed data to the gateway
step3: Sleep for a specified time
step4: Go to step 1
The algorithmic complexity is clearly O(n) for this component. The space complexity for this
process is very small even for the sensor nodes, since there is no dynamic creation of any data.
As clearly explained in the section “4.1.1 Data Description of Sensor Nodes for Star Topology” of
this document, there is only a single field that is send to the gateway from any sensor node.
Moreover, the code segment that will be in the memory will be very small since, as pseudo code
reveals, each sensor node has a very limited job and which can be implemented in a small sized
source code file. There is no exception handling on the sensor network components. The sensor
nodes will sense and send the data on all possible conditions, even if they fail to send the data or
they send incorrect data, everything will be handled on the gateway. The sequence diagram for
the star topology based protocol is given on the section 5.2.1.4. “Dynamic behavior of Sensor
Network” of this document.
Interface/Exports: As stated, the network only communicates with the gateway. This
communication is a one way communication, from network to gateway. The interface of each
sensor node is a network packet. This packet is formed as a C structure, named
PacketToGateway, which includes the following information:
sensorId: Holds the sensor id. Note that each sensor has a unique id which gateway uses as
the primary key in the database.
sensorCondBatteryLevels: Holds the battery level as an integer between 0 and 100.

temperature, humidity, lightLevel: Holds the last measured temperature, humidity and light
levels respectively.
7.1.2. LEACH Protocol
Classification: This component can be classified as a subsystem.
Definition:
LEACH (Low-Energy Adaptive Clustering Hierarchy), a clustering-based protocol that utilizes
randomized rotation of local cluster base stations (cluster-heads) to evenly distribute the energy
load among the sensors in the network. LEACH uses localized coordination to enable scalability
and robustness for dynamic networks, and incorporates data fusion into the routing protocol to
reduce the amount of information that must be transmitted to the base station. The goal of
LEACH is to provide data aggregation for sensor networks while providing energy efficient
communication that does not predictably deplete some nodes more than others. In
LEACH protocol all nodes transmit to cluster heads, and the cluster heads aggregate and
compress the data and forward it to the base station. Each node uses a stochastic
algorithm at each round to determine whether it will become a cluster head in this round.
The most crucial requirement of becoming a CH is to have higher energy level of energy
than other sensor nodes. Moreover, there is no negotiation between nodes or the gateway
for selecting the CHs in the next round. The sensor nodes are randomized in such a way
that most of the time they advertise themselves as CH at the times they have higher levels
of energy relative to its neighbors. Thus, the ultimate aim of the LEACH protocol is to
extend the life span of the whole system by selecting the CHs among more powerful sensor
nodes.
Responsibilities: The main responsibility of this component is to send the data sensed by
the sensor nodes to the gateway.

Constraints: The most important constraint of this component is the energy consumption.
Since energy consumption will inevitably require maintenance, this component must be
power conservative. Moreover, since all the CHs, which are sensor nodes in fact, must be
able to send the data directly to the gateway, we cannot distribute the sensor nodes in a
wide area. For instance, if the greenhouse to be monitored is 2 kilometers length, we
cannot use this protocol.
Composition: The network in a LEACH protocol can be thought as composition of sensor
nodes and CHs. However, it should be noted that a sensor node could be CH or sensor
node overtime. The details of the processing of the sensor nodes and CHS are explained
in the processing part.
Uses/Interactions: The network component is a separate subsystem which is consistent
on its own space. It measures the data, does some processing and sends this processed
data to gateway. Therefore, it only interacts with the gateway subsystem. Since the
component pre-processes the measured data the side effects are removed, resulting the
other components work on stable states.
Resources: Each sensor node is consisted of three parts, radio board, sensor board and
battery. Each sensor node uses its own processor and memory. Since the sensor nodes
are some kind of embedded devices, they have very limited resources. Thus, the code
working on them should be as simple as possible. Radio boards can transmit signals in a
300m radius area (when there are no obstacles such as a wall or tree). Batteries used are
6V lithium-carbon batteries, which we try to maximize the lifetime of it. There are no race
conditions and/or deadlock situations since each sensor node has a single thread working on
them.

Processing:
The sensors measure at regular intervals and send the sensed data to the CHs. The CHs send
the average values of the data that come from the sensor node together with the battery levels of
each of the sensor node, which are calculated from the power of the radio transmission of the
sensor node to the CHs. This compression of the data to be sent to the gateway reduces the
energy consumption of the whole system a lot. The underlying reason is as follows, there are
many sensor nodes and they send their data to the CHs which are very close to them and only
CHs send data over a long distance. Since the energy consumption of a radio button and the
distance that it sends the data are proportional, the total energy consumption will be much less
compared to the other protocols. Another issue related with the energy consumption is that there
is no negotiations over being elected as a CH neither among the sensor nodes nor the gateway.
This also reduces the data to be transmitted, hence the energy consumption a lot. Moreover, after
sensing the environment, each sensor node sleeps until the time it must sense, the time is
determined beforehand and can be configured as intended. For this project, we select that time to
be 5 minutes by default for the LEACH protocol. There is no concurrency for sensor nodes since
they are programmed as a single thread within and infinite loop. It must again be noted that each
sensor node may act as a sensor node or a CH over the time. Here, for the convince of the
reader, we will give the pseudo codes of the two different execution flows separately. Firstly, we
start with the execution flow of the non-CH sensor nodes:
The pseudo code for non-CH sensor node:
step0: Try to elect itself as a CH for this round, however, the non-CHs are the sensor
nodes which fail to elect itself as CH, thus go to step1.
step1: Decide which CH to send the data for this round. The decision is based on
the signal level of the CHs which send advertisement to the sensor node.
step2: Inform the CHs that it is a member of that cluster
step3: Sense the environment
step4: Send the data to the CH that is determined at the beginning of this round.
step5: If it is election time go to step0 else go to step6.

step6: Sleep for a specified time. Go to step 3.
The pseudo code for CH sensor node:
step0: Try to elect itself as a CH for this round, however, the non-CHs are the sensor
nodes which elects itself as CH, thus go to step1.
step1: Broadcast an advertisement message to the rest of the sensor nodes in a
specified range.
step2: Based on the number of nodes in the cluster, the CHs create a schedule telling
each sensor node when it can transmit.
step3: After getting / waiting all the sensor nodes in the cluster, the CH compresses the
data to be sent to the gateway.
step4: Send the compressed data to the gateway.
step5: If it is election time go to step0 else go to step3.
The algorithmic complexity is clearly O(n) for this component, for both of the execution flows.
The space complexity for this process is very small even for the sensor nodes, since there is no
dynamic creation of any data. As clearly explained in the section “4.1.2 Data Description of
Sensor Nodes for LEACH” of this document, there is only a single field that is send to the
gateway from any sensor node. Moreover, the code segment that will be in the memory will be
very small since, as both pseudo codes reveal, each sensor node has a very limited job, as a CH
or non-CH, which can be implemented in a small sized source code file. There is no exception
handling on the sensor network components.
The sensor nodes will sense and send the data on all possible conditions, even if they fail to
send the data or they send incorrect data, they will send the data to the CHs. CHs will try to
eliminate all the corrupted data coming from the sensor nodes. Moreover, the data that is sent to
the gateway will be checked once more on the gateway. The sequence diagram for the star
topology based protocol is given on the section “5.2.1.4. Dynamic behavior of Sensor Network”
of this document.

Step0, in both execution flows, states that the sensor nodes try to elect itself as a CH.
Moreover, it is also stated in the document that, this step is done via randomization. This decision
is based on the suggested percentage of cluster heads for the network (determined a priori) and
the number of times the node has been a cluster-head so far. This decision is made by each of
the sensor nodes. There is no negotiation among the sensor nodes or the gateway to select the
CHs for the next round. Each sensor node chooses a random number n between 0 and 1 at the
beginning of each round. If the number is less than a threshold T(n), the node becomes a CH for
the current round. The threshold is set as:
where P is the desired percentage of cluster heads. For example, if we want four of the
hundred sensors to become the CH at each round, we assign P as 0.04. “r” is the current round
counter, and G is the set of nodes that have not been CH in the last 1/P rounds.
Using this threshold, each sensor will become as CH at some points within 1/P rounds. During
round 0, when r = 0, each node has a probability P of becoming a CH in that round. The nodes
that are CH at the 0th round cannot become CH in the next 1/P rounds. Thus, the probability that
the remaining nodes become CH is increased, since there are fewer nodes that are eligible to
become CH. After “1/P -1” rounds, T = 1 for any that have not been a CH, and after 1/P rounds,
all the sensor nodes will become eligible to be CH again.
Now, let‟s move on to the step 2 of the execution flow of the CHs. It states that, based on the
number of nodes in the cluster, the CHs create a schedule telling each sensor node when it can
transmit. In fact, , the CHs creates a TDMA schedule telling each node when it can transmit. This
schedule is broadcasted back to the nodes in the cluster. TDMA allows several sensor nodes to
share the same frequency channel by dividing the signal into different time slots. The sensor
nodes transmit in rapid succession, one after the other, each using its own time slot. This allows
all the sensor nodes and the CH to use the same radio frequency channel, which is required. The
scheduling is very simple, the CH will assign, for instance, at the begging of each second to one
of the sensor nodes that is in its cluster. Then, this information will be send to each of the non-CH

sensor nodes at the beginning of each round. Since, the sensor nodes will be sending data at
most once in a second or once in a 5 seconds and there will be at most 8 or 10 sensor nodes in
each cluster, assigning each of the sensor nodes a starting millisecond of a second obviously
works.
Interface/Exports:
As stated, only CHs communicate with the gateway. This communication is a one way
communication, from CHs to the gateway. The interface of each sensor node is a network packet.
This packet is formed as a C structure named PacketToGateway which includes the following
information:
sensorId: Holds the sensor id. Note that each sensor has a unique id which gateway uses as
the primary key in the database.
sensorCondBatteryLevels[][]: Holds the battery level as an integer between 0 and 100 for
every non-CH head that is attached to the CH.
averageTemperature, averageHumidity, averageLightLevel: Holds the average of the
measured temperature, humidity and light levels of the non-CH sensor cluster respectively.
7.2. Gateway
Classification: This component can be classified as a subsystem.
Definition: The gateway acts as the network coordinator in charge of node authentication,
message buffering, and bridging from the wireless network to the PostgreSQL database, where
you can collect, process, analyze, and present your measurement data. The PostgreSQL, which
is an object-relational database management system (ORDBMS), is an open-source software. It
supports a large part of the SQL standard and offers many modern features, such as complex
queries, foreign keys, triggers, transactional integrity, multiversion concurrency control, moreover,
can be expanding by the user by adding new data types, functions, operators etc.
Responsibilities: Responsibility of the gateway is receiving the data coming from the

sensor nodes, sending them to the PostgreSQL database.
Constraints: Since the gateway is connected to a computer, there is no constraint about energy
consumption. However there is another constraint about the gateway, the number of
connections that can be made to the gateway is limited and the packets can coincide. On
the other hand, the buffer of the gateway is limited, thus, when the maximum buffer limit is
reached, data transmission is suspended until the buffer has been emptied to avoid buffer
overflow.
Composition: The gateway can be considered as a programmed node connected to the
computer.
Uses/Interactions: The gateway is only interacted with a computer.
Resources: The gateway provides USB connectivity to the IRIS and MICA family of Motes for
communication and in-system programming. USB bus power eliminates the need for an external
power source. The gateway‟ baud rate is 57.6 K.
Processing: The gateway can get the data at any time, when a sensor sends a packet in „star
topology‟ version, when a CH sends a packet in „LEACH protocol‟ version. As clearly explained in
the section “4.1.3 Data Description of Gateway” of this document, the „checked data‟ and the
„greenhouse id‟ are sent to the PostgreSQL database. It checks the data in the „networkData‟
field, if there is no problematic data saves the data to the „checkedData‟ field. If there is a
problematic data, which means the packet is corrupted (i.e. missing bytes in the packet), the
gateway discard that packet.
step1: get the data at any time.
step2: check the data
step3: if there is not any problematic data, save the data to the PostgreSQL database, if
there is a problematic data discard that packet.
step4: go to step1.

The algorithmic complexity is clearly O(n) for this component. The sequence diagram for the star
topology based protocol is given on the section “5.2.2.4. Dynamic behavior of Gateway” of this
document.
Interface/Exports: As stated, the gateway only communicates with the PostgreSQL database.
This communication is a one way communication, from gateway to the PostgreSQL database.
The data is sent to the PostgreSQL database is have two fields, which are:
greenHouseId: Each greenhouse will have a unique id. The id is important since the
data to be written from a greenhouse to the PostgreSQL database must be identified
properly.
checkedData: It is the data that is further checked and to be written to the PostgreSQL
database.
7.3 Web Application
Classification: This component can be classified as a subsystem.
Definition: A web application is an application that is accessed over a network such as
the Internet or an intranet. Web applications are popular due to the ubiquity of web
browsers, and the convenience of using a web browser as a client. The ability to update
and maintain web applications without distributing and installing software on potentially
thousands of client computers is a key reason for their popularity, as is the inherent
support for cross-platform compatibility.
Responsibilities: The most important responsibility of the web application is creation of a user
friendly environment. The end user should easily understand the interface. It must be secure,
user information must be unavailable to other people. Database integrity is a must. Changing the
database management server must not cause any problem. Furthermore, changing the database
structure itself, without changing the interface, must not cause any problems.

Constraints: There is really not much constraints about the web application component. The
target market of this project is really small and many modern servers can easily handle user
requests. Also, these requests are not CPU-consuming operations, they are simply database
fetch operations.
Composition: The design of the component is object oriented. There are five classes in this
design:
WebApplication: This class starts the web application and always works on the
background.
NotifyUsers: This class will act as a daemon thread which will check the database in
predefined intervals and notifies users when needed.
Database: This class is an adapter class which connects to the database, executes the
command given by user and returns the result.
User : The user class represents the user. Each user will run on different threads.
Therefore it only makes sense that User class to extend Thread.
Greenhouse: The greenhouse class has the functions, showInstantData and
showPreviousData. Whenever the user requests some data, this message is passed to the
Greenhouse instance in the user class. Then using its functions, that instance
connects to the database and performs the request.
Uses/Interactions: This component interacts with the gateway subsystem. Interaction takes
place through the database. This component also interacts with the user. This is the only
component which end users can make use of the whole system. User interacts with the web
application via GUI. Side effects of the user interaction do not effect the other parts of the system.
Resources: The web application subsystem needs some resources. Firstly, an external database
is used for storing data. A database management server will also be needed. Also, a web server
is required to host the database and application itself. In the application, there are no race
conditions or deadlock situations. Because, each user can only connect to mutually exclusive
parts of the database. Therefore, different user threads never need to wait for the others.

Processing: The web application has two different processes. The first process happens only a
user enters the system and it is directed by the interaction between the user and the web
application. The second process routinely occurs all the time independent of the user. The details
of these two processes are explained below.
Processing of the user-website interaction:
This process is started by the user via entering the web address in a browser. Upon entering the
web site, web server creates a separate connection thread for the user and user is directed to
main page. The main page is a classic login page which contains a username field and a
password field. Also, there will be a password reminder choice for the users who have forgotten
their password or username. Password reminder functionality needs user to enter his/her e-mail
address. The user is matched with the mail address using the database, then user‟s username
and password is sent to that mail address. Continuing with the main flow, after log in takes place,
user is directed to a page which shows his greenhouse list. This page also includes a link to
settings page, from which user can change his settings.
Alternate Flow 1: User selects one of his greenhouses and directed to the page for that
greenhouse. This page has three functions. Firstly, latest measurements of that
greenhouse is loaded from the database and presented to the user. Second
functionality of this page is that user can request the past measurement data as a list or a
graph by entering the time intervals in the fields. Lastly, user can change the critical
measurement values for that greenhouse.
Alternate Flow 2: User enters the settings page. In settings page, user can change any of his
information. Also, in settings page, user can change his notification settings. User can choose
to be notified via text message or e-mail or not to be notified at all.
After user is done with his job, user can log out. Note that on every page there shall be a log out
button. When logged out the thread related with that user is terminated. If the user does not log
out properly as expected, the session will be terminated after 1 hour not to cause resource leaks.

Processing of the routine database check:
The other task of the web application is notifying the user when an unexpected situation arises.
This situation happens in two conditions. First, the last temperature or humidity value measured is
too high or too low. Second, the batteries of most of the sensors are run out and sensor network
will not work properly. This routine database check is performed by a daemon thread working all
the time. This thread checks each greenhouse in 5 minute intervals and notifies the owner of that
greenhouse by the notification method the owner has defined previously.
As for the time complexity, since this is a basic web application there is not CPU-time consuming
complex algorithm. The time complexity is irrelevant to the subject. Space complexity also is not a
problem. The action done by users does not too many data to main memory, and the memory is
freed when the page user requested is displayed. Concurrency issues naturally occurs because
of the presence multi-threaded system. Right now, we do not know how much user threads can
be supported by an average web server; However that is an hardware issue which can be solved
only after testing phase. Also another concurrency issue occurs when different users try to fetch
data from the database. This problem is solved by DBMS. The exceptional conditions related with
business logic will be handled as explained throughout the report. Other than that, if the system
stops working properly or some huge resource leaks happens overtime due to the reasons we
cannot think of right now, the web application shall check the state and shall restart the system if
needed.
Interface/Exports:
The web application communicates the other parts of the system through the database. This
database can be thought as a interface between this component and the gateway component.
The database is explained in more detailed in part 4.1.5. The other interface is between the web
application and end user, which is user interface. User interface is shown as a draft in the section
“6.User Interface Design” of this document.

8. Libraries and Tools
8.1 Libraries
8.1.1 Libraries For The Programming Sensor Nodes and Gateway
8.1.1.1 “mote.h”
The “mote.h” header file simply provides declarations of these and other basic functions. The
usual C main function is called automatically when the mote boots.
8.1.1.2 Existing C Libraries
Furthermore, nesC programs may always call existing C library functions, either from the
standard C library (e.g., mathematical functions like sin) or functions from a personal library of
existing C code. Thus, math.h, vector.h, stdio.h and time.h will be used.
8.1.2 Libraries for Developing Web Application
8.1.2.1 java.sql Package
Provides the API for accessing and processing data stored in a data source using the Java
programming language.
8.1.2.2 java.util Package
Contains the collections framework, legacy collection classes, event model, date and time
facilities, internationalization, and miscellaneous utility classes (a string tokenizer, a random-
number generator, and a bit array).
8.1.2.3 Java Servlet API
Servlets are protocol- and platform-independent server side components, written in Java,
which dynamically extend Java enabled servers. They provide a general framework for services
built using the request-response paradigm. Their initial use is to provide secure web-based

access to data which is presented using HTML web pages, interactively viewing or modifying that
data using dynamic web page generation techniques.
8.1.2.4 javax.swing
It packages a set of GUI components. Swing components draw themselves on the screen
(lightweight). Swing applications will look the same on all platforms.
8.1.2.5 PostgreSQL.jar
It allows Java programs to connect to a PostgerSQL database using standard, database
independent Java code. It is a pure Java implementation. The driver provides are reasonably
complete implementation of the JDBC 3 specification in addition to some PostgerSQL
specific extensions.
8.2 Tools
8.2.1 NesC (Network Embedded Systems C)
NesC is an extension to the C programming language designed to embody the
structuring concepts and execution model of TinyOS. TinyOS is an event-driven operating system
designed for sensor network nodes that have very limited resources. Since the sensor nodes we
are going to use have very limited resources, we will use nesC to program them. Below there are
some nesC features:
Whole-program analysis: nesC programs are subject to whole program analysis for safety and
optimization for performance. Therefore separate compilation does not take into consideration in
nesC‟s design. The limited program size on motes makes this approach tractable.
nesC is a “static language”: There is no dynamic memory allocation and the call-graph is fully
known at compile-time. These restrictions make whole program analysis and optimization
significantly simpler and more accurate. They sound more onerous than they are in practice.
nesC‟s component model and parametrized interfaces eliminate many needs for dynamic
memory allocation and dynamic dispatch.
nesC supports and reflects TinyOS’s design: nesC is based on the concept of components, and
directly supports TinyOS‟s event based concurrency model. Additionally, nesC explicitly
addresses the issue of concurrent access to shared data. In practice, nesC resolved many
ambiguities in the TinyOS concepts of components and concurrency, and TinyOS evolved to the
nesC versions as it was reimplemented.
8.2.2 NesC Compiler: ncc
It is nesC compiler for TinyOS. It is Implemented as an extension to GCC and called via
TinyOS wrapper ncc. Platform code implements API of macros and functions in C and output
C code or object code.
8.2.3 Java
Java is high-level, object oriented programming language developed by Sun
Microsystems. Java is a general purpose programming language with a number of features that
make the language well suited for use on the World Wide Web.
8.2.4 Javac
The javac tool reads class and interface definitions, written in the Java programming language, and
compiles them into byte code class files.
8.2.5 Mote-View
MOTE-VIEW is designed to be an interface (“client layer”) between a user and a
deployed network of wireless sensors. MOTE-VIEW provides users the tools to simplify
deployment and monitoring. It also makes it easy to connect to a database, to analyze, and to
graph sensor readings.
8.2.6 Moteworks
MoteWorks is the end-to-end enabling platform for the creation of wireless sensor
networks. The optimized processor/radio hardware, industry-leading mesh networking software,

gateway server middleware and client monitoring and management tools support the creation of
reliable, easy-to-use wireless OEM solutions. OEMs are freed from the detailed complexities of
designing wireless hardware and software enabling them to focus on adding unique differentiation
to their applications while bringing innovative solutions to market quickly.
8.2.7 TOSSIM
TOSSIM is the TinyOS simulator. TOSSIM compiles directly from TinyOS code, and is
by default automatically compiled .TOSSIM simulates entire TinyOS applications. It works by
replacing components with simulation implementations. It provides several mechanisms for
interacting with the network; packet traffic can be monitored, packets can be statically or
dynamically injected into the network, and TinyOS call invocation can be logged. Moreover,
because TinyOS applications run as native code under TOSSIM, traditional debugging tools
can be used.
8.2.8 Smart Draw
Smart Draw is a visual processor used to create flowcharts, organization charts, mind
maps, project charts, and other visuals. It integrates with Microsoft Word, Excel, PowerPoint
and Microsoft Project; it can export diagrams to common image formats and PDF format.
We used SmartDraw for drawing data flow diagrams, UML diagrams and ER diagrams. We
used this also in topic 9 for drawing the Gantt chart for the first term.
8.2.9 Sequence Diagram Editor
Sequence Diagram Editor is a Windows tool that helped us quickly and easily create
UML sequence diagrams and call flows. It automatically takes care of tedious layout and
formatting tasks allowing you to create sequence diagrams. We used this tool for the Sequence
diagrams in topic 5.
8.2.10 Microsoft Project Professional
Microsoft Project is a project management software program which assisted us in
developing plans, tracking progress and analyzing workloads. We used this in topic 9 for drawing
the Gantt chart for the second term.

9 Time Schedule
9.1 Gannt Chart for Term 1
9.2 Gannt Chart for Term 2

10 Conclusion
Greenhouses prevent the plant from the effects of climate, inspect and so on, which makes great
sense for agricultural production. The automation and high efficiency on greenhouse environment
monitoring and control are crucial. Applying WSN technologies to greenhouses is a revolution for
protected agriculture which overcomes the limits of wire connection systems.
In this report, the overall WSN system architecture and data architecture is defined. The
design of the subsystems/modules are included. All the necessary diagrams such as ER
diagrams, sequence diagrams and class diagrams are included. This document includes almost
enough information to the developers of this area.