Detailed characterization of local field potential...
22
NEUROENGINEERING ORIGINAL RESEARCH ARTICLE published: 25 October 2011 doi: 10.3389/fneng.2011.00012 Detailed characterization of local field potential oscillations and their relationship to spike timing in the antennal lobe of the moth Manduca sexta Kevin C. Daly 1 *, Roberto F. Galán 2 , Oakland J. Peters 1 and Erich M. Staudacher 1 1 Department of Biology, West Virginia University, Morgantown, WV, USA 2 Department of Neurosciences, Case Western Reserve, Cleveland, OH, USA Edited by: Thomas Nowotny, University of Sussex, UK Reviewed by: VassiliyTsytsarev, George Mason University, USA Paul Szyszka, Universität Konstanz, Germany *Correspondence: Kevin C. Daly, Department of Biology, West Virginia University, PO Box 6057, Morgantown, WV 26506, USA. e-mail: [email protected] The transient oscillatory model of odor identity encoding seeks to explain how odorants with spatially overlapped patterns of input into primary olfactory networks can be discriminated. This model provides several testable predictions about the distributed nature of network oscillations and how they control spike timing.To test these predictions, 16 channel elec- trode arrays were placed within the antennal lobe (AL) of the moth Manduca sexta. Unitary spiking and multi site local field potential (LFP) recordings were made during spontaneous activity and in response to repeated presentations of an odor panel. We quantified oscil- latory frequency, cross correlations between LFP recording sites, and spike–LFP phase relationships. We show that odor-driven AL oscillations in Manduca are frequency modu- lating (FM) from ∼100 to 30 Hz; this was odorant and stimulus duration dependent. FM oscillatory responses were localized to one or two recording sites suggesting a localized (perhaps glomerular) not distributed source. LFP cross correlations further demonstrated that only a small (r < 0.05) distributed and oscillatory component was present. Cross spec- tral density analysis demonstrated the frequency of these weakly distributed oscillations was state dependent (spontaneous activity = 25–55 Hz; odor-driven = 55–85 Hz). Surpris- ingly, vector strength analysis indicated that unitary phase locking of spikes to the LFP was strongest during spontaneous activity and dropped significantly during responses. Appli- cation of bicuculline, a GABA A receptor antagonist, significantly lowered the frequency content of odor-driven distributed oscillatory activity. Bicuculline significantly reduced spike phase locking generally, but the ubiquitous pattern of increased phase locking during spon- taneous activity persisted. Collectively, these results indicate that oscillations perform poorly as a stimulus-mediated spike synchronizing mechanism for Manduca and hence are incongruent with the transient oscillatory model. Keywords: olfaction, odor coding, oscillations, synchrony, GABA A , olfactory bulb, antennal lobe INTRODUCTION Odor stimulation drives a combinatorial spatio-temporal response in first-order olfactory processing centers, the insect anten- nal lobe (AL), and the vertebrate olfactory bulb (OB). Sev- eral aspects of these physiological responses have been cor- related with an animal’s ability to discriminate between even subtly different odorant stimuli in behavioral assays (Stopfer et al., 1997; Daly et al., 2001; Linster et al., 2001; Wright et al., 2002; Galán et al., 2004). For example, odor can drive local field potential oscillations (LFPOs) at species-specific frequencies (Gelperin and Tank, 1990; Heinbockel et al., 1998). Superim- posed on these LFPOs are what has been described as slower temporal patterns of action potentials among populations of principal output cells of the AL/OB (for review see Laurent et al., 2001). At least a subset of action potentials from these responses has been shown to correlate to a specific phase range (i.e., phase lock) of the LFPOs in the locust (Laurent and Davidowitz, 1994; Laurent and Naraghi, 1994; Laurent et al., 1996a,b, 2001; MacLeod and Laurent, 1996; Wehr and Laurent, 1996). Selective disruption of GABA A receptor signaling in the locust AL interferes with fast inhibitory synaptic interactions, thereby disrupting odor-driven oscillations in the AL and its primary projection fields (MacLeod and Laurent, 1996). Disruption of GABA A mediated oscillations also appears to affect discrimination of closely related monomolecular odors in mouse and honeybee (Stopfer et al., 1997; Nusser et al., 2001). Thus, based on compara- tive data from locust (Laurent and Davidowitz, 1994; Laurent and Naraghi, 1994; Wehr and Laurent, 1996, 1999), honeybee (Stopfer et al., 1997), zebra fish (Friedrich and Laurent, 2001), and mice (Nusser et al., 2001), a general model of olfactory encoding has been proposed, positing that stimulus driven LFPOs synchronize transiently active spiking responses across a distributed network of principal output cells in order to mediate enhanced odor dis- crimination over time in downstream brain centers, such as the insect mushroom bodies (MB; for review see Laurent, 2002). Frontiers in Neuroengineering www.frontiersin.org October 2011 |Volume 4 | Article 12 | 1
Transcript of Detailed characterization of local field potential...
NEUROENGINEERINGORIGINAL RESEARCH ARTICLE
published: 25 October 2011doi: 10.3389/fneng.2011.00012
Detailed characterization of local field potential oscillationsand their relationship to spike timing in the antennal lobeof the moth Manduca sextaKevin C. Daly 1*, Roberto F. Galán2, Oakland J. Peters1 and Erich M. Staudacher 1
1 Department of Biology, West Virginia University, Morgantown, WV, USA2 Department of Neurosciences, Case Western Reserve, Cleveland, OH, USA
Edited by:
Thomas Nowotny, University ofSussex, UK
Reviewed by:
Vassiliy Tsytsarev, George MasonUniversity, USAPaul Szyszka, Universität Konstanz,Germany
*Correspondence:
Kevin C. Daly , Department of Biology,West Virginia University, PO Box 6057,Morgantown, WV 26506, USA.e-mail: [email protected]
The transient oscillatory model of odor identity encoding seeks to explain how odorants withspatially overlapped patterns of input into primary olfactory networks can be discriminated.This model provides several testable predictions about the distributed nature of networkoscillations and how they control spike timing. To test these predictions, 16 channel elec-trode arrays were placed within the antennal lobe (AL) of the moth Manduca sexta. Unitaryspiking and multi site local field potential (LFP) recordings were made during spontaneousactivity and in response to repeated presentations of an odor panel. We quantified oscil-latory frequency, cross correlations between LFP recording sites, and spike–LFP phaserelationships. We show that odor-driven AL oscillations in Manduca are frequency modu-lating (FM) from ∼100 to 30 Hz; this was odorant and stimulus duration dependent. FMoscillatory responses were localized to one or two recording sites suggesting a localized(perhaps glomerular) not distributed source. LFP cross correlations further demonstratedthat only a small (r < 0.05) distributed and oscillatory component was present. Cross spec-tral density analysis demonstrated the frequency of these weakly distributed oscillationswas state dependent (spontaneous activity = 25–55 Hz; odor-driven = 55–85 Hz). Surpris-ingly, vector strength analysis indicated that unitary phase locking of spikes to the LFP wasstrongest during spontaneous activity and dropped significantly during responses. Appli-cation of bicuculline, a GABAA receptor antagonist, significantly lowered the frequencycontent of odor-driven distributed oscillatory activity. Bicuculline significantly reduced spikephase locking generally, but the ubiquitous pattern of increased phase locking during spon-taneous activity persisted. Collectively, these results indicate that oscillations performpoorly as a stimulus-mediated spike synchronizing mechanism for Manduca and henceare incongruent with the transient oscillatory model.
Keywords: olfaction, odor coding, oscillations, synchrony, GABAA, olfactory bulb, antennal lobe
INTRODUCTIONOdor stimulation drives a combinatorial spatio-temporal responsein first-order olfactory processing centers, the insect anten-nal lobe (AL), and the vertebrate olfactory bulb (OB). Sev-eral aspects of these physiological responses have been cor-related with an animal’s ability to discriminate between evensubtly different odorant stimuli in behavioral assays (Stopferet al., 1997; Daly et al., 2001; Linster et al., 2001; Wright et al.,2002; Galán et al., 2004). For example, odor can drive localfield potential oscillations (LFPOs) at species-specific frequencies(Gelperin and Tank, 1990; Heinbockel et al., 1998). Superim-posed on these LFPOs are what has been described as slowertemporal patterns of action potentials among populations ofprincipal output cells of the AL/OB (for review see Laurentet al., 2001). At least a subset of action potentials from theseresponses has been shown to correlate to a specific phase range(i.e., phase lock) of the LFPOs in the locust (Laurent andDavidowitz, 1994; Laurent and Naraghi, 1994; Laurent et al.,
1996a,b, 2001; MacLeod and Laurent, 1996; Wehr and Laurent,1996).
Selective disruption of GABAA receptor signaling in the locustAL interferes with fast inhibitory synaptic interactions, therebydisrupting odor-driven oscillations in the AL and its primaryprojection fields (MacLeod and Laurent, 1996). Disruption ofGABAA mediated oscillations also appears to affect discriminationof closely related monomolecular odors in mouse and honeybee(Stopfer et al., 1997; Nusser et al., 2001). Thus, based on compara-tive data from locust (Laurent and Davidowitz, 1994; Laurent andNaraghi, 1994; Wehr and Laurent, 1996, 1999), honeybee (Stopferet al., 1997), zebra fish (Friedrich and Laurent, 2001), and mice(Nusser et al., 2001), a general model of olfactory encoding hasbeen proposed, positing that stimulus driven LFPOs synchronizetransiently active spiking responses across a distributed networkof principal output cells in order to mediate enhanced odor dis-crimination over time in downstream brain centers, such as theinsect mushroom bodies (MB; for review see Laurent, 2002).
Frontiers in Neuroengineering www.frontiersin.org October 2011 | Volume 4 | Article 12 | 1

Daly et al. Local field potentials and spike timing
However, odor discrimination is also correlated with more par-simonious encoding models such as odor dependent patterns ofspike bursting (Stopfer et al., 2003; Daly et al., 2004b; Lehmkuhleet al., 2006), which optimize on a relatively shorter time scale (ca.∼140–240 ms after stimulus onset). This rapid timescale is consis-tent with correspondingly rapid and accurate behavioral responsesin discrimination tasks in both insects and mammals (Uchidaand Mainen, 2003; Budick and Dickinson, 2006; Wesson et al.,2008a,b). Spatial mapping of odorant responses in the OB and ALsuggest that fine odor discrimination can be largely accounted forby subtle differences in glomerular input patterns alone (Johnsonet al., 1998, 1999, 2005; Linster et al., 2001; Galán et al., 2004). Con-sistent with the notion that both spatial and temporal processescontribute to odor discrimination, we have recently shown thatboth odor dependent spatial patterns of glomerular output andspatio-temporal sequences of activations of these glomeruli canbe observed during a response (Staudacher et al., 2009). In thiscase temporal patterns evolved over a ∼120-ms response windowin an odor dependent manner. However, when data are collapsedacross time, the spatial pattern alone remains odor dependent.Thus even within a given species, there are odor dependent spatialand temporal components that correlate to an animal’s ability todiscriminate.
The goal of the current study therefore was to better charac-terize oscillatory dynamics within the AL of the moth Manducaand to specifically establish whether odor-driven oscillations drivespike timing in a manner consistent with the transient oscillatorymodel. Specifically, we wanted to test the following predictions ofthis model: (1) Odor-driven LFPOs should be distributed acrossthe AL; (2) The frequency content of these oscillations are: (a) ofa consistent and stable frequency; (b) independent of the odordelivered and (c) occur reasonably consistently in response timeacross stimulus repeats; (3) unitary spiking responses should phaselock to oscillations; (4) this phase locking should be enhancedduring odor-driven responses, relative to spontaneous activity;and (5) the local inhibitory network should establish oscilla-tory activity in the field and hence affect precise spike timing.To test these hypotheses, we placed 16 channel silicon micro-electrode arrays within the AL to record spatial and temporalpatterns of spiking activity across ensembles of sorted neuralunits. In addition, we recorded local field potentials (LFP) in mul-tiple locations across the electrode array to investigate whetherresponses were localized or distributed. These recordings weremade during both spontaneous activity and in response to odorstimulation in order to compare oscillatory and spiking activityduring spontaneous epochs (i.e., ongoing processes of an activesystem), and during odor-driven responses. This allowed us totest whether the evolution of odor-driven oscillatory activity wasassociated with increased phase locking of individual cells. Finally,in order to address the functional role of local inhibition, theabove observations were made before and during GABAA receptorblockade.
MATERIALS AND METHODSMOTHSMale Manduca moths were reared at West Virginia Universityusing standard rearing procedures (Bell and Joachim, 1976). At
stage 18 of pupal development, pupae were placed individuallyinto paper bags and stored in a Percival incubator at 25˚C witha reversed 16:8 LD cycle and 75% relative humidity. Moths wereallowed to develop 5–7 days post eclosion, prior to experimentaluse; this ensures complete development of the AL and is consistentwith our other behavioral studies.
NEUROPHYSIOLOGICAL PREPARATIONThe method used for preparing moths has been described in detailelsewhere (Daly et al., 2004a,b). Briefly, individual moths wereplaced into a 14-mm ID copper tube and their heads firmly fixedto this tube with molten soft dental wax. An approximately 2 mm2
window was cut into the top center of the head capsule. Next, cutswere made around the perimeter of the bilateral pair of pharyngealdilator muscles (again ∼2 mm2). The pharyngeal dilator muscleswith attached head capsule cuticle were then slid forward into thepreviously cut window. The repositioned section of cuticle wasthen glued into position with superglue. By moving these feedingmuscles, the brain can be directly accessed while leaving the animalfunctionally completely intact (Daly et al., 2004a). The preparedmoth was then positioned on an air table and standard physiolog-ical saline was applied to the opened head to remove hemolymphand keep the brain moist. The flagellum of the ipsilateral antennawas then placed into a glass sleeve (ID 2.5 mm), which was con-nected to an olfactometer. Finally, the 16 channel electrode array(Neuronexus 2 × 2 tet) was placed into the AL using a high reso-lution motorized micromanipulator and controller (WPI HS6-3)under visual control. The probes were placed along a visually iden-tifiable anatomical boundary between the AL and the rest of thebrain, so that the probe array was located at the very caudal bound-ary of the AL. The depth of the deepest electrode in the array wasbetween 500 and 600 μm, although this varied somewhat frommoth to moth and was optimized for each recording. The com-pleted preparation provided stable recordings for several hours.All recordings were performed between 1 and 4 h after the start ofthe moth’s subjective night when they are normally active.
ODOR AND DRUG DELIVERYThree microliters of monomolecular odorants were individuallyplaced, undiluted, onto a ∼3-mm × 30-mm strip of Whatman fil-ter paper and placed into a ∼1.7-ml glass cartridge (see Table 1for odor list). The cartridge ends were made of 1/16 in ID nylon
Table 1 | List of odorants used.
Odorant Source Purity Density
1-pentanone Sigma 99% 0.815
1-hexanol Sigma 97% 0.861
1-heptanol Sigma 98% 0.822
1-octanol Sigma 99% 0.82
1-nonanol Fluka 98% 0.88
1-decanol Sigma 97% 0.89
2-hexanone Sigma 98% 0.81
2-octanone Sigma 98% 0.82
2-nonanone Sigma 99% 0.821
2-decanone Sigma 98% 0.824
Frontiers in Neuroengineering www.frontiersin.org October 2011 | Volume 4 | Article 12 | 2

Daly et al. Local field potentials and spike timing
luer fittings. Prepared cartridges were then connected to the odordelivery system such that the cartridge was only 2 cm from thetip of the antenna. Under normal conditions, dried and charcoalfiltered air passed through the air supply tubing to the antennaat a velocity of 280 cm/s. This velocity was more than sufficientto minimize boundary layer effects around the antenna’s sensilla,yet well within the normal flight speed of this moth (Stevensonet al., 1995). To stimulate with odor, clean air was shunted fromthe normally open line, which blows constantly on the antenna,to a second line which contained the odor cartridge, via a three-way valve (The Lee Co., model LFAA1200118H). The clean air andodor lines then merged into a T. The third arm of the T connectedto the glass sleeve, in which the antennal flagellum had previouslybeen inserted. Thus, air from either the clean air line or the odorline was continuously flowing over the flagellum.
Nine monomolecular odors were presented separately in ran-dom order. Each odorant was presented in 20 consecutive 100 mspulses, each pulse spaced by 10 s. One hundred millisecond pulseswere used based on empirical evidence indicating that this is theapproximate mean exposure time for moths in the natural outdoorenvironment (Murlis and Jones, 1981) and a 10-s inter stimulusinterval is sufficient to eliminate any modulation of responses dueto repeated exposures in this model system (Daly et al., 2004b;Staudacher et al., 2009). This presentation scheme was repeatedprior to, during and following bath application of 200 μM bicu-culline methiodide (BMI) in physiological saline solution. Thisdose level has been shown to be effective in this (Waldrop et al.,1987; Christensen et al., 1998) and other insect species (Stopferet al., 1997; Hosler et al., 2000). Drug treatment was initiated10 min prior to the start of the second block of odor stimulations.
In a subset of two recordings, we also varied stimulus duration(50, 100, 500, and 1000 ms) to assess the effect of both briefer andmore prolonged stimulation on the patterns of oscillatory activity.In this case we presented a restricted number of odors and did notapply GABAA receptor antagonists. We again presented 20 repeatsof each stimulus/duration; each stimulus was again spaced by 10 s.
PHYSIOLOGICAL RECORDING AND SPIKE SORTINGData from the four tetrodes on the electrode array were recordedusing a 24 channel Neuralynx amplifier array and Cheetahdata acquisition and stimulus control software. Spike data wererecorded at 32 kHz using the tetrode sampling technique and localfield recordings were sampled at 10.7 kHz from one electrode ineach of the four tetrodes. Figure 1A highlights the approximatesize relationship of the AL with the microelectrode array andidentifies the relative position of the LFP recording sites on thearray. In this case, LFP recordings were made from the top andbottom-most electrode sites to provide the greatest vertical cov-erage (250 μm deep by 200 μm wide); note that this representsapproximately one-half the width of the AL. Spike channels wereamplified between 2000 and 10,000 times, whereas all LFP record-ings were amplified 2000 times. Hardware band pass filter settingswere 600–6000 Hz for spike data and 1–125 Hz for LFP data.
Spikes were sorted in Matlab using the BubbleClust toolboxsupplied by Neuralynx. This tool box implements a kth nearestneighbor algorithm in a 12 dimensional spike waveform fea-ture space. BubbleClust identified clusters of spikes that were
subsequently assessed and “cleaned” manually based on a numberof descriptive and parametric statistics used to assess the over-all quality and statistical separation of each cluster (see Daly et al.,2004b for complete description). Only those clusters that were sig-nificantly distinct from all other clusters and stable for the durationof the recording were considered for further analysis.
Local field potential recordings were re-filtered off-line via awindowed-sync FIR band pass filter provided by Neuralynx, usinga rectangular smoothing window and 800 taps. This filtering pro-cedure caused a linear phase lag that was then corrected to ensureaccurate alignment of the LFPs with the spike data. Results werecompared to several other filter implementations (including But-terworth and Chebyshev filters) to confirm that any oscillatoryactivity was not attributable to filtering artifacts, such as ringing.All implementations produced essentially identical results. Finally,for time frequency analysis (below) we also implemented a 60-Hz(±2 Hz, unless otherwise noted) windowed-sinc notch filter to theLFP data to remove line noise.
ANALYSISSeveral analytic techniques were used in order to quantify the rela-tionship between parallel recorded LFPOs and between LFPOs andunitary spiking. These methods include LFP–LFP and unit–LFPcross correlations, vector strength analysis, power spectral density(PSD), cross spectral density (CSD), and time frequency responsespectrograms (TFRs). In all cases a 1-ms binning window wasused unless otherwise noted and all calculations were performedin either MATLAB or Neuroexplorer. Statistical analyses of thedata generated from these methods were performed in MATLABand SAS.
First, in order to characterize the frequency content of odor-driven oscillations, TFR spectrograms were generated via the ShortTime Fourier Transform method. TFRs were calculated with the“tfrsp” function in the Time Frequency Toolbox for Matlab (freelyavailable from the Centre National de la Recherche Scientifiqueat http://tftb.non-gnu.org). This analysis was performed on indi-vidual responses to odor stimulation and the results averaged tohighlight consistent oscillations whilst averaging out inconsistentoscillatory activity. Because TFRs were calculated individually foreach response, then averaged across repeats, the approach abstractsfrom (and is hence tolerant of) variation in oscillatory phasebetween stimulus-aligned traces. This is important because aver-aging of raw oscillations from repeated trials for example couldpotentially cancel out oscillations that are not phase aligned acrosstrials. TFR results were z-score normalized to highlight possibledifferences in frequency content and relative amplitude across thefour LFPO recording sites (see Figure 1A). Normalization alsoallowed comparison of pre- versus post- GABAA receptor block-ade in order to highlight changes in frequency content for thesespecific comparisons.
To assess whether each odorant produced a unique frequencymodulating (FM) sweep pattern (i.e., differences in frequencyrange, onset/offset, and duration) we implemented a discriminantanalysis using a supervised classification approach. Specifically weused the support vector classifiers method (Boser et al., 1992; Galánet al., 2004; see also Methods in Appendix). Here the goal was todetermine if TFR’s generated from individual odor responses could
Frontiers in Neuroengineering www.frontiersin.org October 2011 | Volume 4 | Article 12 | 3

Daly et al. Local field potentials and spike timing
FIGURE 1 | Odor-driven oscillations are frequency modulating and
localized to a subset of recording sites (A). Schematic of the multichannelelectrode array configuration within the antennal lobe (AL; Cason stain).Neuronexus two-shank 2 × 2 tetrode silicon electrodes array, each shankcontaining eight electrodes, which are arrayed into two tetrodes (for tetrodesampling of spiking activity), are placed into the AL. One electrode from eachtetrode was used to record local field potentials (LFP; red circles). Thisprovided four parallel LFP recordings (inset) from across the AL. Note in theseexample traces, which have been band pass filtered to highlight 25–100 Hzthat there are several instances of spontaneously occurring “bouts” ofoscillatory activity (inset black arrows). (B) Rasterized peri-stimulus LFP tracesfrom 20 presentations of 9 different alcohols and ketones. Each trace hasbeen converted to a one dimensional color coded line to indicate whether thevoltage was high (reds) or low (blues; see above inset). All 180 responses arealigned by stimulus onset (stimulus duration indicated by vertical black lines)and stacked to create a single composite panel. Odors are separated by black
horizontal lines and identified (left of panel) by moiety (A = alcohol;K = ketone) and carbon chain length (5–10). Highlighted above are two distinctoscillatory response epochs; an early phase (e1), and a later phase (e2). (C)
Averaged time frequency response spectrogram showing consistentoscillatory power (normalized color scale) as a function of frequency (Y -axis)and peri-stimulus time (X -axis) for a single odor (1-pentanol). Displayed arethe averaged results of 20 independent TFR analyses for each of the 20presentations 1-pentanol. Inset white bar (bottom) indicates stimulusduration. Vertical white line indicates odor onset. Horizontal white line is an80-Hz frequency reference. Inset histogram (light blue) is the correspondingmean population spiking response to highlight the relationship between theonset and duration of the spiking response and the oscillations. (D).Comparison of the spectrogram results from the four parallel recording sitesin response to 2-octanone. Inset numbers correspond to electrode recordingsite shown in (A). Power is normalized to the same range to make panelsdirectly comparable. All panels are scaled and referenced as in (C).
be classified accurately into odor groups based on the multidimen-sional shape of the FM sweep. Briefly, we first implemented a datareduction step. This involved cropping the TFRs generated fromeach individual stimulus to a 12 to 124-Hz frequency range, and a−30 to 1000-ms time range and then defined a region of interest(ROI) within each TFR, consisting of all pixels that were abovethe 99th percentile of power density. Next we generated a filteringmask which represented all pixels from all odors that were abovethe 99th percentile and applied it to all TFRs. This data reduc-tion step effectively selects all significant frequency–time content
both within odor repeats and between different odorants andremoves all irrelevant data. We then implemented the supportvector classifiers using both a linear and third order polynomialkernel functions. This analysis was performed on two recordings.Finally, we calculated an experiment wide 95% confidence inter-val to identify classification performance as significantly abovechance.
In order to statistically quantify differences in odor-drivenspectral content prior to and during GABAA receptor blockade,PSD analysis was performed. For this analysis we calculated the
Frontiers in Neuroengineering www.frontiersin.org October 2011 | Volume 4 | Article 12 | 4
Daly et al. Local field potentials and spike timing
PSD for each odor-driven response in a 1000-ms window start-ing at stimulus onset. Note that in response to a 100-ms stimulus,TFR analysis indicated that most evidence of odor-driven oscil-latory activity terminated within ∼500 ms, thus all odor-drivenoscillatory activity should be encapsulated within this 1000 mswindow. Furthermore, TFR analysis indicated that odor-drivenresponses were typically no higher than 100 Hz, thus PSD analy-sis was performed on a 1 to 100-Hz frequency range, in 0.5 Hzsteps using Neuroexplorer. Resulting PSD data were then statis-tically analyzed using ANOVA in SAS to determine if spectralpower at each frequency step was affected by GABAA receptorblockade.
To quantify the precise relationship between LFPs recordedfrom different sites across the AL, we calculated all possible pairwise LFP–LFP cross correlations. For this analysis, a ±100-mssliding window was used and data was sampled from sponta-neous and odor-driven activity (−1000 to 0 and 0 to 1000 msrespectively; time relative to stimulus onset). This analysis was per-formed individually for each stimulus presentation, both beforeand during GABAA receptor blockade, for all recordings. The crosscorrelation not only indicates whether any two traces are corre-lated, but also highlights any temporal structure of that correlatedactivity. In order to extract and quantify the temporal structureembedded in the cross correlation, CSDs were calculated for eachindividually calculated cross correlation. CSDs specifically mea-sure the relative power of any periodic structure present in thecross correlation, hence the CSD quantifies oscillatory activity thatis distributed across the two recording sites used for a given crosscorrelation. Results of the CSD analysis were then statistically ana-lyzed using ANOVA in SAS to determine if distributed power ateach frequency step varied as a function of spontaneous versusodor-driven sampling time, and as a function of GABAA receptorblockade.
We used two related methods to quantify the phase relationshipbetween unitary spiking patterns and the LFPO, as both a func-tion of spontaneous and odor-driven responses, and as a functionof GABAA receptor disruption. First, the instantaneous phase ofthe LFP was calculated in MATLAB as the analytical phase of thesignal, i.e., as the instantaneous angle of the complex time seriesobtained from the Hilbert transform of the LFP. Results of thisanalysis provided a visual display, as a series of histograms for eachcell, highlighting the distribution of spikes relative to oscillatoryphase. Our second approach was to use vector strength analy-sis. Vector strength quantifies the degree to which unitary spikingactivity exhibits a tendency to occur at a particular phase of theLFPO by calculating the reciprocal of the circular variance of thedistribution of phases of sampled spikes to the LFP; this was alsoperformed in MATLAB. For this analysis data was sampled fromthree peri-stimulus epochs; spontaneous activity prior to stimu-lation (−300 to 0 ms), an early response epoch (50–350 ms), anda late response epoch (350–650 ms). Note that 0–50 ms was notconsidered in this analysis to account for the time lag betweenwhen the odor valve opened and the earliest physiological evi-dence of AL responses. Furthermore, because preliminary resultsindicated that odor-driven oscillatory activity was relatively broadband and in a different frequency range than what was observedduring spontaneous activity, we performed the vector strength
analysis on LFP data that was band pass filtered to highlight twofrequency domains; low (25–55 Hz) and high (55–85 Hz). FilteringLFP oscillations into narrower pass bands results in a less complexwave and hence allows more accurate calculation of spike phase.Filtering also allows segregation and characterization of phaselocking in the separate frequency domains. Subsequently, ANOVAwas used to determine whether vector strength was dependenton: peri-stimulus time (i.e., pre, early, and late response epochs),the odorant used, and, GABAA receptor blockade. Analysis wasperformed after accounting for random effects such as individ-ual recording (moth) and individual differences between spikingunits. Finally, the filter implementation (low versus high frequencypass band) was also included in the statistical model to estab-lish whether the different pass bands produced statistically similarresults.
Finally, to establish whether vector strength values were abovewhat might be expected by chance, these values were recalculatedfor one of the recordings using a bootstrapping method, wherebyspike times were first jittered randomly within a series of timeranges from ±1 to ±10 ms in 1 ms steps (spikes were re-jittered30 times for each step in the jitter width). Results were statisticallyanalyzed using ANOVA in SAS to determine if vector strength wasdependent on the amount of jittering for the three peri-stimulusepochs.
RESULTSODOR-DRIVEN OSCILLATIONS ARE FREQUENCY MODULATING ANDTYPICALLY LOCALIZED TO A SUBSET OF RECORDING SITESThe transient oscillatory model of odor identity encoding positsthat odor stimulation should produce a reasonably narrow (hencestable) frequency band of oscillatory activity, which is distributedacross much if not all of the AL. This prediction is based on themorphological characteristics of LNs, which arborize broadly andmediate oscillatory activity. The model furthermore predicts thatthe elicited frequency should be independent of the odorant pre-sented (Laurent and Davidowitz, 1994; Laurent et al., 1996a). Astable response frequency that is independent of varying stim-uli is an important aspect of this model because the second-orderolfactory center, the MB, are proposed to integrate inputs from theAL across a limited time window defined by delayed feed-forwardinhibition from the lateral horn (Laurent, 2002; Perez-Orive et al.,2002). Therefore, we detailed the precise nature of the oscillatoryactivity in the AL of Manduca to determine if these criteria couldbe met.
Figure 1A is a schematic depicting the approximate position-ing and size of the electrode array in the AL. This figure alsohighlights which electrodes from the 16 channel array were usedfor LFP recordings. In this case, we made parallel LFP recordingsfrom the highest two and lowest two recording sites (shown inred), during periods of spontaneous activity and in response toodor stimulation. Superimposed on Figure 1A are peri-stimulusLFP traces representing a range of typical 25–100 Hz oscillations.These oscillations occur both spontaneously (black arrows) andin response to a 100-ms odor presentation (stimulus highlightedby red rectangles). Note that oscillations can be clearly observedduring spontaneous activity on three of the four traces, albeitat a lesser amplitude than those observed during an odor-driven
Frontiers in Neuroengineering www.frontiersin.org October 2011 | Volume 4 | Article 12 | 5

Daly et al. Local field potentials and spike timing
response. This suggests that oscillations are an ongoing product ofa spontaneously active system.
Figure 1B displays rasterized peri-stimulus LFP traces froma single LFP electrode in response to the 20 repeats of each ofthe nine odors used, thus comprising a total of 180 rows of LFPdata. First, in the 200-ms prior to odor stimulation, there is againevidence of spontaneous oscillations as indicated by the random“peppering” of interleaved red and blue “blips” in the horizon-tal (i.e., time) axis. The presence of spontaneous oscillatory fieldactivity should not be particularly surprising given the sponta-neously active nature of the insect AL (Perez-Orive et al., 2002;Stopfer et al., 2003; Daly et al., 2004b).
However, in the presence of odor, LFPOs become both larger inamplitude and in some cases coherent across repeats when alignedby the onset of odor stimulation. For example, inter-trial coher-ence can be seen in Figure 1B by the prominent vertical stripingof blue and red across the 20 repeats of each odor as well as acrossodors in some instances. This indicates that consecutive oscillationpeaks (red) and valleys (blue) were phase aligned from responseto response. This “inter-trial coherence” across stimulus repeats ismost prominent for 1-pentanol (A5) between 150 and 300 ms poststimulus onset. Figure 1B also suggests that odor-driven oscilla-tions have two distinct epochs; these epochs are highlighted byinset brackets labeled e1 and e2. Early phase high frequency oscil-lations (e1) emerge reasonably consistently (∼60 ms post stimulusonset) and last for ∼50 ms. Early phase LFPO’s appear to somedegree for most odors. This early phase oscillation precedes onsetof the odor-driven I1, a bicuculline sensitive, fast inward Cl−conductance observed in Manduca PNs (Waldrop et al., 1987;Christensen et al., 1998). The I1 phase occurs prior to spikingresponses of PNs. Thus, based on the timing of early phase oscil-lations, they likely relate to sensory cell input and early synapticprocessing that occurs prior to the onset of PN spiking responses.
Starting no earlier than ∼120 ms is a second bout of highfrequency LFPOs (e2), which appear less coherent in responsetime, though exceptions exist (again see responses to 1-pentanol).These later phase oscillations tend to be odor dependent.However, it is not always apparent, using this visualizationmethod, whether odor-driven e2 oscillatory activity is consis-tent from trial to trial in terms of onset, frequency, and/orphase.
To establish whether odor-driven oscillations are consistent inresponse time and produce a reasonably stable frequency, therebyproviding a faithful temporal encoding mechanism that is inde-pendent of odor identity (Laurent and Davidowitz, 1994; Laurentand Naraghi, 1994), we calculated TFRs. Figure 1C displays theaveraged results of 20 separate TFR analyses performed on eachof the 20 presentations of 1-pentanol; results are based on a singlerecording site. Power was normalized to a probability distribu-tion and color coded. The first and most striking observationis that odor stimulation drives an oscillatory response that isFM. In response to all 9 odors for all 10 moths in the study(1,800 total odor presentations) we observed that odor-drivenoscillatory responses produced a high-to-low frequency sweepthat typically ranged from 80 to 100 Hz peak frequency down to20–40 Hz. Superimposed on this TFR is the corresponding peri-stimulus histogram, highlighting the summed spiking response
for all units in the corresponding population. Results were thenaveraged across the 20 stimulus repeats. Consistent with the aboveobservation that oscillatory activity precedes spiking activity inAL neurons, Figure 1C shows that high frequency oscillatoryactivity precedes the population spiking response by ∼60 ms inthis case.
Across the 10 moths used for this analysis, odor-driven FMoscillatory responses were also spatially localized. Figure 1D dis-plays typical TFRs generated from the four parallel LFP recordingsites from a single animal in response to 20 presentations of 2-octanone. In Figure 1D, the upper left electrode (1) recordedan FM sweep starting at ∼60 ms post stimulus onset and a peakfrequency of 100 Hz. The frequency of this oscillation then mod-ulated down to 35 Hz by 400 ms post stimulus onset. This patternis evident in the upper right electrode (2) as well, although therelative power was lower. In the lower two electrodes (3 and 4)however, almost no evidence of this FM oscillation was present.As highlighted in Figure 1D electrode 3, there were also con-sistent spontaneous 20–50 Hz oscillations that were interruptedupon odor stimulation; this form of spontaneous oscillatory activ-ity was observed in at least one of the LFP recording sites for6 of the 10 moths that we analyzed using the TRF method (seeFigure A1 in Appendix for examples from all six recordings). Assuggested by the raw traces in Figure 1A, these ongoing oscilla-tions tended to be spontaneous but intermittent; this accountsfor the patchy power structure observed in Figure 1D. Thus,while 2.7 ± 1.15 (mean ± SD) recording sites exhibiting oscilla-tory activity of some sort, only 1.8 ± 1.2 (mean ± SD) recordingsites actually displayed the same odor-driven FM response patternsas seen in electrodes 1 and 2. Contrary to the predictions madeof the transient oscillatory model, this suggests that odor-evokedoscillations that were FM and typically constrained to a sub regionof the AL.
ODOR-DRIVEN OSCILLATIONS MODULATE IN A STIMULUS SPECIFICMANNERAs mentioned above, the transient oscillatory model posits that theoscillations should be frequency invariant across different odors(Laurent and Davidowitz, 1994; Laurent et al., 1996a). TFR results,however, suggest that odor-driven FM LFPOs were dependent onboth the physical features of the odorant molecules used as well asthe duration that a test odorant was presented. Figure 2A displaysTFRs from a single recording electrode in response to each of thenine odors used (see also Figure A2A in Appendix). Responsesdriven by both the short chain alcohols and ketones exhibited amaximum frequency of approximately 100–105 Hz. As the carbonchain length of the stimulus was increased the peak frequency atresponse onset appeared to drop. For example, Figure 2 shows amaximum frequency of approximately 85–95 Hz when the mothwas stimulated with 1-decanol and 2-decanone respectively. Theduration of the oscillatory response also increased with carbonchain length. Note for example, the longer chain odors modu-late more slowly, in the case of K10 the response persists acrossthe time window whereas the shorter chain odors do not. Finally,this implies that the rate of the FM sweep (that is, how long ittook to modulate from high-to-low frequency), is slower with the
Frontiers in Neuroengineering www.frontiersin.org October 2011 | Volume 4 | Article 12 | 6

Daly et al. Local field potentials and spike timing
FIGURE 2 | Odor-driven oscillations modulate in an odor-specific manner.
(A) Time frequency response spectrograms calculated as a function ofchanging molecular features of the stimulus. All panels are the result of TFRanalyses that were calculated, normalized, and presented as described inFigure 1. Each panel represents the averaged TFR result for a single odorant(inset and identified as described in Figure 1). Note that alcohols and ketonesof common length are aligned into columns. Note that with the longer carbonside chains, the initial peak frequency is decreased by ∼15–20 Hz and the FMsweep appears both slower and longer in duration (see also Figure A2 in
Appendix). (B) Results of the discriminant analysis, showing classificationperformance for each odorant as a function of both the linear (blue bars) andpolynomial discriminant functions (green bars). Red line highlights the 95%confidence limit and hence identifies those odorants for which the linear andthird order polynomial kernel functions were able to accurately classifysignificantly better than chance. Note that while the linear kernel in this casewas not able to classify A10 significantly better than chance, the polynomialkernel could discriminate all odors with 100% accuracy (see also Figure A2 inAppendix).
longer carbon chain odors. This resulted in a shallower and moreprolonged downward sweep.
To assess the odor dependency of FM responses we per-formed a discriminant analysis using support vector classifiersand implementing both a linear and polynomial discriminant (orkernel) function on a subset of two recordings. The results ofthis analysis for the dataset shown in Figure 2A are displayed inFigure 2B (for the second example see Figure A2 in Appendix).The linear discriminant function (blue bars) was able to accu-rately discriminate all odors significantly above chance (red lineindicates 95% confidence level) for all but a single odor (A10),whereas the polynomial function (green bars) effectively classifiedwith 100 percent accuracy for all odors. This indicates that eachodorant produced a unique frequency response “signature.” Thisodor dependency can be interpreted as either volatility-dependentor carbon chain length-dependent. In either case, these resultsindicate that the qualitative nature of the oscillation is clearlystimulus-dependent.
In two moths we also varied stimulus duration for a subset ofodors. Figure 3 displays TFRs results from an individual recordingsite where the odor 2-hexanone was presented 20 times for eachof four different stimulus durations, ranging from 50 to 1000 ms.Note that there is a stimulus duration dependent elongation of the
FM sweep; this was observed in both moths where duration wasmanipulated. Thus again, in contrast to theoretical expectations,the frequency content, and rate of modulation are clearly affectedby the odorant used as well as the duration of the stimulus.
CORRELATED FIELD ACTIVITY IS STATE DEPENDENT AND ONLYWEAKLY PERIODICThe observation that odor-driven FM oscillations are localized to asubset of recording sites does not necessarily imply the absence ofmore subtle distributed oscillatory activity that the TFR methodwas unable to quantify. Another method for identifying distrib-uted activity across the four LFP recording sites was to directlycompare pairs of sites using cross correlation analysis. Results ofthis analysis revealed that while different recording sites are in factmoderately to highly correlated, this correlation decays rapidly intime, producing very little evidence of periodic structure.
For example Figure 4A displays the cross correlation betweenLFP recording site 1 with all other LFP recording sites for a singleanimal. This analysis was based on one 40 min recording segmentcontaining both spontaneous and odor-driven activity and servesto highlight that recording sites are clearly correlated at 0 s. Indeed,inspection of these cross correlations reveals that the peak corre-lations are centered on 0 s. and range from r = 0.33 (sites 1 and
Frontiers in Neuroengineering www.frontiersin.org October 2011 | Volume 4 | Article 12 | 7

Daly et al. Local field potentials and spike timing
FIGURE 3 | Frequency modulation is dependent on stimulus duration.
Stimulus averagedTFR spectrograms for a single odor (2-hexanone) presentedfor durations ranging from 50 to 1000 ms (20 presentations/duration). White
bars at the bottom of each panel indicate stimulus duration. Vertical andhorizontal white lines reference stimulus onset and 80 Hz respectively. Notethat with increased stimulus duration there are more prolonged FM sweeps.
FIGURE 4 | Oscillatory local field activity is weakly distributed
and contains state dependent frequency content. (A) The crosscorrelation between LFPs recorded from site 1 (tetrode 1) and the threeother LFP recording sites in the tetrode array (see Figure 1A). Insetschematic of the 2 × 2 tetrode array shows the respective LFP recording sitepositions. For purposes of simplification, only the site on each tetrode thatwas used for LFP recordings is shown. Sites are color coded to identify whichcross correlation trace is associated with which recording electrode. Thus forexample, the red trace is the cross correlation between site 1 (white) and site2 (red). Results based on a total of ∼20 min of continuous recording timefrom a single moth and contain both spontaneous and odor-driven data. Insetarrows identify the periodic structure observed in the cross correlationbetween electrodes 1 and 2. Note that these small “off center” peaks in thecross correlations occur in a periodic manner suggesting the presence of aweak but distributed oscillation. (B) The corresponding cross spectraldensities for the data shown in (A). These CSDs indicate that the cross
correlation between electrodes 1 and 2 contained higher frequency contentthan 1 and 3 and 1 and 4 respectively. (C) Mean cross correlations forspontaneous versus odor-driven periods. Results based on all possible pairwise comparisons between the four LFP recording sites across seven moths.Odor-driven cross-correlation based on 1 s samples, starting at odor onset, foreach of 180 odor stimuli per moth. Spontaneous cross correlation based on180 1 s samples taken immediately prior to odor onset for each odor stimulus,per moth. Note that cross correlations were calculated for each stimulus andresults were averaged. Shaded regions around the mean represent ±1 SD.Inset color coded broken lines above the X -axis indicate periods where asignificant difference in the cross correlation value from 0 was observed.Significance threshold for these tests was set to 2.3 × 10⁻⁶ to maintain anoverall alpha of 0.01 (see Figure A3 in Appendix for an expanded view). (D)
Mean cross spectral densities as a function of spontaneous and odor-drivenactivity. Results based on all responses from the same seven moths shown in(C). Shaded area represents SE.
Frontiers in Neuroengineering www.frontiersin.org October 2011 | Volume 4 | Article 12 | 8

Daly et al. Local field potentials and spike timing
3), to r = 0.68 (sites 1 and 2). This high degree of correlationoccurs between sites which are as much as 250 μm apart. As high-lighted in Figure 4A, the magnitude of these correlations does notappear to be dependent on the distance between recording sites.For example, the cross correlation between sites 1 and 4 in thisexperiment (250 μm) was considerably higher than between sites1 and 3 (200 μm).
Note too that there are some small but regular “ripples” inthe individual cross correlations (highlighted by inset arrows inFigure 4A). These small and roughly evenly spaced (in time)peaks and valleys, indicate that there is indeed some periodic tem-poral structure in the cross correlation. However, the peaks ofthese correlations are quite small (ca. r < 0.10). Nevertheless, bycalculating the CSD of each individual cross correlation, any peri-odic temporal structure in the cross correlation can be quantified;the corresponding CSDs for the cross correlations displayed inFigure 4A are shown in Figure 4B. Figure 4B plots the amountof distributed oscillatory power by frequency and indicates thatthere was correlated periodic activity between sites 1 and 2 (redtrace) centered around ∼60 Hz but spanning broadly from ∼40to 85 Hz. By contrast, distributed oscillatory power present in thecross correlations between sites 1 and 3, and sites 1 and 4 containedfrequency content in a lower frequency range indicating that thecorrelated oscillatory activity between sites 1 and 2 is not the sameas that found between sites 1 and 3 or 1 and 4.
Figure 4C summarizes the mean of all possible unique pairwise cross correlations for all recordings used in this analysis (sixpossible unique pair wise comparisons per moth and seven mothsused for this analysis). Results are based on a total of 360 1000 mssamples and are broken down as a function of spontaneous versusodor-driven activity. Mean cross correlations have been plottedwith ±1 SD shading to provide a sense of variability in the crosscorrelations; this indicates that the greatest variability occurs in a±50-ms window centered around 0 ms.
The mean peak cross correlation was 0.38 (SD = ± 0.18) forspontaneous activity and 0.43 (SD = ± 0.19) for odor-drivenactivity. A one-tailed paired t -test comparing the peak cross cor-relation revealed that odor produces a significant increase inthis measure across the recording sites (p < 0.001). However,because these cross correlations are presented as means of mul-tiple analyses, all but the most consistent and robust temporaldetails tend to be averaged out. To determine whether the sec-ondary peaks (and valleys) that flank the central peak at 0 ms weresignificantly different from r = 0.0, a two tailed, t -test was calcu-lated, for each frequency step; this was performed for both thespontaneous and odor-driven cross correlations. Inset along theX -axis in Figure 4C are the results of this test. In this case breaksin the colored lines indicate moments where the spontaneous orodor-driven cross correlations were not statistically different from0. Conversely, the presence of colored lines highlights where therewere significant deviations from 0. Thus, in spite of the fact thatthe flanking peaks and valleys were quite small, there were periodswhere the correlations were significantly different from 0, suggest-ing that there is indeed some correlated temporal structure that isdistributed across pairs of recording sites.
Therefore, in order to quantify this distributed temporal struc-ture, CSD’s were calculated for each individual cross correlation.
Results of these CSD analyses were then averaged as a functionof spontaneous versus odor-driven epochs and are displayed inFigure 4D. As shown in Figure 4D, the most striking differencebetween spontaneous and odor-driven CSDs is that they producedistributed temporal structure in nearly dichotomous frequencyranges. That is, during spontaneous epochs of time, the bulk ofdistributed periodic activity was in the range of ∼25–55 Hz. Inthe presence of odor however, there was relatively more distrib-uted power in the range of ∼55–85 Hz. After accounting for allstatistical main effects, ANOVA revealed distributed oscillatorypower was significantly dependent on the interaction between thepresence or absence of odor and frequency (p < 0.0001). Collec-tively then, this pattern of results indicate that both spontaneousand odor-driven activity produce weak but detectable distributedoscillatory activity in different frequency ranges. Our expectationwas that the relationship between oscillations across recordingsites would be far greater than actually observed; nevertheless thepresence of distributed oscillations is consistent with the transientoscillatory model. The next question is whether these weak butdistributed oscillations affect spike timing in a pattern consistentwith the model.
UNITARY SPIKING PHASE LOCKS TO LFPOS AS AN ONGOING, NOTODOR-DRIVEN PROCESSThe odor-driven increase in the amplitude and frequency ofweakly but distributed oscillatory activity across the AL couldprovide enhanced synchrony of distributed spiking behavior frompopulations of AL neurons as predicted by the transient oscillatorymodel (Laurent and Davidowitz, 1994; Laurent et al., 1996a,b).This would require that phase locking of spikes to the oscillationsoccurs during odor-driven responses and this phase locking wouldpresumably be stronger than what is observed during sponta-neous activity. To test this hypothesis, we calculated unitary vectorstrength for the three peri-stimulus time epochs. These calcula-tions were made for each unit across all stimulations of all odors.Thus for each moth, individual unitary vector strength calcula-tions were based on 180 ms × 300 ms (or 54 s) samples for eachof the three peri-stimulus time epochs. Furthermore, given thattwo relatively distinct frequency domains were observed for dis-tributed oscillatory activity during spontaneous and odor-drivenepochs (see Figure 4D), vector strength calculations were madebased on both the low (25–55 Hz) and high (55–85 Hz) LFP bandpass filter implementations. Finally, only vector strength valuesthat were calculated based on 60 or more spikes were included inthe analysis (376,518 spikes, or 87% of the 433,667 spikes sam-pled). This criterion was used because vector strength describesthe variation in a distribution of spikes relative to the phase ofa 360˚ oscillation cycle. Hence, with low spike counts, the vectorstrength measure is less reliable, particularly in cases where thereare spikes that are outliers. To analyze variation in vector strength,we implemented a mixed General Linear Model in SAS using theGLM procedure to model data from five moths (90 neurons) forwhich we had comprehensive datasets (including both before andduring GABAA receptor blockade via BMI application; BMI resultsdescribed below).
The overall model was significant, explaining 49% of the vari-ance in unitary vector strength scores (p < 0.0001). This analysis
Frontiers in Neuroengineering www.frontiersin.org October 2011 | Volume 4 | Article 12 | 9

Daly et al. Local field potentials and spike timing
found that the main effects of odor identity (of the nine odorsused), the peri-stimulus time epoch (−300 to 0; 50–350; and 350–650 ms, relative to onset of odor stimulation), and drug treatment(before versus during BMI application) all significantly influencedvector strength values (p < 0.0001). However, the LFP frequencyrange used to calculate the vector strength values (25–55 or 55–85 Hz) was not significant (p = 0.7274) indicating that vectorstrength values were approximately the same for both frequencydomains.
Of particular importance is the significant main effect of peri-stimulus epoch, which compared vector strength as a function ofthe three different epochs of peri-stimulus time. Post hoc analy-sis of this effect (Figure 5A) indicates that, independent of theband pass filter implementation, spontaneous activity prior toodor stimulation (−300 to 0 ms relative to odor onset) pro-duced the greatest overall vector strength values. Interestingly,
from 50 to 350 ms, the peri-stimulus epoch typically associatedwith odor dependent spiking patterns (Stopfer et al., 2003; Dalyet al., 2004b; Staudacher et al., 2009), produced about half thevector strength, indicating relatively weak phase locking duringodor-driven responses. Even during the late response epoch (350–650 ms), while there was a significant increase in vector strengthrelative to the early response epoch (p < 0.01), it was still sig-nificantly lower than vector strength during spontaneous activity(p < 0.01). In order to better understand this “response epoch”effect at the single unit level, phase lag histograms are displayedfor all 26 units from a single recording and in response to 20 pre-sentations of 1-decanol, (Figure 5B). Results are displayed for thesame three peri-stimulus epochs. Here we show that ongoing (i.e.,spontaneous) spiking tends to occur, in this recording,on the risingphase of the oscillation cycle. In this exemplar case, all units showa decrease in their phase relationship to the oscillation during the
FIGURE 5 | Unitary spiking phase locks to LFPOs as an ongoing
not odor-driven process (A). Mean unitary vector strength as afunction of the three stimulus epochs for the five moths used in thisanalysis. Results are broken down by LFP band pass filter range.However, note that there are no significant differences within anyperi-stimulus response epoch between the 25–55 Hz (light gray) and55–85 Hz (dark gray) band pass filter implementations. Inset are the results ofstatistical post hoc comparison mean vector strength values (averaged acrossfilter implementation) across the different peri-stimulus time epochs; meanswith significant differences are indicated with an asterisk. Errors barsrepresent SE. (B) Phase lag histograms for all 26 recorded units from a singlerecording. Results based on one of the four LFPs recording sites, and in
response to the 20 presentations of 1-decanol. Results are broken down byspontaneous (300 ms just prior to odor onset), early response (50–350 ms),and late response (350–650 ms). Note that several units (but not all, forexample see the light green histogram) show a tendency to spike on therising phase of the oscillation cycle (between 0 and 1.57 radians; see alsoinset red wave) during spontaneous activity. During odor-driven responsesonly one unit retains a strong (increased) phase relationship to the oscillationwhile the bulk of the units lose their phase relationships. (C) Population-levelvector strength as a function of the three stimulus epochs. Results are for the25 to 55-Hz band pass filter implementation and each panel represents adifferent animal. (D) The same as (C) except using LFP data that was55–85 Hz band pass filtered.
Frontiers in Neuroengineering www.frontiersin.org October 2011 | Volume 4 | Article 12 | 10

Daly et al. Local field potentials and spike timing
early phase of the odor-driven response except one (Figure 5B, 50–350 ms; unit 7, light blue histogram), which increased and shiftedphase essentially to the peak of the oscillation cycle. Finally, dur-ing the late phase of the response, units appear to come back intoa similar phase alignment as was observed during spontaneousactivity.
In summary, of those units meeting the 60 spike minimumcriterion for both spontaneous and early response epoch (N = 65units), odor stimulation resulted in 68% of those units producinga 0.09 ± 0.08 (mean ± SD) reduction in vector strength relativeto spontaneous activity, while only 32% produced a 0.03 ± 0.04(mean ± SD) increase. Furthermore, consistent with the findingthat vector strength recovers during the late response epoch, wefound that 71% of units produced a 0.07 ± 0.05 (mean ± SD;N = 68 units) increase in vector strength scores from the early tolate response epoch, while only 29% of cells produced a 0.06 ± 0.08(mean ± SD; N = 68 units) decrease. Thus, more than two-thirdsof units show a relative decrease in vector strength during the earlyresponse epoch and recover during the late response epoch.
Unitary vector strength measures represent the best possiblescenario for highlighting the relationship between LFPO’s andspike timing of individual units because it is tolerant of dif-ferences in preferred phase angles between units. However, thetransient oscillatory model predicts that not only do spikes phaselock to oscillations during an odor-driven response, but that phaselocking of the responding assembly of output cells results in anincrease of synchronized spiking of the population on an oscil-latory timescale. In order to understand how oscillations mightsynchronize a population of parallel recorded neural units, thesame vector strength analysis can be applied to a populationvector, which is the summed spiking behavior of the recordedpopulation. This population vector strength approach is sensitiveto differences in preferred phase angles between units. Thus, asthe variation in preferred phase angle among individual neuronsin the population increases, the population-level measure of vectorstrength (and hence synchrony among individuals) will decrease.Figures 5C,D display population-level vector strength and pre-ferred phase angle across all recorded units for the five recordingsused in the statistical analysis. We again used the same 60 spikeminimum for inclusion into the population vector. Each panel inFigures 5C,D displays the vector strength for the same three peri-stimulus response epochs for a single moth; results are collapsedacross all presentations of all odors. Figure 5C displays resultsbased on the 25–55 Hz band pass filter implementation, whereasFigure 5D is based on the 55–85 Hz filter. As statistically veri-fied in Figure 4A and visualized in Figure 5B, the most strikingresult observed in Figure 5C is that, on average, vector strength isconsistently greatest during spontaneous activity and consistentlyweakest during odor-driven responses; this pattern of results isconsistent across all recordings and across both filtering ranges,with only one exception; in this case, vector strength values wereroughly equal (see Figure 5D5). Also consistent with Figures 5A,B,vector strength values during the late response epoch were,on aver-age, lower than the spontaneous epoch but greater than the earlyresponse epoch.
Given that CSD analysis indicated that distributed oscillatoryactivity was in a higher frequency range during odor responses
(Figure 5D), we might have expected to observe greater vectorstrength values during odor-driven responses in the higher fre-quency domain. However, as shown in Figures 5A,D, the relativedisparity between spontaneous and odor-driven phase locking wasnot statistically different as a function of the filter implementa-tion and we found no examples where odor-driven phase lockingwas, on average, stronger than spontaneous phase locking. Thus,whether considering phase locking at the unitary or population-level, or at low versus high frequency ranges, the results shownhere are in contrast to what the transient oscillatory model pre-dicts; namely that phase locking should be (relatively speaking) anodor-driven phenomenon.
Finally, comparison of mean unitary vector strength values(Figure 5A) with mean population-level vector strength values(Figures 5C,D) provides an indicator of how well synchronizedthe population is on an oscillatory time scale. Specifically the meanunitary vector strength should be generally higher than those cal-culated based on a population vector simply because variabilityin preferred phase angle is ignored when averaging unitary vectorstrength. Recall that vector strength is defined as the reciprocalof the circular variance of the distribution of phases of sampledspikes to the LFP; the preferred phase angle is simply the meanof a given distribution of spikes. Thus as the variability in spikephases increases, vector strength decreases. Given a set of individ-ual units with different preferred phase angles, when treated as apopulation, those different preferred phase angles (i.e., differentmeans) will add variance to the population-level distribution ofspike phases, resulting in lower population-level vector strength.The ratio of the mean population vector strength to mean unitaryvector strength indicates the relative ability of all of the neuronsto spike in the same phase (sic. synchronously). Based on the 25to 55-Hz LFPs, the population: unit vector strength ratio of thethree response epochs was 0.63, 0.33, 0.48 for spontaneous, early,and late response epochs respectively. These results indicate thatthe preferred phase angles during spontaneous activity are moreconsistent (i.e., producing more synchronous spiking) than theresponse epochs within this LFP frequency range. For the 55 to85-Hz LFPs, the ratios were 0.40, 0.61, and 0.61 for spontaneous,early, and late response epochs respectively suggesting that unitswere relatively less phase aligned spontaneously in this frequencyrange. This pattern of results suggests that synchronous spikingfrom the population is more likely in the higher frequency range.In all cases, however, there is variation in individual units’preferredphase relationships to the oscillations, which results in lower net-work synchronization. Furthermore, even within the higher LFPOfrequency domain, vector strength values during the odor-drivenresponse are still quite small.
THE PHASE RELATIONSHIP BETWEEN SPIKING AND OSCILLATIONS ISSMALL BUT SIGNIFICANTRelative to vector strength values commonly described in vari-ous regions of the vertebrates brain such as the auditory system(e.g., Goldberg and Brown, 1969; Moushegian et al., 1975; Kadnerand Berrebi, 2008), the average vector strength values observedin the present study as well as those from other insect studies(Ito et al., 2009) are relatively small. However, we can determinewhether these values are above what is expected by chance, by
Frontiers in Neuroengineering www.frontiersin.org October 2011 | Volume 4 | Article 12 | 11

Daly et al. Local field potentials and spike timing
randomly jittering the spike timing within a restricted time rangeand recalculating vector strength. If the phase relation betweenspikes and the LFP are above what is expected by chance, then ran-domly jittering spike times will negatively impact vector strengthvalues while maintaining much of the internal statistics of thedataset. First, to visualize this point, we randomly jittered all ofthe spikes from an individual spike train from a single record-ing (N = 44,758 across a 166-min recording session) by 0, ±3,or ±6 ms and cross correlated the spike train to one of the cor-responding LFP recording sites (Figure 6A). Data includes bothspontaneous and odor-driven activity. Note that in contrast tothe cross correlations between LFPs (see Figure 4), this unit–LFPcross correlation shows clear temporal structure. Furthermore,random jittering of spikes by ±3 ms reduced and by ±6 ms elim-inated this cross correlation. Next, using a bootstrapping methodwhere spike trains were randomly re-jittered and vector strength
FIGURE 6 |The phase relationship between spiking and oscillations is
significant. (A) The cross-correlation of a single unit to a parallel recordedLFPO normally (in red), after spikes were randomly jittered by a width of±3ms (blue) and after spikes were jittered by a width of ±6 ms (black). (B)
Vector strength for the three epochs and their recalculation after jittering.Jittering width started at ±1 ms and was increased in 1 ms steps. Insetasterisks indicate significant differences in vector strength to neighboringjittering ranges (one-way paired t -tests; p < 0.01). Note that the resultingstrength of the unit–LFP relationship is clearly dependent by the degree ofjittering indicating that these correlations, though small, are dependent onprecise spike timing with respect to the periodic nature of the local field.
recalculated, vector strength decay can be quantified as a functionof the time range of the random jittering. In this case we used allunits from a single recording and only spikes occurring within ourthree 300 ms peri-stimulus epochs (N = 19 units, 10,762 spikes).The initial data were re-jittered 30 times for each jitter width andvector strength was recalculated. Results of this analysis were thenstatistically analyzed using one-tailed paired t -tests. Figure 6Bplots the mean vector strength by jitter width for each of the threeperi-stimulus epochs and clearly indicate that the distributions ofspikes tend to occur at a particular phase of the oscillation cycle.One-way t -test comparison of mean vector strength (significantresults inset as asterisks) indicates a significant drop in strength asa function of increasing the jitter width by as little as ±1 ms up tothe point at which the vector strength values approach 0 (±5 ms;p < 0.001; Figure 6B); this was true independent of the stimulusepoch used in the analysis. These results establish that while phaselocking is weak relative to other sensory systems, it is neverthelessgreater than what is expected based on chance.
BICUCULLINE SIGNIFICANTLY REDUCES ODOR-DRIVEN FMOSCILLATORY RESPONSES AND DECREASES THE LATENCY OF SPIKINGRESPONSESPrevious intracellular investigations on the effects of GABAA
receptor blockade establish that BMI injection into Manduca ALsspecifically and reversibly blocks a GABAA-dependent inward Cl−conductance in PNs (Christensen et al., 1998). This conductancenormally results in a brief IPSP (44 ± 31 ms; Staudacher et al.,2009) and suppression of spontaneous PN spiking followed by arelatively prolonged supra-threshold EPSP, upon which an exci-tatory burst of spikes is superimposed. Thus, we first sought toestablish if an additional function of GABAA receptors in the ALis to mediate the network’s ability to maintain distributed oscilla-tory activity across the AL using the same methods as above. Thisanalysis was performed using a within-animal design so that theresults could be directly compared with those obtained prior toGABAA receptor disruption.
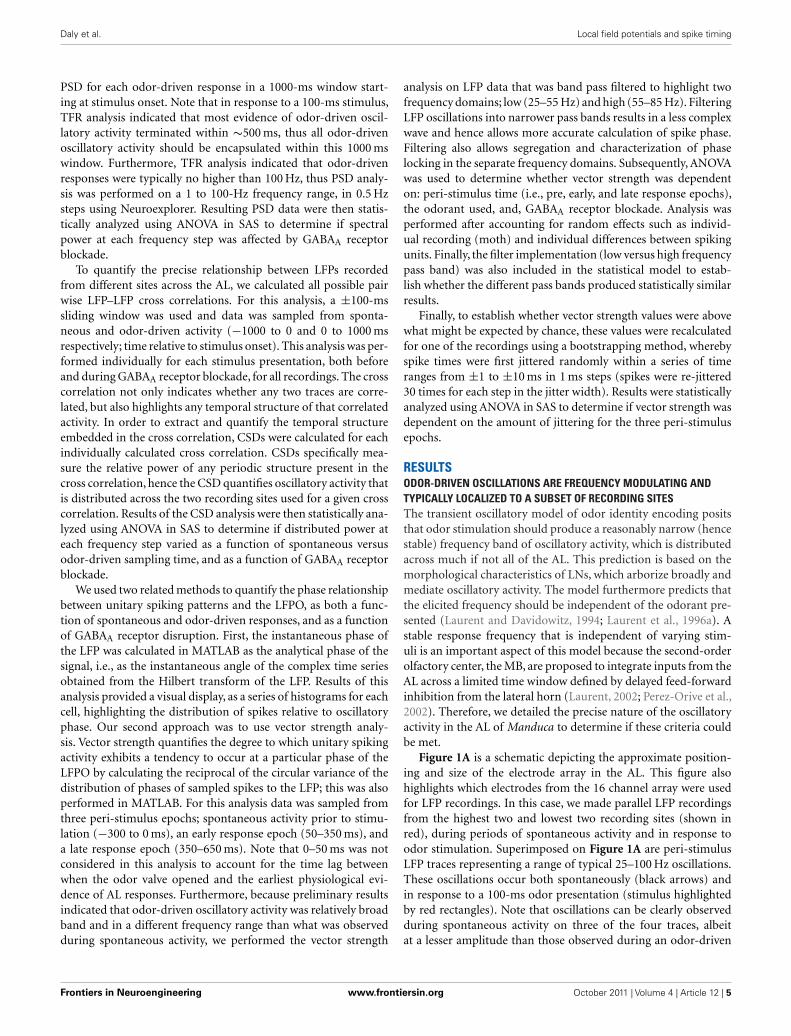
First, application of BMI disrupted and in many cases com-pletely eliminated the odor-driven FM LFPOs. Figure 7A presentsfour typical TFRs from four different moths before and duringBMI application. In all four cases, application of BMI causeda qualitative decrease in oscillatory power relative to pre-BMImeasures. This decrease ranged from near complete (Figure 7Apanels 1 and 2) to partial (panels 3 and 4). Note too that inFigure 7A2i the spontaneous 20–50 Hz activity, which terminateswith odor stimulation, was also greatly reduced as compared toFigure 7A2ii. This suggests that both ongoing and odor-drivenoscillations were decreased. In order to statistically verify the lossof the FM responses, we modeled z-score normalized oscilla-tory power as a function of the main effects of individual dif-ferences between moths, the recording site the frequency stepand the pharmacological treatment and their interactions usingANOVA. Results were based on five recordings for which we hadcomprehensive datasets for both pre and during BMI treatment.Results of the ANOVA indicate a significant drop in power from0.32 ± 0.98 to −0.37 ± 0.81 (mean ± SD) as a result of BMI appli-cation (p < 0.001). Importantly the interaction of frequency bytreatment was also significant. Post hoc analysis of oscillatory
Frontiers in Neuroengineering www.frontiersin.org October 2011 | Volume 4 | Article 12 | 12
Daly et al. Local field potentials and spike timing
power as a function of the frequency by treatment interactionwas performed using one-tailed paired t -tests comparing powerat each of 84 frequency steps a p-value of 0.0005 was used to reduceexperiment-wise type 1 error rate (0.05/84). Results of this analy-sis (inset in Figure 7B indicated that oscillatory power at nearlyevery frequency step from 25 to 100 Hz was significantly reducedduring BMI application.
The corresponding spiking responses were also impacted byBMI application. Figure 7C represents the mean peri-stimulusresponse to all presentations of all odors across all five moths usedin this analysis. Note that as the oscillatory activity is decreasedduring BMI application (Figures 7A,B), there is a correspond-ing ∼60 ms decrease in the mean onset latency of the spikingpopulation response (inset black arrow). There is also an increasein spike rate (inset gray arrow) and overall duration of the spikingresponse. This pattern of results is consistent with the previous
findings of Christensen et al. (1998). That is, by disrupting theinward Cl− conductance specifically, I1 inhibition is presumablylost and hence, PNs respond earlier, stronger, and longer.
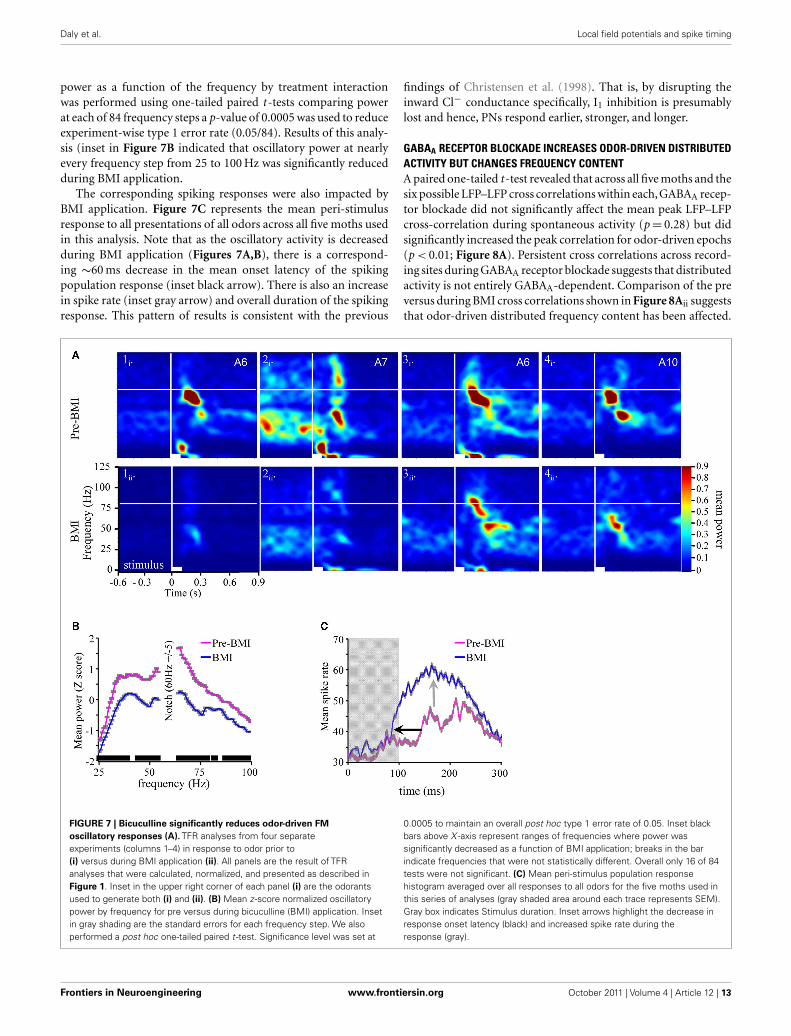
GABAA RECEPTOR BLOCKADE INCREASES ODOR-DRIVEN DISTRIBUTEDACTIVITY BUT CHANGES FREQUENCY CONTENTA paired one-tailed t -test revealed that across all five moths and thesix possible LFP–LFP cross correlations within each,GABAA recep-tor blockade did not significantly affect the mean peak LFP–LFPcross-correlation during spontaneous activity (p = 0.28) but didsignificantly increased the peak correlation for odor-driven epochs(p < 0.01; Figure 8A). Persistent cross correlations across record-ing sites during GABAA receptor blockade suggests that distributedactivity is not entirely GABAA-dependent. Comparison of the preversus during BMI cross correlations shown in Figure 8Aii suggeststhat odor-driven distributed frequency content has been affected.
FIGURE 7 | Bicuculline significantly reduces odor-driven FM
oscillatory responses (A). TFR analyses from four separateexperiments (columns 1–4) in response to odor prior to(i) versus during BMI application (ii). All panels are the result of TFRanalyses that were calculated, normalized, and presented as described inFigure 1. Inset in the upper right corner of each panel (i) are the odorantsused to generate both (i) and (ii). (B) Mean z -score normalized oscillatorypower by frequency for pre versus during bicuculline (BMI) application. Insetin gray shading are the standard errors for each frequency step. We alsoperformed a post hoc one-tailed paired t -test. Significance level was set at
0.0005 to maintain an overall post hoc type 1 error rate of 0.05. Inset blackbars above X -axis represent ranges of frequencies where power wassignificantly decreased as a function of BMI application; breaks in the barindicate frequencies that were not statistically different. Overall only 16 of 84tests were not significant. (C) Mean peri-stimulus population responsehistogram averaged over all responses to all odors for the five moths used inthis series of analyses (gray shaded area around each trace represents SEM).Gray box indicates Stimulus duration. Inset arrows highlight the decrease inresponse onset latency (black) and increased spike rate during theresponse (gray).
Frontiers in Neuroengineering www.frontiersin.org October 2011 | Volume 4 | Article 12 | 13
Daly et al. Local field potentials and spike timing
FIGURE 8 | GABAA receptor blockade increases odor-driven distributed
activity and broadens its periodic structure (A). The mean crosscorrelation prior to BMI application (red) and during BMI application. Resultsdisplayed for spontaneous (i) and odor-driven (ii) epochs. Results based onall possible pair wise comparisons across the four LFP recording sites. (B)
Mean cross spectral density prior to BMI application (red) and during BMIapplication. Results displayed for spontaneous (i) and odor-driven (ii)
epochs and based on the data represented in (A).
To address this question statistical comparison of CSD measureswas performed using ANOVA. Figure 8B displays the mean CSDfor spontaneous and odor-driven activity for pre versus duringBMI application. ANOVA revealed that there was no significantchange in mean CSD during spontaneous activity (p > 0.01) indi-cating that the relative power of distributed oscillations remainedlargely unchanged during this epoch. However, there was a sig-nificant shift in distributed frequency content during odor-drivenresponses that resulted in an increase in lower frequency content(between 40 and 55 Hz) while at the same time causing a rela-tive reduction of higher frequency content (65–85 Hz; p < 0.01;Figure 8B).
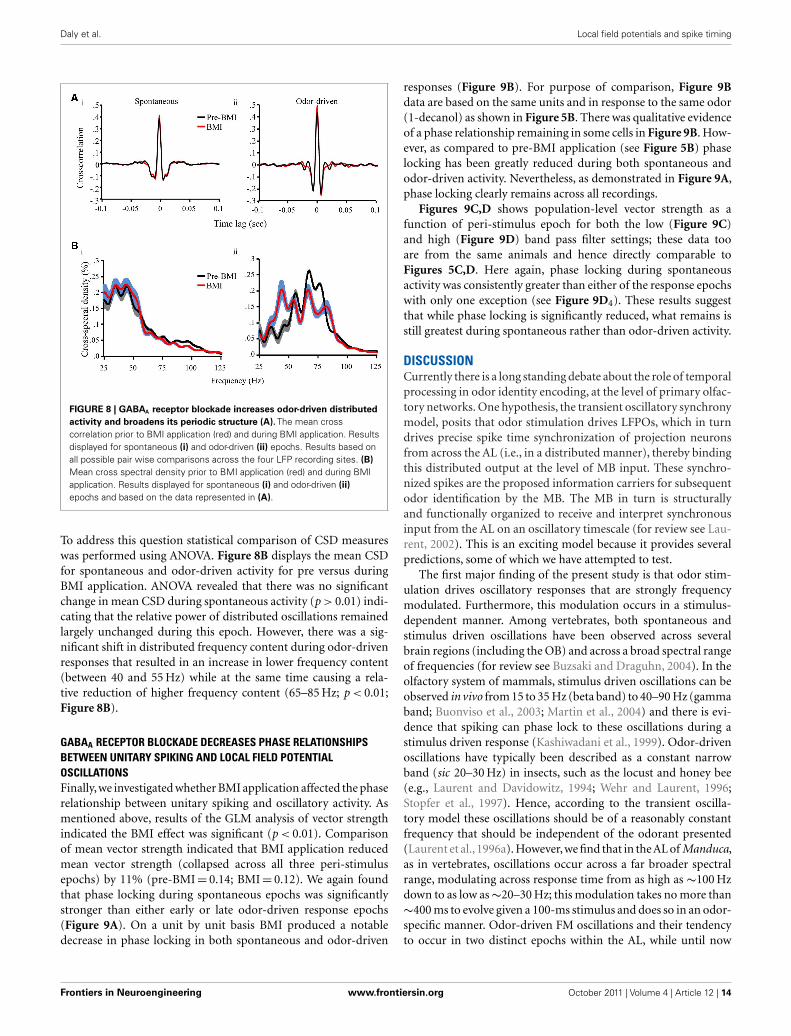
GABAA RECEPTOR BLOCKADE DECREASES PHASE RELATIONSHIPSBETWEEN UNITARY SPIKING AND LOCAL FIELD POTENTIALOSCILLATIONSFinally,we investigated whether BMI application affected the phaserelationship between unitary spiking and oscillatory activity. Asmentioned above, results of the GLM analysis of vector strengthindicated the BMI effect was significant (p < 0.01). Comparisonof mean vector strength indicated that BMI application reducedmean vector strength (collapsed across all three peri-stimulusepochs) by 11% (pre-BMI = 0.14; BMI = 0.12). We again foundthat phase locking during spontaneous epochs was significantlystronger than either early or late odor-driven response epochs(Figure 9A). On a unit by unit basis BMI produced a notabledecrease in phase locking in both spontaneous and odor-driven
responses (Figure 9B). For purpose of comparison, Figure 9Bdata are based on the same units and in response to the same odor(1-decanol) as shown in Figure 5B. There was qualitative evidenceof a phase relationship remaining in some cells in Figure 9B. How-ever, as compared to pre-BMI application (see Figure 5B) phaselocking has been greatly reduced during both spontaneous andodor-driven activity. Nevertheless, as demonstrated in Figure 9A,phase locking clearly remains across all recordings.
Figures 9C,D shows population-level vector strength as afunction of peri-stimulus epoch for both the low (Figure 9C)and high (Figure 9D) band pass filter settings; these data tooare from the same animals and hence directly comparable toFigures 5C,D. Here again, phase locking during spontaneousactivity was consistently greater than either of the response epochswith only one exception (see Figure 9D4). These results suggestthat while phase locking is significantly reduced, what remains isstill greatest during spontaneous rather than odor-driven activity.
DISCUSSIONCurrently there is a long standing debate about the role of temporalprocessing in odor identity encoding, at the level of primary olfac-tory networks. One hypothesis, the transient oscillatory synchronymodel, posits that odor stimulation drives LFPOs, which in turndrives precise spike time synchronization of projection neuronsfrom across the AL (i.e., in a distributed manner), thereby bindingthis distributed output at the level of MB input. These synchro-nized spikes are the proposed information carriers for subsequentodor identification by the MB. The MB in turn is structurallyand functionally organized to receive and interpret synchronousinput from the AL on an oscillatory timescale (for review see Lau-rent, 2002). This is an exciting model because it provides severalpredictions, some of which we have attempted to test.
The first major finding of the present study is that odor stim-ulation drives oscillatory responses that are strongly frequencymodulated. Furthermore, this modulation occurs in a stimulus-dependent manner. Among vertebrates, both spontaneous andstimulus driven oscillations have been observed across severalbrain regions (including the OB) and across a broad spectral rangeof frequencies (for review see Buzsaki and Draguhn, 2004). In theolfactory system of mammals, stimulus driven oscillations can beobserved in vivo from 15 to 35 Hz (beta band) to 40–90 Hz (gammaband; Buonviso et al., 2003; Martin et al., 2004) and there is evi-dence that spiking can phase lock to these oscillations during astimulus driven response (Kashiwadani et al., 1999). Odor-drivenoscillations have typically been described as a constant narrowband (sic 20–30 Hz) in insects, such as the locust and honey bee(e.g., Laurent and Davidowitz, 1994; Wehr and Laurent, 1996;Stopfer et al., 1997). Hence, according to the transient oscilla-tory model these oscillations should be of a reasonably constantfrequency that should be independent of the odorant presented(Laurent et al.,1996a). However,we find that in the AL of Manduca,as in vertebrates, oscillations occur across a far broader spectralrange, modulating across response time from as high as ∼100 Hzdown to as low as ∼20–30 Hz; this modulation takes no more than∼400 ms to evolve given a 100-ms stimulus and does so in an odor-specific manner. Odor-driven FM oscillations and their tendencyto occur in two distinct epochs within the AL, while until now
Frontiers in Neuroengineering www.frontiersin.org October 2011 | Volume 4 | Article 12 | 14

Daly et al. Local field potentials and spike timing
FIGURE 9 | GABAA receptor blockade decreases phase
correlations between unitary spiking and local field
oscillations. (A) Mean vector strength as a function of the three stimulusepochs during BMI application. Results are broken down by filterimplementation (25–55 Hz in light gray; 55–85 Hz in dark gray). The results ofstatistical post hoc comparison between means are inset; means withsignificant differences indicate by an asterisk. Errors bars represent standarderrors. (B) Phase lag histograms for 26 individual units from a single recording
during spontaneous and the two odor-driven response epochs during BMIapplication. For comparative purposes, these histograms were generatedfrom the same moth and in response to the same odorants as shown inFigure 5B. (C) Population-level measures of vector strength as a function ofthe three stimulus epochs for the five moths used in this analysis. Results arefor the 25 to 55-Hz band pass filter implementation and each panel representsa different animal. (D) The same as (C). except using the 55 to 85-Hz bandpass filter.
unreported in the insect literature, is strikingly similar to what hasbeen observed in mammalian OB (Buonviso et al., 2003).
It has recently been shown that prolonged odor stimulation (ca.500–4000 ms) drives FM oscillations ranging from 50 Hz down to10 Hz in the MBs of Manduca (Ito et al., 2009). We find that FMLFPOs recorded in the AL occur across a broader spectral range,do not require prolonged stimulation and are furthermore clearlyodor dependent. The two studies taken together suggest that thehighest frequency content does not pass from AL to MB. Indeed,much of the higher frequency content that occurs during the earlyphase of the AL response (100–80 Hz at ∼60–110 ms post stimulusonset) occurs prior to initiation of PN spiking responses, whichtypically start no earlier than ∼110–120 ms after the odor valve isactuated (Daly et al., 2004b; Staudacher et al., 2009). Thus, at leastsome of the higher frequency content observed in the AL, becauseit occurs while PN output is suppressed, cannot be transmitted tothe MB.
In insects, it has been proposed that the downstream receivers ofAL output, the Kenyon cells of the MB, are normally under strong
inhibitory control by inputs projecting from the lateral horn. Lat-eral horn cells, like the Kenyon cells of the MB calyx, receive directexcitatory input from the AL. It has been furthermore proposedthat this circuitous pathway establishes an integration windowthat is opened for synchronous excitatory input from the AL thenabruptly closed by inhibitory input from the lateral horn (Perez-Orive et al., 2002). This integrate-and-reset window occurs withinthe periodic timescale initially established by odor-driven AL oscil-lations. From a theoretical perspective, given that neurons havefixed conduction velocities, cable lengths, and synaptic delays, thecircuit function proposed by Perez-Orive et al. (2002) will have abiophysically constrained integration window. As a result, such anintegrate-and-reset circuit will have limited tolerance for the FMoscillations that we have observed (for review see Laurent, 2002).It remains to be determined if and how subsequent decoding inthe MB could occur under the constraints of a static integrationwindow.
A second finding of this study is that odor-driven FM oscil-latory responses are largely restricted to a subset (less than 2 on
Frontiers in Neuroengineering www.frontiersin.org October 2011 | Volume 4 | Article 12 | 15

Daly et al. Local field potentials and spike timing
average) of the four LFP recording sites and hence appears in mostcases to be regionalized. Furthermore, cross correlation analysisalso indicates that there is only a very small amount of activitythat is both distributed across pairs of recording sites and tem-porally structured (i.e., oscillatory). This distributed oscillatoryactivity is state dependent; that is, spontaneous distributed activ-ity is dominated by oscillatory activity in the 25 to 55-Hz range,whereas distributed odor-driven oscillations are in the 55 to 85-Hzrange; this pattern of results of relatively higher frequency oscil-latory content during odor-driven responses is consistent withprior findings in honeybee (Ritz et al., 2001). While the precisedegree of this regionalization of responses remains an importantarea for further research, it is at odds with the transient oscillatorymodel.
One question that arises from these results is whether the rela-tively small amount of distributed oscillatory activity is sufficientto correlate with or otherwise influence spiking behavior in PNsin a manner that increases the amount of synchrony across ALPNs, as required by the transient oscillatory model. Our resultsdemonstrate that spike timing is indeed biased to occur in a pre-ferred phase relationship to the oscillation, though this bias wasclearly state and cell (and recording) specific (see Figures 5 and6). Contrary to the expectations of the transient oscillatory model,however, we observed that during an odor-driven response, as apopulation, this phase locking was largely lost. This occurred inpart because unitary vector strength values dropped significantlyduring the odor response, which means that even at the level ofindividual cells, odor stimulation decoupled cells from the influ-ence of LFPOs. Additionally, preferred phase angles of individualunits became more variable and hence more evenly distributedacross all phases of the oscillation cycle; this lowered population-level measures of phase locking. Thus, odor-driven oscillationsper se had little effect on synchronizing the spikes across individ-ual units of the recorded population. It is worth highlighting thatstrong phase locking has been typically observed in response tolonger stimulations than we presented here (Laurent and Naraghi,1994; Laurent et al., 1996b; Stopfer et al., 1997; Kashiwadani et al.,1999). While future work will explore the possibility that longerand temporally structured stimuli have differing effects on odor-driven phase locking, we note that 100 ms stimulations are entirelyconsistent with expected encounter times in natural plumes thatthe moth might encounter (Murlis and Jones, 1981) and are knownto respond to in behavioral studies (Willis and Baker, 1984).
The fact that phase locking is lost during odor-driven responsesin this model system should not be surprising. Indeed, it has longbeen known that in response to odor stimulation, AL PNs in Man-duca are briefly inhibited followed by a sustained supra-thresholddepolarization and spiking (for several examples see Christensenet al., 1996; Christensen et al., 1998; Heinbockel et al., 1998, 1999;Staudacher et al., 2009). This explains in part why odor responsesappear to be characterized by a loss of phase relationship betweenour recorded units and LFPOs. This also likely explains why oth-ers were not able to establish phase locking during odor-drivenresponses in previous studies (Christensen et al., 2003). However,this does not explain the prolonged loss of phase locking.
In the AL of Manduca, LNs and PNs are spontaneously activeunder normal conditions; this has long been known (Matsumoto
and Hildebrand, 1981; Kanzaki et al., 1989). Because oscilla-tions are presumably the result of reciprocal synaptic connectivitywithin the network, it is expected that there is always some spon-taneous oscillatory activity observable in the LFP, even though theamplitude may be small, relative to what is observed during odor-driven responses. Unexpectedly, we found that there is a tendencyfor individual cells to spontaneously spike in phase with oscillationcycles in the absence of odor stimulation.
It has been shown that even weak oscillatory signals in neuralcircuits can in some cases enhance signal to noise ratios; this phe-nomena is called stochastic resonance (Wiesenfeld and Moss, 1995;Wilkens et al., 2002; Korn and Faure, 2003). It has also been shownthat weakly correlated noise in the olfactory circuit can enhancespike time synchrony (Galán et al., 2006). Perhaps then, the mostintriguing finding in the current study is the significantly greaterspike to LFP phase locking observed during spontaneous activ-ity, relative to odor-driven responses; this was true independentof the frequency range of the oscillations under consideration.Thus, if oscillations were acting as a synchronizing mechanismin this model system, they are doing so during ongoing, spon-taneous activity, and not during odor-driven responses. This isin sharp contrast to predictions made by the transient oscillatorymodel, which assumes that phase locking is a stimulus driven phe-nomenon involved in odor identity encoding. It is worth notingthat we are unaware of any reported comparisons of spontaneousversus odor-driven phase locking prior to the present study, thusit is difficult to assess the generality of our findings. However,“bouts” of spontaneous oscillatory activity have been observed inboth locust (Laurent and Naraghi, 1994) and honeybee (Ritz et al.,2001) olfactory pathways that appear to be consistent with ourobservations.
In response to odor stimulation, individual PNs recorded fromManduca AL are briefly inhibited via an inward Cl− conductance,then burst as the second epoch of oscillations emerge. Severallines of evidence from both vertebrate and invertebrate mod-els establish that spatially co-localized principal output neuronstend to produce stimulus driven synchronous spike bursting pat-terns (Schoppa and Westbrook, 2001, 2002; Lei et al., 2002; Dalyet al., 2004b; Hayar et al., 2005) in what has been describedas onset synchrony (Christensen et al., 2001; Lei et al., 2002).Parallel recordings of neural ensembles as well as serial recon-structions of AL output activity suggest that the onset of thisburst of activity is different for different glomeruli thereby pro-ducing a brief sequence of onsets that are odor dependent andoptimize within ∼240 ms of odor onset (or ∼120 ms from theonset of the excitatory response) in this model system (Dalyet al., 2004b; Staudacher et al., 2009); this is roughly consistentwith calcium-imaging studies in honeybee (Galán et al., 2004).This time course for producing odor-specific activation patternsalso appears to be consistent with physiological evidence fromother model organisms (Muller et al., 2002; Lehmkuhle et al.,2006; Spors et al., 2006; Namiki and Kanzaki, 2008; Namiki et al.,2009) as well as behavioral evidence demonstrating odor identi-fication/discrimination within the same approximate time frameor faster (Laska et al., 1999; Uchida and Mainen, 2003; Budickand Dickinson, 2006; Wesson et al., 2008a,b). Thus, it is reason-able to conclude that the temporal window for odor identification
Frontiers in Neuroengineering www.frontiersin.org October 2011 | Volume 4 | Article 12 | 16

Daly et al. Local field potentials and spike timing
is in the range of 240 ms from stimulus onset or about ∼120 msfrom initiation of the excitatory response within the AL (e.g., seeFigure 1).
Stopfer et al. (1997) demonstrated that oscillations are abol-ished in the honeybee by application of the GABAA receptorantagonist picrotoxin. Based on a stimulus generalization para-digm they also suggest that GABAA receptor blockade disrupts fineodor discrimination in this insect. These findings represent a cor-nerstone of the transient oscillatory model because they identifya specific functional role for oscillations. More recently, however,the conclusion that GABAA receptor blockade affects discrimi-nation only of closely related odors has been challenged by amore comprehensive behavior-pharmacological study in Manduca(Mwilaria et al., 2008). This study was based on pharmacologicaldata from 1680 moths and established that discrimination of pairsof odors is generally disrupted independent of the relatedness ofthe odor pairs. Furthermore, Mwilaria et al. (2008) showed thatGABAA receptor disruption increased detection thresholds. Basedon these finding it was proposed that the disruption of the abil-ity to discriminate closely related odors was most likely due toa general increase in detection thresholds, which increased taskdifficulty. These findings have been subsequently supported byphysiological and wind tunnel experiments demonstrating thatGABAA receptor blockade in the macroglomerular complex of theAL (the region of the male AL where the primary componentsof female pheromones are processed), does not affect pheromonedetection at the level of spiking PNs but does reduce PN signal tonoise (Lei et al., 2009). These researchers furthermore showed thatreduction in signal to noise disrupts the ability of male moths tosuccessfully plume track. This is consistent with the interpretationthat at the level of sensory perception, loss of AL GABAA receptorfunction results in a loss of ability to clearly perceive the presenceof (i.e., detect) an odor cue (Mwilaria et al., 2008). This too is instark contrast to the transient oscillatory model, which predictsthat the sole functional effect of GABAA receptor blockade is onthe ability to discriminate closely related odors.
In conclusion, it is perhaps not surprising that the transientoscillatory model,which is based primarily on data from the locust,does not fit well with data from model systems such as Manducagiven the differences in structural organization of the AL betweenthese two species. For example, locusts have a derived AL morphol-ogy consisting of hundreds of small microglomeruli, in which botholfactory receptor neurons and PNs are multi glomerular and LNs
are non-spiking (Anton and Homberg, 1999). In contrast, Mand-uca, like most insects and mammals, have exclusively uniglomeru-lar ORNs and predominantly uniglomerular PNs as well as severalLN morphologies, all of which produce action potentials. The dif-ferences in structure between the locust and Manduca likely reflectfunctional adaptations to distinct behavioral and chemical ecolo-gies. Insects such as Manduca are more or less specialized upon asingle food source as adults (i.e., floral nectars), and heavily depen-dent upon olfactory cues for locating these food sources from adistance (Bernays, 2001). For these insects there is a need to detectand rapidly discriminate among many faint and brief odor cuesin the environment in order to locate a particular food source viaodor plume tracking behavior. In contrast, orthopteran insectsincluding locusts are extreme dietary generalists, consuming awide variety of food sources consisting of both living and deadplant and animal material (Gangwere, 1961). Individual food pref-erences appear to be based upon a mixture of variables includinglocal environmental conditions, the need to avoid predators (Des-pland and Simpson, 2005), what types of food are available, foodquality, and nutrient need (Raubenheimer and Simpson, 2003).Given this pattern of food acquisition, it is likely that these insectsare less dependent on identifying palatable food sources using spe-cific olfactory cues, but may instead navigate to broad categoriesof food odors such as green leaf volatiles (Ochieng and Hansson,1999; Chen and Kang, 2000). Unfortunately, while recent studiesnow support the notion that the locust can learn and discriminatebetween a pair of broadly different odorants (Simoes et al., 2011)there are no studies to date that integrate observations of fineodor discrimination, food choice, and AL physiology in locusts soit is not possible at present to speculate how this insect actuallydetects and utilizes odors in a behavioral context. We can, how-ever, posit that the locust, an insect with an unusual wide openfeeding ecology, in addition to possessing a unique AL anatomyand physiology, is unlikely to process odorants in a manner typ-ical of the majority of insects or of odorant-sensing animals ingeneral.
ACKNOWLEDGMENTSWe thank Dr’s S. M. Farris, G. Spirou, B. G. Schreurs, and A. Agmonfor critical review of this research. This research was funded byNIH/NIDCD R01DC009417 and NIH/NCRR P20RR015574 toKevin C. Daly and by the Mt. Sinai Health Care Foundation andthe Alfred P. Sloan Foundation to Roberto F. Galán.
REFERENCESAnton, S., and Homberg, U. (1999).
Insect Olfaction. Berlin, NY: Springer,457.
Bell, R. A., and Joachim, F. G. (1976).Techniques for rearing laboratorycolonies of tobacco hornworms andpink bollworms. Ann. Entomol. Soc.Am. 69, 365–372.
Bernays, E. A. (2001). Neural limitationsin phytophagous insects: implica-tions for diet breadth and evolu-tion of host affiliation. Annu. Rev.Entomol. 46, 703–727.
Boser, B. E., Guyon, I. M., and Vap-nik, V. N. (1992). “A training algo-rithm for optimal margin classi-fiers,” in COLT 1992 Proceedingsof the Fifth Annual Workshop onComputational Learning (New York:ACM).
Budick, S. A., and Dickinson, M.H. (2006). Free-flight responses ofDrosophila melanogaster to attrac-tive odors. J. Exp. Biol. 209,3001–3017.
Buonviso, N., Amat, C., Litaudon, P.,Roux, S., Royet, J. P., Farget, V., and
Sicard, G. (2003). Rhythm sequencethrough the olfactory bulb layersduring the time window of a res-piratory cycle. Eur. J. Neurosci. 17,1811–1819.
Buzsaki, G., and Draguhn, A. (2004).Neuronal oscillations in cortical net-works. Science 304, 1926–1929.
Chen, H. H., and Kang, L. (2000).Olfactory responses of two speciesof grasshoppers to plant odours.Entomol. Exp. Appl. 95, 129–134.
Christensen, T. A., D’Alessandro, G.,Lega, J., and Hildebrand, J. G. (2001).
Morphometric modeling of olfac-tory circuits in the insect anten-nal lobe: I. Simulations of spikinglocal interneurons. Biosystems 61,143–153.
Christensen, T. A., Heinbockel, T., andHildebrand, J. G. (1996). Olfactoryinformation processing in the brain:encoding chemical and temporalfeatures of odors. J. Neurobiol. 30,82–91.
Christensen, T. A., Lei, H., and Hilde-brand, J. G. (2003). Coordina-tion of central odor representations
Frontiers in Neuroengineering www.frontiersin.org October 2011 | Volume 4 | Article 12 | 17

Daly et al. Local field potentials and spike timing
through transient, non-oscillatorysynchronization of glomerular out-put neurons. Proc. Natl. Acad. Sci.U.S.A. 100, 11076–11081.
Christensen, T. A., Waldrop, B. R., andHildebrand, J. G. (1998). Multitask-ing in the olfactory system: context-dependent responses to odors revealdual GABA-regulated coding mech-anisms in single olfactory pro-jection neurons. J. Neurosci. 18,5999–6008.
Daly, K. C., Chandra, S., Durtschi, M.L., and Smith, B. H. (2001). Thegeneralization of an olfactory-basedconditioned response reveals uniquebut overlapping odour representa-tions in the moth Manduca sexta. J.Exp. Biol. 204, 3085–3095.
Daly, K. C., Christensen, T. A., Lei,H., Smith, B. H., and Hildebrand,J. G. (2004a). Learning modulatesthe ensemble representations forodors in primary olfactory net-works. Proc. Natl. Acad. Sci. U.S.A.101, 10476–10481.
Daly, K. C., Wright, G. A., andSmith, B. H. (2004b). Molecularfeatures of odorants systematicallyinfluence slow temporal responsesacross clusters of coordinated anten-nal lobe units in the moth Man-duca sexta. J. Neurophysiol. 92,236–254.
Despland, E., and Simpson, S. J. (2005).Food choices of solitarious and gre-garious locusts reflect cryptic andaposematic antipredator strategies.Anim. Behav. 69, 471–479.
Friedrich, R. W., and Laurent, G. (2001).Dynamic optimization of odor rep-resentations by slow temporal pat-terning of mitral cell activity. Science291, 889–894.
Galán, R. F., Fourcaud-Trocme, N.,Ermentrout, G. B., and Urban, N.N. (2006). Correlation-induced syn-chronization of oscillations in olfac-tory bulb neurons. J. Neurosci. 26,3646–3655.
Galán, R. F., Sachse, S., Galizia, C. G.,and Herz, A. V. M. (2004). Odor-driven attractor dynamics in theantennal lobe allow for simple andrapid olfactory pattern classification.Neural Comput. 16, 999–1012.
Gangwere, S. K. (1961). A monographon food selection in Orthoptera.Trans. Am. Entomol. Soc. 87, 67–230.
Gelperin, A., and Tank, D. W. (1990).Odour-modulated collectivenetwork oscillations of olfactoryinterneurons in a terrestrial mollusc.Nature 345, 437–440.
Goldberg, J. M., and Brown, P. B.(1969). Response of binaural neu-rons of dog superior olivary com-plex to dichotic tonal stimuli: somephysiological mechanisms of sound
localization. J. Neurophysiol. 32,613–636.
Hayar, A., Shipley, M. T., and Ennis,M. (2005). Olfactory bulb externaltufted cells are synchronized by mul-tiple intraglomerular mechanisms. J.Neurosci. 25, 8197–8208.
Heinbockel, T., Christensen, T. A., andHildebrand, J. G. (1999). Tem-poral tuning of odor responsesin pheromone-responsive projec-tion neurons in the brain of thesphinx moth Manduca sexta. J.Comp. Neurol. 409, 1–12.
Heinbockel, T., Kloppenburg, P.,and Hildebrand, J. G. (1998).Pheromone-evoked potentials andoscillations in the antennal lobes ofthe sphinx moth Manduca sexta. J.Comp. Physiol. A 182, 703–714.
Hosler, J. S., Buxton, K. L., and Smith,B. H. (2000). Impairment of olfac-tory discrimination by blockade ofGABA and nitric oxide activity inthe honey bee antennal lobes. Behav.Neurosci. 114, 514–525.
Ito, I., Bazhenov, M., Ong, R. C.,Raman, B., and Stopfer, M. (2009).Frequency transitions in odor-evoked neural oscillations. Neuron64, 692–706.
Johnson, B. A., Farahbod, H., Saber, S.,and Leon, M. (2005). Effects of func-tional group position on spatial rep-resentations of aliphatic odorantsin the rat olfactory bulb. J. Comp.Neurol. 483, 192–204.
Johnson, B. A., Woo, C. C., Hingco,E. E., Pham, K. L., and Leon, M.(1999). Multidimensional chemo-topic responses to n-aliphatic acidodorants in the rat olfactory bulb.J. Comp. Neurol. 409, 529–548.
Johnson, B. A., Woo, C. C., and Leon,M. (1998). Spatial coding of odor-ant features in the glomerular layerof the rat olfactory bulb. J. Comp.Neurol. 393, 457–471.
Kadner, A., and Berrebi, A. S. (2008).Encoding of temporal featuresof auditory stimuli in the medialnucleus of the trapezoid bodyand superior paraolivary nucleusof the rat. Neuroscience 151,868–887.
Kanzaki, R., Arbas, E. A., Strausfeld,N. J., and Hildebrand, J. G. (1989).Physiology and morphology of pro-jection neurons in the antennallobe of the male moth Mand-uca sexta. J. Comp. Physiol. A 165,427–453.
Kashiwadani, H., Sasaki, Y. F., Uchida,N., and Mori, K. (1999). Syn-chronized oscillatory discharges ofmitral/tufted cells with differentmolecular receptive ranges in therabbit olfactory bulb. J. Neurophys-iol. 82, 1786–1792.
Korn, H., and Faure, P. (2003). Is therechaos in the brain? II. Experimentalevidence and related models. C. R.Biol. 326, 787–840.
Laska, M., Galizia, C. G., Giurfa,M., and Menzel, R. (1999). Olfac-tory discrimination ability andodor structure-activity relationshipsin honeybees. Chem. Senses 24,429–438.
Laurent, G. (2002). Olfactory networkdynamics and the coding of multi-dimensional signals. Nat. Rev. Neu-rosci. 3, 884–895.
Laurent, G., and Davidowitz, H. (1994).Encoding of olfactory informationwith oscillating neural assemblies.Science 265, 1872–1875.
Laurent, G., and Naraghi, M. (1994).Odorant-induced oscillations in themushroom bodies of the locust. J.Neurosci. 14, 2993–3004.
Laurent, G., Stopfer, M., Friedrich, R.W., Rabinovich, M. I., Volkovskii, A.,and Abarbanel, H. D. I. (2001). Odorencoding as an active, dynamicalprocess: experiments, computation,and theory. Annu. Rev. Neurosci. 24,263–297.
Laurent, G., Wehr, M., and David-owitz, H. (1996a). Temporal rep-resentations of odors in an olfac-tory network. J. Neurosci. 16,3837–3847.
Laurent, G., Wehr, M., MacLeod,K., Stopfer, M., Leitch, B., andDavidowitz, H. (1996b). Dynamicencoding of odors with oscil-lating neuronal assemblies inthe locust brain. Biol. Bull. 191,70–75.
Lehmkuhle, M. J., Normann, R. A., andMaynard, E. M. (2006). Trial-by-trialdiscrimination of three enantiomerpairs by neural ensembles in mam-malian olfactory bulb. J. Neurophys-iol. 95, 1369–1379.
Lei, H., Christensen, T. A., and Hilde-brand, J. G. (2002). Local inhibi-tion modulates odor-evoked syn-chronization of glomerulus-specificoutput neurons. Nat. Neurosci. 5,557–565.
Lei, H., Riffell, J. A., Gage, S. L., andHildebrand, J. G. (2009). Contrastenhancement of stimulus intermit-tency in a primary olfactory net-work and its behavioral significance.J. Biol. 8, 21.
Linster, C., Johnson, B. A., Yue, E.,Morse,A., Xu, Z., Hingco, E. E., Choi,Y., Choi, M., Messiha, A., and Leon,M. (2001). Perceptual correlates ofneural representations evoked byodorant enantiomers. J. Neurosci. 21,9837–9843.
MacLeod, K., and Laurent, G. (1996).Distinct mechanisms for synchro-nization and temporal patterning
of odor-encoding neural assemblies.Science 274, 976–979.
Martin, C., Gervais, R., Chabaud, P.,Messaoudi, B., and Ravel, N. (2004).Learning-induced modulation ofoscillatory activities in the mam-malian olfactory system: the role ofthe centrifugal fibres. J. Physiol. Paris98, 467–478.
Matsumoto, S. G., and Hildebrand, J.G. (1981). Olfactory mechanisms inthe moth Manduca sexta: responsecharacteristics and morphology ofcentral neurons in the antennal lobe.Proc. R. Soc. Lond. B Biol. Sci. 213,249–277.
Moushegian, G., Rupert, A. L.,and Gidda, J. S. (1975). Func-tional characteristics of superiorolivary neurons to binauralstimuli. J. Neurophysiol. 38,1037–1048.
Muller, D., Abel, R., Brandt, R., Zockler,M., and Menzel, R. (2002). Differen-tial parallel processing of olfactoryinformation in the honeybee, Apismellifera L. J. Comp. Physiol. A Neu-roethol. Sens. Neural Behav. Physiol.188, 359–370.
Murlis, J., and Jones, C. D. (1981). Fine-scale structure of odor plumes inrelation to insect orientation to dis-tant pheromone and other attrac-tant sources. Physiol. Entomol. 6,71–86.
Mwilaria, E. K., Ghatak, C., andDaly, K. C. (2008). Disruptionof GABA(A) in the insect anten-nal lobe generally increases odordetection and discriminationthresholds. Chem. Senses 33,267–281.
Namiki, S., Haupt, S. S., Kazawa, T.,Takashima, A., Ikeno, H., and Kan-zaki, R. (2009). Reconstruction ofvirtual neural circuits in an insectbrain. Front. Neurosci. 3:206–213.doi:10.3389/neuro.01.028.2009
Namiki, S., and Kanzaki, R. (2008).Reconstructing the populationactivity of olfactory output neuronsthat innervate identifiable process-ing units. Front. Neural Circuits 2:1.doi:10.3389/neuro.04.001.2008
Nusser, Z., Kay, L. M., Laurent, G.,Homanics, G. E., and Mody, I.(2001). Disruption of GABA(A)receptors on GABAergic interneu-rons leads to increased oscil-latory power in the olfactorybulb network. J. Neurophysiol. 86,2823–2833.
Ochieng, S. A., and Hansson, B.S. (1999). Responses of olfactoryreceptor neurones to behaviourallyimportant odours in gregarious andsolitarious desert locust, Schisto-cerca gregaria. Physiol. Entomol. 24,18–36.
Frontiers in Neuroengineering www.frontiersin.org October 2011 | Volume 4 | Article 12 | 18

Daly et al. Local field potentials and spike timing
Perez-Orive, J., Mazor, O., Turner, G.C., Cassenaer, S., Wilson, R. I., andLaurent, G. (2002). Oscillations andsparsening of odor representationsin the mushroom body. Science 297,359–365.
Raubenheimer, D., and Simpson,S. J. (2003). Nutrient balanc-ing in grasshoppers: behaviouraland physiological correlates ofdietary breadth. J. Exp. Biol. 206,1669–1681.
Ritz, R., Galán, R. F., Szyszka, P., andHerz, A. V. M. (2001). Analysis ofodor processing in the mushroombodies of the honeybee. Neurocom-puting 38–40, 313–318.
Schoppa, N. E., and Westbrook, G.L. (2001). Glomerulus-specific syn-chronization of mitral cells inthe olfactory bulb. Neuron 31,639–651.
Schoppa, N. E., and Westbrook, G.L. (2002). AMPA autoreceptorsdrive correlated spiking in olfac-tory bulb glomeruli. Nat. Neurosci.5, 1194–1202.
Simoes, P., Ott, S. R., and Niven, J. E.(2011). Associative olfactory learn-ing in the desert locust, Schisto-cerca gregaria. J. Exp. Biol. 214,2495–2503.
Spors, H., Wachowiak, M., Cohen, L.B., and Friedrich, R. W. (2006).Temporal dynamics and latency pat-terns of receptor neuron input to
the olfactory bulb. J. Neurosci. 26,1247–1259.
Staudacher, E. M., Huetteroth, W.,Schachtner, J., and Daly, K. C.(2009). A 4-dimensional represen-tation of antennal lobe outputbased on an ensemble of character-ized projection neurons. J. Neurosci.Methods 180, 208–223.
Stevenson, R., Corbo, K., Baca, L., andLe, Q. (1995). Cage size and flightspeed of the tobacco hawk mothManduca sexta. J. Exp. Biol. 198,1665–1672.
Stopfer, M., Bhagavan, S., Smith, B. H.,and Laurent, G. (1997). Impairedodour discrimination on desynchro-nization of odour-encoding neuralassemblies. Nature 390, 70–74.
Stopfer, M., Jayaraman, V., and Laurent,G. (2003). Intensity versus iden-tity coding in an olfactory system.Neuron 39, 991–1004.
Uchida, N., and Mainen, Z. F. (2003).Speed and accuracy of olfactorydiscrimination in the rat. Nat. Neu-rosci. 6, 1224–1229.
Waldrop, B., Christensen, T. A., andHildebrand, J. G. (1987). GABA-mediated synaptic inhibition of pro-jection neurons in the antennallobes of the sphinx moth, Mand-uca sexta. J. Comp. Physiol. A 161,23–32.
Wehr, M., and Laurent, G. (1996).Odour encoding by temporal
sequences of firing in oscillatingneural assemblies. Nature 384,162–166.
Wehr, M., and Laurent, G. (1999). Rela-tionship between afferent and cen-tral temporal patterns in the locustolfactory system. J. Neurosci. 19,381–390.
Wesson, D. W., Carey, R. M., Ver-hagen, J. V., and Wachowiak, M.(2008a). Rapid encoding and per-ception of novel odors in the rat.PLoS Biol. 6, e82. doi:10.1371/jour-nal.pbio.0060082
Wesson, D. W., Donahou, T. N.,Johnson, M. O., and Wachowiak,M. (2008b). Sniffing behavior ofmice during performance in odor-guided tasks. Chem. Senses 33,581–596.
Wiesenfeld, K., and Moss, F. (1995). Sto-chastic resonance and the benefits ofnoise – from ice ages to crayfish andsquids. Nature 373, 33–36.
Wilkens, L. A., Hofmann, M. H., andWojtenek, W. (2002). The electricsense of the paddlefish: a passive sys-tem for the detection and captureof zooplankton prey. J. Physiol. Paris96, 363–377.
Willis, M. A., and Baker, T. C. (1984).Effects of intermittent and continu-ous pheromone stimulation on theflight behaviour of the oriental fruitmoth Grapholita molesta. Physiol.Entomol. 9, 341–358.
Wright, G. A., Skinner, B. D., andSmith, B. H. (2002). Ability ofhoneybee, Apis mellifera, to detectand discriminate odors of varietiesof canola (Brassica rapa and Bras-sica napus) and snapdragon flowers(Antirrhinum majus). J. Chem. Ecol.28, 721–740.
Conflict of Interest Statement: Theauthors declare that the research wasconducted in the absence of anycommercial or financial relationshipsthat could be construed as a potentialconflict of interest.
Received: 07 July 2011; paper pendingpublished: 16 August 2011; accepted: 30September 2011; published online: 25October 2011.Citation: Daly KC, Galán RF, PetersOJ and Staudacher EM (2011) Detailedcharacterization of local field potentialoscillations and their relationship to spiketiming in the antennal lobe of the mothManduca sexta. Front. Neuroeng. 4:12.doi: 10.3389/fneng.2011.00012Copyright © 2011 Daly, Galán, Petersand Staudacher. This is an open-accessarticle subject to a non-exclusive licensebetween the authors and Frontiers MediaSA, which permits use, distribution andreproduction in other forums, providedthe original authors and source are cred-ited and other Frontiers conditions arecomplied with.
Frontiers in Neuroengineering www.frontiersin.org October 2011 | Volume 4 | Article 12 | 19

Daly et al. Local field potentials and spike timing
APPENDIXMETHODSDiscriminant analysis of time-frequency response spectrogramsThe aim of this analysis was to establish whether odor-driven fre-quency modulation of the LFP oscillation was odor specific. Thereare two main approaches to investigate this: by means of unsu-pervised learning algorithms (e.g., k-means clustering analysis),or by means of supervised learning algorithms (e.g., discriminantanalysis via support vector classifiers). In the unsupervised learn-ing approach, all samples (in our case TFRs) are represented aspoints in a multidimensional space and groups of points that arecloser among themselves than among others are classified together.One thus expects that all points from the same cluster belong tothe same odor. In practice, however, this is seldom the case. Theclouds of points from the same odor may not have radial symme-try and even worse, they may partially overlap with the “clouds”of other odors. Thus, the relative distance between points is nota good criterion to classify odors, regardless of the definition ofdistance (Euclidean, angular, etc.). The supervised classificationapproach, which is an alternative to unsupervised clustering, hasbeen used previously to identify odor-specific patterns of neuralactivity in the antennal lobe of the honeybee (Galán et al., 2004).In this case, a multidimensional representation is also used but thepoints are labeled, i.e., assigned to an odor. Then, an optimiza-tion algorithm, the support vector classifier, (Boser et al., 1992)attempts to find a hyperplane (a plane in more than three dimen-sions) or another high-dimensional manifold that separates thepoints belonging to the same class (odor) from the rest. If success-ful, the manifold can be used as a classifier to identify that odor:on one side lie the points of the same odor; on the other side liethe rest. The same procedure can be repeated for each odor tocompute odor-specific classifiers. Support vector classifiers havethe advantage over clustering methods of tolerating some over-lap (soft margin) between clouds of points from different stimuli.However, when the clouds overlap the mere existence of a sep-arating manifold is not very informative, since both groups arenot 100% separable. In such cases, the Classification PerformanceIndex (CPI) provides a better parameter to quantify odor-specificTFR patterns; CPI is computed using the leave-one-out method(Boser et al., 1992; Galán et al., 2004): First, the separating man-ifold is computed after removing one point from the data set.Then, one tests if the point that was left out is correctly clas-sified. These three steps (removal of a point, calculation of thediscriminator, and classification of the point removed) are theniterated for all points of a given stimulus. The fraction of pointsthat are correctly classified for each stimulus is the CPI. A highCPI means that the separating manifold is fairly insensitive to theremoval of any given point, and hence robust to perturbationsof the data set. A high CPI implies that the high-dimensionalspace in which the points are represented is divided into stimu-lus specific regions, despite some overlap between the clouds ofpoints.
Dimensionality reductionAs a preprocessing step for TFRs discriminate analysis, we croppedout a reduced frequency–time window, which contained the vastbulk of the FM response across all TFRs (from 12 to 124 Hz and
from −30 to 1000 ms); this resulted in a reduced data matrix of118,800 pixels per TFR/response. For each response to each odor,we then defined a region of interest (ROI), consisting of all pix-els that are above the 99th percentile of power density. All theseROI (9 odors × 20 repeats = 180 ROI) where overlaid to create amask whose pixel values were “1” if that pixel was significantlyactivated by any odor in any trial and “0” if not. For the discrim-inant analysis with support vector classifiers, we only consideredthe pixels of the TFRs whose values in the mask were“1.”Each TFRis thus represented as a vector 24,969 components (pixels) insteadof 118,800 for the cropped TFR, thereby leading to a substantialdimensionality reduction of roughly 80%.
Kernels for the support vector classifierThe vectors representing the TFRs are fed into the algorithm ofthe support vector classifier. The output of the algorithms returnsa set of n “support vectors,” �si , weights ai, and bias b that are usedto classify a given vector �x according to the following equation:
c =n∑
i =1
aiK (�si , �x) + b, (A1)
where K is a kernel function. In the case of a linear kernel, it is thedot product: K (�si , �x) = �si · �x and the Eq. A1 defines a plane in thehigh-dimensional space. If c ≥ 0, then �x is classified as a memberof group 1 (e.g., odor Y), otherwise it is classified as a membergroup 2 (e.g., any other odor different from Y). In this paper, wealso use a non-linear kernel, specifically, a third order polynomialgiven by:
K (�si , �x) = (�si · �x + 1)3 .
This allows us to separate odors with a curvy manifold and theregion assigned to a given odor may be composed of disjoint sub-regions. Using this kernel, we can discriminate TRFs from eachodor group with 100% CPI.
Calculation of the confidence interval for the classificationperformance indexThe null hypothesis to compute the confidence interval is that thetwo groups are completely intermingled and cannot be discrimi-nated so that the probability that any point falls in one side of theclassifier is p = 50%. In our case, the two groups correspond to theN = 20 trials of the same odor (first group) and the rest of pointsfrom all other odors (second group). Thus the probability that Mout of the N points fall into the same side of the classifier is givenby a binomial distribution whose mean and variance are N × Pand N × P × (1-P), respectively. The binomial distribution itselfis discrete. However, it can be smoothened by interpolation so thatits cumulative distribution is also smooth, not staggered, and thepercentiles can be calculated at any level. For example, the 95thpercentile corresponds to the ratio M /N = 66.25%. This meansthat if the CPI is above 66.25%, we can reject the null hypothesiswith 95% confidence and for each CPI value above this level thep-value is smaller than 0.05. In the CPI plots, the red line indicatesthis significance level.
Frontiers in Neuroengineering www.frontiersin.org October 2011 | Volume 4 | Article 12 | 20

Daly et al. Local field potentials and spike timing
FIGURE A1 | Averaged time frequency response (TFR) spectrogram from
6 of 10 total recordings. Displayed in each panel are the averaged results of20 independent analyses for each of the 20 presentations for various odors(inset; K = ketone, A = alcohol; number = carbon chain length). Also inset arewhite bars indicating stimulus duration (100 ms). Vertical white line indicates
odor onset. Horizontal white line is an 80-Hz frequency reference. Note theongoing oscillatory activity present centered around 30–50 Hz that occursbetween 600 ms until just after stimulus onset. Upon stimulus onset thisactivity abruptly terminates. Note too that the weakest examples are mothsthree and six.
FIGURE A2 | Replication of Figure 2 using data from a different moth to
highlight that FM modulation is odor dependent. (A) Each panelrepresents the averaged result of 20 individual TFR analyses that werecalculated, normalized and presented as described in Figure 1. Note thatalcohols and ketones of common length are aligned into columns. (B) Resultsof the discriminant analysis for the data shown in (A). Blue Bars represent
classification performance for the linear kernel function, whereas green barsrepresent performance of the third order polynomial kernel function. Inset redline represents the 95% confidence interval. Note that the linear kernelfunction classified responses of two of the nine odorants significantly abovechance, whereas the polynomial function accurately classified all odorresponses with 100% accuracy.
Frontiers in Neuroengineering www.frontiersin.org October 2011 | Volume 4 | Article 12 | 21

Daly et al. Local field potentials and spike timing
FIGURE A3 | Expanded view of the mean cross correlations for
spontaneous versus odor-driven periods. Results based on all possiblepair wise comparisons between the four LFP recording sites (six in total).Odor-driven cross-correlation based on 1 s samples, starting at odor onset,for each of 180 odor stimuli per moth (N = 7 moths). Spontaneous crosscorrelation based on 180 1 s samples taken immediately prior to odor onsetfor each odor stimulus. Note that cross correlations were calculated foreach stimulus and results were averaged across seven moths. Shadedregions around the mean represent ±1 SD. Inset broken lines just abovethe X -axis indicate where in time the cross correlation was significantlydifferent from 0. Significance threshold for these tests was set to 2.3 × 10⁻⁶
to maintain an overall alpha of 0.01. Each color coded line corresponds toregions in time where the correlation was significantly different from zerofor spontaneous (mauve) and odor-driven (green) cross correlations.
Frontiers in Neuroengineering www.frontiersin.org October 2011 | Volume 4 | Article 12 | 22