Desolvation Barrier Effects Are a Likely Contributor to the Remarkable Diversity in the Folding...
18
Desolvation Barrier Effects Are a Likely Contributor to the Remarkable Diversity in the Folding Rates of Small Proteins Allison Ferguson, Zhirong Liu and Hue Sun Chan⁎ Department of Biochemistry, University of Toronto, Toronto, Ontario, Canada M5S 1A8 Department of Molecular Genetics, University of Toronto, Toronto, Ontario, Canada M5S 1A8 Department of Physics, University of Toronto, Toronto, Ontario, Canada M5S 1A7 Received 3 March 2009; received in revised form 1 April 2009; accepted 6 April 2009 Available online 9 April 2009 The variation in folding rate among single-domain natural proteins is tremendous, but common models with explicit representations of the protein chain are either demonstrably insufficient or unclear as to their capability for rationalizing the experimental diversity in folding rates. In view of the critical role of water exclusion in cooperative folding, we apply native-centric, coarse-grained chain modeling with elementary desolvation barriers to investigate solvation effects on folding rates. For a set of 13 proteins, folding rates simulated with desolvation barriers cover ∼ 4.6 orders of magnitude, spanning a range essentially identical to that observed experimentally. In contrast, folding rates simulated without desolvation barriers cover only ∼ 2.2 orders of magnitude. Following a Hammond-like trend, the folding transition-state ensemble (TSE) of a protein model with desolvation barriers generally has a higher average number of native contacts and is structurally more specific, that is, less diffused, than the TSE of the corresponding model without desolvation barriers. Folding is generally significantly slower in models with desolvation barriers because of their higher overall macroscopic folding barriers as well as slower conformational diffusion speeds in the TSE that are ≈ 1/50 times those in models without desolvation barriers. Nonetheless, the average root-mean- square deviation between the TSE and the native conformation is often similar in the two modeling approaches, a finding suggestive of a more robust structural requirement for the folding rate-limiting step. The increased folding rate diversity in models with desolvation barriers originates from the tendency of these microscopic barriers to cause more heightening of the overall macroscopic folding free-energy barriers for proteins with more nonlocal native contacts than those with fewer such contacts. Thus, the enhancement of folding cooperativity by solvation effects is seen as positively correlated with a protein's native topological complexity. © 2009 Elsevier Ltd. All rights reserved. Edited by C. R. Matthews Keywords: contact order; Gō model; transition state; Kramers' theory; conformational diffusion Introduction Theoretical studies of protein folding kinetics afford a conceptual framework for deciphering from experi- mental data the physicochemical interactions under- lying protein behaviors. 1–11 Much progress has been attained recently by investigating small, single- domain natural globular proteins whose folding/ unfolding thermodynamics and kinetics are two- state-like. For these proteins, although folding speed has not been extensively optimized by evolution, 12,13 no appreciable accumulation of folding or unfolding *Corresponding author. E-mail address: [email protected]. Present address: Z. Liu, College of Chemistry and Molecular Engineering, Peking University, Beijing 100871, China. Abbreviations used: TSE, transition-state ensemble; RCO, relative contact order; db, desolvation barrier; PMF, potential of mean force; LRO, long-range order; cm, contact minimum; ssm, solvent-separated minimum; CI2, chymotrypsin inhibitor 2. doi:10.1016/j.jmb.2009.04.011 J. Mol. Biol. (2009) 389, 619–636 Available online at www.sciencedirect.com 0022-2836/$ - see front matter © 2009 Elsevier Ltd. All rights reserved.
-
Upload
allison-ferguson -
Category
Documents
-
view
212 -
download
0
Transcript of Desolvation Barrier Effects Are a Likely Contributor to the Remarkable Diversity in the Folding...

doi:10.1016/j.jmb.2009.04.011 J. Mol. Biol. (2009) 389, 619–636
Available online at www.sciencedirect.com
Desolvation Barrier Effects Are a Likely Contributorto the Remarkable Diversity in the Folding Rates ofSmall Proteins
Allison Ferguson, Zhirong Liu and Hue Sun Chan⁎
Department of Biochemistry,University of Toronto, Toronto,Ontario, Canada M5S 1A8
Department of MolecularGenetics, University of Toronto,Toronto, Ontario, Canada M5S1A8
Department of Physics,University of Toronto, Toronto,Ontario, Canada M5S 1A7
Received 3 March 2009;received in revised form1 April 2009;accepted 6 April 2009Available online9 April 2009
*Corresponding author. E-mail [email protected] address: Z. Liu, College o
Molecular Engineering, Peking UnivChina.Abbreviations used: TSE, transitio
RCO, relative contact order; db, desopotential of mean force; LRO, long-rcontact minimum; ssm, solvent-sepachymotrypsin inhibitor 2.
0022-2836/$ - see front matter © 2009 E
The variation in folding rate among single-domain natural proteins istremendous, but common models with explicit representations of theprotein chain are either demonstrably insufficient or unclear as to theircapability for rationalizing the experimental diversity in folding rates. Inview of the critical role of water exclusion in cooperative folding, we applynative-centric, coarse-grained chain modeling with elementary desolvationbarriers to investigate solvation effects on folding rates. For a set of 13proteins, folding rates simulated with desolvation barriers cover ∼4.6orders of magnitude, spanning a range essentially identical to that observedexperimentally. In contrast, folding rates simulated without desolvationbarriers cover only ∼2.2 orders of magnitude. Following a Hammond-liketrend, the folding transition-state ensemble (TSE) of a protein model withdesolvation barriers generally has a higher average number of nativecontacts and is structurally more specific, that is, less diffused, than the TSEof the corresponding model without desolvation barriers. Folding isgenerally significantly slower in models with desolvation barriers becauseof their higher overall macroscopic folding barriers as well as slowerconformational diffusion speeds in the TSE that are ≈1/50 times those inmodels without desolvation barriers. Nonetheless, the average root-mean-square deviation between the TSE and the native conformation is oftensimilar in the two modeling approaches, a finding suggestive of a morerobust structural requirement for the folding rate-limiting step. Theincreased folding rate diversity in models with desolvation barriersoriginates from the tendency of these microscopic barriers to cause moreheightening of the overall macroscopic folding free-energy barriers forproteins with more nonlocal native contacts than those with fewer suchcontacts. Thus, the enhancement of folding cooperativity by solvationeffects is seen as positively correlated with a protein's native topologicalcomplexity.
© 2009 Elsevier Ltd. All rights reserved.
Keywords: contact order; Gō model; transition state; Kramers' theory;conformational diffusion
Edited by C. R. Matthewsess:
f Chemistry andersity, Beijing 100871,
n-state ensemble;lvation barrier; PMF,ange order; cm,rated minimum; CI2,
lsevier Ltd. All rights reserve
Introduction
Theoretical studies of protein folding kinetics afforda conceptual framework for deciphering from experi-mental data the physicochemical interactions under-lying protein behaviors.1–11 Much progress has beenattained recently by investigating small, single-domain natural globular proteins whose folding/unfolding thermodynamics and kinetics are two-state-like. For these proteins, although folding speedhas not been extensively optimized by evolution,12,13
no appreciable accumulation of folding or unfolding
d.

620 Desolvation and Topology-Dependent Folding
intermediates has been observed.14–16 This hallmarkfeature is in contrast with the more complex, multi-phasic folding kinetics of somewhat larger proteins,which were often subjects of earlier experiments.17–20
Two-state-like folding is also clearly set apart from thenoncooperative thermodynamics and kinetics exhib-ited by those proteins recently found to be likelyglobal downhill folders.21,22 With the folding data foran increasing number of such single-domain proteinsbecoming available since the early 1990s14 (reviewedin Refs. 23–25), the very simplicity of their foldingprocesses has led researchers to taking a panoramicview of biophysically important trends across manytwo-state-like folders. In a seminal discovery byPlaxco et al., a significant correlation was found toexist between logarithmic folding rates of two-statefolders and the values of a simple parameter termedrelative contact order (RCO) derived from theresidue–residue contacts in a given protein's nativestructure; the pattern of these contacts is commonlyreferred to as native topology.26 (For a perspective onthis usage of the term “topology” vis-à-vis that inother biomolecular contexts, see Section 1.1 of Ref. 27.)It was recognized immediately that this simple
empirical rate–topology correlation should offerimportant clues to the energetics of protein folding.The correlation actually represented a fundamentalconceptual challenge because several protein chainmodels embodying common notions of proteinenergetics at the time failed to reproduce a similartrend.28 One apparent exception was a two-dimen-sional square-lattice-model study conducted 20years earlier by Taketomi and Gō.29 These earlyresearchers concluded that local interactions speedup folding kinetics, whereas nonlocal interactionslead to more cooperative folding transitions. How-ever, although this earlier finding was consistentwith the discovery of Plaxco et al., it did not directlyaddress the multiple-protein rate–topology correla-tion because only a single 49mer native structurewas considered in Ref. 29.Ising-like constructs offered the first rationaliza-
tions for the rate–topology correlation.30,31 Theirsuccess provided critical physical insights regardingthe different contributions of local and nonlocalinteractions to the free-energy barrier to folding.Nonetheless, these constructs are not self-containedheteropolymer models because they lack an explicitrepresentation of the protein chain.32 As such, therelationship between Ising-like constructs and expli-cit-chain models—which clearly bear a more directresemblance to real proteins—remains to be betterelucidated.33 The rate–topology correlation was sub-sequently addressed using explicit-chain, continuumGō-like modeling34–36 by Koga and Takada, whosimulated folding rates of 18 natural proteins.37Consistent with experiment,26 a positive correlationbetween simulated rates and RCO was found, albeitwith a weaker correlation coefficient. These resultsshowed that the empirical rate–topology correlationcan be captured, at least to a degree, by native-centricmodels. The results also revealed, however, a funda-mental limitation of the common Gō-like potential
because it fell short in accounting for the diversity offolding rates among natural two-state-like folders. Asnoted by the authors, the simulated folding ratesspanned ≈1.5 orders of magnitude, which is muchnarrower than the 6 orders of magnitude spanned bythe corresponding experimental folding rates.37
It was soon realized38,39 that a likely origin for thisshortcoming is that continuum Gō-like models withpairwise-additive Lennard–Jones-like potentials aswell as common lattice Gōmodels fold less coopera-tively than real two-state-like proteins.40,41 Latticemodeling efforts inspired by this realization showedmore diverse folding rates when cooperativity wasenhanced by nonadditive many-body energyterms.38,39 These studies further suggested that theremarkable diversity of experimental folding ratesamong two-state-like proteins is probably under-pinned by specific, rather than generic, forms ofmany-body interactions, for there are substantialvariations in folding rate diversity when differentmany-body interaction schemes were applied. Forexample, under a physically plausible nonadditivescheme that coupled local conformational propen-sity with nonlocal contact interactions, folding ratesamong a set of 27mer three-dimensional cubic latticemodel proteins spanned≈2.6 orders ofmagnitude.39
(See Ref. 42 for a recent analytical model based on asimilar local–nonlocal coupling mechanism.39,43) Incontrast, under a different nonadditive scheme,38 thecorresponding computed folding rates spanned only≈1.8 orders of magnitude.8 A subsequent applica-tion of the idea about many-body effect to con-tinuum explicit-chain models showed that adding athree-body term to the common pairwise-additiveGō potential could increase model folding ratediversity among 18 proteins from ≈2.0 to ≈3.0orders of magnitude, even though the improvementwas insufficient to match the ≈4.5–6.0 orders ofmagnitude spanned by the corresponding experi-mental rates.44 Analytical modeling has explored theboosting effect of many-body terms on foldingcooperativity,45 and a recent nonexplicit-chain var-iational model study also indicated that folding ratediversity was enhanced by many-body effects.46Together, these findings have convincingly
demonstrated that folding cooperativity is a crucialingredient in the physical accounting of the empiri-cal rate–topology correlation. A case in point is anearlier lattice-model study that has insightfully con-cluded that folding cooperativity increases withnonlocality of native contacts.47 However, becausethe models in that study were insufficiently coop-erative (see Ref. 48 and Section 16.4.4, pp. 422–427,of Ref. 49 for an assessment of the 20-letter interac-tion scheme used in Ref. 47), severe chevron roll-overs50,51 led to the simulation results that “underconditions at which each native conformation wasstable, the structure with mostly nonlocal contactsfolded 2 orders of magnitude faster than the onewith mostly local contacts”.47 This prediction wasopposite to the experimental rate–topology trend.26In contrast, more cooperative native-centric modelshave milder chevron rollovers, and thus a positive
621Desolvation and Topology-Dependent Folding
correlation between simulated folding rate and RCOcan be maintained even under strongly foldingconditions.52
What are the physical origins of a high degree offolding cooperativity? Biophysical properties ofproteins are governed by water-mediated interac-tions; and one key physical contributor to foldingcooperativity is the energetic effects of waterexpulsion (desolvation).53 Recent simulations ofcoarse-grained protein chain models with a phy-sics-based desolvation/solvation barrier (referred tosimply as “desolvation barrier,” or “db” below) intheir native-centric potential41,52,54–58 showed thatmicroscopic db's could significantly enhance fold-ing/unfolding cooperativity.54,57,59 In this respect,db's afford protein chain models with more realisticthermodynamics and kinetics than those stipulatedby common Gō-like models with no db's. In view ofthe positive impact of desolvation effects on foldingcooperativity and the above-discussed relationshipbetween folding cooperativity and rate–topologycorrelation, we deemed it worthwhile to investigatethe extent to which desolvation effects may accountfor the remarkable diversity in folding rates amongtwo-state-like proteins.60
Our group has underlined the role of conforma-tional entropy in the rate–topology correlation usingcommon continuum Gō-like models with no db's.27Building upon that advance and motivated by theprospect of gaining a deeper understanding aboutthe role of solvation/desolvation in protein folding,in the present work we used db models, which havemore realistic folding cooperativity, to address twomain questions: (1) How are the folding rates ofmodels of small, single-domain proteins impactedby the introduction of db's, and do they exhibit astronger correspondence with experimental rates?(2) What is the physical basis behind the changes inthe overall free-energy barrier to folding and in thespeed of conformational sampling that lead to thisalteration in the rates?
Theory
The present investigation adopts the coarse-grained native-centric approach in our previousstudies.41,57–59 This modeling approach is appro-priate for our purpose. Although nonnative interac-tions occur in the folding of some proteins,61–65 theireffects are not dominant in two-state-like foldersand can be treated as a perturbation on a native-centric background.66 Hence, our native-centricapproach may be seen as a zeroth approximationin a more general modeling framework.66–68 As inour previous efforts, for computational tractability,we use an implicit-water effective db potential54,59in place of explicit-water simulations.69,70 Theeffective db potential embodies the collective effectsof many water molecules, and thus, in this sense,represents a “many-body” contribution. However, itshould be recognized that our pairwise-additiveform of the effective db potential involves an
approximation because it neglects the nonadditivityof the water-mediated effective interactions them-selves8,71–73 (see below). Despite these limitations,results from recent coarse-grained native-centric dbmodeling have provided useful physical insightsinto molecular recognition74 and mechanical stabi-lity of proteins in pulling experiments.75 Moreover,our simulations showed that db's could significantlyreduce native-state conformational fluctuations,52,59a notable feature consistent with the experimentalview that db's are amain factor in the kinetic stabilityof proteins.76,77 As already noted above, db'senhance kinetic cooperativity; that is, they entail amore extended linear chevron regime.52,57,59 For theissue at hand regarding folding rate diversity, thischevron property, by itself, means that db's tend toincrease the diversity of folding rate of a givenproteins under different folding conditions. Giventhis trend, it is not unreasonable to expect that db'swould also increase the diversity of folding ratesacross different native structures. This is indeed thecase, as will be detailed below.Here we use a native-centric potential with an
implicit-water desolvation barrier54 that our grouphas applied in previous investigations.41,57 Follow-ing the notation in the detailed formulation in Ref.59, the potential is given by
U r; rcm; e; edb; essmð Þ
=
eZ rð Þ Z rð Þ � 2½ � for rbrcm
CY rð Þn Y rð Þn=2� rdb � rcmð Þ2nh i
=2n + edb for rcmVrbrdb
�B Y rð Þ � h1½ �= Y rð Þm + h2½ � for rbrdb
ð1Þ
8>><>>:
where rcm is the contact-minimum (cm) separation, ɛis the magnitude of energy at cm, ɛdb is the dbheight, ɛssm is the depth of the energy well at thesolvent-separated minimum (ssm), as illustrated inFig. 1a; and
Z rð Þ = rcm=rð ÞkY rð Þ = r=rdbð Þ2
C = 4n e + edbð Þ= rdb � rcmð Þ4nB =messm rssm � rdbð Þ2 m�1ð Þ
h1 = 1� 1=mð Þ rssm � rdbð Þ2= essm=edb + 1ð Þh2 = m� 1ð Þ rssm � rdbð Þ2m= 1 + edb=essmð Þ
ð2Þ
In the above Eq. (2), rssm= rcm+3 Å, whichfollowed from the consideration that 3 Å isapproximately equal to the diameter of a watermolecule, and rdb=(rssm+ rcm)/2, as in the originalwork of Cheung et al.54 We use k=6, m=3, and n=2as before.41,57,58The form of this potential was motivated by the
general behavior of two nonpolar solutes in water.In order for the solutes to be in contact, watermolecules must be pushed out of the space betweenthem (Fig. 1a). The finite size of the water moleculesthus leads to an energetic cost, manifested as abarrier in the effective pair potential between thesolutes, that is, the potential of mean force (PMF)with the water degrees of freedom averaged.79Evidently, a similar effect is likely to have a signi-
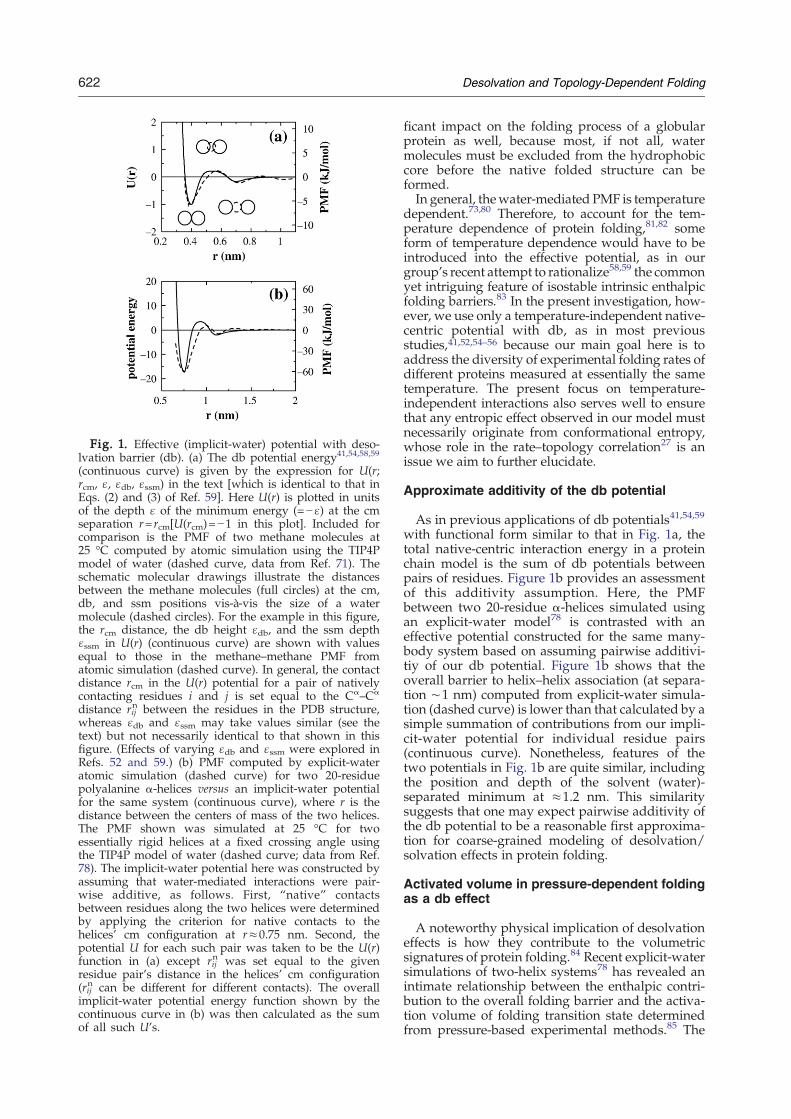
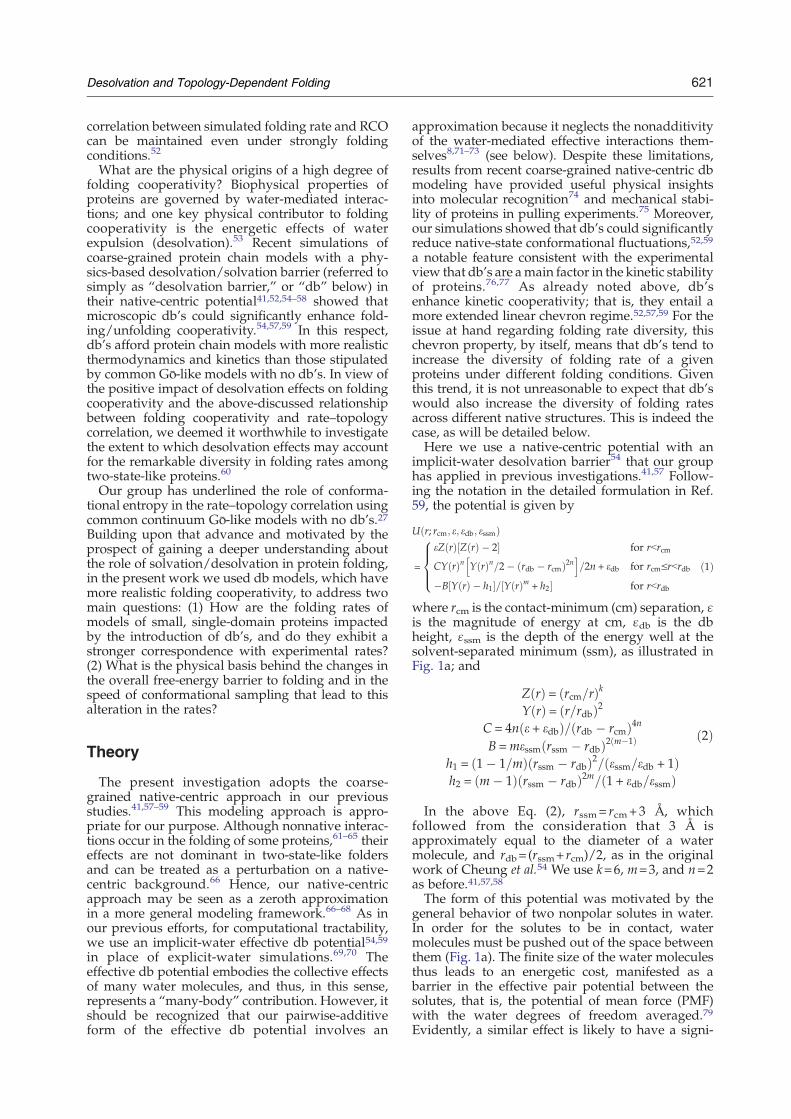
Fig. 1. Effective (implicit-water) potential with deso-lvation barrier (db). (a) The db potential energy41,54,58,59
(continuous curve) is given by the expression for U(r;rcm, ɛ, ɛdb, ɛssm) in the text [which is identical to that inEqs. (2) and (3) of Ref. 59]. Here U(r) is plotted in unitsof the depth ɛ of the minimum energy (=−ɛ) at the cmseparation r= rcm[U(rcm)=−1 in this plot]. Included forcomparison is the PMF of two methane molecules at25 °C computed by atomic simulation using the TIP4Pmodel of water (dashed curve, data from Ref. 71). Theschematic molecular drawings illustrate the distancesbetween the methane molecules (full circles) at the cm,db, and ssm positions vis-à-vis the size of a watermolecule (dashed circles). For the example in this figure,the rcm distance, the db height ɛdb, and the ssm depthɛssm in U(r) (continuous curve) are shown with valuesequal to those in the methane–methane PMF fromatomic simulation (dashed curve). In general, the contactdistance rcm in the U(r) potential for a pair of nativelycontacting residues i and j is set equal to the Cα–Cα
distance rijn between the residues in the PDB structure,
whereas ɛdb and ɛssm may take values similar (see thetext) but not necessarily identical to that shown in thisfigure. (Effects of varying ɛdb and ɛssm were explored inRefs. 52 and 59.) (b) PMF computed by explicit-wateratomic simulation (dashed curve) for two 20-residuepolyalanine α-helices versus an implicit-water potentialfor the same system (continuous curve), where r is thedistance between the centers of mass of the two helices.The PMF shown was simulated at 25 °C for twoessentially rigid helices at a fixed crossing angle usingthe TIP4P model of water (dashed curve; data from Ref.78). The implicit-water potential here was constructed byassuming that water-mediated interactions were pair-wise additive, as follows. First, “native” contactsbetween residues along the two helices were determinedby applying the criterion for native contacts to thehelices' cm configuration at r≈0.75 nm. Second, thepotential U for each such pair was taken to be the U(r)function in (a) except rij
n was set equal to the givenresidue pair's distance in the helices' cm configuration(rij
n can be different for different contacts). The overallimplicit-water potential energy function shown by thecontinuous curve in (b) was then calculated as the sumof all such U's.
622 Desolvation and Topology-Dependent Folding
ficant impact on the folding process of a globularprotein as well, because most, if not all, watermolecules must be excluded from the hydrophobiccore before the native folded structure can beformed.In general, thewater-mediated PMF is temperature
dependent.73,80 Therefore, to account for the tem-perature dependence of protein folding,81,82 someform of temperature dependence would have to beintroduced into the effective potential, as in ourgroup's recent attempt to rationalize58,59 the commonyet intriguing feature of isostable intrinsic enthalpicfolding barriers.83 In the present investigation, how-ever, we use only a temperature-independent native-centric potential with db, as in most previousstudies,41,52,54–56 because our main goal here is toaddress the diversity of experimental folding rates ofdifferent proteins measured at essentially the sametemperature. The present focus on temperature-independent interactions also serves well to ensurethat any entropic effect observed in our model mustnecessarily originate from conformational entropy,whose role in the rate–topology correlation27 is anissue we aim to further elucidate.
Approximate additivity of the db potential
As in previous applications of db potentials41,54,59
with functional form similar to that in Fig. 1a, thetotal native-centric interaction energy in a proteinchain model is the sum of db potentials betweenpairs of residues. Figure 1b provides an assessmentof this additivity assumption. Here, the PMFbetween two 20-residue α-helices simulated usingan explicit-water model78 is contrasted with aneffective potential constructed for the same many-body system based on assuming pairwise additivi-tiy of our db potential. Figure 1b shows that theoverall barrier to helix–helix association (at separa-tion ∼1 nm) computed from explicit-water simula-tion (dashed curve) is lower than that calculated by asimple summation of contributions from our impli-cit-water potential for individual residue pairs(continuous curve). Nonetheless, features of thetwo potentials in Fig. 1b are quite similar, includingthe position and depth of the solvent (water)-separated minimum at ≈1.2 nm. This similaritysuggests that one may expect pairwise additivity ofthe db potential to be a reasonable first approxima-tion for coarse-grained modeling of desolvation/solvation effects in protein folding.
Activated volume in pressure-dependent foldingas a db effect
A noteworthy physical implication of desolvationeffects is how they contribute to the volumetricsignatures of protein folding.84 Recent explicit-watersimulations of two-helix systems78 has revealed anintimate relationship between the enthalpic contri-bution to the overall folding barrier and the activa-tion volume of folding transition state determinedfrom pressure-based experimental methods.85 The

623Desolvation and Topology-Dependent Folding
helix simulations in Ref. 78 highlighted the creationof a void volume when the two helices (as a modelfor two parts of a folding protein) were separated bya distance too small to accommodate water mole-cules in between them (a process termed “stericdewetting”). Thus, formation of the helix dimerentails surmounting an “activation volume” (peak ofvolume increase as the two helices approach eachother from large separation) of ≈55 mL/mol and≈150 mL/mol, respectively, for a pair of 20-residuepolyalanine and polyleucine helices (Fig. 3 of Ref.78). Interestingly, pressure-based experiment byMitra et al. showed that the folding activationvolume of wild-type staphylococcal nuclease is≈56 mL/mol (Table 1 of Supporting Informationfor Ref. 85), suggesting that the extent of dehydrationat the folding rate-limiting step of this proteinmay besimilar to that typified by the dimerization of tworigid 20-residue polyalanine helices. This compar-ison between activation volume data from pressureexperiments and from explicit-water simulation of
Fig. 2. Ribbon diagrams of the PDB structures of the set of 1each structure by its PDB id). The same set was used in a previoRasMol.
many-body hydrophobic interactions providedfurther support to the hypothesis that the rate-limiting step of folding for some proteins likelyinvolves large-scale, near-simultaneous hydropho-bic burial. If so, the height of the enthalpic foldingbarrier as well as the size of activation volume maybe closely related to the degree of folding coopera-tivity of a given protein.58,78 How these many-body,nonadditive effects might be captured and eluci-dated by coarse-grained modeling is beyond thescope of the present work but is a question thatwould be extremely interesting to explore in thefuture.
db's lead to a higher overall folding free-energybarrier
As in most of our previous studies,41,59 we adoptɛdb=0.1ɛ and ɛssm=0.2ɛ for the native-centric dbpotential (Fig. 1a). We focus on the 13 proteins in theprevious study byWallin and Chan27 (Fig. 2). The set
3 proteins used in the present investigation (labeled belowus study byWallin and Chan.27 Drawings were created by
624 Desolvation and Topology-Dependent Folding
of native contacts used for modeling a protein isobtained by applying the same 4.5 Å side chain–sidechain separation criterion as that in Refs. 27, 58, and59 on the given protein's Protein Data Bank (PDB)structure. Folding kinetics and equilibrium samplingare conducted by Langevin dynamics.86 As before,bias potentials are introduced to facilitate sam-pling52,87–89 when necessary. The parameters forLangevin dynamics simulations are identical tothose in our previous works. In particular, the simu-lation time step δt=0.02 and the friction coefficientγ=0.0125, as in Refs. 27 and 59. During Langevindynamics simulation, a pair of residues belonging tothe native contact set is considered to be in contact—and thus contributing to the fractional native contactnumber Q—if the distance between their Cα posi-tions is not larger than that at the db peak of their
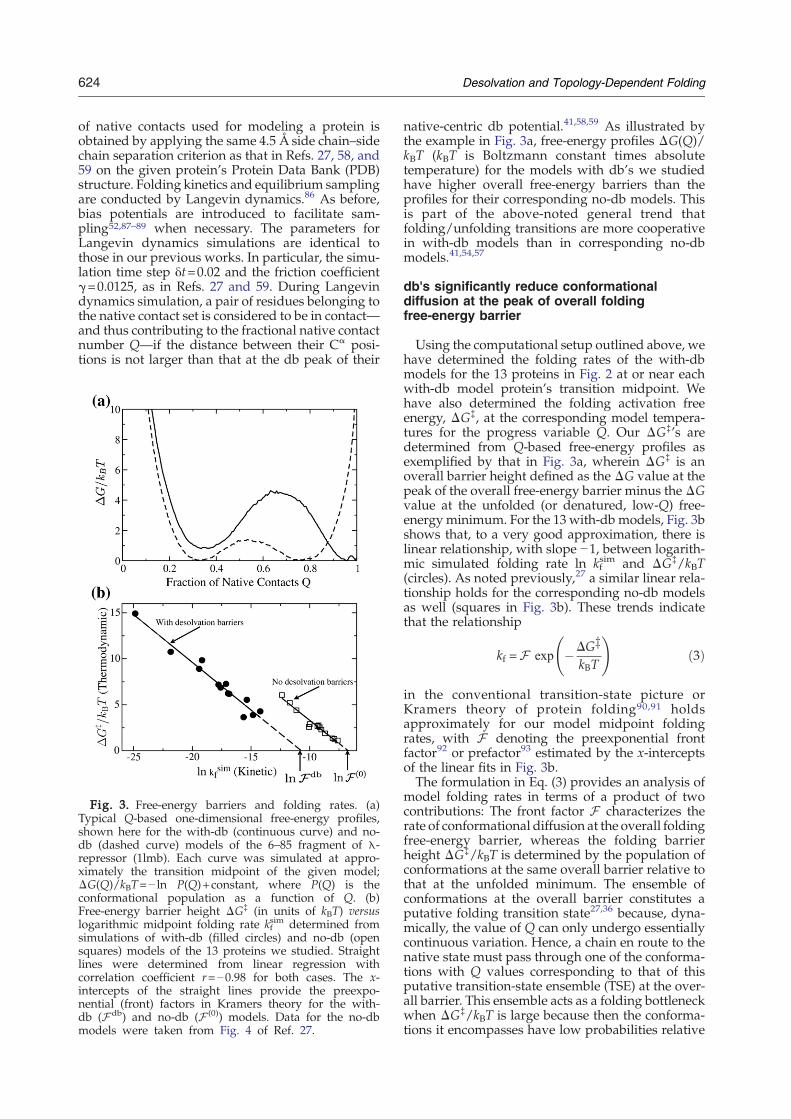
Fig. 3. Free-energy barriers and folding rates. (a)Typical Q-based one-dimensional free-energy profiles,shown here for the with-db (continuous curve) and no-db (dashed curve) models of the 6–85 fragment of λ-repressor (1lmb). Each curve was simulated at appro-ximately the transition midpoint of the given model;ΔG(Q)/kBT=− ln P(Q)+constant, where P(Q) is theconformational population as a function of Q. (b)Free-energy barrier height ΔG‡ (in units of kBT) versuslogarithmic midpoint folding rate kf
sim determined fromsimulations of with-db (filled circles) and no-db (opensquares) models of the 13 proteins we studied. Straightlines were determined from linear regression withcorrelation coefficient r=−0.98 for both cases. The x-intercepts of the straight lines provide the preexpo-nential (front) factors in Kramers theory for the with-db (Fdb) and no-db (F (0)) models. Data for the no-dbmodels were taken from Fig. 4 of Ref. 27.
native-centric db potential.41,58,59 As illustrated bythe example in Fig. 3a, free-energy profiles ΔG(Q)/kBT (kBT is Boltzmann constant times absolutetemperature) for the models with db's we studiedhave higher overall free-energy barriers than theprofiles for their corresponding no-db models. Thisis part of the above-noted general trend thatfolding/unfolding transitions are more cooperativein with-db models than in corresponding no-dbmodels.41,54,57
db's significantly reduce conformationaldiffusion at the peak of overall foldingfree-energy barrier
Using the computational setup outlined above, wehave determined the folding rates of the with-dbmodels for the 13 proteins in Fig. 2 at or near eachwith-db model protein's transition midpoint. Wehave also determined the folding activation freeenergy, ΔG‡, at the corresponding model tempera-tures for the progress variable Q. Our ΔG‡'s aredetermined from Q-based free-energy profiles asexemplified by that in Fig. 3a, wherein ΔG‡ is anoverall barrier height defined as the ΔG value at thepeak of the overall free-energy barrier minus the ΔGvalue at the unfolded (or denatured, low-Q) free-energyminimum. For the 13 with-db models, Fig. 3bshows that, to a very good approximation, there islinear relationship, with slope −1, between logarith-mic simulated folding rate ln kf
sim and ΔG‡/kBT(circles). As noted previously,27 a similar linear rela-tionship holds for the corresponding no-db modelsas well (squares in Fig. 3b). These trends indicatethat the relationship
kf =F exp �DGzkBT
!ð3Þ
in the conventional transition-state picture orKramers theory of protein folding90,91 holdsapproximately for our model midpoint foldingrates, with F denoting the preexponential frontfactor92 or prefactor93 estimated by the x-interceptsof the linear fits in Fig. 3b.The formulation in Eq. (3) provides an analysis of
model folding rates in terms of a product of twocontributions: The front factor F characterizes therate of conformational diffusion at the overall foldingfree-energy barrier, whereas the folding barrierheight ΔG‡/kBT is determined by the population ofconformations at the same overall barrier relative tothat at the unfolded minimum. The ensemble ofconformations at the overall barrier constitutes aputative folding transition state27,36 because, dyna-mically, the value of Q can only undergo essentiallycontinuous variation. Hence, a chain en route to thenative state must pass through one of the conforma-tions with Q values corresponding to that of thisputative transition-state ensemble (TSE) at the over-all barrier. This ensemble acts as a folding bottleneckwhen ΔG‡/kBT is large because then the conforma-tions it encompasses have low probabilities relative
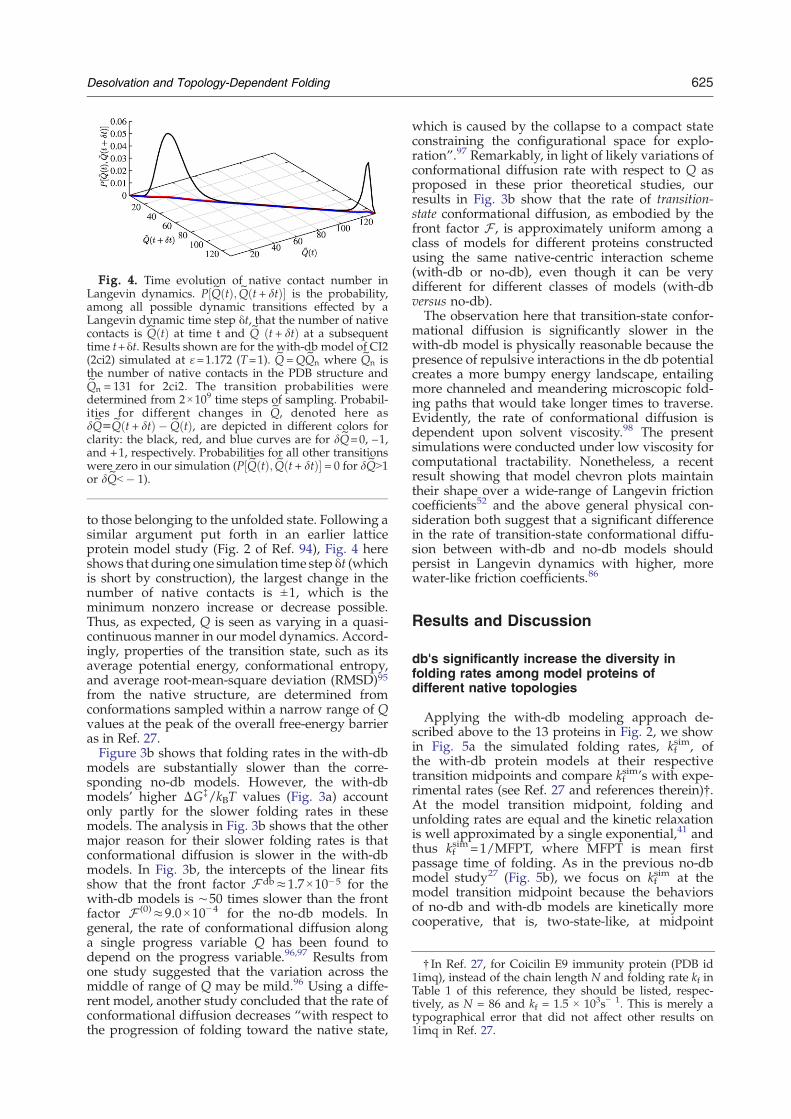
Fig. 4. Time evolution of native contact number inLangevin dynamics. P½Q~ tð Þ;Q~ðt + dtÞ� is the probability,among all possible dynamic transitions effected by aLangevin dynamic time step δt, that the number of nativecontacts is Q
~tð Þ at time t and Q
~t + dtð Þ at a subsequent
time t+δt. Results shown are for the with-db model of CI2(2ci2) simulated at ɛ=1.172 (T=1). Q
~n where Q
~n is
the number of native contacts in the PDB structure andQ~n = 131 for 2ci2. The transition probabilities were
determined from 2×10⁹ time steps of sampling. Probabil-ities for different changes in Q
~, denoted here as
dQ~uQ~
t + dtð Þ �Q~
tð Þ, are depicted in different colors forclarity: the black, red, and blue curves are for dQ
~=0, –1,
and +1, respectively. Probabilities for all other transitionswere zero in our simulation (P½Q~ tð Þ;Q~ t + dtð Þ� = 0 for dQ
~N1
or dQ~b� 1).
† In Ref. 27, for Coicilin E9 immunity protein (PDB id1imq), instead of the chain length N and folding rate kf inTable 1 of this reference, they should be listed, respec-tively, as N = 86 and kf = 1.5 × 10³s− 1. This is merely atypographical error that did not affect other results on1imq in Ref. 27.
625Desolvation and Topology-Dependent Folding
to those belonging to the unfolded state. Following asimilar argument put forth in an earlier latticeprotein model study (Fig. 2 of Ref. 94), Fig. 4 hereshows that during one simulation time step δt (whichis short by construction), the largest change in thenumber of native contacts is ±1, which is theminimum nonzero increase or decrease possible.Thus, as expected, Q is seen as varying in a quasi-continuous manner in our model dynamics. Accord-ingly, properties of the transition state, such as itsaverage potential energy, conformational entropy,and average root-mean-square deviation (RMSD)95from the native structure, are determined fromconformations sampled within a narrow range of Qvalues at the peak of the overall free-energy barrieras in Ref. 27.Figure 3b shows that folding rates in the with-db
models are substantially slower than the corre-sponding no-db models. However, the with-dbmodels' higher ΔG‡/kBT values (Fig. 3a) accountonly partly for the slower folding rates in thesemodels. The analysis in Fig. 3b shows that the othermajor reason for their slower folding rates is thatconformational diffusion is slower in the with-dbmodels. In Fig. 3b, the intercepts of the linear fitsshow that the front factor F db≈1.7×10⁻⁵ for thewith-db models is ∼50 times slower than the frontfactor F (0)≈9.0×10⁻⁴ for the no-db models. Ingeneral, the rate of conformational diffusion alonga single progress variable Q has been found todepend on the progress variable.96,97 Results fromone study suggested that the variation across themiddle of range of Q may be mild.96 Using a diffe-rent model, another study concluded that the rate ofconformational diffusion decreases “with respect tothe progression of folding toward the native state,
which is caused by the collapse to a compact stateconstraining the configurational space for explo-ration”.97 Remarkably, in light of likely variations ofconformational diffusion rate with respect to Q asproposed in these prior theoretical studies, ourresults in Fig. 3b show that the rate of transition-state conformational diffusion, as embodied by thefront factor F , is approximately uniform among aclass of models for different proteins constructedusing the same native-centric interaction scheme(with-db or no-db), even though it can be verydifferent for different classes of models (with-dbversus no-db).The observation here that transition-state confor-
mational diffusion is significantly slower in thewith-db model is physically reasonable because thepresence of repulsive interactions in the db potentialcreates a more bumpy energy landscape, entailingmore channeled and meandering microscopic fold-ing paths that would take longer times to traverse.Evidently, the rate of conformational diffusion isdependent upon solvent viscosity.98 The presentsimulations were conducted under low viscosity forcomputational tractability. Nonetheless, a recentresult showing that model chevron plots maintaintheir shape over a wide-range of Langevin frictioncoefficients52 and the above general physical con-sideration both suggest that a significant differencein the rate of transition-state conformational diffu-sion between with-db and no-db models shouldpersist in Langevin dynamics with higher, morewater-like friction coefficients.86
Results and Discussion
db's significantly increase the diversity infolding rates among model proteins ofdifferent native topologies
Applying the with-db modeling approach de-scribed above to the 13 proteins in Fig. 2, we showin Fig. 5a the simulated folding rates, kf
sim, ofthe with-db protein models at their respectivetransition midpoints and compare kf
sim's with expe-rimental rates (see Ref. 27 and references therein)†.At the model transition midpoint, folding andunfolding rates are equal and the kinetic relaxationis well approximated by a single exponential,41 andthus kf
sim=1/MFPT, where MFPT is mean firstpassage time of folding. As in the previous no-dbmodel study27 (Fig. 5b), we focus on kf
sim at themodel transition midpoint because the behaviorsof no-db and with-db models are kinetically morecooperative, that is, two-state-like, at midpoint
‡We note that the rescaling procedure proposed byChavez et al. in Eq. (C.4) in Supporting Information ofRef. 100 is unwarranted. The proposed procedureresulted in approximately 4 orders of magnitude increasein the range of their no-db model folding rates afterrescaling. However, even if the model native-centricenergy strength ɛ may be different for different proteinswhen measured in physical energy units, this considera-tion cannot affect model midpoint folding rate becausekfsim at midpoint temperature Tm is controlled by thedimensionless quantity ΔG‡/kBTm that, therefore, isinvariant with respect to change in unit for ɛ.
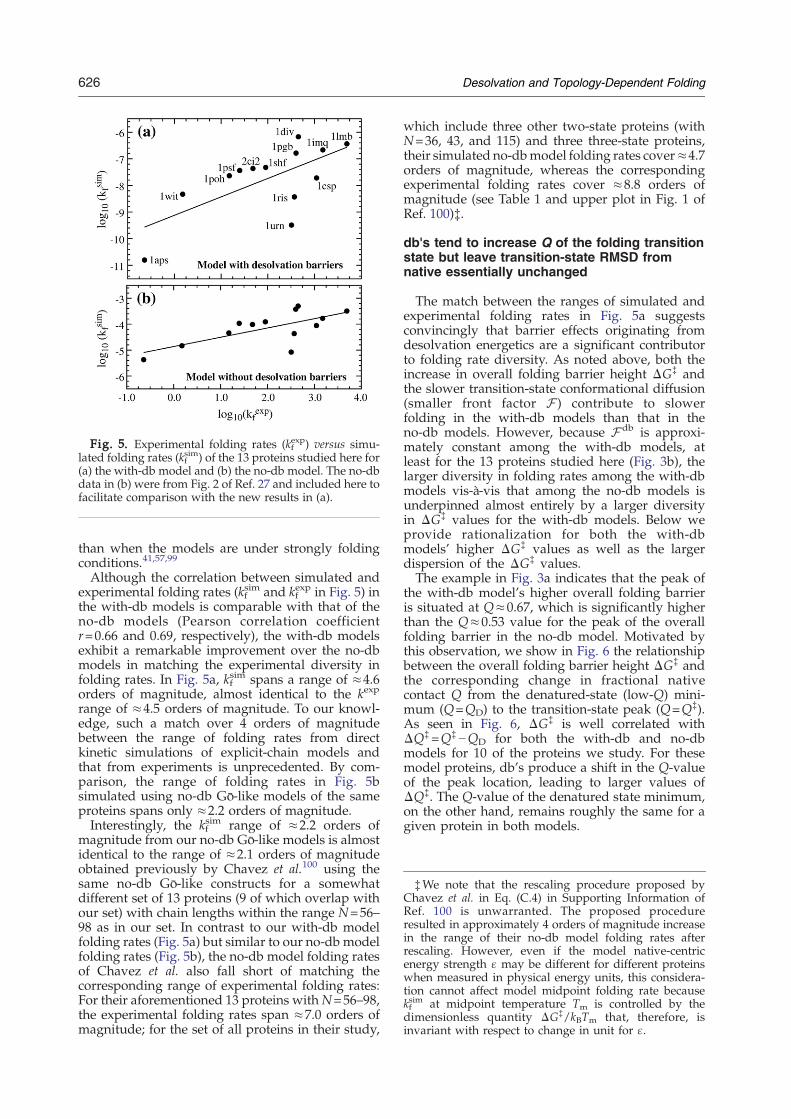
Fig. 5. Experimental folding rates (kfexp) versus simu-
lated folding rates (kfsim) of the 13 proteins studied here for
(a) the with-db model and (b) the no-db model. The no-dbdata in (b) were from Fig. 2 of Ref. 27 and included here tofacilitate comparison with the new results in (a).
626 Desolvation and Topology-Dependent Folding
than when the models are under strongly foldingconditions.41,57,99
Although the correlation between simulated andexperimental folding rates (kf
sim and kfexp in Fig. 5) in
the with-db models is comparable with that of theno-db models (Pearson correlation coefficientr=0.66 and 0.69, respectively), the with-db modelsexhibit a remarkable improvement over the no-dbmodels in matching the experimental diversity infolding rates. In Fig. 5a, kf
sim spans a range of ≈4.6orders of magnitude, almost identical to the kexp
range of ≈4.5 orders of magnitude. To our knowl-edge, such a match over 4 orders of magnitudebetween the range of folding rates from directkinetic simulations of explicit-chain models andthat from experiments is unprecedented. By com-parison, the range of folding rates in Fig. 5bsimulated using no-db Gō-like models of the sameproteins spans only ≈2.2 orders of magnitude.Interestingly, the kf
sim range of ≈2.2 orders ofmagnitude from our no-db Gō-like models is almostidentical to the range of ≈2.1 orders of magnitudeobtained previously by Chavez et al.100 using thesame no-db Gō-like constructs for a somewhatdifferent set of 13 proteins (9 of which overlap withour set) with chain lengths within the range N=56–98 as in our set. In contrast to our with-db modelfolding rates (Fig. 5a) but similar to our no-db modelfolding rates (Fig. 5b), the no-db model folding ratesof Chavez et al. also fall short of matching thecorresponding range of experimental folding rates:For their aforementioned 13 proteins withN=56–98,the experimental folding rates span ≈7.0 orders ofmagnitude; for the set of all proteins in their study,
which include three other two-state proteins (withN=36, 43, and 115) and three three-state proteins,their simulated no-dbmodel folding rates cover≈4.7orders of magnitude, whereas the correspondingexperimental folding rates cover ≈8.8 orders ofmagnitude (see Table 1 and upper plot in Fig. 1 ofRef. 100)‡.
db's tend to increase Q of the folding transitionstate but leave transition-state RMSD fromnative essentially unchanged
The match between the ranges of simulated andexperimental folding rates in Fig. 5a suggestsconvincingly that barrier effects originating fromdesolvation energetics are a significant contributorto folding rate diversity. As noted above, both theincrease in overall folding barrier height ΔG‡ andthe slower transition-state conformational diffusion(smaller front factor F ) contribute to slowerfolding in the with-db models than that in theno-db models. However, because F db is approxi-mately constant among the with-db models, atleast for the 13 proteins studied here (Fig. 3b), thelarger diversity in folding rates among the with-dbmodels vis-à-vis that among the no-db models isunderpinned almost entirely by a larger diversityin ΔG‡ values for the with-db models. Below weprovide rationalization for both the with-dbmodels' higher ΔG‡ values as well as the largerdispersion of the ΔG‡ values.The example in Fig. 3a indicates that the peak of
the with-db model's higher overall folding barrieris situated at Q≈0.67, which is significantly higherthan the Q≈0.53 value for the peak of the overallfolding barrier in the no-db model. Motivated bythis observation, we show in Fig. 6 the relationshipbetween the overall folding barrier height ΔG‡ andthe corresponding change in fractional nativecontact Q from the denatured-state (low-Q) mini-mum (Q=QD) to the transition-state peak (Q=Q‡).As seen in Fig. 6, ΔG‡ is well correlated withΔQ‡=Q‡−QD for both the with-db and no-dbmodels for 10 of the proteins we study. For thesemodel proteins, db's produce a shift in the Q-valueof the peak location, leading to larger values ofΔQ‡. The Q-value of the denatured state minimum,on the other hand, remains roughly the same for agiven protein in both models.

Fig. 7. RMSD from the native PDB conformation as afunction of fractional number of native contacts Q. Resultsare shown for the examples of (a) λ–repressor (1lmb) and(b) S6 (1ris). In each panel, filled circles (upper curve) arefor the with-db model, whereas open squares (lowercurve) are for the no-db model. Vertical lines in each of theplot mark the locations of the overall barrier peaks alongthe free-energy profiles for the with-db (continuous line)and no-db (dashed line) models.
Fig. 6. Activation free energy (ΔG‡, in units of kBT)versus “activation” Q value (ΔQ‡=Q‡ –QD). For both thewith-db (filled circles) and no-db (open squares) models,the correlation is significant for 10 of the proteins studied(3 outliers not plotted, see the text). The straight lines areleast-squares linear regression; correlation coefficientr=0.73 and 0.75, respectively, for the with- and no-dbmodels plotted.
627Desolvation and Topology-Dependent Folding
Thus, the larger ΔG‡ in the with-db models maybe viewed as resulting from a larger ΔQ‡. Thisfeature was noted previously for with-db models ofchymotrypsin inhibitor 2 (CI2) and barnase.59 Themore general result in Fig. 6 showing a substantialincrease in ΔQ‡ for the with-db models over that forthe no-db models is physically reasonable becausedb tends to decrease the stability of partially orderedconformations. As a result, folding does not proceeduntil a sufficiently high number of contacts haveformed; that is, larger portions of the protein areordered into native-like structure. Additionally, Fig.6 shows for both the with-db and no-db models thatan approximate linear relationship exists betweenΔG‡ and ΔQ‡. We consider this trend a Hammond-like behavior,101 because it shows that the extent ofstructural reorganization of the transition state fromthat of the reactant (denatured state in our case) isnegatively correlated with reaction (folding) speed,and therefore positively correlated with overallbarrier height (Fig. 3b), as in the Hammond hypo-thesis. The underlying principle of this trend issimilar to that enunciated by Hammond, althoughhis original study of chemical reactions consideredpotential energy as a function of reaction coordi-nate101 rather than the free-energy profile used inthe study of protein folding.It should be noted, however, that Hammond-like
behavior does not apply to all of our proteinfolding models. The behaviors of three outliers—models for twitchin (1wit), spliceosomal proteinU1A (1urn), and acylphosphatase (1aps)—suggestthat once the overall folding barrier ΔG‡ becomessufficiently high, its relationship with ΔQ‡ does notfollow the trend exhibited in Fig. 6 for models withcomparatively lower ΔG‡ values (outlier data notshown in Fig. 6). For with-db models of the outliers,ΔG‡/kBT=9.8, 10.8, and 14.9, and ΔQ‡=0.40, 0.51,
and 0.45, respectively, For their no-db counterparts,ΔG‡/kBT=4.7, 5.3, and 6.1, and ΔQ‡=0.31, 0.28,and 0.30, respectively. Nonetheless, these no-dbΔG‡ and ΔQ‡ values are lower than those for thecorresponding with-db models. In this respect, theyare similar to the results for the proteins shown inFig. 6.We next turn to the increased diversity in ΔG‡
values in the with-db model. What is causing someproteins to experience an increased shift in simu-lated ΔQ‡ value than others when modeling isswitched from the no-db to the with-db interactionscheme? To address the issue, we consider RMSDfrom the native structure as a function of Q (shownfor two proteins in Fig. 7). In all cases, includingthose for the remainder of the protein set not shownin Fig. 7, RMSD is a decreasing function of Q,wherein for Q values intermediate between thedenatured and native states (Q ∼0.2–0.8) the RMSDat a given Q is higher for the with-db than for theno-db model. Remarkably, the RMSD values at thebarrier peak locations of the two models (markedby vertical lines in Fig. 7) are essentially the same.This near-invariance of transition-state RMSD with

628 Desolvation and Topology-Dependent Folding
respect to the change from the no-db to with-dbinteraction scheme provides a perspective forunderstanding the corresponding shift in ΔG‡. Itappears that adding db's shifts the ΔG peak to ahigher Q‡ position because in the presence of theunfavorable interactions at the db's, a largernumber of native contacts are necessary to achievea given RMSD threshold required at the rate-limiting step of folding, and this shift in Q‡ leadsto a higher ΔG‡ following a Hammond-like trend.However, the magnitude of this Q‡ shift is sensitiveto native topology. Comparing the results for 1lmband 1ris in Fig. 7, for example, indicates that onaverage a protein with higher native topologicalcomplexity would require a larger Q‡ shift tomaintain an essentially model-independent RMSDthreshold.
Fig. 8. Comparing the transition states in the with-dbprobabilities (color coded as indicated) in the transition stasimulation conditions as in Fig. 4 above) and in the no-db motransition midpoint. Transition states are defined from Q-basedrawings illustrate conformational variations in the transition(c), the thick black traces represent the backbone of the narepresentative transition-state conformations optimally supeconstructed using the method in Ref. 10.
Folding routes with db's are more channeled
To gain further insight into db effects, we examinethe distribution of individual native contacts along themodel folding trajectories.At eachvalue ofQ, there areconformations with different sets of native contactsthat are consistent with the given total number ofnative contacts, such that Q =
PQ~nk = 1 P ckjQð Þ=Q~n,
where P(ck∣Q) is the probability of contact ck in theset of conformations each of which has a given Qvalue, the contact label k=1, 2, …, Q
~n, with Q
~n
denoting the total number of contacts in the native(PDB) structure. For an individual conformation, acontact ck can either be formed or not formed (withslight variation when a smooth criterion is usedinstead52). But in an ensemble, P(ck) typically takeson fractional value because it involves averaging over
and no-db model. (a) Contact maps showing contacttes of 2ci2 in the with-db model (upper triangle, samedel (lower triangle), simulated at each model's respectived free-energy profiles as discussed in the text. The bottomstates for the with-db (b) and no-db (c) models. In (b) andtive PDB 2ci2 structure, whereas thin red traces depictrimposed on the native structure. These drawings were
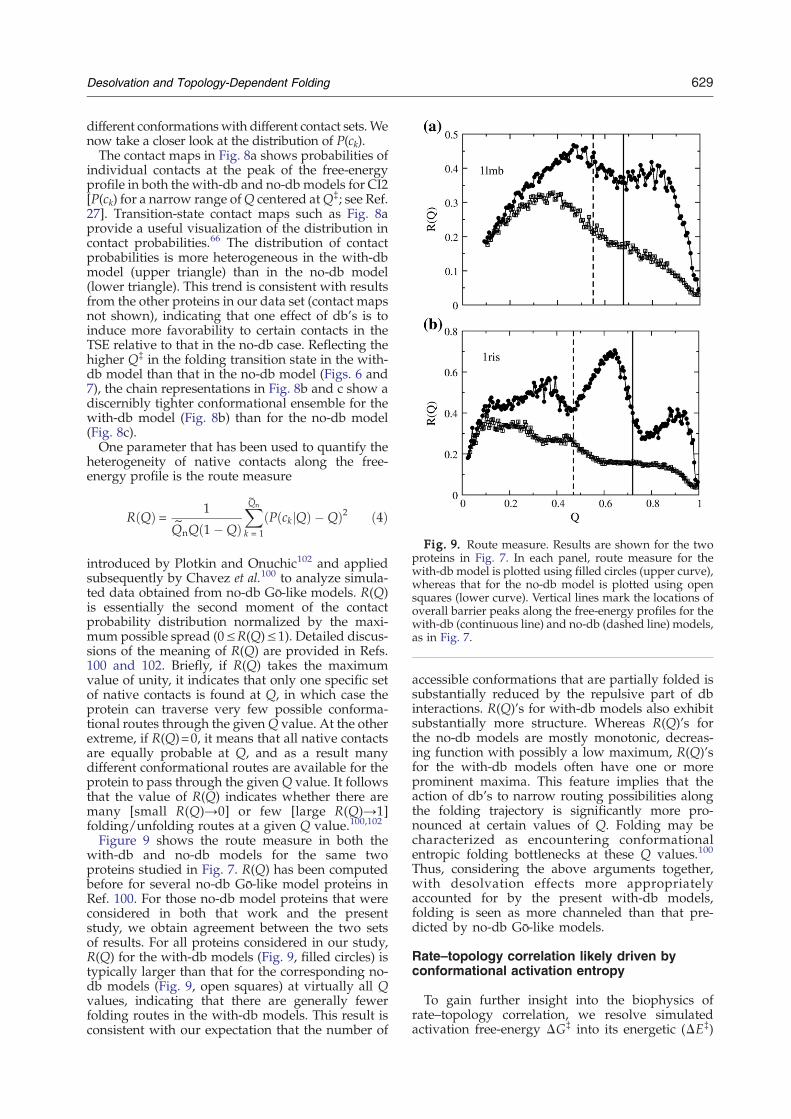
Fig. 9. Route measure. Results are shown for the twoproteins in Fig. 7. In each panel, route measure for thewith-db model is plotted using filled circles (upper curve),whereas that for the no-db model is plotted using opensquares (lower curve). Vertical lines mark the locations ofoverall barrier peaks along the free-energy profiles for thewith-db (continuous line) and no-db (dashed line) models,as in Fig. 7.
629Desolvation and Topology-Dependent Folding
different conformationswith different contact sets.Wenow take a closer look at the distribution of P(ck).The contact maps in Fig. 8a shows probabilities of
individual contacts at the peak of the free-energyprofile in both the with-db and no-db models for CI2[P(ck) for a narrow range ofQ centered atQ‡; see Ref.27]. Transition-state contact maps such as Fig. 8aprovide a useful visualization of the distribution incontact probabilities.66 The distribution of contactprobabilities is more heterogeneous in the with-dbmodel (upper triangle) than in the no-db model(lower triangle). This trend is consistent with resultsfrom the other proteins in our data set (contact mapsnot shown), indicating that one effect of db's is toinduce more favorability to certain contacts in theTSE relative to that in the no-db case. Reflecting thehigher Q‡ in the folding transition state in the with-db model than that in the no-db model (Figs. 6 and7), the chain representations in Fig. 8b and c show adiscernibly tighter conformational ensemble for thewith-db model (Fig. 8b) than for the no-db model(Fig. 8c).One parameter that has been used to quantify the
heterogeneity of native contacts along the free-energy profile is the route measure
R Qð Þ = 1
Q~nQ 1�Qð Þ
XQ~n
k = 1
P ckjQð Þ �Qð Þ2 ð4Þ
introduced by Plotkin and Onuchic102 and appliedsubsequently by Chavez et al.100 to analyze simula-ted data obtained from no-db Gō-like models. R(Q)is essentially the second moment of the contactprobability distribution normalized by the maxi-mum possible spread (0≤R(Q)≤1). Detailed discus-sions of the meaning of R(Q) are provided in Refs.100 and 102. Briefly, if R(Q) takes the maximumvalue of unity, it indicates that only one specific setof native contacts is found at Q, in which case theprotein can traverse very few possible conforma-tional routes through the givenQ value. At the otherextreme, if R(Q)=0, it means that all native contactsare equally probable at Q, and as a result manydifferent conformational routes are available for theprotein to pass through the given Q value. It followsthat the value of R(Q) indicates whether there aremany [small R(Q)→0] or few [large R(Q)→1]folding/unfolding routes at a given Q value.100,102
Figure 9 shows the route measure in both thewith-db and no-db models for the same twoproteins studied in Fig. 7. R(Q) has been computedbefore for several no-db Gō-like model proteins inRef. 100. For those no-db model proteins that wereconsidered in both that work and the presentstudy, we obtain agreement between the two setsof results. For all proteins considered in our study,R(Q) for the with-db models (Fig. 9, filled circles) istypically larger than that for the corresponding no-db models (Fig. 9, open squares) at virtually all Qvalues, indicating that there are generally fewerfolding routes in the with-db models. This result isconsistent with our expectation that the number of
accessible conformations that are partially folded issubstantially reduced by the repulsive part of dbinteractions. R(Q)'s for with-db models also exhibitsubstantially more structure. Whereas R(Q)'s forthe no-db models are mostly monotonic, decreas-ing function with possibly a low maximum, R(Q)'sfor the with-db models often have one or moreprominent maxima. This feature implies that theaction of db's to narrow routing possibilities alongthe folding trajectory is significantly more pro-nounced at certain values of Q. Folding may becharacterized as encountering conformationalentropic folding bottlenecks at these Q values.100
Thus, considering the above arguments together,with desolvation effects more appropriatelyaccounted for by the present with-db models,folding is seen as more channeled than that pre-dicted by no-db Gō-like models.
Rate–topology correlation likely driven byconformational activation entropy
To gain further insight into the biophysics ofrate–topology correlation, we resolve simulatedactivation free-energy ΔG‡ into its energetic (ΔE‡)
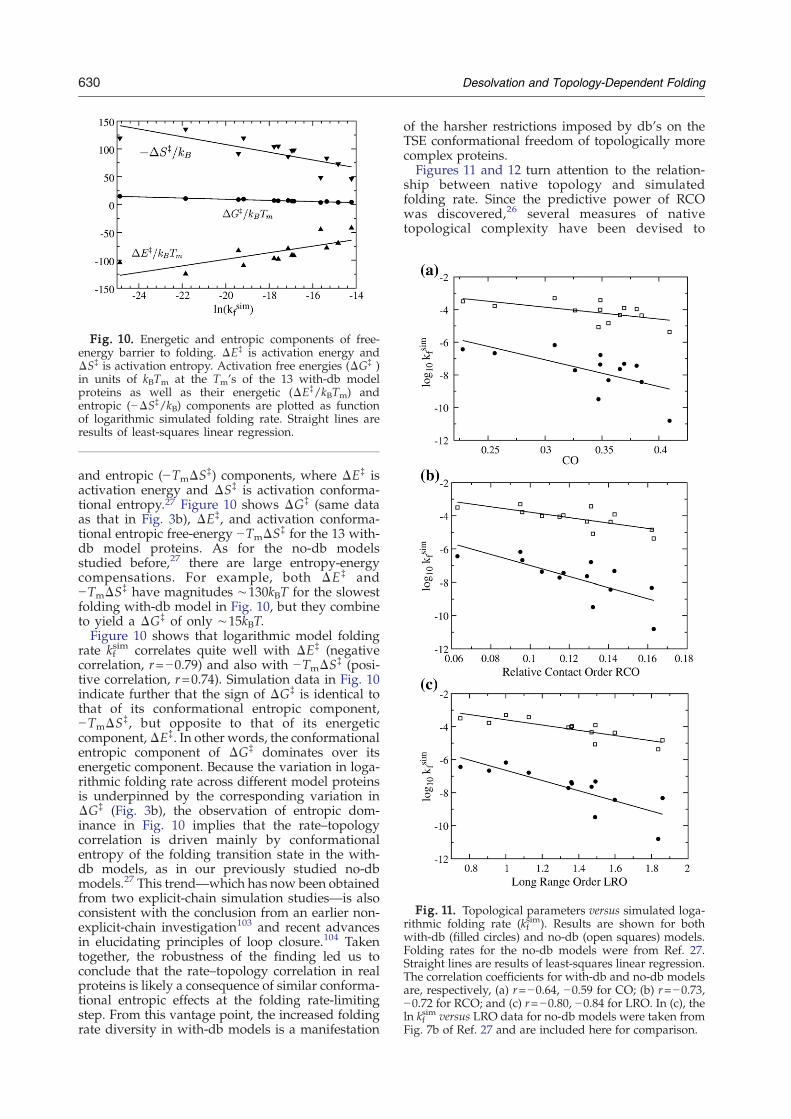
Fig. 10. Energetic and entropic components of free-energy barrier to folding. ΔE‡ is activation energy andΔS‡ is activation entropy. Activation free energies (ΔG‡ )in units of kBTm at the Tm's of the 13 with-db modelproteins as well as their energetic (ΔE‡/kBTm) andentropic (−ΔS‡/kB) components are plotted as functionof logarithmic simulated folding rate. Straight lines areresults of least-squares linear regression.
Fig. 11. Topological parameters versus simulated loga-rithmic folding rate (kf
sim). Results are shown for bothwith-db (filled circles) and no-db (open squares) models.Folding rates for the no-db models were from Ref. 27.Straight lines are results of least-squares linear regression.The correlation coefficients for with-db and no-db modelsare, respectively, (a) r=−0.64, −0.59 for CO; (b) r=−0.73,−0.72 for RCO; and (c) r=−0.80, −0.84 for LRO. In (c), theln kf
sim versus LRO data for no-db models were taken fromFig. 7b of Ref. 27 and are included here for comparison.
630 Desolvation and Topology-Dependent Folding
and entropic (−TmΔS‡) components, where ΔE‡ isactivation energy and ΔS‡ is activation conforma-tional entropy.27 Figure 10 shows ΔG‡ (same dataas that in Fig. 3b), ΔE‡, and activation conforma-tional entropic free-energy −TmΔS‡ for the 13 with-db model proteins. As for the no-db modelsstudied before,27 there are large entropy-energycompensations. For example, both ΔE‡ and−TmΔS‡ have magnitudes ∼130kBT for the slowestfolding with-db model in Fig. 10, but they combineto yield a ΔG‡ of only ∼15kBT.Figure 10 shows that logarithmic model folding
rate kfsim correlates quite well with ΔE‡ (negative
correlation, r=−0.79) and also with −TmΔS‡ (posi-tive correlation, r=0.74). Simulation data in Fig. 10indicate further that the sign of ΔG‡ is identical tothat of its conformational entropic component,−TmΔS‡, but opposite to that of its energeticcomponent,ΔE‡. In other words, the conformationalentropic component of ΔG‡ dominates over itsenergetic component. Because the variation in loga-rithmic folding rate across different model proteinsis underpinned by the corresponding variation inΔG‡ (Fig. 3b), the observation of entropic dom-inance in Fig. 10 implies that the rate–topologycorrelation is driven mainly by conformationalentropy of the folding transition state in the with-db models, as in our previously studied no-dbmodels.27 This trend—which has now been obtainedfrom two explicit-chain simulation studies—is alsoconsistent with the conclusion from an earlier non-explicit-chain investigation103 and recent advancesin elucidating principles of loop closure.104 Takentogether, the robustness of the finding led us toconclude that the rate–topology correlation in realproteins is likely a consequence of similar conforma-tional entropic effects at the folding rate-limitingstep. From this vantage point, the increased foldingrate diversity in with-db models is a manifestation
of the harsher restrictions imposed by db's on theTSE conformational freedom of topologically morecomplex proteins.Figures 11 and 12 turn attention to the relation-
ship between native topology and simulatedfolding rate. Since the predictive power of RCOwas discovered,26 several measures of nativetopological complexity have been devised to

Fig. 12. Transition-state topological parameters versusentropic component of activation free energy (see Fig. 10).Present results for the with-db models (filled circle) arecompared against previous results27 for the no-db models(open squares). Straight lines are results of least-squareslinear regression. The correlation coefficients for the with-db and no-db models are, respectively, (a) r=0.34, r=0.24for CO‡, and (b) r=0.70, r=0.53 for LRO‡. Data for the no-db models were taken from Figs. 8b and 9b of Ref. 27.
631Desolvation and Topology-Dependent Folding
rationalize protein folding rates.105–109 Here wefocus on RCO,26 long-range order (LRO),105 and ameasure we termed27 CO:
CO =1
NQ~n
Xibj�3
lij ð5Þ
where N is the chain length (number of residues) ofthe given protein, i and j are residue labels, lij= ∣j− i∣and the summation is over residue–residue contactsin the native structure. This measure was motivatedby, but differs somewhat from, the original defini-tion of RCO. CO was introduced for Cα chain modelstudies27 for its similarity with RCO. But unlikeRCO, once the native contact set is determined,calculation of CO does not require knowledge aboutside-chain positions (Fig. 11a). The RCO values inFig. 11b, however, are calculated by the originaldefinition:
RCO =1
NNa
Xatomic contacts
lij ð6Þ
where the summation is over contacts betweennonhydrogen atoms of contacting residues, and Nais the total number of such atomic contacts.26,107 Wealso provide in Fig. 11c the dependence of simulatedfolding rate on LRO:105
LRO =1N
Xibj�lc
nij ð7Þ
where nij=1 if residues i and j are in contact;otherwise, nij=0. Unlike CO and RCO, the terms forLRO are not weighted by the loop length lij, andLRO counts only long-range contacts satisfying asequence cutoff lc criterion. Here we use lc=12 as inRef. 27.Figure 11 shows for the 13 studied proteins that the
correlation between logarithmic kfsim and the topo-
logical complexity parameters are reasonably good.Introduction of db's leads to an improved correlationwith CO (−r increases from0.59 for the no-dbmodelsto 0.64 for thewith-dbmodel, Fig. 11a). But db's havelittle effect on the correlation of log kf
sim with RCOand LRO. As noted above, the lij terms in RCO areweighted by the number of side-chain atomiccontacts, whereas those in CO are not [Eqs. (5) and(6)]. Interestingly, even though kf
sim is computedusing a Cα chain model with a uniform strength forfavorable native-centric energies, the correlation oflog kf
sim with the RCO measure (r≈−0.73) issignificantly stronger than that with the CO mea-sure. Among the topological complexity parametersconsidered, the simulated logarithmic folding ratescorrelate most strongly with LRO (Fig. 11c). Ther≈−0.8 value for the correlation between log kf
sim
and LRO is comparable to that for the dependence ofexperimental log kf
exp on LRO,105 despite the weakercorrelation between log kf
sim and log kfexp for the set of
proteins we study (r=0.66, Fig. 5).Combining the results from Figs. 10 and 11, Fig. 12
explores the relationship between activation con-formational entropy ΔS‡ and the transition-statetopological complexity parameters CO‡ and LRO‡
of the with-db models, an analysis that has beenperformed for the corresponding no-db models.27
The activation quantities CO‡ and LRO‡ are the COand LRO values computed for the TSE instead of forthe native structure; that is, they are obtained byapplying Eqs. (5) and (7) but with the summationreplaced by one that sums over contacts in each ofthe TSE conformations and then averaged over theTSE. [Note that RCO‡ cannot be computed using aCα chain model because the side-chain informationrequired in Eq. (6) is lacking.]Figure 12a shows that there is not much correla-
tion between ΔS‡ and CO‡ among both the with-dband no-db models. This is not too surprisingbecause although log kf
sim correlates reasonablywell with ΔS‡ (Fig. 10), the correlation betweenlog kf
sim and native CO is weaker (Fig. 11a).Nonetheless, it is interesting to note that the rangeof CO‡ values spanned by the 13 model proteins is60–80% of the corresponding range of native COvalues. This trend appears to be consistent with

632 Desolvation and Topology-Dependent Folding
recent results based on ψ-value analyses and otherexperimental techniques, indicating that transitionstates of several small proteins achieve approxi-mately 60–80% (∼70%) of the RCO of theirrespective native structures.110,111 A somewhatlower ∼50% of native RCO, however, was foundin putative TSE's simulated using experimental ϕ-value as constraints112 (see also comment in Ref. 113on the method in Ref. 112).Figure 12b shows that activation conformational
entropy correlates much better with LRO, and thatdb significantly improves the correlation, viz., r forLRO‡ versus −ΔS‡/kB increases from 0.53 for the no-db models to 0.70 for the with-db models. Contrast-ing this behavior with that in Fig. 12a, our findingsuggests that the conformational entropic conse-quence of the topological complexity in the TSE maybe better characterized by the LRO measure than bythe RCO measure. It is clear from Fig. 12b that db'spromote nonlocal contacts in the TSE, with themaximum LRO‡ among the 13 proteins studiedshifting from ∼0.65 for the no-db models to ∼0.8 forthe with-db models. Results in Figs. 11c and 12bindicate that LRO‡ ∼0.4 (LRO). Experimental testingof this predicted scaling should provide usefultopological information about the TSE in additionto the insight gained from the CO‡ ∼0.7 (CO) rela-tion discussed above.
Concluding Remarks
In summary, we have shown that incorporatingphysics-inspired pairwise db's into native-centriccoarse-grained explicit-chain models of a set ofnatural proteins can lead to a remarkable diversityin folding rates almost identical to that observedexperimentally, a feat not achievable by commonGō-like models without db's. db's give rise to moreruggedness on the energy landscape. This rugged-ness enhances rather than diminishes foldingcooperativity because db's serve to eliminate manypartially folded conformations that are prone tokinetic trapping. In other words, energy landscapeswith db are rugged with barriers but not ruggedwith traps, a distinction that has been pointed out ina lattice modeling context.92 Consequently, wefound that folding with physical db's is morecooperative, slower, and more channeled than thatstipulated by no-db modeling.In our models, the slowing of folding rate by
db's as well as the concomitant enhancement offolding cooperativity is seen as mainly a transition-state conformational entropic effect. Broadlyspeaking, this effect is more prominent for proteinswith more complex native topologies. The correla-tion between simulated and experimental foldingrates is fair for the set of proteins studied.Although the match between the range of simu-lated and experimental folding rates improvesdramatically with the incorporation of db's, thedegree of correlation between simulated andexperimental folding rates are practically the
same, and are not very high, for our with-dband no-db models. This means that much needs tobe learned about the relationship between theenergetics of db models and that of real proteins,as well as the possible connections between ourwith-db models and many-body interactionschemes that have been invoked, with variousdegree of success, to rationalized rate–topologycorrelation.38,39,52
In this respect, it should be noted that thenative-centric db model has recently been appliedproductively to rationalize non-two-state proteinfolding.67 The modeling approach also appearscapable, at least for two members of the peripheralsubunit-binding domain family with availablePDB structures, to capture the rank order offolding cooperativity of homologous proteins.However, it may not always reproduce quantita-tively the full divergence in folding rates amonghomologues.52,114 Experiments have shown thateven a single mutation can significantly changefolding speed,13 and folding rates of proteins withthe same architecture, such as those for thespectrin domains, can differ by more than 3 ordersof magnitude.115 Several circular permutants'116
nonconformity to the usual rate–topology corre-lation117 also raised questions as to the generalityof any simple theoretical treatment based onnative topology. To what degree native-centricapproaches such as the present db model canrationalize these intriguing findings remains to beascertained.These potential limitations of the present model
notwithstanding, the fact that a simple addition ofdb's is sufficient to essentially reproduce the largerange of experimental folding rates in this studysuggests strongly that db effects are a main physicalorigin of the remarkable diversity in the foldingrates of natural proteins. A further tantalizingsuggestion from our results is that once a proteinsequence is designed to specifically favor a foldedconformation (as in our native-centric models) thathas an appropriate topology,52,67,118 most of foldingcooperativity and folding rate diversity mightsimply follow from the physics of desolvation.This is an attractive prospect that deserves furtherinvestigation.
Acknowledgements
We thank Artem Badasyan, Justin MacCallum,Cathy Royer, Peter Tieleman, and Stefan Wallin forhelpful discussions. A.F. is a postdoctoral trainee ofthe Canadian Institutes of Health Research (CIHR)Training Program in “Protein Folding: Principlesand Diseases” at the University of Toronto andthanks the Program for stipend support. We thankalso CIHR (grant MOP-84281 to H.S.C.) and theCanada Research Chairs Program for funding thisresearch.

633Desolvation and Topology-Dependent Folding
References1. Levitt, M. &Warshel, A. (1975). Computer simulation
of protein folding. Nature, 253, 694–698.2. Taketomi, H., Ueda, Y. & Gō, N. (1975). Studies on
protein folding, unfolding and fluctuations bycomputer simulation. 1. The effect of specific aminoacid sequence represented by specific inter-unitinteractions. Int. J. Pept. Protein Res. 7, 445–459.
3. Bryngelson, J. D., Onuchic, J. N., Socci, N. D. &Wolynes, P. G. (1995). Funnels, pathways, and theenergy landscape of protein folding: a synthesis.Proteins Struct. Funct. Genet. 21, 167–195.
4. Dill, K. A., Bromberg, S., Yue, K., Fiebig, K. M., Yee,D. P., Thomas, P. D. & Chan, H. S. (1995). Principles ofprotein folding—a perspective from simple exactmodels. Protein Sci. 4, 561–602.
5. Thirumalai, D. & Woodson, S. A. (1996). Kinetics offolding of proteins and RNA. Acc. Chem. Res. 29,433–439.
6. Dill, K. A. & Chan, H. S. (1997). From Levinthal topathways to funnels. Nat. Struct. Biol. 4, 10–19.
7. Mirny, L. & Shakhnovich, E. (2001). Protein foldingtheory: from lattice to all-atom models. Annu. Rev.Biophys. Biomol. Struct. 30, 361–396.
8. Chan, H. S., Shimizu, S. & Kaya, H. (2004).Cooperativity principles in protein folding. MethodsEnzymol. 380, 350–379.
9. Onuchic, J. N. & Wolynes, P. G. (2004). Theory ofprotein folding. Curr. Opin. Struct. Biol. 14, 70–75.
10. Wallin, S. & Chan, H. S. (2005). A critical assessmentof the topomer search model of protein folding usinga continuum explicit-chain model with extensiveconformational sampling. Protein Sci. 14, 1643–1660.
11. Shakhnovich, E. (2006). Protein folding thermody-namics and dynamics: where physics, chemistry, andbiology meet. Chem. Rev. 106, 1559–1588.
12. Kim, D. E., Gu, H. & Baker, D. (1998). The sequencesof small proteins are not extensively optimized forrapid folding by natural selection. Proc. Natl Acad.Sci. USA, 95, 4982–4986.
13. Northey, J. G. B., Di Nardo, A. A. & Davidson, A. R.(2002). Hydrophobic core packing in the SH3 domainfolding transition state. Nat. Struct. Biol. 9, 126–130.
14. Jackson, S. E. & Fersht, A. R. (1991). Folding ofchymotrypsin inhibitor 2. 1. Evidence for a two-statetransition. Biochemistry, 30, 10428–10435.
15. Sosnick, T. R., Mayne, L., Hiller, R. & Englander, S.W.(1994). The barriers in protein folding. Nat. Struct.Biol. 1, 149–156.
16. Jacob, J., Krantz, B., Dothager, R. S., Thiyagarajan, P.& Sosnick, T. R. (2004). Early collapse is not anobligate step in protein folding. J. Mol. Biol. 338,369–382.
17. Matthews, C. R. & Hurle, M. R. (1987). Mutantsequences as probes of protein folding mechanisms.BioEssays, 6, 254–257.
18. Kuwajima, K. (1989). The molten globule state as aclue for understanding the folding and cooperativityof globular protein structure. Proteins: Struct. Funct.Genet. 6, 87–103.
19. Kim, P. S. & Baldwin, R. L. (1990). Intermediates inthe folding reactions of small proteins. Annu. Rev.Biochem. 59, 631–660.
20. Matthews, C. R. (1993). Pathways of protein folding.Annu. Rev. Biochem. 62, 653–683.
21. Sadqi, M., Fushman, D. & Muñoz, V. (2006). Atom-by-atom analysis of global downhill protein folding.Nature, 442, 317–321.
22. Liu, F. & Gruebele, M. (2007). Tuning λ6–85 towardsdownhill folding at its melting temperature. J. Mol.Biol. 370, 574–584.
23. Jackson, S. E. (1998). How do small single-domainproteins fold? Folding Des. 3, R81–R91.
24. Baker, D. (2000). A surprising simplicity to proteinfolding. Nature, 405, 39–42.
25. Barrick, D. (2009). What have we learned from thestudies of two-state folders, and what are theunanswered questions about two-state protein fold-ing? Phys. Biol. 6, 015001.
26. Plaxco, K. W., Simons, K. T. & Baker, D. (1998).Contact order, transition state placement and therefolding rates of single domain proteins. J. Mol. Biol.227, 985–994.
27. Wallin, S. & Chan, H. S. (2006). Conformationalentropic barriers in topology-dependent protein fold-ing: perspectives from a simple native-centric polymermodel. J. Phys.: Condens. Matter, 18, S307–S328.
28. Chan, H. S. (1998). Matching speed and locality.Nature, 392, 761–763.
29. Gō, N. & Taketomi, H. (1978). Respective roles ofshort- and long-range interactions in protein folding.Proc. Natl Acad. Sci. USA, 75, 559–563.
30. Alm, E. & Baker, D. (1999). Prediction of protein-folding mechanisms from free-energy landscapesderived from native structures. Proc. Natl Acad. Sci.USA, 96, 11305–11310.
31. Muñoz, V. & Eaton, W. A. (1999). A simple model forcalculating the kinetics of protein folding from three-dimensional structures. Proc. Natl Acad. Sci. USA, 96,11311–11316.
32. Chan, H. S. (2000). Modeling protein density ofstates: additive hydrophobic effects are insufficientfor calorimetric two-state cooperativity. Proteins:Struct. Funct. Genet. 40, 543–571.
33. Karanicolas, J. & Brooks, C. L. (2003). The importanceof explicit chain representation in protein foldingmodels: an examination of Ising-like models. Pro-teins: Struct. Funct. Genet. 53, 740–747.
34. Micheletti, C., Banavar, J. R., Maritan, A. & Seno, F.(1999). Protein structures and optimal folding from ageometrical variational principle. Phys. Rev. Lett. 82,3372–3375.
35. Shea, J.-E., Onuchic, J. N. & Brooks, C. L. (1999).Exploring the origins of topological frustration:design of a minimally frustrated model of fragmentB of protein A. Proc. Natl Acad. Sci. USA, 96,12512–12517.
36. Clementi, C., Nymeyer, H. & Onuchic, J. N. (2000).Topological and energetic factors: what determinesthe structural details of the transition state ensembleand “en-route” intermediates for protein folding? Aninvestigation for small globular proteins. J. Mol. Biol.298, 937–953.
37. Koga, N. & Takada, S. (2001). Roles of nativetopology and chain-length scaling in protein folding:a simulation study with a Gō-like model. J. Mol. Biol.313, 171–180.
38. Jewett, A. I., Pande, V. S. & Plaxco, K. W. (2003).Cooperativity, smooth energy landscapes and theorigins of topology-dependent protein folding rates.J. Mol. Biol. 326, 247–253.
39. Kaya, H. & Chan, H. S. (2003). Contact orderdependent protein folding rates: kinetic conse-quences of a cooperative interplay between favor-able nonlocal interactions and local conformationspreferences. Proteins: Struct. Funct. Genet. 52,524–533.
634 Desolvation and Topology-Dependent Folding
40. Kaya, H. & Chan, H. S. (2000). Polymer principles ofprotein calorimetric two-state cooperativity.Proteins:Struct. Funct. Genet. 40, 637–661; [Erratum: 43, 523(2001)].
41. Kaya, H. & Chan, H. S. (2003). Solvation effects anddriving forces for protein thermodynamic and kineticcooperativity: how adequate is native-centric topo-logical modeling? J. Mol. Biol. 326, 911–931; [Corri-gendum: 337, 1069–1070 (2004)].
42. Ghosh, K. & Dill, K. A. (2009). Theory for proteinfolding cooperativity: helix bundles. J. Am. Chem. Soc.131, 2306–2312.
43. Kaya, H. & Chan, H. S. (2005). Explicit-chain modelof native-state hydrogen exchange: implications forevent ordering and cooperativity in protein folding.Proteins: Struct. Funct. Bioinf. 58, 31–44.
44. Ejtehadi, M. R., Avall, S. P. & Plotkin, S. S. (2004).Three-body interactions improve the prediction ofrate and mechanism in protein folding models. Proc.Natl Acad. Sci. USA, 101, 15088–15093.
45. Wang, J., Lee, C. & Stell, G. (2005). The cooperativenature of hydrophobic forces and protein foldingkinetics. Chem. Phys. 316, 53–60.
46. Qi, X. & Portman, J. J. (2007). Excluded volume, localstructural cooperativity, and the polymer physics ofprotein folding rates. Proc. Natl Acad. Sci. USA, 104,10841–10846.
47. Abkevich, V. I., Gutin, A. M. & Shakhnovich, E. I.(1995). Impact of local and nonlocal interactions onthermodynamics and kinetics of protein folding.J. Mol. Biol. 252, 460–471.
48. Chan, H. S. (1999). Folding alphabets. Nat. Struct.Biol. 6, 994–996.
49. Chan, H. S., Kaya, H. & Shimizu, S. (2002).Computational methods for protein folding: scalinga hierarchy of complexities. In Current Topics inComputational Molecular Biology (Jiang, T., Xu, Y. &Zhang, M. Q., eds), pp. 403–447, The MIT Press,Cambridge, MA; chapt. 16.
50. Kaya, H. & Chan, H. S. (2003). Origins of chevronrollovers in non-two-state protein folding kinetics.Phys. Rev. Lett. 90, 258104.
51. Zhou, Y., Zhang, C., Stell, G. & Wang, J. (2003).Temperature dependence of the distribution of thefirst passage time: results from discontinuous mole-cular dynamics simulations of an all-atom model ofthe second β-hairpin fragment of protein G. J. Am.Chem. Soc. 125, 6300–6305.
52. Badasyan, A., Liu, Z. & Chan, H. S. (2008). Probingpossible downhill folding: native contact topologylikely places a significant constraint on the foldingcooperativity of proteins with ∼40 residues. J. Mol.Biol. 384, 512–530.
53. Rank, J. A. & Baker, D. (1997). A desolvation barrierto hydrophobic cluster formation may contribute tothe rate-limiting step in protein folding. Protein Sci. 6,347–354.
54. Cheung, M. S., García, A. E. & Onuchic, J. N. (2002).Protein folding mediated by solvation: water expul-sion and formation of the hydrophobic core occurafter the structural collapse. Proc. Natl Acad. Sci. USA,99, 685–690.
55. Karanicolas, J. & Brooks, C. L. (2002). The originsof asymmetry in the folding transition states ofprotein L and protein G. Protein Sci. 11,2351–2361.
56. Sessions, R. B., Thomas, G. L. & Parker, M. J. (2004).Water as a conformational editor in protein folding. J.Mol. Biol. 343, 1125–1133.
57. Kaya, H., Liu, Z. & Chan, H. S. (2005). Chevronbehavior and isostable enthalpic barriers in proteinfolding: successes and limitations of simple Gō-likemodeling. Biophys. J. 89, 520–535.
58. Liu, Z. & Chan, H. S. (2005). Desolvation is a likelyorigin of robust enthalpic barriers to protein folding.J. Mol. Biol. 349, 872–889.
59. Liu, Z. & Chan, H. S. (2005). Solvation and desolva-tion effects in protein folding: native flexibility,kinetic cooperativity, and enthalpic barriers underisostability conditions. Phys. Biol. 2, S75–S85.
60. Ferguson, A., Liu, Z. & Chan, H. S. (2007). Desolva-tion effects and topology-dependent protein folding.2007 American Physical Society March MeetingAbstract BAPS.2007.MAR.D26.3. http://meetings.aps.org/link/BAPS.2007.MAR.D26.3.
61. Capaldi, A. P., Kleanthous, C. & Radford, S. E. (2002).Im7 folding mechanism: misfolding on a path to thenative state. Nat. Struct. Biol. 9, 209–216.
62. Viguera, A. R., Vega, C. & Serrano, L. (2002).Unspecific hydrophobic stabilization of foldingtransition states. Proc. Natl Acad. Sci. USA, 99,5349–5354.
63. Feng, H., Takei, J., Lipsitz, R., Tjandra, N. & Bai, Y.(2003). Specific non-native hydrophobic interactionsin a hidden folding intermediate: implications forprotein folding. Biochemistry, 42, 12461–12465.
64. Cho, J. H., Sato, S. & Raleigh, D. P. (2004).Thermodynamics and kinetics of non-native interac-tions in protein folding: a single point mutantsignificantly stabilizes the N-terminal domain of L9by modulating non-native interactions in the dena-tured state. J. Mol. Biol. 338, 827–837.
65. Gu, Z., Rao, M. K., Forsyth, W. R., Finke, J. M. &Matthews, C. R. (2007). Structural analysis of kineticfolding intermediates for a TIM barrel protein,indole-3-glycerol phosphate synthase, by hydrogenexchange mass spectrometry and Gō model simula-tion. J. Mol. Biol. 374, 528–546.
66. Zarrine-Afsar, A., Wallin, S., Neculai, A. M., Neu-decker, P., Howell, P. L., Davidson, A. R. & Chan, H.S. (2008). Theoretical and experimental demonstra-tion of the importance of specific nonnative interac-tions in protein folding. Proc. Natl Acad. Sci. USA,105, 9999–10004.
67. Zhang, Z. & Chan, H. S. (2009). Native topology ofthe designed protein Top7 is not conducive tocooperative folding. Biophys. J. 96, L25–L27.
68. Chan, H. S. & Zhang, Z. (2009). Liaison amiddisorder: non-native interactions may underpinlong-range coupling in proteins. J. Biol. 8, 27.
69. Sheinerman, F. B. & Brooks, C. L. (1998). Molecularpicture of folding of a small α/β protein. Proc. NatlAcad. Sci. USA, 95, 1562–1567.
70. Rhee, Y. M., Sorin, E. J., Jayachandran, G., Lindahl, E.& Pande, V. S. (2004). Simulations of the role of waterin the protein-folding mechanism. Proc. Natl Acad.Sci. USA, 101, 6456–6461.
71. Shimizu, S. & Chan, H. S. (2002). Anti-cooperativityand cooperativity in hydrophobic interactions: three-body free energy landscapes and comparison withimplicit-solvent potential functions for proteins.Proteins: Struct. Funct. Genet. 48, 15–30; [Erratum:49, 294 (2002)].
72. Shimizu, S. & Chan, H. S. (2002). Origins of proteindenatured state compactness and hydrophobic clus-tering in aqueous urea: inferences from nonpolarpotentials of mean force. Proteins Struct. Funct. Genet.49, 560–566.
635Desolvation and Topology-Dependent Folding
73. Moghaddam, M. S., Shimizu, S. & Chan, H. S. (2005).Temperature dependence of three-body hydrophobicinteractions: potential of mean force, enthalpy,entropy, heat capacity, and nonadditivity. J. Am.Chem. Soc. 127, 303–316; [Correction: 127, 2363(2005)].
74. Levy, Y. & Onuchic, J. N. (2006). Water mediation inprotein folding and molecular recognition. Annu.Rev. Biophys. Biomol. Struct. 35, 389–415.
75. Best, R. B. & Hummer, G. (2008). Protein foldingkinetics under force frommolecular simulation. J. Am.Chem. Soc. 130, 3706–3707.
76. Rodríguez-Larrea, D., Minning, S., Borchert, T. V. &Sanchez-Ruiz, J. M. (2006). Role of solvation barriersin protein kinetic stability. J. Mol. Biol. 360, 715–724.
77. Costas, M., Rodríguez-Larrea, D., De Maria, L.,Borchert, T. V., Gómez-Puyou, A. & Sanchez-Ruiz,J. M. (2009). Between-species variation in the kineticstability of TIM proteins linked to solvation-barrierfree energies. J. Mol. Biol. 385, 924–937.
78. MacCallum, J. L., SabayeMoghaddam,M., Chan,H. S.& Tieleman, D. P. (2007). Hydrophobic association ofα-helices, steric dewetting and enthalpic barriers toprotein folding. Proc. Natl. Acad. Sci. USA, 104,6206–6210; [Correction: 105, 19561 (2008)].
79. Pratt, L. R. & Chandler, D. (1977). Theory ofhydrophobic effect. J. Chem. Phys. 67, 3683–3704.
80. Shimizu, S. & Chan, H. S. (2000). Temperaturedependence of hydrophobic interactions: a meanforce perspective, effects of water density, and non-additivity of thermodynamic signatures. J. Chem.Phys. 113, 4683–4700; [Erratum: 116, 8636 (2002)].
81. Chen, B.-L., Baase, W. A. & Schellman, J. A. (1989).Low-temperature unfolding of a mutant of phage-T4lysozyme. 2. Kinetic investigations. Biochemistry, 28,691–699.
82. Oliveberg, M., Tan, Y.-J. & Fersht, A. R. (1995).Negative activation enthalpies in the kinetics ofprotein folding. Proc. Natl Acad. Sci. USA, 92,8926–8929.
83. Scalley, M. L. & Baker, D. (1997). Protein foldingkinetics exhibit an Arrhenius temperature depen-dence when corrected for the temperature depen-dence of protein stability. Proc. Natl Acad. Sci. USA,94, 10636–10640.
84. Chalikian, T. V. (2003). Volumetric properties ofproteins. Annu. Rev. Biophys. Biomol. Struct. 32,207–235.
85. Mitra, L., Hata, K., Kono, R., Maeno, A., Isom, D.,Rouget, J.-B. et al. (2007). Vi-value analysis: apressure-based method for mapping the foldingtransition state ensemble of proteins. J. Am. Chem.Soc. 129, 14108–14109.
86. Veitshans, T., Klimov, D. & Thirumalai, D. (1997).Protein folding kinetics: timescales, pathways andenergy landscapes in terms of sequence-dependentproperties. Folding Des. 2, 1–22.
87. Valleau, J. P. & Torrie, G. M. (1977). A guide toMonte Carlo for statistical mechanics: 2. Byways. InStatistical Mechanics, Part A: Equilibrium Techniques(Berne, B. J., ed.), pp. 169–194, Plenum Press,New York; chapt. 5.
88. Beveridge, D. L. & DiCapua, F. M. (1989). Free-energy via molecular simulation – Applications tochemical and biomolecular system. Annu. Rev.Biophys. Biophys. Chem. 18, 431–492.
89. Voter, A. F. (1997). Hyperdynamics: acceleratedmolecular dynamics of infrequent events. Phys. Rev.Lett. 78, 3908–3911.
90. Fersht, A. R., Matouschek, A. & Serrano, L. (1992).The folding of an enzyme. I. Theory of proteinengineering analysis of stability and pathway ofprotein folding. J. Mol. Biol. 224, 771–782.
91. Bilsel, O. &Matthews, C. R. (2000). Barriers in proteinfolding reactions. Adv. Protein Chem. 53, 153–207.
92. Chan, H. S. & Dill, K. A. (1998). Protein folding in thelandscape perspective: chevron plots and non-Arrhe-nius kinetics. Proteins: Struct. Funct. Genet. 30, 2–33.
93. Portman, J. J., Takada, S. & Wolynes, P. G. (2001).Microscopic theory of protein folding rates. II. Localreaction coordinates and chain dynamics. J. Chem.Phys. 114, 5082–5096.
94. Kaya, H. & Chan, H. S. (2002). Towards a consistentmodeling of protein thermodynamic and kineticcooperativity: how applicable is the transition statepicture to folding and unfolding? J. Mol. Biol. 315,899–909.
95. Coutsias, E. A., Seok, C. & Dill, K. A. (2004). Usingquaternions to calculate RMSD. J. Comput. Chem. 25,1849–1857.
96. Best, R. B. & Hummer, G. (2006). Diffusive model ofprotein folding dynamics with Kramers turnover inrate. Phys. Rev. Lett. 96, 228104.
97. Chahine, J., Oliveira, R. J., Leite, V. B. P. & Wang, J.(2007). Configuration-dependent diffusion can shiftthe kinetic transition state and barrier height of proteinfolding. Proc. Natl Acad. Sci. USA, 104, 14646–14651.
98. Jacob, M. & Schmid, F. X. (1999). Protein folding as adiffusional process. Biochemistry, 38, 13773–13779.
99. Kaya, H. & Chan, H. S. (2003). Simple two-stateprotein folding kinetics requires near-Levinthal ther-modynamic cooperativity. Proteins: Struct. Funct.Genet. 52, 510–523.
100. Chavez, L. L., Onuchic, J. N. & Clementi, C. (2004).Quantifying the roughness on the free energy land-scape: entropic bottlenecks and protein folding rates.J. Am. Chem. Soc. 126, 8426–8432.
101. Hammond, G. S. (1955). A correlation of reactionrates. J. Am. Chem. Soc. 77, 334–338.
102. Plotkin, S. S. & Onuchic, J. N. (2002). Structural andenergetic heterogeneity in protein folding. I. Theory.J. Chem. Phys. 116, 5263–5283.
103. Bai, Y., Zhou, H. & Zhou, Y. (2004). Critical nuclea-tion size in the folding of small apparently two-stateproteins. Protein Sci. 13, 1173–1181.
104. Weikl, T. R. (2008). Loop-closure principles in proteinfolding. Arch. Biochem. Biophys. 469, 67–75.
105. Gromiha, M. M. & Selvaraj, S. (2001). Comparisonbetween long-range interactions and contact order indetermining the folding rate of two-state proteins:application of long-range order to folding rateprediction. J. Mol. Biol. 310, 27–32.
106. Zhou, H. & Zhou, Y. (2002). Folding rate predictionusing total contact distance. Biophys. J. 82, 458–463.
107. Ivankov, D. N., Garbuzynskiy, S. O., Alm, E., Plaxco,K. W., Baker, D. & Finkelstein, A. V. (2003). Contactorder revisited: influence of protein size on thefolding rate. Protein Sci. 12, 2057–2062.
108. Micheletti, C. (2003). Prediction of folding rates andtransition-state placement from native-state geome-try. Proteins Struct. Funct. Genet. 51, 74–84.
109. Gong, H., Isom, D. G., Srinivasan, R. & Rose, G. D.(2003). Local secondary structure content predictsfolding rates for simple, two-state proteins. J. Mol.Biol. 327, 1149–1154.
110. Pandit, A. D., Jha, A., Freed, K. F. & Sosnick, T. R.(2006). Small proteins fold through transition stateswith native-like topologies. J. Mol. Biol. 361, 755–770.
636 Desolvation and Topology-Dependent Folding
111. Baxa, M. C., Freed, K. F. & Sosnick, T. R. (2008).Quantifying the structural requirements of thefolding transition state of protein A and othersystems. J. Mol. Biol. 381, 1362–1381.
112. Paci, E., Lindorff-Larsen, K., Dobson, C. M., Karplus,M. & Vendruscolo, M. (2005). Transition state contactorders correlate with protein folding rates. J. Mol.Biol. 352, 495–500.
113. Hubner, I. A., Shimada, J. & Shakhnovich, E. I. (2004).Commitment and nucleation in the protein Gtransition state. J. Mol. Biol. 336, 745–761.
114. Badasyan, A., Liu, Z. & Chan, H. S. (2009).Interplaying roles of native topology and chainlength in marginally cooperative and noncoopera-tive folding of small protein fragments. Int. J.Quantum Chem. In press. doi:10.1002/qua.22272.
115. Scott, K. A., Batey, S., Hooton, K. A. & Clarke, J.(2004). The folding of spectrin domains I: wild-type domains have the same stability but verydifferent kinetic properties. J. Mol. Biol. 344,195–205.
116. Lindberg, M., Tangrot, J. & Oliveberg, M. (2002).Complete change of the protein folding transitionstate upon circular permutation. Nat. Struct. Biol. 9,818–822.
117. Miller, E. J., Fischer, K. F. & Marqusee, S. (2002).Experimental evaluation of topological parametersdetermining protein-folding rates. Proc. Natl Acad.Sci. USA, 99, 10359–10363.
118. Cho, S. S., Weinkam, P. & Wolynes, P. G. (2008).Origins of barriers and barrierless folding in BBL.Proc. Natl Acad. Sci. USA, 105, 118–123.