Designing of Reverse Osmosis Desalination Plant in Jordan ...
129
An-Najah National University Faculty of Graduate Studies Designing of Reverse Osmosis Desalination Plant in Jordan Valley Using Optimal Energy Options With Less Environmental Impacts By Ahmad AbdUllah Abdel-fattah Othman Supervisor Dr. Aysar Yasin Co- Supervisor Dr. Abdel-haleemKhader This thesis is submitted in Partial Fulfillment of the Requirementsfor the Degree of Master of Water and EnvironmentalEngineering, Nablus, Palestine 2017
Transcript of Designing of Reverse Osmosis Desalination Plant in Jordan ...

An-Najah National University
Faculty of Graduate Studies
Designing of Reverse Osmosis Desalination Plant
in Jordan Valley Using Optimal Energy Options
With Less Environmental Impacts
By
Ahmad AbdUllah Abdel-fattah Othman
Supervisor
Dr. Aysar Yasin
Co- Supervisor
Dr. Abdel-haleemKhader
This thesis is submitted in Partial Fulfillment of the Requirementsfor
the Degree of Master of Water and EnvironmentalEngineering,
Nablus, Palestine
2017

II
Designing of Reverse Osmosis Desalination Plant in Jordan
Valley Using Optimal Energy Options With Less
Environmental Impacts
By
Ahmad AbdUllah Abdel-Fattah Othman
This thesis was defended successfully on 03/08/2017 and approved by:
Defended Committee MembersSignature
- Dr. Aysar Yasin / Supervior ………..………….
-Dr. Abdel-haleem Khader / Co- Supervisor ………..………….-
-Dr. Mohammad Alsayed / External Examiner ..………………….-
-Dr. Subhi Samhan / Internal Examiner ………..………….

III
Dedication
This thesis is dedicated to:
The sake of Allah, my Creator and my Master,,,,
My great teacher, Mohammed (May Allah bless
and grant him), who taught us to follow the right ways of life,,,,
My homeland Palestine, the warmest womb,,,,
An-Najah National University; my second magnificent home,,,,
The great martyrs and prisoners, the symbol of sacrifice,,,,
My brothers "martyrs" Kamal and Amjad, the symbol of hope , optimism
and patience,,,,
My work managers ,Mamoun, Jamil, Ayad, Khalil and Mahmoud,,,,
My colleagues in myjob , Mohsen, Ali, Adham and Basem
My great parents, "AbdUllah and Randa" , who have always loved me
unconditionally and whose good examples have taught me to work hard for
the things that I aspire to achieve,,,,
The memory of my father "AbdUllah" , I miss him every day ,,,,
My dearest wife,who leads me through the valley of darkness
with light of hope and support,,,,
My beloved brothers and sisters,,,,
To all my family, the symbol of love and giving,,,,
My friends who encourage and support me,,,,
All the people in my life who touch my heart,,,,
I dedicate this work….

IV
Acknowledgments
First and foremost, I must acknowledge my limitless thanks to Allah, the
Ever-Magnificent; the Ever-Thankful, for His help and bless. I am totally
sure that this work would have never become truth, without His guidance.
I would like to express my grateful thanks to my advisor's Dr. Aysar Yasin
and Dr. Abdel-Haleem Khader for their guidance , inspiration , support and
encouragement in every stage of my study , also they provide me vision,
optimistic attitude , enthusiasm and continual pursuing for scientific and
practical challenges with lifetime benefits.
My thanks and appreciations go to the staff of Water and Environmental
Engineering Master Program in An-Najah National University for their
suggestions and assistance.
My great thanks to my parents, wife, brothers, sisters and my big family for
their support and encouragement . I am grateful to all of you for your love,
support and patience. All my friends and fellow graduate colleagues, thank
you.
I would like to thank the Palestinian Water Authority (PWA) and Middle
East Desalination Research Center for the financial moral support that they
gave me to complete my study.
Special thanks to An-Najah National University for giving us an
opportunity to complete this work.
Finally, I would like to thank to everybody who was important to the
successful realization of thesis, as well as expressing my apology that I
could not mention personally one by one .

V
الإقرار
أنا الموقعة أدناه مقدمة الرسالة التي تحمل العنوان :
Designing of Reverse Osmosis Desalination Plant in Jordan
Valley Using Optimal Energy Options With Less
Environmental Impacts
أقر بأن ما اشتملت عليه هذه الرسالة هي نتاج جهدي الخاص, باستثناء ما تمت الإشارة إليه حيثما
ورد, و أن هذه الرسالة كاملة, أو أي جزء منها لم يقدم من قبل لنيل أي درجة أو لقب علمي أو
بحثي لمؤسسة تعليمية أو بحثية أخرى.
Declaration
The work provided in this thesis, unless otherwise referenced, is the
researcher's own work, and has not been submitted elsewhere for any other
degree or qualification.
Student's name: اسم الطالب:أحمد عبد الله عبد الفتاح عثمان
Signature: :التوقيع
Date: 03/08/2017:التاريخ

VI
Table of Contents
Dedication ................................................................................................... III
Acknowledgments ....................................................................................... IV
Declaration ................................................................................................... V
Table of Contents ........................................................................................ VI
List of Tables ............................................................................................... IX
List of Figures ............................................................................................. XI
List of Appendix....................................................................................... XIII
List of abbreviations and symbols ........................................................... XIV
Chapter One ................................................................................................. 19
Introduction ................................................................................................. 19
Introduction .............................................................................................. 20
1.1 General introduction .......................................................................... 20
1.2 Objectives ........................................................................................... 21
1.2.1 General Objectives ....................................................................... 21
1.2.2 Specific objectives ....................................................................... 22
1.2.3 Research question and identified problems ................................. 22
1.3 Methodology ...................................................................................... 22
1.4 Literature review ................................................................................ 24
1.4.1 General Introduction .................................................................... 24
1.4.2 Renewable energy sources in Palestine ....................................... 25
1.4.3 Environmental and Feasibility study for the RO plant ................ 25
Chapter Two ................................................................................................ 29
Study area and water demand ..................................................................... 29
2.1 Study Area .......................................................................................... 30
2.1.1 Az-Zubaidat Village .................................................................... 30
2.1.2 Population .................................................................................... 30
2.1.3 Water Resources .......................................................................... 31
2.2 Water Demand ................................................................................... 32
2.2.1 Water demand definition ................................................................. 32
2.2.2 Population Forecast Method ........................................................ 32

VII
2.2.3 Population forecasting for Az-Zubaidat Village ......................... 33
Chapter Three .............................................................................................. 35
Design of Reverse Osmosis Desalination Plant .......................................... 35
3.1 Definitions .......................................................................................... 36
3.1.1 Osmosis and reverse osmosis principles ..................................... 36
3.1.2 Desalination technologies ............................................................ 38
3.2 RO Membranes .................................................................................. 39
3.2.1 Cellulose Acetate Membranes ..................................................... 39
3.2.2 Composite Polyamide Membranes .............................................. 39
3.3 Membrane Modules ........................................................................... 40
3.3.1 Hollow Fine Fiber ........................................................................ 40
3.3.2 Spiral Wound ............................................................................... 41
3.4 Passes and Stages in RO System ....................................................... 42
3.4.1 Single and Double Pass RO ......................................................... 42
3.4.2 One and two stages of RO system ............................................... 43
3.5 Reverse osmosis Performance & Design Calculations ...................... 45
3.5.1 Osmotic and Operating Pressure ................................................. 46
3.5.2 Rejection ...................................................................................... 47
3.5.3 Permeate Recovery ...................................................................... 47
3.6 Desalination plant components .......................................................... 48
3.6.1 Inlet water unit ............................................................................. 48
3.6.2 Water transfer unit ....................................................................... 48
3.6.3 Pretreatment unit .......................................................................... 52
3.6.4 Membrane Element Unit .............................................................. 57
3.6.5 High pressure pumping unit ......................................................... 59
Chapter Four ............................................................................................... 62
Case Study : Az-Zubaidat Village .............................................................. 62
4.1 Introduction ........................................................................................ 63
4.2 The Case Study Load Profile ............................................................. 63
4.3 Standalone System ............................................................................. 66
4.4 Photovoltaic system ........................................................................... 67
4.4.1 Photovoltaic Panels (PV) ............................................................. 67

VIII
4.5 Wind turbine ...................................................................................... 70
4.6 Batteries (Lead acid batteries) ........................................................... 72
4.7 Inverter ............................................................................................... 72
4.8 Diesel Generator ................................................................................ 74
Chapter Five ................................................................................................ 76
Optimization of power configurations for operating the Reverse Osmosis
desalination plant......................................................................................... 76
5.1 Homer program .................................................................................. 77
5.2 Optimization using HOMER program ............................................... 78
5.2.1 Stand alone system (off-grid) ...................................................... 78
5.2.2 Grid Connection (on grid)............................................................ 97
Chapter Six .................................................................................................. 98
Economic analysis and environmental impacts of using reverse osmosis
desalination plant powered by different sources of energy ........................ 98
6.1 Economic analysis of using RO plant powered by PV panels and D.G
.................................................................................................................. 99
6.1.1 Water Distribution Tank system : .............................................. 102
6.1.2 Chemical energy storage system (Lead acid batteries ) ............ 104
6.2 Environmental assessments ............................................................. 106
Results and Conclusion .......................................................................... 108
Recommendations .................................................................................. 109
References ................................................................................................. 110
Appendices ................................................................................................ 117
ب ........................................................................................................... الملخص

IX
List of Tables
Table (3.1): the number of stages of RO system and the recovery rate . ........ 45
Table (3.2): Main parameter for dual-media filter .......................................... 49
Table (3.3): Main results for dual-media filter ............................................... 50
Table (4.1) : Hourly load data ......................................................................... 64
Table (4.2): Distribution of water consumption during day and night ........... 65
Table (4.3) : The solar radiation of Marjna'ja village . ................................... 70
Table (4.4) : The wind speed of Marjna'ja village . ........................................ 71
Table (5.1) : Homer software input data for the optimal solution of scenario 81
Table(5.2) : The output energy production of scenario .................................. 82
Table (5.3) : The net present cost for PV-diesel generator-battery-power
converter hybrid system of scenario .......................................... 84
Table (5.4): The net present cost for diesel generator, battery and power
converter hybrid system of scenario ......................................... 84
Table (5.5): The net present cost for PV, diesel generator and power converter
hybrid system of scenario ......................................................... 85
Table (5.6): The net present cost for diesel generator hybrid system of
scenario ...................................................................................... 85
Table (5.7): The net present cost for PV, battery and power converter hybrid
system of scenario ..................................................................... 86
Table (5.8): comparison of various hybrid energy system of scenario .......... 87
Table (5.9) : Homer software input data for the optimal solution of scenario 90
Table(5.10): The output energy production of scenario ................................ 91
Table (5.11) : The net present cost for PV-diesel generator-battery-power
converter hybrid system of scenario ........................................ 93
Table (5.12): The net present cost for PV-diesel generator- power converter
hybrid system of scenario ......................................................... 93
Table (5.13): The net present cost for diesel generator, battery and power
converter hybrid system of scenario ......................................... 94
Table (5.14): The net present cost for diesel generator hybrid system of
scenario ..................................................................................... 94
Table (5.15): The net present cost for PV, battery and power converter hybrid
system of scenario ..................................................................... 95
Table (5.16) : comparison of various hybrid energy system of scenario ....... 96
Table (6.1): Direct capital cost of the project . ............................................. 100
Table(6.3) : The cost of cubic meter of water for the other configurations of
scenario ................................................................................... 103

X
Table (6.4): Energy cost when the batteries used as the storage system ...... 104
Table(6.5) : The cost of cubic meter for the other configurations of scenario
.................................................................................................. 105
Table (6.6): The amount of gaseous emissions for diesel generator over its
lifetime. .................................................................................... 107

XI
List of Figures
Figure (1.1): Methodology flowchart. ......................................................... 24
Figure (2.1) : Az Zubaidat location map . ................................................... 30
Figure (3.1): Osmosis principle . ................................................................ 36
Figure (3.2): Reverse Osmosis principle .................................................... 37
Figure (3.3): Hollow fiber membrane . ....................................................... 41
Figure (3.4): Spiral wound membrane module .......................................... 42
Figure (3.5): Single pass RO ...................................................................... 43
Figure (3.7): One-stage RO system ............................................................. 44
Figure (3.8): Two-stage RO system ............................................................ 44
Figure (3.9): Flowchart for RO desalination plant ..................................... 46
Figure (3.10): Feed water tank dimensions ................................................ 51
Figure (3.11): Water transfer pump ............................................................ 52
Figure (3.12): Dual-media filter .................................................................. 54
Figure (3.13):Antiscalant pump ................................................................. 56
Figure (3.14): Cartridge filter ..................................................................... 57
Figure (3.15): Two stages RO membranes ................................................ 58
Figure (3.16): Water distribution tank dimensions ..................................... 60
Figure (4.1): Schematic diagram for RO desalination plant ....................... 64
Figure (4.2) : daily load in system of scenario . .......................................... 65
Figure (4.3): Schematic diagram of Standalone system ........................... 66
Figure (4.4) : Photovoltaic system shape .................................................... 68
Figure (4.5) : Photo of wind turbine ........................................................... 71
Figure (4.6) : Photo of inverter ................................................................... 73
Figure (4.7) : Photo of diesel generator ...................................................... 75
Figure (5.1): Schematic diagram of Standalone system (off-grid)
configurations ...................................................................... 77
Figure (5.2) : Energy flow diagram of scenario .......................................... 80
Figure (5.3) : Optimization Result of system of scenario ........................... 82
Figure (5.4) : Cash summary by component type of system of scenario ... 83
Figure (5.5) : The amount of electricity produced monthly by hybrid
system of scenario ................................................................ 83
Figure (5.6) : Energy flow diagram for the hybrid energy system of
scenario ............................................................................... 88
Figure(5.7) : hourly load (during sunshine hours) of scenario ................... 89
Figure (5.8) :Optimization Result of system of scenario ............................ 91

XII
Figure (5.9) : Cash summary by component type of system of scenario ... 92
Figure (5.10) : The amount of electricity produced monthly by hybrid
system of scenario ................................................................ 92

XIII
List of Appendix
Appendix A1 : Head loss before water transfer pump calculations ......... 118
Appendix A2 : High pressure pumping unit calculations ......................... 120
Appendix A3 :The cost of cubic meter water using Water Distribution Tank
Scenario .............................................................................. 122
Appendix A4 : The cost of cubic meter water using Batteries Scenario .. 124

XIV
List of abbreviations and symbols
the osmotic pressure (kPa). π
shape factor ϕ
porosity
Specific gravity
Fluid viscosity
efficiency of the pump η
Cross section area of the pipe A
Angstrom AO
alternating current AC
annualized capital cost ACC
analytic hierarchy process AHP
Ante meridiem a.m
anti scaling pump AP
anti scaling tank AT
Applied Research Institute – Jerusalem ARIJ
Brackish Water BW
Capita C
Degree centigrade C0
cellulose acetate CA
reject concentration Cc
drag force coefficient CD
cartridge filter CF
feed concentration Cf
centimeter cm
cost of energy COE
Permeate concentration Cp
Diameter of the pipe D
depth of filter sand D'
day d
direct current DC
direct capital cost DCC
Diesel Generator DG
distribution tank DT
Total daily load energy Eld
Food and Agriculture Organization FAO
acceleration of gravity g
Group Christian Volunteers GVC
Head at point 1 h1
Head at point 2 h2
Hour hr
frictional head loss through the filter hL
HP motor pump HP-M2

XV
Hybrid Optimization of Multiple Electric Renewable HOMER
the interest rate (%) i
indirect capital cost ICC
Density ρ
Kilo Pascal kpa
Kilometer km
Kilowatt Kw
Kilowatt peak Kwp
liter Ltr
Length of the pipe L
load factor (%) Lplant
life cycle inventory LCI
daily potable water production of theplant Mplant
meter m
millimeter mm
Cubic meter m3
multi effect distillation MED
milligram mg
multistage flash distillation MSF
Micro meter µm
Number of elements N'
Number of filters N
Number of forecasting years n
the plant life time n(plant) :
number of membrane that will be used in the plant nb
lift time of each membrane nLTMbrn
operating and maintenance cost OCO&M
the operating cost of the membrane OC Mbrn
the energy cost for each kilowatt OC power
Total power Plt
the population separated by the time ∆ t P and Po
population P
Current Population P0
Pressure at point 1 ( tank) P1
Pressure at point 2 ( pipe exit) P2
polyamide PA
Palestinian Central Bureau of Statistics PCBS
potential of hydrogen pH
present population Po
Post meridiem p.m
Head loss through a pump Ploss
the saturation population of the community Psat
Parts per million ppm
Photovoltaic PV

XVI
Palestinian Water Authority PWA
input power required at pump 1 Pw1
input power required at pump 2 Pw2
Total daily permeate flow rate Q
Feed water Flow rate Qf
Permeate water Flow rate Qp
Concentrate water Flow rate Qc
the population growth rate r
the universal gas constant R
recovery R'
Reynolds number Re
Reverse Osmosis RO
Reverse Osmosis System Analysis ROSA
second s
Silt density index SDI
salt rejection SR
Storage tank ST
the temperature (Kelvin). T
period of the project t
Total capital cost TCC
Total daily operation td
Total dissolved solid TDS
Total Net Present Cost TNPC
transfer motor pump TP- M1
total water price TWP
Velocity at the inlet (point 1 ) 1ν
Velocity at the outlet (point 2 ) 2ν
Velocity of the fluid ( water ) ν
Velocity V
approach velocity va
watt W
wind energy conversion WEC
Water & Environment Research Unit WERU
World Health Organization WHO
the concentration of all constituents in a solution ∑ X i

XVII
Designing Of Reverse Osmosis Desalination Plant in Jordan Valley
Using Optimal Energy Options With Less Environmental Impacts
By
Ahmad AbdUllah Abdel-fattah Othman
Supervisor
Dr. Aysar Yasin
Co- Supervisor
Dr. Abdel-haleemKhader
Abstract
The objective of this research is to design a reverse osmosis desalination
plant in Jordan Valley using clean and sustainable energy source. The
village of Az-Zubaidat’s well water is taken as a case study. According to
World Health Organization (WHO) Az-Zubaidat’s well water is not
potable and need to be purified. The total dissolved solids(TDS) of Az-
Zubaidat’s well water is 2100 ppm, which is high and should be less than
or equal to 1500 ppm. The population of Az-Zubaidat’s Village in 2016 is
1798 capita based on engineering method for forecasting the population
and the corresponding water average consumption rate is 150 L/capita/day
according to WHO standards.
A reverse osmosis (RO) plant with an average daily drinking water
production of 270m3/day is designed; the capacity of Az-Zubaidat’s well is
120m3/hr.
The reverse osmosis technology is considered in this research where
feasible and sustainable energy source to power the plant is to be studied
and analyzed. Powering the plant using diesel generators is not considered
in this study as the running cost is high and exhausts of the generators is

XVIII
highly polluting. In the meanwhile, connecting to Israeli electrical grid is
not considered as an option in this study as it increases the dependency on
Israeli side and the capacity offered is limited.
Investigating the possibility of utilizing renewable energy sources, mainly
the solar energy to operate the designed plant is the core of this research.
The solar energy includes Photovoltaic and wind energy. Az-Zubaidat’s
village has great potential of solar radiation which reaches about 5.40
kWh/m2/day (global horizontal) but the annual average speed is very low
and definitely not suitable for electricity generation. Stand-alone hybrid
system (off grid) based on PV panels, diesel generator and different storage
systems with five configurations are investigated. The five configurations
include PV panels with batteries, diesel generator(DG) with batteries, PV
panels and DG without batteries, PV panels and DG with batteries and DG
without batteries. To investigate the optimal option of the previous
configuration is tedious and time-consuming effort and impossible in some
cases, so Hybrid Optimization of Multiple Electric Renewable (HOMER)
software is utilized. HOMER software facilities the sensitivity analysis and
make it easier to evaluate the many possible system configurations and
choose the best one.
The results shows that the configuration consists of PV, DG and battery
storage system from the Lead acid batteries is the best as the cost of energy
(COE) is 0.462$/kWh and the cost of potable cubic meter is 0.601$/ m3.
Using water distribution tank as a storage system to reduce or exclude the
battery energy storage system is analyzed in this research. The results
shows that introducing storage tank to the configuration that includes PV,

XIX
DG and battery reduces the COE to 0.348$/kWh and the cost of potable
cubic meter is 0.479$/ m3.
Chapter One
Introduction

20
Introduction
1.1General introduction
When population growing, water demand for domestic, agricultural and
industrial needs is increasing.
Fresh water resources are now widely exploited over the world due to
increasing population and the amount of potable water will be decreased
so, the other sources of water require some form of treatment before
potable use without interruption and with reasonable cost to the consumer.
Desalination technologies have appeared since 1950s at large scale plant with
thermal processes like Multi Stage Flash Distillation (MSF) andMulti Effect
Distillation (MED). Heating processes became established using the plenty
supply of available oil-driven energy for the required heating process[1].
The Reverse Osmosis (RO) process, developed since 1970s, is the main
alternative to the previous technologies that require less amount of energy
than thermal processes [1].
The desalination of ground water has more interest especially in Jordan
Valley region due to high amount of salinity (Total Dissolve solids TDS).
The design and operation of treatment plant depends on the feed water
quality in order to decide which pretreatment, feed pressure, recovery and
waste disposable method is selected since the energy consumption is
related directly to feed water TDS[2].
RO is a treatment process used to remove dissolved solutes and large
molecules from water or any other solutions by applying high amount of

21
pressure to feed water that causes a portion of water to cross and diffuse
through the surface of membrane called permeate while the remaining of
water called concentrate will be rejected out of the system. This process is
provide to purify water from a surface, well, Brackish and sea water
resources [3].
Reverse osmosis plants are now being used for a variety of applications
including semiconductors, food processing, power generation,
pharmaceuticals, desalination, biotechnology, coproduced water from oil
and gas production, textile, pulp and paper, mine and diary wastewater,
process and boiler water, tanneries and beverage industry [3].
One of the significant alternative used to operate RO plants are utility
renewable energies mainly PV technologies combined with diesel
generator using different types of storage technologies.
The optimization method was developed for the sources of energy
configurations using HOMER software and evaluated using economical,
technical and environmental performance indicators.
1.2 Objectives
1.2.1 General Objectives
The Aim of this thesis is to design and operate reverse osmosis desalination
plant using different types of energy sources and to investigate the
feasibility and the environmental impacts of using reverse osmosis
technology in water desalination in the Jordan valley in order to make it
suitable for drinking uses.

22
1.2.2 Specific objectives
The main objective of the project is to study the use of conventional and/or
non conventional source of energy in water desalination in terms of cost,
economic feasibility and its impact on the surrounding environment.
1.2.3 Research question and identified problems
The proposed research aims at giving a reliable answer to the following
questions:
❖ What are the possible sources of energy which is suitable for water
desalination, especially in Palestine?
❖ What is the most feasible source of energy which can be used in
water desalination with less damage to the environment?
❖ What are the environmental impacts of water desalination plant?
❖ What is the price of cubic meter is expected for the consumer?
1.3 Methodology
This work was achieved by the following methodology:
a. Data collection:
Taking available options of conventional and nonconventional energies
with their products and other information in order to see which techniques
can be used.
b. Defining Process
Define the different types of energy technologies from technical point of
view and other configurations.

23
c. Experimental and Analysis work
Will be the study of the amount and suitable type of energy needed to run
the project, the prices of the necessary equipment, the cost of
maintenance will also be the work of testing in the laboratory to identify
the amount of total dissolved solids of the source of water feeder for the
project.
d. Process evaluation
Choose the least expensive method for the proper disposal of brine to
minimize harm to the environment and also choose the best source of
energy using HOMER software that will be used to operate the project.

24
Figure (1.1): Methodology flowchart[31].
1.4 Literature review
1.4.1General Introduction
Water desalination using membrane techniques will be a common one
specially in middle east area. Petroleum fuels powered desalination plants
Methodology
Data collection
Defining problem Defining process
RO Desalination
plant design
Optimization using
HOMER software
Process evaluation and
selection

25
spread in the Arabian Gulf region due to drink water scarcity and
availability of large amount of cheap fuel, as the United Arab Emirates and
Qatar where giant desalination plants were established. Such diesel
powered plants have never been established in Palestine since the fuel
prices are very high and it would not be feasible to establish such plants[3].
1.4.2 Renewable energy sources in Palestine
There are several forms of energy produced from renewable sources used
for water desalination. This includes geothermal energy, solar, and wind
energy. One of the most renewable energies used nowadays in Palestine is
PV(photovoltaic) panels, which convert solar radiation to electricity. Later,
the electricity is used to operate the RO processes and produce pure safe
drinking water from surface, brackish water or seawater.
1.4.3 Environmental and Feasibility study for the RO plant
The optimization method was developed for the sources of energy
configurations and evaluated using economical, technical and
environmental performance indicators. The initial, operating and
maintenance cost must be determined in order to calculate the potable
water cost for the customer.
Different studies and researches have been implemented to utilize RO
technology for water desalination using different types of power sources.
The following section introduces some of them.

26
Franz Trieb and Hans Müller-Steinhagen, present a long-term scenario for
the demand of freshwater in the Middle East and North Africa and show
how it may be covered by a better use of the existing renewable water
sources and by seawater desalination powered with solar energy[4].
Mohammed Rasool Qtaishat and Fawzi Banat,present the main features of
a solar powered membrane distillation system along with its basic
principles and review efforts of researchers in coupling membrane
distillation with solar energy and their cost estimates [5].
Maged A.I. El-Shaarawi et al, estimate the minimum initial cost of
photovoltaic (PV) arrays in PV-powered reverse osmosis (PV–RO)
desalination systems by thermo-hydro calculations that are based on second
law of thermodynamics limitations [6].
Fawzi Banat and Nesreen Jwaied, made an economic assessment to
determine the water cost for small scale solar power membrane distillation
units. Based on their work, the cost of potable water using distillation
method is 15$/m3 by the large units [7].
J. V. Benne, D. G. Jirka and J. Largier, The environmental impact
assessment (EIA) of any Desalination projects are very necessary, in
addition to it should discuss any potential impacts on air, land and marine
environments[8].
T. Hoepner, Made the feasibility study of the site project that be done
before the construction of the project parts begins[9].

27
W. R. Everest and T. Murphree, Applied the environmental standards
within the plant's operation in order to arrive to good environmental
management of high quality projects[10].
Mousa Mohsen and Jamal Jaberevaluate the possibility of using
photovoltaic powered scenario as a source of energy to power water
desalination projects in Jordan, they found that Shoubak, Aqaba, Azraq
and Amman are the most favorable sites for photovoltaic RO desalination
systems. With a TDS of 7000 mg/L, the annual amount of water production
for these sites was 329, 320, 304 and 301m3, respectively; 65% of the
treated water is produced in the months of April through September; the
driest months in the country [11].
Johannes Lindemann discuss the use of wind and solar powered
desalination systems in the middle east and Arabian gulf, he presents a
seawater desalination plant with an average daily drinking water production
of 1000m3/day planned by different water. The desalination water plant
with ultra filtration process is supplied by wind energy with capacity of
750kW with on grid . also he discuss another system as research
projectusing RO process with photovoltaic system that has capacity of
4.8kWh with additional battery storage of 60kWh , it produced an average
daily production water of 0.8-3m3/d [12].
Mohsen and A1- Jayyousi, investigated the feasibility of different
desalination technologies to cover the increasing water demand in Jordan.
They carried out an AHP multi-criteria analysis considering economic,
technical and environmental criteria, and compared the five most important

28
desalination technologies that will produce potable water from brackish and
seawater[13].
Sultan A. Kershrman, prepared the economic analysis of the integrated
renewable energy systems predicts water cost for the integration of Grid to
wind energy conversion (WEC) and photovoltaic power generation (PV)
for small-scale RO desalination plant in Libya, the water cost for the
integration of Grid and WEC with RO is €0.8/m3 and for Grid and PV with
RO is €0.9/m3[14].
Samer Farid Yousef Yousef, made the economic analysis and
environmental impacts of Brackish Water Reverse Osmosis technology for
a small project in West Bank- Palestine using solar electric power, the cost
of each m3 potable water is 3.17$ using battery and 2.33$ without using
battery[15].
Wala' Faheem Al Sheikh Abdallah, evaluate the techno-economic
feasibility study for two cases of BWRO desalination project powered by
PV panels in West Bank-Palestine using DEEP program, the cost of each
m3 potable water of Marj Na'aja project is 0.423$ while the cost of each m3
potable water of Al-Zubaidat project 5.09$[16].

29
Chapter Two
Study area and water demand

30
2.1 Study Area
2.1.1 Az-Zubaidat Village
Az-Zubaidat Village is a located with 35.4km north of Jericho City in
Palestine. Az-Zubaidat Village is bordered by Marj Na'ja Village to the
north, Marj al Ghazal to the south, the Jordan River to the east and Tubas
City to the west as shown in Figure (2.1) below.
Az-Zubaidat Village is located under sea level with 275m, the average
annual temperature is 23ºC,the average annual humidity is 48% and the
mean annual rainfall is 192mm [17].
Figure (2.1) : Az Zubaidat location map [17].
2.1.2 Population
The total population of Az-Zubaidat Village in 1997 was 968capita; of
whom 489 were male and 479 female, The number of households was 85

31
households living in 85 housing units, while the population of Az-Zubaidat
grew in 2007 to 1,357capita; of whom 696 were male and 661 female. The
number of households was 199 households living in 199 housing units
[18].
2.1.3 Water Resources
The source of drinking water of Az-Zubaidat Village is the Israeli company
(Mekerot), with water network constructed in 2001.
The average consumption rate of domestic water in Az-Zubaidat Village is
150L/C/d, the amount of water supplied to the Village in 2011 was
500m3/d[19].
The Village has three underground wells, those wells aren't suitable to
supply this village as potable water due to high value of total dissolved
solid, they would be used only for irrigation of vegetables, grapes and palm
trees[19].
The depletion of the groundwater sources through ‘Mekerot’ privately
owned and controlled Israeli wells, which forbidden the Palestinian from
excavation new wells and purchase the water only from Mekerot Company,
also, the village has two wells controlled by Mekorot Company, namely :
Marj Na'ja no. 14 and Argaman no. 29 [17].

32
2.2Water Demand
2.2.1 Water demand definition
Water demand is the total amount of water consumed by the customers
within the water system during a period of time[20].
There are several factors that can influence the amount of water demand
such aseducation, age, religion and culture of the user himself .
Another factor that affects the amount of water consumption is the purpose
for which water is used such as domestic, agricultural or industrial uses.
Types of demand in Az-Zubeidat Village :
1. Domestic water demand
In this type, water is used for drinking, bathing and showering,
cooking,gardening and houses cleaning, etc .
The average per capita per day consumption is calculated by dividing the
total consumption for a year over the number of population over the
number of days of that year.
2. Agricultural water demand
In this type,water is used in agricultural purpose for irrigation and live
stock.
2.2.2 Population Forecast Method
There are many methods used to forecast population, but one will choose
the best suitable method based on many factors such as engineering
experience, judgment, type of the region in which population to be
estimated and its location.

33
The factors which may cause the main change in population are :
- The rate of fertility (increase ).
- The rate of mortality (increase ).
- Migration (increase or decrease ).
- Economic considerations (increase or decrease ).
- Economic development (increase or decrease ) [21].
2.2.2.1 Engineering Method
This method gives a good projection . It is expressed mathematically as :
)1.2....(..................................................)1(0
n
t rPP +=
Where :
n: Number of forecasting years
Pt : the population at certain time in the future
P0: the present population
r : the population growth rate [22].
Future population estimates based on 1997 PCBScensus of population and
prescribed growth rate. Estimation of growth rates are based on past
surveys of population growth rates in the West Bank between 1967 and
1992. These surveys indicate that these rates generally flocculated between
1 to 3 percent[23].
The decrease of the overall population was attributed to the combined
effect of Palestinian Intifada which began in 1987.
2.2.3 Population forecasting for Az-Zubaidat Village
By applying equation number (1.6) of engineering method :

34
P = Po(1+r)n
P(2007) = P(1997) (1+r)10 → 1357 = 968(1+r)10 → r = 3 %
P(2036) = P(2007) (1+r)29 → P(2036) = 1357(1+0.03)29 → P(2036) = 3197
Based on" Guidelines on technologies for water supply system in small
communities ", published by WHO on 1993. Water demand is 150L/C/D (
minimum WHO demand for house connections in small communities ).
Targeted average consumption rate is to be 150L/C/d so ;
Total demand = population * capita demand
= 3197 capita * 150 dC
L
. = 479679.2 L/d ≈ 480
d
m3
Engineering method would be used in our project because there are only
two census of the population in Palestine in 1997 and 2007 and this method
applies to them, while the other methods need more than two population
analyzes ( three or more) in order to apply them.

35
Chapter Three
Design of Reverse Osmosis Desalination Plant

36
3.1 Definitions
3.1.1 Osmosis and reverse osmosis principles
Osmosis is a naturally occurring phenomenon and one of the most
important processes in nature. It is a process where a weaker saline solution
will tend to migrate to a strong saline solution. Examples of osmosis are
when plant roots absorb water from the soil and our kidneys absorb water
from our blood. Figure(3.1) shows the osmosis principle. A solution that
is less concentrated will have a natural tendency to migrate to a solution
with a higher concentration[24].
Figure (3.1): Osmosis principle [24].
Semi-permeable membrane is a membrane that will allow some
atoms or molecules to pass but not others.

37
Reverse Osmosis is a technology that is used to remove a large
majority of contaminants from water by pushing the water under
pressure through a semi-permeable membrane[24].
Reverse osmosis is the contrary of osmosis process. The osmosis
process happens without need any energy assistance while the reverse
osmosis process needs energy to the more saline solution. The
membrane of the reverse osmosis process is a semi permeable
membrane that allows the water molecules to pass through but doesn't
allow of dissolved salts, organics and bacteria to pass[24].
The energy required in reverse osmosis process as a pressure to push
the water through the membrane that must be greater than the naturally
osmosis in order to allow pure water and to hold back the
contaminants. Figure(3.2) shows the reverse osmosis process when the
pressure applied in the concentrated side, the water forced and pass
through the membrane while the contaminants prevented[24].
Figure (3.2): Reverse Osmosis principle[24].

38
A high pressure pump will be used in the reverse osmosis process to
increase the pressure in the concentrated side in order to force the
water molecules to cross the membrane and almost all dissolved solids
will be left the system in the reject stream. If the concentration of the raw
water increases the pressure required to the process will be increased.
The stream of the water that doesn't allow to cross the membrane is
called the reject stream (or concentrate) while the water that allow to
cross the membrane is called permeate (or product) water[24].
3.1.2Desalination technologies
There are many desalination processes that used membrane on industrial
field; the membrane processes include reverse osmosis, nanofiltration,
ultrafiltration and microfiltration. Differences among these processes are
shown below, where:
- Microfiltration operates on a particle size of 0.15 µm.
- Ultrafiltration operates on a particle size range of 0.15 to 5*10-2 µm.
-Nanofiltration operates on a particle size range of 5*10-2 to 5*10-3 µm.
-Reverse osmosis operates on a particle size range of 5*10-3 to 10-4 µm.
The difference between all filtration processes and RO is for separation
mechanism, the separation of the filtration processes membrane made as
sieving that retains the large particles and pass the smaller one while in RO
the membrane allow to pass the solvent and prevent the solute.

39
All filtration techniques are used to remove the suspended materials, but
the reverse osmosis process is used to remove dissolved salts and nano-
filtration is used for partial softening of water [21].
3.2 RO Membranes
There are two major commercial types of RO membranes include Cellulose
Acetate (CA) and Polyamide(PA).
The membrane is a semi permeable thin film of polymeric material with
thousands angstroms thick of polymeric porous material, the life time of
the membranes varies between 3 to 5 years depends on the inlet water
quality and the pretreatment system efficiency[25].
3.2.1 Cellulose Acetate Membranes
The CA membranes made from diacetate and triacetate cellulose, the
separation process mechanism is to remove the solvent material by
evaporation.
The structure of CA membranes with a surface layer of 0.1 to 0.2 micron is
responsible for the salt removal. The membrane film is very porous with
high solution permeability. The variations in temperature is responsible to
control the amount of water flux and salt rejection[25].
3.2.2 Composite Polyamide Membranes
The PA membrane has two layers, one is a porous support layer while the
other is a semi-permeable layer.

40
The PA membrane is higher water flux and lower salt pass than CA
membrane, In addition to, PA membrane is stable with wide pH range than
CA membrane but CA membrane is less degradation of exposure to free
chlorine than PA membrane.
When the feed water has high fouling such as surface water supplies, so
CA membrane is more applicable than PA membrane because the surface
of CA membrane is more stable to free chlorine [26].
3.3Membrane Modules
The two major membrane module (membrane element and pressure vessel)
used for reverse osmosis applications are hollow fiber and spiral wound.
Other types, which include tubular, plate and frame are used in the food
and dairy industry.
3.3.1 Hollow Fine Fiber
This type of membrane is a fine form of hollow fibers, that made from
cellulose or non cellulose material with inside diameter of 42µm and
outside diameter of 85µm.
Figure (3.3) shows thatthere are millions of fine fibers collected into a
bundle, also there are some plastic tubes work as inlet water distributer, in
addition to, there are two ends stream one for permeate water and the other
for concentrated water[27].

41
Figure (3.3): Hollow fiber membrane[27].
There is a cylindrical shell flows in radial movement inside the hollow
fiber membrane that used to collect the permeate water that come from the
pressurized feed water through the fiber bundle and exits to the permeate
stream.
Hollow fiber modules required feed water of better quality (low
concentration of suspended solids) than the spiral wound module
configuration[27].
3.3.2 Spiral Wound
Figure (3.4) shows the spiral wound membrane components, it consists of two
flat sheets separated with spacer sheet, all three sheets are wound around a
permeate tube that has many bores to collect the permeate water[27].

42
Figure (3.4): Spiral wound membrane module[27].
The feed water flow axial through the element, running parallel to the
surface of membrane. The spacer make turbulence and reduce
concentration polarization.
Recovery is responsible for the length of water feed path, the spiral system
usually has many stages with three to six membrane elements connected in
series in a pressure vessel. The brine stream from the first element becomes
the feed to the next element within the pressure vessel while the brine
stream from the last element exists to waste.
But the treatment water (permeate) from each element enters the permeate
collector tube and exists to permeate stream. The recovery of a single
pressure vessel will be operated up to 50% under normal conditions.
3.4 Passes and Stages in RO System
3.4.1 Single and Double Pass RO
Figure (3.5) shows the single pass RO process lines, the permeate stream is
the water that will be distributed to the customer directly[28].

43
Figure (3.5): Single pass RO [28].
While Figure (3.6) shows a double pass RO process lines, the permeate
stream from the first pass becomes the inlet to the second pass so, the
water from a double pass process is higher quality than a single pass [28] .
Figure (3.6):Double pass RO[28].
3.4.2 One and two stages of RO system
In one stage system, there is one stream for each feed, concentrate and
permeate water as shown in Figure (3.7)[29].

44
Figure (3.7): One-stage RO system[29].
While in two stage system, the concentrate from the first stage becomes the
inlet to the second stage in order to increase the recovery and the permeate
stream for all stages will be collected together as shown in Figure (3.8)[29].
Figure (3.8): Two-stage RO system[29].
Array
An array describes the arrangement of RO membrane in pressure
vessel, each pressure vessel contains from one to six membranes. Each
stage has unlimited amount of pressure vessels. The reject stream from
each stage becomes the inlet stream for the next one and so on[30].
Second Stage First Stage

45
From Figure(3.8) the system is 2:1 array that means the two pressure
vessels reject stream becomes the inlet stream for the next one vessel.
Recovery
The recovery is the ratio of permeate flow to feed flow.
The relation between recovery rate and the number of stages is shown in
Table 3.1:
Table (3.1): the number of stages of RO system and the recovery
rate [30].
Number of stages Recovery rate ( %)
One < 50
Two > 50 and < 80
Three > 80 and < 90
3.5 Reverse osmosis Performance & Design Calculations
In RO system, there are a number of terms that includes :
- Operating pressure
- Rejection
- Recovery
The design of RO system depends on the quality of the feed water specially
the salinity. Figure (3.9) shows a flowchart of an RO desalination plant
components.

46
Figure (3.9):Flowchart for RO desalination plant[31].
Where ST stands for Storage tank, TP- M1 stands for transfer motor pump,
MMF stands for multimedia filter, AT stands for anti scaling tank,
AP stands for antiscaling pump, CF stands for cartridge filter,HP-M2
stands for HP motor pump (RO), RO stands for RO vessels (contain the
membranes element) and DT stands for distribution tank.
3.5.1 Osmotic and Operating Pressure
The concentration of dissolved salts of a solution is determined
experimentally in order to determine the osmotic pressure(π). The osmotic
pressure is determine by the following equation:
π = R T ∑ Xi……………… (3.1)
where π stands for the osmotic pressure (Kpa),T stands for the temperature
(K),R stands for is the universal gas constant, 8.314Kpa.m3/kg.mol.K and
∑Xi stands for is the concentration of all constituents in a solution
(kg.mol/m3).
An approximation for π may be made by assuming that 100ppm of (TDS)
equals to 75.84Kpa (≈0.76bar) of osmotic pressure[30].

47
On 7/11/2016,a water sample that was taken from Az-Zubaidat Village
water well. In that sample we found that Total Dissolved Solids (TDS)
equals to 2100ppm so, the osmotic pressure will be:
π =(2100 *0.76)/1000 = 1.6bar
The operating pressure must be overcome the effects of friction losses of
pipes, resistance, Osmotic and permeate pressure in order to a achieve the
economic permeate flow rate.
3.5.2 Rejection
The rejection of salt is known by this formula :
)2.3.......(%.........100*)1(f
p
C
CSR −=
Where SR stands for salt rejection, Cp stands for Permeate concentration
and Cf stands for feed concentration
The rejection of salt values (TDS) for many membrane at this period above
99% for sea and BW membranes[30].
3.5.3 Permeate Recovery
Recovery is very important parameter in design and operation of RO plant,
the recovery is determined by the following formula:
)3.3.........(..........%.........100*)('f
p
Q
QR =
Where R' stands for recovery, Qp stands for permeate water flow rate and
Qf stands for feed water flow rate.
As the recovery rate increases, the salt concentration on the feed-brine side
of the membrane increases, which causes an increase in salt flow rate

48
across the membrane. In addition, a higher salt concentration in the feed-
brine solution increases the osmotic pressure[30].
3.6 Desalination plant components
The components of RO system are :
- Inlet water unit
- Water transfer unit
- Pretreatment units
- Pressure pumping unit
- Membranes unit
3.6.1 Inlet water unit
The source of feed water quantity and quality is the most important
parameter in the design of RO system.
In our project, water supply will be Az-Zubaidat Village water well which
has a capacity of 120m3/hr, and TDS of 2100ppm, Az-Zubaidat well water
will be pumped to storage tank as feed water to RO system.
3.6.2 Water transfer unit
In this unit, there is a pump used to transfer water from the feed unit( ST)
through the pretreatment filters. The osmotic pressure of the system is 1.6
bar depends on the value of TDS. Taking into account the drop from the
filters system so, taking a safety factor of 1.1.

49
Head loss in media filter:
The head loss during multimedia filter can be determined using Rose
equation: [21]
( ))4.3.....(....................
'*
**
'**067.14
2
d
C
g
DVahL D
=
Where hL stands for frictional head loss through, Va stands for approach
velocity, D' stands for depth of sand filter and CD stands for drag force
coefficient, ϕ stands for shape factor, g stands for acceleration of gravity,
stands for porosity and d' stands for diameter of sand grains
The main parameters for anthracite and sand layers that will be used to
calculate the friction head loss through the filter are shown in Table (3.2).
Table (3.2): Main parameter for dual-media filter
Sand Anthracite Parameter / granular
Type 0.4 0.8 Mean Diameter of granules(mm)
0.45 0.55 Porosity
2.65 1.75 Specific Gravity
0.5 0.4 Depth(m)
0.73 0.82 Shape factor ( )
0.4*0.4 0.4*0.4 Width * length (m)
)5.3.........(....................036.0
86400*4.0*4.0
500
)()(
3
=
==s
m
d
smm
d
m
A
QsandVaa
s
)6.3.(..............................18.1310*9
036.0*0004.0*73.0**)Re()(
7===
−
Vadsandb
)7.3...(..........99.234.018.13
3
18.13
2434.0
Re
3
Re
24)(
5.05.0=+
+
=+
+
=DCc

50
( )m
s
ms
m
d
C
g
DVahLd D 8.15
0004.0
99.2*
45.0*)(81.9*73.0
5.0*)(036.0*067.1
***
'**067.1)(
4
2
2
4
2
==
You can do the same steps (a-d) to calculate the head loss for anthracite.
The main results that calculated for anthracite and sand layers are shown in
Table (3.3).
Table (3.3): Main results for dual-media filter
Sand Anthracite variable / granular type
0.036 0.036 Va(m/s)
13.18 23.47 Re
2.99 1.98 CD
15.8 2.11 hL(m)
( ) )(14.0)500(*0195.0*0195.03
5.05.0filter
d
mQfN ==
==
Total head loss during multimedia filter = 15.8+2.11 ≈18m *1.1 (safety
factor) = 20 m
Water transfer pump specified as follows:
The output flow rate is 32m3/hr at 20m head with about 2bar (each bar is
equal to 10.2m head).
The main dimensions for feed water tank that will be used to calculate the
friction head loss through are shown in Figure (3.10).
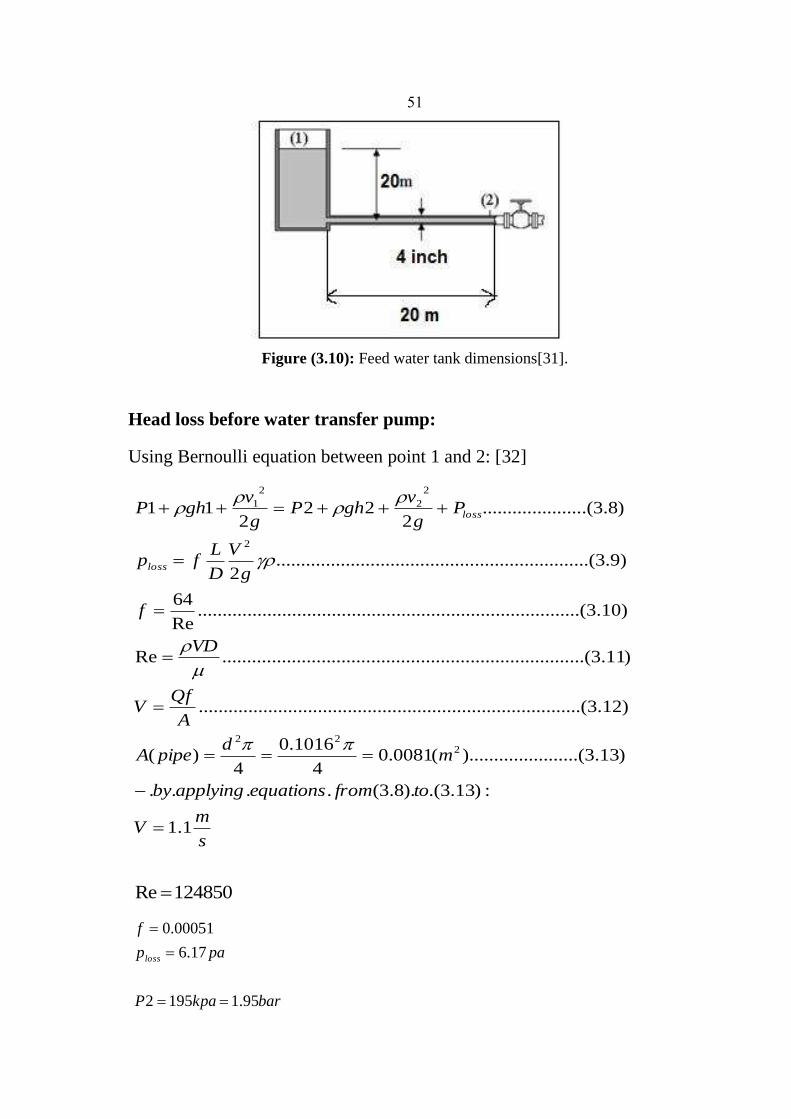
51
Figure (3.10): Feed water tank dimensions[31].
Head loss before water transfer pump:
Using Bernoulli equation between point 1 and 2: [32]
s
mV
tofromequationsapplyingby
md
pipeA
A
QfV
VD
f
g
V
D
Lfp
Pg
vghP
g
vghP
loss
loss
1.1
:)13.3.().8.3(....
)13.3...(..........).........(0081.04
1016.0
4)(
)12.3.......(......................................................................
)11.3...(......................................................................Re
)10.3.......(......................................................................Re
64
)9.3...(............................................................2
)8.3.(....................2
222
11
222
2
2
2
2
1
=
−
===
=
=
=
=
+++=++
124850Re =
barkpaP
pap
f
loss
95.11952
17.6
00051.0
==
=
=

52
Power needed for water transfer pump:
wattheadQfg
wattPw 4140***
)(1 ==
for more details see appendix A1
The main specifications of suggested water transfer pump (Figure 3.11)
are: [33]
❖ Pump type :CM50-125A / Pentax company / made in Italy
❖ Material : Iron
❖ Q/ H performance : maximum flow 72 m3/hr , H: 24.5 m
❖ Supply voltage :400 volt
❖ Motor power : 4.2 Kw (5.5 hp)
❖ Efficiency : 0.42
Figure (3.11): Water transfer pump[31]
3.6.3 Pretreatment unit
Due to equilibration times, adsorption and filtration actions of soils in the
aquifer, well water have low turbidity and Silt Density Index(SDI)
compared with surface water from rivers, lakes and ponds. Surface water in

53
contrast have high turbidity, SDI and natural organic matter derived from
abundance of biotic life.
The proper pretreatment of raw water to make it compatible as feed water
to RO must involve a total system approach for continuous, consistent and
reliable operation.
Pretreatment is very important step that increase the efficiency and life
expectancy of the membrane element by reducing fouling and scaling[34].
Due to the earth's geological layers before reach to ground water, the
pretreatment system consists of sand or dual filter, inhabitation system and
cartridge filters.
Screening (media filter):
Sand filters remove only relatively large solids (normally in the range of 40
micron and larger).
Removing suspended solids smaller than 40 microns requires filters with
either two or three layers of filter media. These are referred to as dual-
media filters or multi-media filters. When sized properly and with the
correct configuration of filter media, these filters can remove suspended
solids as small as 5 micron.
Media filter consist of dual layer filter ( sand and anthracite filter) that used
to remove suspended and colloidal solids that may found in well water with
small quantities[35,36].
The main specifications of dual-media filter are:
❖ The grain size: 0.5 mm (fine sand ) is and 0.8 mm ( anthracite).
❖ Column : armored fiber glass

54
❖ Column dimension : 16 inch * 65 inch[39]
The components of dual media filter are shown in Figure (3.12).
Figure (3.12): Dual-media filter[31].
Scale inhibitor
RO antiscalants, sometimes called scale inhibitors, are specialized chemical
formulations that are added to increase the solubility of sparingly soluble
salts. In reverse osmosis system Calcium Carbonate (CaCO3), Calcium
Sulfate (CaSO4), Strontium Sulfate (SrSO4), Barium Sulfate (BaSO4) and
Calcium Fluoride (CaF2) are the most common scales of concern. The use
of such antiscalants can form an essential component in the operation of
well-run reverse osmosis systems[34].
The most scale inhibitors used commonly are sodium hexametaphosphate
(SHMP), organophosphonates and polyacrylates.
Organophosphonates are more effective and stable than SHMP. They act as
antifoulants for insoluble aluminum and iron, keeping them in solution.

55
Polyacrylates are generally known for reducing silica scale formation via a
dispersion mechanism. Polymeric organic scale inhibitors are also more
effective than SHMP.
If the operating recovery in RO brackish water plants above 35% then a
scale inhibitor is recommended [37].
RO scale inhibitor that have been expertly developed to meet the following
criteria:
❖ Safe to handle and safe in use.
❖ Good scale prevention properties.
❖ Membrane compatibility.
❖ Stable and effective across a wide pH range.
❖ Compatibility with other products.
❖ Cost affectivity.
The main specifications of inhibitor pump ,Figure (3.13), are :
❖ Material of pump : PVC
❖ Maximum flow rate : 2(L/hr)
❖ Maximum head : 50 m
❖ Voltage : 220 v
❖ Power : 0.5 kW
❖ Pump efficiency : 0.42[33].

56
Figure (3.13):Antiscalant pump[31].
Cartridge filter (CF):
A melt blown filter cartridge is a "depth" type filter that is good for the
removal of relatively uniform sized particles throughout the body of the
filter.
The cartridge filter is the last defense for protecting the membrane
elements, it has a minimum pretreatment so it doesn't considered as a basic
pretreatment element even for ground water sources [38,39].
Two filters will be installed in the system each of 40inch in length and 2.5
inch in diameter.
There are four basic types of filter cartridges:
❖ Melt Blown (Solid) Filter Cartridges
❖ String Wound Filter Cartridges
❖ Pleated Filter Cartridges
❖ Media Cartridges: Activated Carbon(GAC), Alumina and more.
There were many applications for filter cartridges such asdrinking water,
boilers, washing machines, pre-filtration in water treatment, seawater
desalination, process water and chemical processes[38].
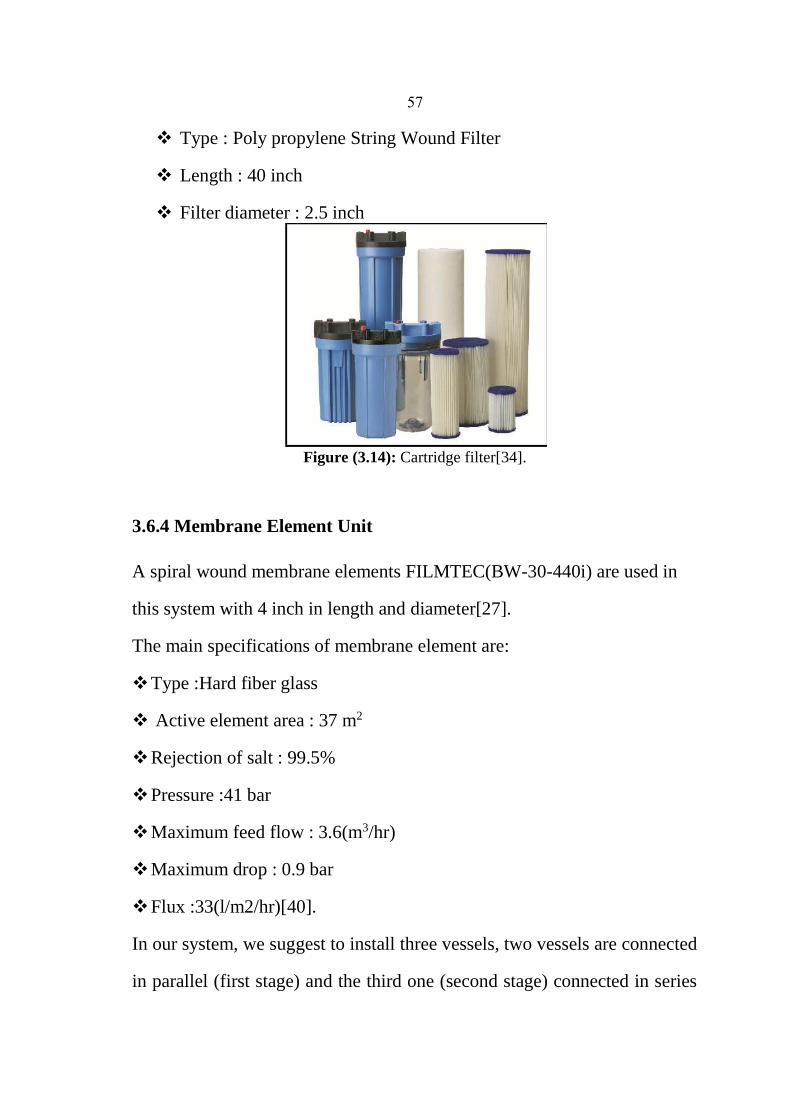
The main specifications of cartridge filter, Figure (3.14), are: [39]
57
❖ Type : Poly propylene String Wound Filter
❖ Length : 40 inch
❖ Filter diameter : 2.5 inch
Figure (3.14): Cartridge filter[34].
3.6.4 Membrane Element Unit
A spiral wound membrane elements FILMTEC(BW-30-440i) are used in
this system with 4 inch in length and diameter[27].
The main specifications of membrane element are:
❖ Type :Hard fiber glass
❖ Active element area : 37 m2
❖ Rejection of salt : 99.5%
❖ Pressure :41 bar
❖ Maximum feed flow : 3.6(m3/hr)
❖ Maximum drop : 0.9 bar
❖ Flux :33(l/m2/hr)[40].
In our system, we suggest to install three vessels, two vessels are connected
in parallel (first stage) and the third one (second stage) connected in series

58
as shown in Figure (3.15), each vessel contains six RO membrane elements
connected in series.
Figure (3.15): Two stages RO membranes[29].
Equations used in RO system:
There are many formula's used to design RO desalination plant, as shown
below:
elementelement
mhrm
L
m
L
hr
day
day
m
1806.17
)(37*/
33
1000*
24*500
a) ( area surface active *Flux
Qp = )(N' elements of(a)Number
2
3
3
=
=
)element 6 contains elEvery vess(36
18 vesselsof(b)Number vessel==
(c)Number of stages:
According to (Filmtec membranes) = 2 stages
%65100*32
8.20%100*covRe)( ==
=
f
p
Q
Qeryd
To achieve 65% recovery of 32 (m3/hr) feed water, 2:1 array could be used
where the first stage has two RO vessels, each operating at 16m3/hr and
40% recovery, while the second stage has one RO vessel operating at
19.2m3/hr and 40% recovery.

59
The permeate flow rate from the first stage would be:
(16 m3/hr) * (0.4) * (2 RO vessels) =12.8 (m3/hr).
The concentrate from the first stage (32(m3/hr)-12.8(m3/hr) )
= 19.2(m3/hr).
The permeate flow rate from the second stage would be:
(19.2 m3/hr) * (0.4) * (1 RO vessels) =7.7 (m3/hr).
The total permeate flow from the system would be: 12.8+7.7 =20.5 (m3/hr)
The recovery would be 20.5 (m3/hr) / 32(m3/hr) ≈ 65 %.
(f) Flow balance and mass balance:
Qf = Qp+Qc→ 32 = 20.8 + Qc→ Qc= 11.2 (m3/hr)
Qf * Cf = Qp*Cp + Qc*Cc → 32*2100 = 20.8*10.5 + 11.2*Cc → Cc =
5980.5 ppm [41, 42].
3.6.5 High pressure pumping unit
This pump is installed between cartridge filter and the RO membrane
elements; to pump water from the output of cartridge filter through the RO
vessels to distribution tank.
The feed flow is 32m3/hr and the operating pressure must be:
Operating pressure > permeate pressure + membrane resistance + friction
loss
Membrane resistance (pressure drop) = 0.9 bar (depends on type of
membrane element)
ppmCC
C
Cjectione p
p
f
p5.10
21001995.01Re)( =−=−=

60
Permeate pressure:
The main dimensions for water distribution tank that will be used to
calculate the friction head loss through are shown in Figure (3.16).
Figure (3.16): Water distribution tank dimensions[31].
Applying the same equations from (3.8) to (3.13):
Using Bernoulli equation between point 3 and 4:[32]
s
mVb
mpipeAa
A
QV
VD
f
g
V
D
Lfp
g
vghPP
g
vghP
P
loss
loss
77.0)(
)(0081.0)()(
Re
Re
64
2
22
2
2
2
3
33
2
4
44
=
=
=
=
=
=
++=+++
barbarpaPf
pape
fd
c
loss
393.2293125)(
33.4)(
00073.0)(
87637Re)(
3 ==
=
=
=

61
Operating pressure > (90000pa * 18 element ) +293117pa+ 4.33pa=
1913130 pa
Operating pressure > 19.1 bar ≈ 20 bar ≈200m (head) (10m ≈ 1 bar)
For RO pump:
)(4.41)(41399)(2 kwwattwattPw ==
For more details see appendix A2.
Power needed for antiscaling pump :
Pw3 = 0.35 kW ( from anti scaling pump specification )[33].
Total power(Plt) = Pw1+Pw2+Pw3 = 4.1 + 41.4+0.35 =45.540 kW/hr
Edl = Plt*td = 45.54(kW/hr )* 10(hr/day) = 455.4kW/day[43].
Each m3 need = 455.4 (kW/day) / 500 (m3/day) = 0.91kW/m3.

62
ChapterFour
Case Study: Az-Zubaidat Village

63
4.1 Introduction
In West Bank and Gaza strip, all types of fossil fuels are imported from
Israeli companies as well as most of the electrical energy.
The conventional sources of energy includes coal, petroleum and natural
gas. The main sources of conventional energies are fossil fuels. Nowadays,
many countries are used fossil fuels as a basic source of energy to meet
their requirement.
The Non-conventional sources of energy includes solar, geo-thermal and
wind energy that is considered as the energy of the future. There is
continuous research for developing these sources to make it more feasible.
4.2 The Case Study Load Profile
The total energy require in RO processes are the energy needs to transfer
water from feed tank to dual media filter and cartridge filter, the energy
required to add antiscalant to water, then the energy required to transfer
water from the output of cartridge filter through the RO vessels to
distribution tank and last the energy required to operate other process
controls and instruments.
The equipments of the RO desalination plant are shown in Figure (4.1).

64
Figure (4.1):Schematic diagram for RO desalination plant[31].
The amount of energy needed to operate the system is shown in Table(4.1):
Table (4.1) : Hourly load data
Name of items Power (kW)
Anti scaling pump 00.35
Transfer motor pump 04.10
High pressure motor pump 41.40
Others( air conditioner,
lightening ..etc)
05.00
Total hourly power = 51.00kW/hr
The system will be designed at the present need of water and at the present
amount of energy needed to operate the project.
The population at 2016 is 1798 capita and the demand of each capita is 150
(Liter/ day), so the total amount of water needs daily is 270m3, each m3
need 0.91kW, so the total amount of energy needs daily is 246kW.
Assumed the operating hours will be 24hr/ day, so the energy required to
operate the system will be 10.25kW/hr, but the energy consumed during the
day and night is different, so the distribution of water consumption will be
multiplied by a factor.
The Distribution of water consumption factor during day and night is
shown in Table (4.2) below [44].

65
Table (4.2): Distribution of water consumption during day and night
Hour 0-2 2-4 4-6 6-8 8-10 10-12 12-14 14-16 16-18 18-20 20-22 22-24
Factor 0.5 0.3 0.5 2.0 1.5 1.1 1.0 1.1 1.2 2.0 1.3 0.8
So the daily load during day and night in kW/hr is shown in Figure (4.2)
below.
Figure (4.2) : daily load in system of scenario 1 [31].
The proposed Scenarios for operating the proposed desalination plant
In general, there are two main scenarios for electrifications using renewable
energy sources which are standalone and grid connected systems.
In standalone systems the local electrical system is completely responsible
for feeding the load all over the day and because the renewable energy
sources are not constant all over the day a backup system is normally with
storage system. This system is preferable in this research because it gives
more independency from electrical grid which is owned by Israeli
companies.
The grid connected system in another scenario for supporting the electrical
load but it is not going to be studied in this research as it increases the
dependency on the Israeli electrical companies.

66
4.3 Standalone System
For many people, powering their homes or small business using a small
renewable energy system in not connected to the electricity grid called a
stand-alone system, makes economic sense and appeals to their
environmental values. Stand-alone systems generally take advantage of a
combination of techniques and technologies to generate reliable power,
reduce costs and minimize inconvenience[45].
Az-Zubaidat village region is located in C area that means it is under Israeli
occupation control, the source of energy (electricity) is only from Israeli
grid connection which can be disconnected at any time. This means that
standalone system will be more logical options[45].
The proposed stand alone system as shown in Figure (4.3) is mainly based
on renewable energies like PV and wind turbine in addition to diesel
generator which is used as a backup. The storage system using batteries is
utilized in such system as well and energy meters[45].
Figure (4.3): Schematic diagram of Standalone system[31].

67
The energy storage system is important parameter in standalone system as
renewable energy sources are not reliable at all the day[45].
The technical parameters of the proposed energy sources of the previous
configurations are illustrated below :
4.4 Photovoltaic system
The proposed systems are mainly depends on photovoltaic panels which is
the most important source of energy in our work.
4.4.1 Photovoltaic Panels (PV)
Palestine has a high solar energy potential and it's located between 34o:20' -
35 o:30' East and 31 o:10' - 32 o:30' North.
The solar radiation on horizontal surface varies from 2.65kWh/m2 per day
in December to 8.34kWh/m2 per day in June.
Photovoltaic(PV) system is able to supply electric energy to a given load by
directly converting solar energy through the photovoltaic effect. The system
structure is very flexible. PV module are the main building blocks, these can
be arranged into arrays to increase electric energy production[46].
The amount of solar radiation varies with the passage of time during the
day, solar cells can work between the hours of 6 a.m. to 6 p.m, after 6 p.m
the spare storage system will be used to compensate the shortage of PV
panels energy[46].

68
PV panels (solar cell) is an electronic devices that converts sunlight directly
into electricity characterized by an output voltage and current without the
need to heat the air or water.
There are two types of PV technology:
1. Crystalline.
2. Thin-film[47].
The following Figure (4.4) shows photovoltaic : cell, module and array :
Figure (4.4) : Photovoltaic system shape[48].
Cells : Films, thin squares, or discs of semiconductor device that convert
sun light into direct current DC electricity.
PV modules consists of PV cell circuits scaled in an environmentally
protective laminate and are the fundamental building block of PV system.
Panels : Include one or more PV modules assembled as pre-wired, field-
installable unit.
PV array is the complete power-generating unit, and that's a group of
modules that are electrically connected in series or in parallel.
PV modules are connected in series to obtain higher output voltages while
PV modules are connected in parallel to obtain greater current .

69
Stationary structures are usually used with flat-plate systems. These
structures tilt the PV array at a fixed angle and this angle is called tilt angle
(The angle between the sun irradiation rays and vertical lines)[48].
The tilt angle in the target area varies between 23o in summer and 45 oin
winter.
The maximum tilt angle to be 45 o as fixed mounting structures[46].
In the energy sources, they are designed at the current situation, all the
instruments of the energy system can be expanded when there will be
needed in the future; because if the system expanded to the requirements of
energy to 20 years ( project period ) the life of the instruments will be
decreased and the instruments will be damaged .
The population at 2016 is 1798 capita and the demand of each capita is
150Liter/day, so the total amount of water needs daily is 270m3, each m3
need 0.91kW.hr, so the total amount of energy needs daily is 246kW.hr.
This project must be effective year round, so it must be sized for the
months which receive the least sunlight per day in addition to night hours.
These months occur during the rainy season, from December to March, so
the spare storage system will be used to compensate the shortage of energy.
The solar radiation of Marjna'ja village is shown in Table(4.3):

70
Table (4.3) : The solar radiation of Marjna'ja village[46].
Month Solar radiation
(kw.hr/d/m2)
January 3.01
February 3.38
March 5.05
April 6.7
May 7.05
June 8.34
July 7.69
August 7.29
September 5.92
October 4.65
November 3.28
December 2.65
The solar radiation of Az-Zubaidat doesn't recorded but Marjna'ja is very
near to Az-Zubaidat village so it can be used in this project.
The specifications of PV panels that will be used in the project are :
− PV type : polycrystalline solar modules
− Electrical performance: 0.385 (watt/m2)
− Life time and warranty: 20 years
− PV price: 2 ($/watt )[49].
4.5 Wind turbine
Wind turbines are commercially common used on a wide range of
producing power.
Wind energy is another renewable energy source that could be used without
producing by-products that are harmful to nature. Like solar power,
harnessing the wind is dependent upon weather and location.

71
The fins of a windmill rotate in vertical plane, which is kept perpendicular
to the wind by means of a tail fin. As wind flow crosses the blades of the
windmill, it is forced to rotate and can be used to generate electricity[50].
Most of wind turbines have three bladed rotor as shown in Figure (4.5)
with horizontal axis type, but some of them have two blades to make them
lighter, more flexible and to reduce the cost[50].
Figure (4.5) : Photo of wind turbine[31].
The wind speed of Marjna'ja village is shown in Table (4.4):
Table (4.4) : The wind speed of Marjna'ja village[46].
Month Wind speed
(m/s)
January 1.025
February 0.8789
March 0.8789
April 1.2505
May 0.8727
June 0.9260
July 0.9288
August 1.044
September 0.6671
October 0.8153
November 1.0169
December 0.9087

72
The average wind speed is 0.934m/s, due to the position of the village (
under sea level), wind turbine is insufficient to produce energy; so it will be
omitted from the optimization of energy sources.
4.6 Batteries (Lead acid batteries)
Batteries store electricity for use during times that your system in not
producing electricity (the resource is not available).
The lead acid batteries typically used for systems of life time from 5 to 10
years. In addition to these batteries provide electricity over long periods
and can continuously charge and discharge up to 80% of their capacity for
its life period[51].
The stand-alone system need batteries to store power sufficient to meet the
system requirements during periods of cloudy weather, low wind or at
night time [51].
The size and number of batteries depends on the system desired using
HOMER program that will be shown in the next chapter[51].
The specifications of Batteries that will be used in the project are : [49]
-Battery type : mol battery(Lead acid battery)
-Battery size : 200 ampere , 12 volt , 2.4 (kWh)
-Battery price : 420 ( $ )
4.7 Inverter
The Direct Current (DC) electricity must first be converted to Alternating
Current (AC) electricity using inverters.The inverter does not produce any
power; the power is provided by the DC source.

73
An inverter converts the DC electricity from sources such as PV panels,
batteries and other sources to AC electricity. The electricity can be at any
required voltage; it can operate AC equipments[48].
The size and numbers of inverter depends on the system desired load (kW)
using HOMER program that will be shown in the next chapter.
For any future additional loads you want to enlarge the renewable energy
system components so, it is essential an inverter with a larger input and output
rating than you currently need to replace it with a larger one later[48].
The specifications of inverter, Figure (4.6), that will be used in the project
are : [49]
- Inverter type : VWM converter(stand alone installation)
- Inverter size : depending on PV size
-Life time:15 years
- Inverter price : 250 ( $/kW )
-Efficiency: 98%
Figure (4.6) : Photo of inverter[31].

74
Instrumentation
Includes meters and other instruments allow to monitor the energy sources,
system's battery voltage, the amount of power consumed …etc.
4.8 Diesel Generator
The most nonconventional source of energy that used widely specially in
petroleum states is fuel.
A diesel generator is the combination of a diesel engine with an electric
generator to generate electrical energy. A diesel compression-ignition
engine often is designed to run on fuel oil, but some types are adapted for
other liquid fuels or natural gas[52].
Diesel generating sets are used in places without connecting to a power
grid, or as emergency power-supply if the grid fails, as well as for more
complex applications such as those used in hospitals and water plant[52].
The plant brings generator sets online and takes them offline depending on
the demands of the system at a given time.
The size and numbers of diesel generator depends on the system desired
load (kW) using HOMER program that will be shown in the next chapter.

75
Figure (4.7) : Photo of diesel generator[53].
The specifications of DG that will be used in the project are : [49]
- DG type : Basic Diesel Generator
- DG size : depending on PV size .
-Cooling Method: Air Cooled
-Engine Model: 198f
- Frequency: 50Hz
- Life time : 15,000 (hr)
-Continuous work : 12 (hr)
- DG price : 100 ( $/kW )

76
Chapter Five
Optimization of power configurations for operating the
Reverse Osmosis desalination plant

77
There are different configurations going to be investigated in this research,
mainly :
1. Photovoltaic panels with batteries
2. Diesel generator with batteries
3. PV panels and diesel generator without batteries
4. PV panels and diesel generator with batteries
5. Diesel generator without batteries.
The above configurations are complicated as they include different systems
as shown in Figure (5.1), so to finding the optimum size of each component
is not easy, in this work we utilize special software that is specialized for
finding the optimum size of hybrid systems like HOMER program.
Figure (5.1): Schematic diagram of Standalone system (off-grid) configurations
5.1 Homer program
HOMER is the micro power optimization model, simplifies the task of
evaluating designs of both off-grid and grid-connected power systems for a
variety of applications[54].
Because there are large different variations in technology options such as
cost and energy sources that make the selection of the best technology is

78
complex so, HOMER's optimization make it easier to evaluate many
different configurations[54].
This model needs input data to make the simulation such as cost of
components, resources, types and the capacity. HOMER displays the
results in many tables and figures that make the comparison between
different configurations more easier [54].
HOMER makes the energy balance for each system configuration and
determine the feasibility for each one (if it is achieve the power demand)
also decides how and when to operate the generator and use the batteries.
In addition to it is determine the system cost for installing and operating the
processes over the life time of the project[54].
Hybrid systems compromises between some renewable energy sources that
used to supply with electrical power so, any reduction of power generation
from one source can be compensated directly from the other source to keep
the continuity of power supply.
Also the use of non conventional sources reduce the energy price for a long
period.
Different scenarios for energy storage are investigated in this research like
Lead acid batteries and Water distribution tank system.
5.2 Optimization using HOMER program
5.2.1 Stand alone system (off-grid)
Two scenarios will be discussed as storage system :
1- Chemical energy storage system(Lead acid batteries )

79
2- Water distribution tank system
In the first scenario, the storage system is lead acid batteries, the batteries
are designed to provide electricity over long periods, and can repeatedly
charge and discharge up to 80% of their capacity.
In addition to, when using Wind or photovoltaic stand-alone system the
batteries need to be used to store power sufficient to meet the system needs
during anticipated periods of cloudy weather, low wind or at night time.
But in the second scenario, a water distribution tank will be used to store
water in order to achieve demand. When the water level of storage tank
decreased, the system will operate to compensate the shortage of water at
any time during the day without using batteries.
All basic data of renewable energies is collected and input to HOMER
software in order to give the most economic, flexibility, efficiency and
reliability source (from five hybrid systems in this study) that will be used
to electrifying the project.
5.2.1.1 Chemical energy storage system (Lead acid batteries )
The batteries can be used as storage device and as alternative source of
energy when the power generation from the other sources of energy is
weak so, it is used to substitute the deficit.
The solar radiation from solar panels is stored in battery that will be used
specially during cloudy, rainy days and during the period of night.
The components of hybrid system are PV panels, DG, batteries and
converter as shown in Figure(5.2).

80
Figure (5.2) : Energy flow diagram of scenario 1

81
Table 5.1 shows the input data entered to the HOMER software.
Table (5.1) : Homer software input data for the optimal solution of scenario 1
component Size Life time Purchase
cost
($/kW)
Replacement
cost ($/kW)
Maintenance
cost ($/year)
Quantity
PV module
0, 1, 5, 10, 25, 35, 45, 50, 55 kW
20 years 2000 2000 100 ----
Diesel generator 0, 1, 5, 15, 20, 25 kW 15,000 hr 100 100 5 1
Battery Vision6FM200D
(12V,200Ah)
917 kWh 420 420 21 0, 1, 5, 10, 20, 25,
35, 40, 45
converter
0, 1, 10, 15, 20, 25, 30 kW
15 year 250 250 12.5 1
The price that shown in Table (5.1) is collecting from local market for the individual .

82
Optimization Result
HOMER makes many iterations for each configuration in order to gain
the optimal result for the hybrid energy system as shown in Figure (5.3).
Figure (5.3) :Optimization Result of system of scenario 1
Hybrid system results:
The amount of electricity produced by individual hybrid system is shown
in Table (5.2) below :
Table(5.2) : The output energy production of scenario1
production kWh/yr %
PV array 39,570 33
D.G 78,902 67
Total 118,471 100 %
It is noticed from the previous table that the Diesel generator is the base
load of this hybrid system with 67% participation of total generated
electricity.
Cost Summaries :
The Net present cost of hybrid system component type after HOMER
software simulation is shown in Figure (5.4).

83
Figure (5.4) : Cash summary by component type of system of scenario 1
The average amount of electricity produced monthly by this hybrid
system of PV and DG without using batteries is shown in Figure (5.5)
below which is obtained as a result after simulation.
Figure (5.5) : The amount of electricity produced monthly by hybrid system of
scenario 1
The five configuration systems of scenario 1 is explained in more details
and ordered from the most feasible to least one as following :
Configuration 1: The PV , diesel generator, battery and power
converter configuration, is the most feasible system for the many
iterations of PV-DG-battery and power converter systems which were

84
optimized with the HOMER program. The components of this system are
PV modules with 25kW, DG of 20kW, 4 batteries, and a 20kW converter.
The COE of this system is 0.462$/kWh and the Total Net Present Cost
(TNPC) is 550,921$ as shown in Table (5.3).
Table (5.3) : The net present cost for PV-diesel generator-battery-
power converter hybrid system of scenario1
Configuration 2:Diesel generator, battery and converter
The second economic system is a DG, battery and power converter. The
components of this system are DG with 20kW, 4 batteries and 10kW
converter.
The COE is 0.503$/kWh and the TNPC is 594,658$ as shown in Table
(5.4).
Table (5.4): The net present cost for diesel generator, battery and
power converter hybrid system of scenario 1

85
Configuration 3: PV, diesel generator and power converter
A PV, diesel generator and converter is the third economic system as
energy suppliers. The components of this system are PV modules with 35
kW, DG with 25kW, and 20kW converter.
The COE of this system is 0.529$/kWh and the TNPC is 636,430$
as shown in Table (5.5).
Table (5.5): The net present cost for PV, diesel generator and power
converter hybrid system of scenario 1
Configuration 4: Diesel Generator
A DG is the fourth economic system as energy suppliers with capacity of
25kW.
The COE of this system is 0.540$/kWh and the TNPC is 646,520$ as
shown in Table (5.6).
Table (5.6): The net present cost for diesel generator hybrid system
of scenario1

86
Configuration 5: PV, battery and converter
A PV, battery and converter is the least economic system as energy
suppliers. The components of this system are PV modules with 140kW,
480batteries and 50kW converter.
The COE of this system is 0.738$/kWh and the TNPC is 859,624$ as
shown in Table (5.7).
Table (5.7): The net present cost for PV, battery and power converter
hybrid system of scenario 1
The comparison between the five configuration systems of previous
scenario 1 is more explained in Table 5.8.

87
Table (5.8): comparison of various hybrid energy system of scenario 1 C
OE
($/k
Wh
)
NP
C ($
)
Op
eratin
g
cost($
)
Initia
l cap
ital
cost($
)
Con
verter
(kW
)
Battery
(nu
mb
er)
D.G
(kW
)
PV
mod
ule size
(kW
)
Con
figu
ratio
n
0.462 550,921 43,073 056,880 20 40 20 25 PVwith
batteries
0.503 594,657 51,367 005,480 10 40 20 0.0 DG with
batteries
0.529 636,430 48,887 075,700 20 0.0 25 35 PV and DG
without
batteries
0.540 646,519 56,149 002,500 0 0.0 25 0.0 PV and DG
withbatteries
0.738 859,624 32,627 485,400 50 480 0 140 DG without
batteries.

88
5.2.1.2 Water Distribution Tank System
In this scenario, the storage system is water distribution tank that will use
to store water in order to achieve demand, when the water level of storage
tank decreased, the system will be operate to compensate the needed
water during the sunshine hours without using batteries or with small
batteries.
There were different size of PV panels, diesel generator with different
capacities (kW) are considered in this study. A diesel generator is
designed to achieve the power demand.
The components of this system are PV, DG, batteries and converter as
shown in Figure (5.6).
Figure (5.6) : Energy flow diagram for the hybrid energy system of scenario 2
But the system will be designed at the present need of water and at the
present amount of energy needed to operate the project.
The population at 2016 is 1798capita and the demand of each capita is
150 Liter/ day, so the total amount of water needs daily is 270m3, each m3
need 0.91kW.hr, so the total amount of energy needs daily is 246kWh.
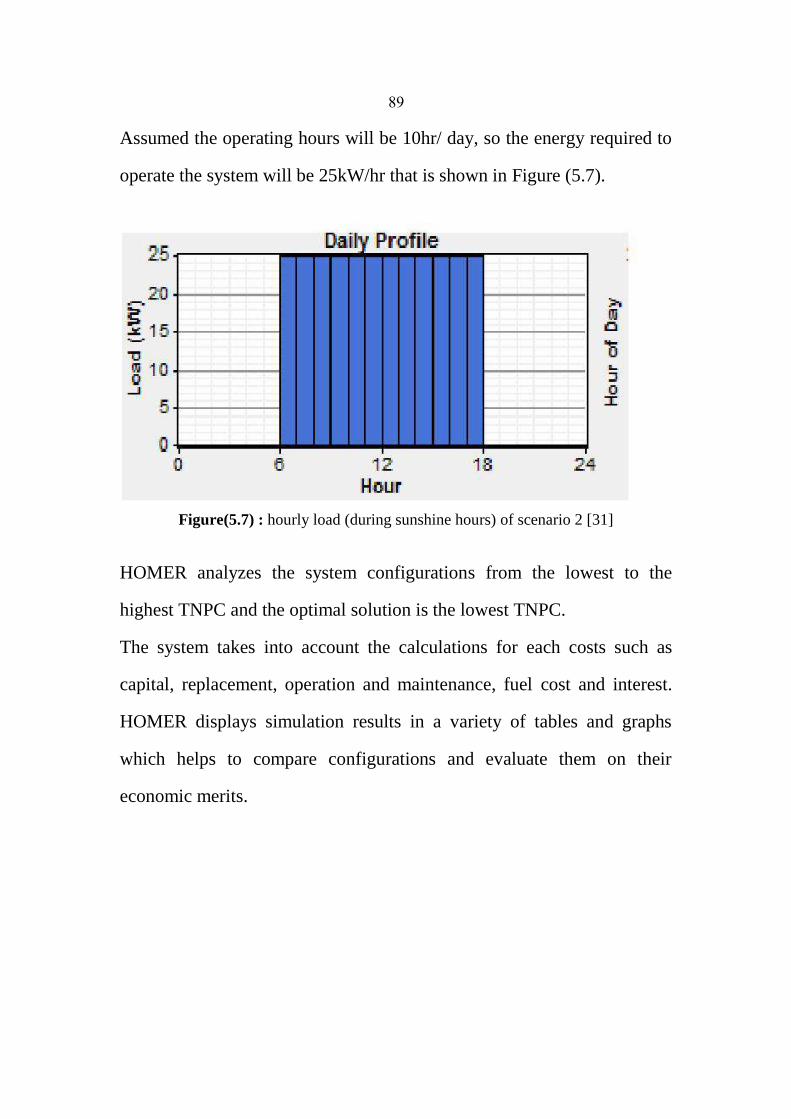
89
Assumed the operating hours will be 10hr/ day, so the energy required to
operate the system will be 25kW/hr that is shown in Figure (5.7).
Figure(5.7) : hourly load (during sunshine hours) of scenario 2 [31]
HOMER analyzes the system configurations from the lowest to the
highest TNPC and the optimal solution is the lowest TNPC.
The system takes into account the calculations for each costs such as
capital, replacement, operation and maintenance, fuel cost and interest.
HOMER displays simulation results in a variety of tables and graphs
which helps to compare configurations and evaluate them on their
economic merits.
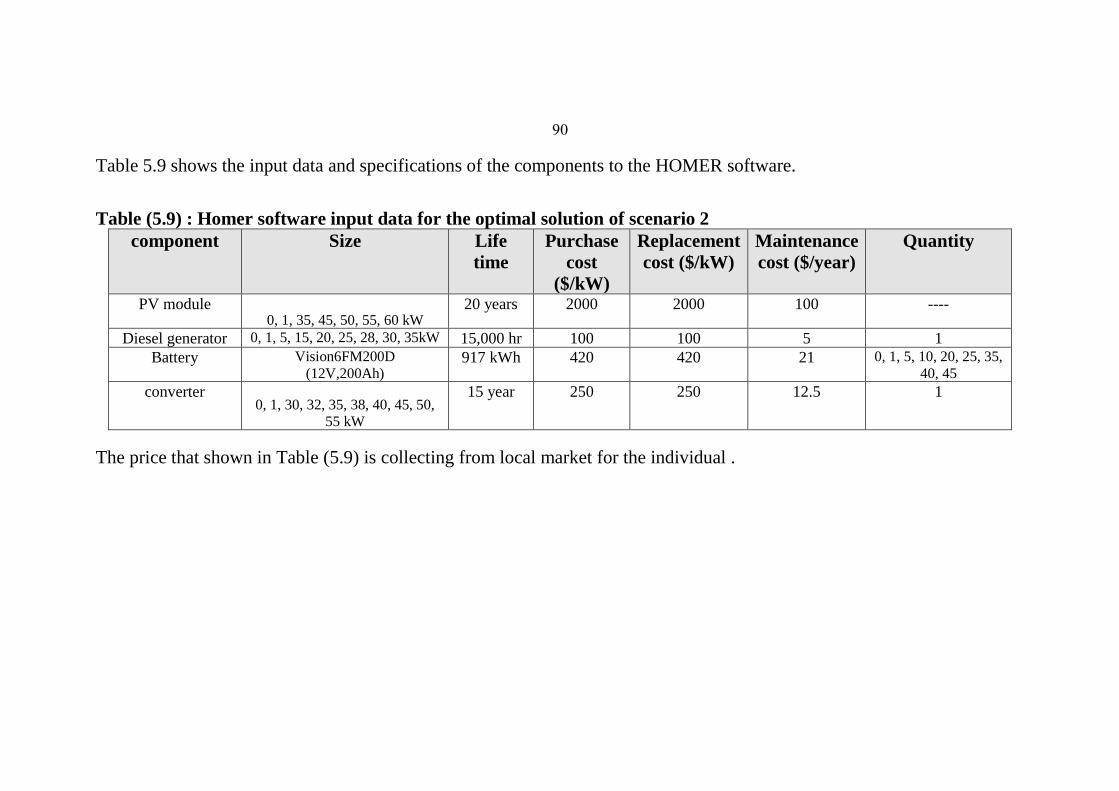
90
Table 5.9 shows the input data and specifications of the components to the HOMER software.
Table (5.9) : Homer software input data for the optimal solution of scenario 2
component Size Life
time
Purchase
cost
($/kW)
Replacement
cost ($/kW)
Maintenance
cost ($/year)
Quantity
PV module 0, 1, 35, 45, 50, 55, 60 kW
20 years 2000 2000 100 ----
Diesel generator 0, 1, 5, 15, 20, 25, 28, 30, 35kW 15,000 hr 100 100 5 1
Battery Vision6FM200D
(12V,200Ah) 917 kWh 420 420 21 0, 1, 5, 10, 20, 25, 35,
40, 45
converter
0, 1, 30, 32, 35, 38, 40, 45, 50,
55 kW
15 year 250 250 12.5 1
The price that shown in Table (5.9) is collecting from local market for the individual .

91
Optimization Result
HOMER makes many iterations for each configuration in order to gain
the optimal result for the hybrid energy system as shown in Figure (5.8).
Figure (5.8) :Optimization Result of system of scenario 2
The amount of electricity produced by individual hybrid system is shown
in Table (5.10) below :
Table(5.10): The output energy production of scenario 2
production Kwh/yr %
PV array 87,053 67
Generator 44,930 34
Total 131,983 100
It is noticed from the previous table that the PV panels is the base load of
this hybrid system with 67% participation of total generated electricity.
Cost Summaries :
The Net present cost of hybrid system component type after HOMER
software simulation is shown in Figure (5.9).

92
Figure (5.9) : Cash summary by component type of system of scenario 2
The average amount of electricity produced monthly by this hybrid
system of PV and DG without using batteries is shown in Figure (5.10)
below which is obtained as a result after simulation.
Figure (5.10) : The amount of electricity produced monthly by hybrid system of
scenario 1
The five configuration systems of scenario 2 is explained in more details
and ordered from the most feasible to least one as following :
Configuration 1: The PV, diesel generator, battery and power
converter configuration, is the most feasible system for the many
iterations of PV-DG-battery and power converter systems which were

93
optimized with the HOMER program. The components of this system are
PV modules with 55kW, DG of 25kW, 20 batteries, and a 45kW
converter.
The COE of this system is 0.348$/kWh and TNPC is 432,717$ as shown
in Table (5.11).
Table (5.11) : The net present cost for PV-diesel generator-battery-
power converter hybrid system of scenario 2
Configuration 2:PV, diesel generator and converter
The second economic system is a PV, DG, and power converter. The
components of this system are PV modules with 45kW, DG with 25kW,
and 30kW converter. The COE of this system is 0.385$/kWh and the
TNPC is 470,339$ as shown in Table (5.12).
Table (5.12): The net present cost for PV-diesel generator- power
converter hybrid system of scenario 2

94
Configuration 3:Diesel generator, battery and power converter
A DG battery and converter is the third economic system as energy
suppliers. The components of this system are DG with 30kW, 4 batteries
and 1kW converter.
The COE of this system is 0.444 $/kWh and the TNPC is 540,441$
as shown in Table (5.13).
Table (5.13): The net present cost for diesel generator, battery and
power converter hybrid system of scenario 2
Configuration 4: Diesel generator
A DG is the fourth economic system as energy suppliers with capacity of
35kW.
The COE of this system is 0.449$/kWh and the TNPC is 556,032$ .
Table (5.14): The net present cost for diesel generator hybrid system
of scenario 2

95
Configuration 5:PV, battery and converter
A PV, battery and converter is the least economic system as energy
suppliers. The components of this system are PV modules with 150Kw,
300 batteries and 50kW converter.
The COE of this system is 0.564$/kWh and the TNPC is 675,182$ .
Table (5.15): The net present cost for PV, battery and power
converter hybrid system of scenario 2

96
The comparison between the five configuration systems of previous scenario 2 is more explained in Table 5.16.
Table (5.16) : comparison of various hybrid energy system of scenario 2
COE
($/kWh)
NPC
($)
Operating
cost($)
Initial
capital
cost($)
Converter
(kW)
Battery
(number)
D.G (kW) PV module size
(kW)
Configuration
0.348 432,717 26,863 124,600 45 20 25 55 PV and D.G
with batteries
0.385 470,339 32,654 95,900 30 0 25 45 PV and D.G
without
batteries
0.444 540,441 46,684 4,980 1 4 30 0 DG with
batteries
0.449 556,032 48,172 3,500 0 0 35 0 DG without
batteries
0.564 675,182 21,394 429,800 50 300 0 150 PV with
batteries

97
5.2.2 Grid Connection (on grid)
Electrical grid is an interconnected network for delivering electricity from
suppliers to consumers. It consists of generating stations that produce
electrical power, high-voltage transmission lines that carry power from
distance sources to demand centers, and distribution lines that connect
individual customers.
Power stations may be located near a fuel source, at a dam site, or to take
advantage of renewable energy sources, and are often located a way from
heavily populated areas. The electric power which is generated is stepped
up to a higher voltage at which it connects to the electric power
transmission network .
A grid-connected system allows to power our home, business or any
system with renewable energy during the year ( daily as well as
seasonally). Any excess electricity that produce is fed back into the grid.
When renewable resources are unavailable, electricity from the grid
supplies your needs, eliminating the expense of electricity storage devices
like batteries[55].

98
Chapter Six
Economic analysis and environmental impacts of
using reverse osmosis desalination plant powered by
different sources of energy

99
The project will be operated using several sources of energy. The
economic analysis and the environmental effects will be done to choose
the best source of energy.
The total project cost will be calculated as the present value of the
project, and includes all cost items expected during the assumed project
life of 20 years, the feasibility evaluation should take into account the
capital, operating and maintenance cost.
The initial investment including building construction, pumps, piping,
energy cabling and transformers, membrane, filters, plant design
electronic components and assembling. The cost of maintenance varies
between 5 to 10% from the capital cost, the main energy costs come from
the electric power needed to run the process pumps[56].
6.1 Economic analysis of using RO plant powered by PV panels and
D.G
The cost of PV panels, diesel generator, batteries, inverters and charge
controller are entered in HOMER program to give the cost of energy as
($/kW).
The cost of each component (capital cost), operating and maintenance
cost of the project are shown in Table (6.1).

100
Table (6.1): Direct capital cost of the project [33,49].
Component Quantity
(#)
Price
($)
Life time
(years)
Total
price ($)
Transfer pump 1 900 20 900
Dual filter 2 2000 5 4000
Cartridge filter 2 500 5 1000
Anti scaling pump 1 200 20 200
High pressure pump 1 10,000 20 10,000
RO membrane elements 18 700 5 12600
pipes , valves , gages 1 4000 20 4000
Installation 1 2500 20 2500
Electrical control panel 1 1200 20 1200
instruments 1 2000 20 2000
Direct capital cost of the project(DCC) 38700
Operating and maintenance cost ( 5 % of capital cost ) CO&M
land, storage tank and distribution tank are already available.
Economic analysis equations
Total Capital Cost (TCC) is equal to the sum of Direct Capital Cost
(DCC) and Indirect Capital Cost (ICC).
TCC ($) = DCC ($) + ICC($) ……………………….………….... (6.1)
The DCC includes all equipments and membranes .
The ICC includes constructions and well water cost , it is equal to 27 %
of DCC [57].
that means :
ICC($) = 0.27 * DCC ($) …………………………………………(6.2)
The Annual Operating and Maintenance Cost (OCO&M) is considered to
be the cost of labor, maintenance, chemical, membrane replacement and
insurance cost that equal to 5 % of the TCC : [57]
CO&M ($) = 0.05*TCC($…………………….…………..…………(6.3)

101
The operating cost is calculated in ($/year) as shown below :
OC =OCpower+ OCO&M+OC Mbne……………..……...…..…………(6.4)
OC power = the energy cost for each kilowatt ($/Kw) (using HOMER
program results)
OCO&M = 0.05 *TCC($)
Mbrn LT
Mbnen
(nb)*($/member) PriceOC = ……..……………....………………(6.5)
Where OC Mbrn stands for the operating cost of the membrane, nb stands
for number of membrane that will be used in the plant and nLTMbrn stands
for lift time of each membrane (years)[58].
The Annualized Capital Cost (ACC) in ($/year) is calculated using
chauvel formula : [59]
1)1(
)1(**)(
)(
)(
−+
+=
plantn
plantn
i
iiTCCACC …………………...…..…..…………(6.6)
Wherei stands for the interest rate (%) and n(plant) stands for the plant
life time (years).
The Total Potable Water Price (TWP) in ($/m3) is calculated by the
following equation :
plantplant LM
OCACCTWP
*365*
+= ………………………..…………..……(6.7)
Where Mplant stands for daily potable water production of the plant
(m3/day) and Lplant stands for load factor (85%)[60].

102
6.1.1 Water Distribution Tank system :
Using the same five cases that optimized by HOMER program in the
previous chapter (5), Table (6.2) shows the energy cost when the storage
system is water distribution tank.
Table (6.2): Energy cost when the distribution tank used as the storage system
COE
($/kWh)
Converter
(kW)
Battery
(number)
D.G
(kW)
PV
module
size (kW)
Configuration
0.348 45 20 25 55 PV and D.G with
batteries
0.385 30 0 25 45 PV and D.G without
batteries
0.444 1 4 30 0 DG with batteries
0.449 0 0 35 0 DG without batteries
0.564 50 300 0 150 PVwith batteries
Configuration 1: PV panels , D.G , Battery and converter
Applying the equations from (6.1) to (6.7) to calculate the cost of cubic
meter of water :
From table (6.1), DCC =38700 $
ICC($) = 10449$
So, TCC = 49149$
CO&M ($) = 2457.45$
• OC power =
year
$81.31208
•
=
year
$2520OCMbne
So ,OC = 36186.26 ($/year).

103
=
yearACC
$84.3943
=
3m
$479.0TWP
For more details see Appendix A3
Using the same equations from (6.1) to (6.7) to calculate the cost of cubic
meter of water for the other configurations :
TCC, DCC, ICC, MbneOC and OCO&M are fixed values for all the
configurations, the other results would be shown in Table (6.3) below :
Table(6.3) : The cost of cubic meter of water for the other
configurations of scenario 1 TWP
($/m3)
OC(power)
($/kW. year)
OC
($/year)
Configuration
0.479 31208.8 36186.26
PV and D.G with
batteries
0.518 34526.9 39504.44 PV and D.G without
batteries
0.581 39818.1 44795.59 DG with batteries
0.587 40266.5 45243.99 DG without batteries
0.710 50579.8 55557.25 PVwith batteries
From the previous table, The difference for the total water price between
the first four configurations and the last one is due to high prices of
generating power from use more batteries and big size of solar panels
that have high purchase cost; so the TWP would be higher than the other
four configurations.

104
6.1.2 Chemical energy storage system (Lead acid batteries )
Using the same five cases that optimized by HOMER program when the
storage system is batteries, Table (6.4) shows the energy cost when the
storage system is Lead acid batteries.
Table (6.4): Energy cost when the batteries used as the storage
system COE
($/kWh)
Converter
(kW)
Battery
(number)
D.G (kW) PV module
size (kW)
Configuration
0.462 20 4 20 25 PV with batteries 0.503 10 4 20 0 DG with batteries
0.529 20 0 25 35 PV and DG without
batteries
0.54 0 0 25 0 PV and DG with
batteries 0.738 50 480 0 140 DG without
batteries
Configuration 1: PV panels, D.G, Battery and converter
Applying the equations from (6.1) to (6.7) to calculate the cost of cubic
meter of water :
From Table (6.1), DCC = 38700 $
ICC($) = 10449$
So , TCC = 49149$
CO&M ($) = 2457.45$
• OC power =
year
$4.41432
•
=
year
$2520OCMbne
So ,OC =46409.84 ($/year)
=
yearACC
$84.3943

105
=
3m
$601.0TWP
For more details see Appendix A4
Using the same equations from (6.1) to (6.7) to calculate the cost of cubic
meter of water for the other configurations :
TCC, DCC, ICC, MbneOC and OCO&M are fixed values for all the
configurations, the other results would be shown in Table (6.5) below :
Table(6.5) : The cost of cubic meter for the other configurations of
scenario 2
TWP
($/m3)
OC(power)
($/kW.
year)
OC
($/year)
Configuration
0.601 41432.39 46409.841 PV with batteries
0.645 45109.29 50086.74 DG with batteries
0.672 47440.98 52418.43
PV and DG without
batteries
0.684 48427.47 53404.92
PV and DG with
batteries
0.896 66184.20 71161.65 DG without batteries
From the previous table,The difference for the total water price between
the first four configurations and the last one is due to high prices of
generating power from use more batteries and big size of solar panels
that have high purchase cost; so the TWP would be higher than the other
four configurations.

106
6.2 Environmental assessments
The life cycle inventory inputs and outputs of processes in any plant is
the total effects on our environment.
The inputs of RO desalination plant include raw material (water),
chemicals and source of electricity (energy) while the outputs are brine
water and emissions of greenhouse or any other gases.
The inputs of the project (water and chemicals) don't have any bad
effects because water is coming from the ground. The chemicals (anti
scalant) are used in small quantities and will be consumed totally to
prevent scaling.
The electricity consumed by the desalination processes is mostly
responsible of the total plant life cycle impacts. The energy cost is the
maximum cost of the operating cost in this project.
This study is focused on the use of most economic alternative energy
source and less environmental impacts.
There are many advantages of PV panels such as it operates in a long life
(20 years) with low maintenance, it generates energy without producing
any emissions or any bad gases and it operates silent[61].
The production of electricity may needed to use fuels ( like diesel
generator) which combustion emits CO2, thus have a bad effects on the
surrounding environment (air pollution).
Air pollution emissions from fossil fuels is the most energy related bad
impacts on human health that causes of morbidity and mortality in the
world compared with renewable energy technology.

107
The greenhouse gases emissions produced by the combustion of fossil
fuel of diesel generator during its lifetime are shown in Table (6.6).
The reduction in the renewable energy cost that can be used as energy
suppliers instead of fossil fuels is the penalty cost.
Table (6.6): The amount of gaseous emissions for diesel generator
over its lifetime.
On the other hand, brine discharge is one of the largest sources of
wastewater from the desalination plant, brine effluents have a strong
negative impacts on the environment due to their high concentration of
salts and other pollutant contents.
The physiochemical effects of rejected water are related to their salinity,
temperature and constituents that could change the physiochemical
properties of the receiving water. This change may have adverse effects
on marine life if it would be discharged to the nearest sea or spring [61].
It was reported that unconcerned disposal of reject brine water
(particularly into unlined ponds or pits) could create pollution of the
ground water and soil due to the increase of salinity that may decrease
plant and soil productivity[62].

108
Results and Conclusion
The input data are analyzed, characterized and tabulated systematically
using the HOMER software in order to determine the most economic
hybrid system of the five hybrid systems are proposed in this study.
Different scenarios for energy storage are investigated in this research
like Lead acid batteries and Water distribution tank system.
The analysis results from the Lead acid batteries scenario show that,
among five hybrid systems for supplying electrical requirements, the
most economical is PV modules with 25 kW, DG of 20 kW, 4 batteries,
and a 20 kW converter hybrid system, which has a Cost Of Energy (COE)
of 0.462 $/kWh and the cost of potable cubic meter is 0.601$/ m3.
The components of second economic system are the configuration that
includes the DG with 20kW, 4 batteries and 10kW converter. The COE is
0.503$/kWh and the cost of potable cubic meter is 0.645$/ m3.
The components of third economic system are the configuration that
includes the PV modules with 35 kW, DG with 25 kW, and 20 kW
converter. The COE of this system is 0.529$/kWh and the cost of potable
cubic meter is 0.672$/ m3.
The fourth configuration that includes only a diesel generator of 25kW.
The COE of this system is 0.540$/kWh the cost of potable cubic meter is
0.684$/ m3.
The configuration that includes PV modules with 140kW, 480 batteries
and 50kW converter has a COE0.738$/kWh. The cost of potable cubic
meter is 0.896$/ m3.

109
The results from the Water distribution tank scenario show that the most
economical system is PV modules with 55kW, DG of 25kW, 20 batteries,
and a 45kWconverter. The COE is 0.348$/kWh and the cost of potable
cubic meter is 0.479$/ m3.
The next feasible configuration is the that includes PV modules with 45
kW, DG with 25kW, and 30kWconverter. The COE of this system is
0.385$/kWh and the cost of potable cubic meter is 0.518$/ m3.
The COE obtained from the system includes DG with 30kWand 4
batteries is 0.444$/kWh and the cost of potable cubic meter is 0.581$/ m3.
The only DG configuration with 35kW Obtains a COE of 0.449$/kWh.
The cost of potable cubic meter is 0.587$/ m3.
The least economic system components are PV modules with 150kW,
300 batteries. The COE of this system is 0.564$/kWh and the cost of
potable cubic meter is 0.710$/ m3.
Recommendations
❖ It is recommended to use PV panels as major source of energy to
produce electricity for operating the plant.
❖ Studying the combination between the two scenarios(water
distribution tank and lead acid batteries) in order to get more accurate
and best results.
❖ Studying the use of another water desalination method and
comparison it with RO method.
❖ Studying the use of other sources of power such as grid connected
hybrid system.

110
References
1. Olivier Lorain, Berengère Hersant, Françoise Persin, Alain
Grasmick,Nathalie Brunard, Jean Michel Espenan, Ultrafiltration
membrane pre-treatment benefits for reverse osmosis process in
seawater desalting. Quantification in terms of capital investment cost
and operating cost reduction, Desalination 203 (2007) 277–285.
2. François Vince, François Marechalb, Emmanuelle Aoustina,
Philippe Bréanta, Multi-objective optimization of RO desalination
plants, Desalination 222 (2008) 96–118.
3. Lilian Malaeb, George M. Ayoub, Reverse osmosis technology for
water treatment, Desalination 267 (2011) 1–8.
4.Franz Trieb, Hans Müller-Steinhagen, Concentrating solar power
for seawater desalination in the Middle East and North Africa,
Desalination 220 (2008) 165–183.
5.Mohammed Rasool Qtaishat, Fawzi Banat, Desalination by solar
powered membrane distillation systems, Desalination 308 (2013)
186–197.
6.Maged A.I. El-Shaarawi, Hussain Al Awjan, Dawood Al
Ramadhan, Mustafa Hussain Effect of thermodynamic limitations
on PV initial cost estimations for solar-powered RO desalination,
Desalination 276 (2011) 28–37.
7.Fawzi Banat, Nesreen Jwaied, Economic evaluation of desalination
by small-scaleautonomous solar-powered membrane distillation

111
units Economic evaluation of desalination by small-scale,
Desalination 220 (2008) 566-573.
8. J. V. Benne, D. G. Jirka and J. Largier, Ocean brine disposal,
Desalination 97 (1994) , 365–372.
9.T. Hoepner, A procedure for environmental impact assessments
(EIA) for seawater desalination plants, Desalination 124 (1999), 1–
12.
10. W. R. Everest and T. Murphree, Desalting residuals: A problem
or a beneficial resource, Desalination 102 (1995), 107–117.
11.Mousa S. Mohsen, Jamal O. Jaber, (2001) ‘A photovoltaic-
powered system for water desalination’, Desalination volume 138
129-136.
12.Johannes H. Lindemann, Wind and solar powered seawater
desalination Applied solutions for the Mediterranean, the Middle
East and the Gulf Countries, Desalination 168 (2004) 73-80.
13.M.S. Mohsen and O.R. AI-Jayyousi, Reverse osmosis (RO)
supplied by photovoltaic (PV-RO),Desalination, 126 (1999) 163.
14. Sultan A. Kershrman, Seawater reverse osmosis powered Tom
renewable energy sources, Desalination 153 (2002) 17-23
15.S.F.Y.Yousef, Performance test and techno-economic evaluation of
a PV powered reverse osmosis brackish water desalination system in
west bank(2013).
16.W.F.A.Abdallah,Techno-economic Evaluation of BWRO Systems
for Brackish Water Desalination in the Jordan Valley(2016).

112
17. Applied Research Institute - Jerusalem (ARIJ). 2012. Water &
Environment Research Unit Database (WERU). Bethlehem -
Palestine.
18.Palestinian Central Bureau of Statistics, General Census of
Population, Housing and Establishments 1997 and 2007, retrieved
from: http://www.pcbs.gov.ps.
19.Group Christian Volunteers (GVC) & Food and Agriculture
Organization (FAO) (2011), retrieved from: http://www.gvcfao-
database.org.
20.Water demand definition, retrieved from :
http://www.waterhelp.org/index.php/article/2279
21.Mackenzie L. Davis, Water and waste water engineering, design
principles and practice, chapter 6, international edition 2011 .
22.Population forecasting methods, retrieved from :
http://www.aboutcivil.org/estimation-of-water-demand-population-
forecasting.html
23.Palestinian Central Bureau of Statistics, retrieved from :
http://www.pcbs.gov.ps/default.aspx
24.Reverse osmosis basics, osmosis and reverse osmosis, retrieved
from: http://www.toraywater.com/knowledge/kno_001_01.html.

113
25.European Polymer Journal, Synthesis, characterization and thermal
studies on cellulose acetate membranes, Volume 40, Issue 9,
September 2004, Pages 2153–2159.
26.Separation and Purification Technology, Surface modification of thin
film composite polyamide membranes, Volume 66, Issue 2, 20 April
2009, Pages 287–294
27.Water desalination technologies in the economic and social
commission for western Asia (ESCWA) member countries, chapter
3, United Nations, 2011.
28. Guidelines for the design of reverse osmosis membrane systems,
LANXESS Deutschland GmbH, Business Unit Ion Exchange
Resins, Chempark Leverkusen, Germany, October 2012.
29. Passes and stages in RO system, retrieved from :
http://www.puretecwater.com .
30.Hydranautics a Nitto Denko Corporation, Terms and Equations of
Reverse Osmosis, retrieved from :
http://www.membranes.com/docs/trc/termsequ.pdf
31. Taken by Ahmad Othman(researcher)
32. D.N.Roy, Applied fluid mechanics, Ellis Horwood series in
Mechanical Engineering, Chapter 3, 1987.
33.Alwadi Company for Mechanical Equipment, Nablus, Palestine .
34. American Membrane Technology Association (AMTA),
Pretreatment for Membrane Processes, Florida, February 2007,
retrieved from : www.amtaorg.com

114
35.Yekaterina Moran, Danielle Volpe " Green Reverse Osmosis
Pretreatment for Shipboard Desalination " B.Sc . Thesis presented to
Worcester Polytechnic Institute, USA, 2010.
36.Robert Y. Ning (2011). Pretreatment for Reverse Osmosis Systems,
Expanding Issues in Desalination, Trends and technologies, InTech,
retrieved from:
http://www.intechopen.com/books/expanding-issues-in-
desalination/pretreatment-for-reverse-osmosis-systems
37. Dow Water and process solutions " FILMTECTM Reverse Osmosis
Membranes " Technical Manual .
38. Cartridge filters application, Types of cartridge filters, retrieved
from:
http://www.lenntech.com/systems/sediment/cartridge/cartridge.htm
39.Ether Company for Technology Solutions, Solutions to water
problems, Industrial water filters, cartridge filter specification, Haifa
Street, Jenin, Palestine.
40. DOW FILMTEC™ BW30-400 Element, Spiral-wound element
with polyamide thin-film composite membrane, product
specifications, retrieved from :
http://msdssearch.dow.com
41.Terms and Equations of Reverse Osmosis, retrieved from :
http://www.membranes.com/doc/trc/termsequ.pdf
42.FILMTEC Membranes, The Steps to Design a Membrane System,
retrieved from: http://msdssearch.dow.com

115
43.Power of pumping water, retrieved from :
http://www.engineeringtoolbox.com/pumps-power-d_505.html
44. Palestinian Water Authority, Planning and Design Guidelines, 1
September 2000
45. Stand-alone system, additional equipments, retrieved from :
https://energy.gov/energysaver/grid-or-stand-alone-renewable-energy-
systems
46.Meteorological Palestinian, Amman Street , Nablus, Palestine .
47.Soteris A. Kalogirou, Seawater desalination using renewable energy
sources, solar energy system, Progress in Energy and Combustion
Science 31 (2005) 242–281
48. Appropedia, photovoltaic components, inverter, retrieved from :
http://www.appropedia.org/Photovoltaics#Photovoltaic_System_Compo
nents
49. Irrad Company for solar systems, Ein Misbah, Ramallah, Palestine .
50. Marcos S. Miranda and David Infield, A wind-powered seawater
reverse osmosis system without Batteries, Desalination 153 (2002)
9-16 .
51.Appropedia,photovoltaic components, batteries, retrieved from :
http://www.appropedia.org/Photovoltaics#Batteries
52.Diesel generator definition, retrieved from :
https://en.wikipedia.org/wiki/Diesel_generator
53. Diesel Generator, retrieved from : http://www.made-in-china.com

116
54. Homer program, introduction to homer, retrieved from
:www.homerenergy.com
55.Grid connection, retrieved from :
https://energy.gov/energysaver/grid-connected-renewable-energy-
systems
56. M.D. Afonso, J.O. Jaber and M.S. Mohsen, Desalination, 164
(2004) 157–171.
57. A. Malek, et al., Design and economics of RO seawater
desalination, Desalination, 105 (1996) 245–261
58.Y.-Y. Lu, et al., Optimum design of reverse osmosis system under
different feed concentration and product specification, J. Membr.
Sci., 287(2007) 219–229.
59. A. Chauvel, Manual of Process Economic Evaluation, TECHNIP,
August 2003.
60.Soteris A. Kalogirou , Seawater desalination using renewable
energy sources, Progress in Energy and Combustion Science 31
(2005) 242–281.
61. Roberts, D.A., Johnston, E.L. & Knott, N.A., Impacts of
Desalination Plant Discharges on the Marine Environment, A
Critical Review of Published Studies, Water Research, 44, pp. 5117-
5128, (2010).
62. Mohamed, A.M.O., Maraqa, M. & Al Handhaly, J., Impact of
Land Disposal of Reject Brine from Desalination Plants on Soil and
Groundwater, Desalination, 182, pp. 411-433, (2005).

117
Appendices
Appendix A1 : Head loss before water transfer pump calculations
Appendix A2 : High pressure pumping unit calculations
Appendix A3 : The cost of cubic meter water using Water Distribution
Tank Scenario
Appendix A4 : The cost of cubic meter water using Batteries Scenario

118
Appendix A1 : Head loss before water transfer pump calculations
Using Bernoulli equation between point 1 and 2: [29]
s
m
s
hr
m
hrmV
tofromequationsapplyingby
md
pipeA
A
QfV
VD
f
g
V
D
Lfp
Pg
vghP
g
vghP
loss
loss
1.13600
1*
0081.0
)/(35
:)13.5.().8.5(...
)13.5...(..........).........(0081.04
1016.0
4)(
)12.5.......(......................................................................
)11.5...(......................................................................Re
)10.5.......(......................................................................Re
64
)9.5...(............................................................2
)8.5.(....................2
222
11
2
3
222
2
2
2
2
1
==
===
=
=
=
=
+++=++
124850
10*89.0
1016.0*1.1*997
Re3
3
=
=−
s
pa
ms
m
m
kg

119
barkpaP
smm
kg
Pms
m
m
kg
Pg
vghP
g
vghP
pam
kg
s
m
sm
m
m
g
V
D
Lfp
f
loss
loss
95.11952
17.62
/2.1*997
020)20*81.9*997(0
222
211
17.6997*1*
81.9*2
/1.1*
1016.0
20*00051.0
2
00051.0124850
64
Re
64
2
3
23
2
2
2
1
3
2
22
==
+
++=+
+
+++=++
=
==
===
Power needed for water transfer pump:
watt
ms
hr
hr
m
s
m
m
kg
headQfgwattPw
414042.0
20*3600
1*32*81.9*997
***)(1
3
23
=
=
=

120
Appendix A2 : High pressure pumping unit calculations
Applying the equations from (5.8) to (5.13):
Using Bernoulli equation between point 3 and 4:[29]
s
m
s
hr
m
hrmVb
md
pipeAa
A
QV
VD
f
g
V
D
Lfp
g
vghPP
g
vghP
P
loss
loss
77.03600
1*
0081.0
)/(5.22)(
)(0081.04
1016.0
4)()(
Re
Re
64
2
22
2
3
222
2
2
3
33
2
4
44
==
===
=
=
=
=
++=+++
87637
10*89.0
1016.0*77.0*997
Re)(3
3
=
=−
s
pa
ms
m
m
kg
c

121
00073.087637
64
Re
64)( ===fd
barbarpaP
smm
kg
Pms
m
m
kg
g
vghPP
g
vghPf
pam
kg
s
m
sm
m
m
g
V
D
Lfpe
loss
loss
393.2293125
2
/77.0*997
033.40)30*81.9*997(0
22)(
33.4997*1*
81.9*2
/77.0*
1016.0
20*00073.0
2)(
3
2
3
323
2
3
33
2
444
3
2
22
==
++=++
+
++=+++
=
==
Operating pressure > (90000pa * 18 element ) +293117pa+ 4.33pa=
1913130 pa
> 19.1 bar ≈ 20 bar ≈200m (head) (10m ≈ 1 bar)
For RO pump:
watt
ms
hr
hr
m
s
m
m
kg
wattPw 4139942.0
200*3600
*32*81.9*1000
)(2
3
23
=
=

122
Appendix A3 : The cost of cubic meter water using Water
Distribution Tank Scenario
Configuration 1: PV panels , D.G , Battery and converter
Applying the equations from (4.1) to (4.7) to calculate the cost of cubic
meter:
To calculate total capital cost(TCC) using formula (4.1) :
TCC ($) = DCC ($) + ICC($)
The DCC includes equipments , membranes and Concentrated brine
disposal.
From table (4.1) , DCC =US$ 38700 $
The ICC includes constructions and owners cost , it is equal to 27 % of
direct capital cost, using formula (4.2) :
ICC($) = 0.27 * DCC = 0.27*38700 = US$ 10449
So , TCC = 38700 + 10449 = US$ 49149
• To calculate the annual operating and maintenance cost (OCO&M)
using formula (4.3) :
CO&M ($) = 0.05 *TCC = 0.05 * 49149 =US$ 2457.45
• The operating cost is calculated in ($/year) using formula (4.4) :
OC = OCpower+ OCO&M + OCMbne
• OC power = how much the energy cost for each kilowatt ($/kW) (using
HOMER program results) =
=
year
US
kwyear
day
day
m
m
kw $81.31208
$348.0*
365*270*91.0
3
3

123
- To calculate the operating cost of the membrane using formula (4.5) :
•
===
year
US
years
membrane $2520
5
18*)/($700
n
(nb)*($/member) PriceOC
Mbrn LT
Mbne
So ,OC = OCpower+ OCO&M+ OCMbne
= 31208.81+2457.45+2520 = 36186.26 (US$/year)
The ACC in ($/year) is calculated using formula (4.6) :
=
−=
−+
+=
year
US
i
iiTCCACC
plantn
plantn $84.3943
1)05.1(
)05.1(*05.0*49149
1)1(
)1(**)(
20
20
)(
)(
The total potable water price (TWP) in $/m3 is calculated using formula
(4.7) :
==
+=
33 m
US$479.0
85.0*365*270
26.36186*84.3943
*365* mLM
OCACCTWP
plantplant

124
Appendix A4 : The cost of cubic meter water using Batteries
Scenario
Configuration 1: PV panels, D.G, Battery and converter
Applying the equations from (4.1) to (4.7) to calculate the cost of cubic
meter :
To calculate total capital cost(TCC) using formula (4.1) :
TCC ($) = DCC ($) + ICC($)
The DCC includes equipments , membranes and Concentrated brine
disposal.
From table (4.1) , DCC =US$ 38700 $
The ICC includes constructions and owners cost , it is equal to 27 % of
direct capital cost, using formula (4.2) :
ICC($) = 0.27 * DCC = 0.27*38700 = US$ 10449
So , TCC = 38700 + 10449 = US$ 49149
To calculate the annual operating and maintenance cost (OCO&M) using
formula (4.3) :
CO&M ($) = 0.05 *TCC = 0.05 * 49149 =US$ 2457.45
The operating cost is calculated in ($/year) using formula (4.4) :
OC = OCpower+ OCO&M + OCMbne
OC power = how much the energy cost for each kilowatt ($/kW) (using
HOMER program results) =
=
year
US
kwyear
day
day
m
m
kw $4.41432
$462.0*
365*270*91.0
3
3

125
To calculate the operating cost of the membrane using formula (4.5) :
•
===
year
US
years
membrane $2520
5
18*)/($700
n
(nb)*($/member) PriceOC
Mbrn LT
Mbne
So ,OC = OCpower+ OCO&M + OCMbne
= 41432.4+2457.45+2520 = 46409.84 (US$/year)
The ACC in ($/year) is calculated using formula (4.6) :
=
−=
−+
+=
year
US
i
iiTCCACC
plantn
plantn $84.3943
1)05.1(
)05.1(*05.0*49149
1)1(
)1(**)(
20
20
)(
)(
The total potable water price (TWP) in $/m3 is calculated using formula
(4.7) :
==
+=
33 m
US$601.0
85.0*365*270
84.46409*84.3943
*365* mLM
OCACCTWP
plantplant

جامعة النجاح الوطنية كلية الدراسات العليا
تصميم محطة تحلية المياه باستخدام تقنية الاسموزية العكسية في منطقة غور الأردن باستخدام أفضل مصدر للطاقة واقل تأثيرا على
البيئة
إعداد أحمد عبد الله عبد الفتاح عثمان
إشراف د. أيسر ياسين
الحليم خضرد. عبد
قدمت هذه الأطروحة استكمالا لمتطلبات الحصول على درجة الماجستير في هندسة المياه فلسطين -نابلس ،والبيئة بكلية الدراسات العليا في جامعة النجاح الوطنية
م 2017

ب
تصميم محطة تحلية المياه باستخدام تقنية الاسموزية العكسية في منطقة غور الأردن باستخدام أفضل مصدر للطاقة واقل تأثيرا على البيئة
إعداد أحمد عبد الله عبد الفتاح عثمان
إشراف د. أيسر ياسين
د. عبد الحليم خضر
الملخص
تعد منطقة وادي الأردن منطقة مناسبة و مثالية لاستخدام أفضل مصدر للطاقة العالية والعدد المرتفع المتجددة وهي الطاقة الشمسية بسبب كثافة الإشعاع الشمسي
لساعات أشعة الشمس السنوية، حيث يعتبر مناخ هذا الموقع شبه استوائي، حار وجاف في الصيف ودافئ خلال فصل الشتاء ، حيث يتراوح متوسط درجات الحرارة
درجة مئوية في الصيف. 35درجة مئوية في فصل الشتاء إلى 16الشهرية ما بين ميم محطة تحلية المياه باستخدام أفضل مصدر للطاقة وأقل تهدف هذه الرسالة إلى تص
تأثيرا على البيئة، حيث تم اخذ قرية الزبيدات كحالة خاصة، ووفقا لمنظمة الصحة العالمية وجد أن مياه بئر الزبيدات غير صالحة للشرب لان كمية المواد الصلبة المذابة
لمسموح به هو اقل أو يساوي جزء من المليون في حين أن ا 2100فيها بلغت حوالي جزء من المليون . 1500
تناولت هذه الأطروحة في البداية عدد السكان في قرية الزبيدات في محافظة أريحا، وذلك من أجل تصميم المحطة بناء على احتياجات السكان لمياه الشرب في تلك
1798إلى 2016ام المنطقة، حيث بلغ عدد سكان القرية بعد إجراء الحسابات في الع 150نسمة ووفقا لمنظمة الصحة العالمية فإن معدل استهلاك الفرد اليومي للمياه هو
يوميا. 3م 270)لتر/فرد.يوميا (، أي أننا بحاجة إلى

ت
تم تصميم محطة تحلية المياه باستخدام تقنية الأسموزية العكسية وباستخدام تكنولوجيا ساعة(. /3)م 120الذي تم التصميم بناء عليه هي الأغشية وكانت قدرة البئر
حيث ركز هذا البحث على دراسة وتحليل مصادر الطاقة المستدامة والممكنة لتشغيل المحطة، وخلال التصميم حاولنا التقليل من استخدام مولد الديزل كمصدر لإنتاج
ه نتيجة الاحتراق الكهرباء لما له من اثر سلبي على البيئة نتيجة الأدخنة الصاعدة منوبالإضافة إلى غلاء سعر التشغيل للمولد، وكما تم استبعاد استخدام الطاقة الكهربائية المزودة مباشرة من الجانب الإسرائيلي وذلك من أجل محاولة الاعتماد كليا على
المحطة بالإضافة إلى أن كمية الطاقة الكهربائية المزودة لنا محدودة.ة استخدام مصادر الطاقة المتجددة لتشغيل محطة التحلية وتشمل وتناول البحث إمكاني
الطاقة الشمسية وطاقة الرياح، حيث أن متوسط الإشعاع الشمسي في قرية الزبيدات كيلو واط لكل متر مربع، أما بالنسبة إلى طاقة الرياح فقد تم 5.4كبير ويقدر بحوالي
نتاج الطاقة استبعادها وذلك لان سرعة الرياح الموجودة غير كافية لتشغيل التوربينات وا الكهربائية .
أنظمة وهي خلايا شمسية مع بطاريات، مولد ديزل مع 5كما تم عمل مقارنة بين بطاريات، خلايا شمسية ومولد ديزل بدون بطاريات، خلايا شمسية ومولد ديزل مع
لطاقة بطاريات ومولد ديزل بدون بطاريات وذلك من أجل اختيار أفضل مصدر للتزويد المشروع بالكهرباء باستخدام برنامج خاص )هومر( وذلك لوجود العديد من الخيارات وصعوبة اختيار أفضل مصدر للطاقة يدويا وتحتاج وقتا طويلا وبعضها
مستحيلا. أنظمة أن 5حيث بينت نتائج التحليل من الناحية الاقتصادية بعد المقارنة ما بين
زمة لتغطية احتياجات المشروع بالكهرباء باستخدام البطاريات أفضل مصدر للطاقة اللاكمصدر لتخزين الطاقة هو مكون من خلايا شمسية، مولد ديزل، بطاريات ومحول
) دولار / كيلو واط .ساعة ( في حين بلغ 0.462كهربائي، حيث بلغ سعر الطاقة بينما 3لار / مدو 0.601سعر المتر المكعب من المياه باستخدام هذا المصدر هو

ث
كان استخدام خزان توزيع المياه كمصدر للتخزين وتوفير الطاقة كمحاولة للتقليل من أو استبعاد استعمال البطاريات مكون من خلايا شمسية، مولد ديزل، بطاريات و محول
) دولار / كيلو واط .ساعة ( في حين قل 0.348كهربائي ، حيث قل سعر الطاقة إلى .3دولار / م 0.479عب من المياه باستخدام هذا المصدر إلى سعر المتر المك