Designing of Nano Composites of Conducting Polymers …cdn.intechweb.org/pdfs/15415.pdf ·...
55
19 Designing of Nano Composites of Conducting Polymers for EMI Shielding S.K. Dhawan, Anil Ohlan and Kuldeep Singh National Physical Laboratory (CSIR), New Delhi –110 012 India 1. Introduction Enormous progress in nanotechnology has made electronic systems smaller and has increased the density of electrical components within an instrument. The operating frequencies of signals in these systems are also increasing and have created a new kind of problem called electromagnetic interference (EMI). To provide an adequate solution for the EMI problem, the shielding or absorbing of the electromagnetic field is taken into account. It is observed that the high conductivity and dielectric constant of the materials contribute to high EMI shielding efficiency (SE). This article is an evaluation of the ferrite based conducting polymer nanocomposite and underlines the complex interplay of its intrinsic properties with EMI shielding. The unique properties of nanostructured ferrite offer excellent prospects for designing a new kind of shielding materials. The absorption loss in the material is caused by the heat loss under the action between electric dipole and/or magnetic dipole in the shielding material and the electromagnetic field so that the absorption loss is the function of conductivity and the magnetic permeability of the material. The designing of ferrite based conducting polymer nanocomposites increases the shielding effectiveness. Conducting and magnetic properties of conducing polymer-ferrite nanocomposites can be tuned by suitable selection of polymerization conditions and controlled addition of ferrite nanoparticles. The contribution to the absorption value comes mainly due the magnetic losses (Ǎ˝) and dielectric losses (dž˝). The dependence of SE A on magnetic permeability and conductivity demonstrates that better absorption value has been obtained for material with higher conductivity and magnetization. Therefore, it has been concluded that the incorporation of magnetic and dielectric fillers in the polymer matrix lead to better absorbing material which make them futuristic radar absorbing material. This chapter examines the development of ferromagnetic conducting polymer nanocomposite in the context of its application as microwave absorber and concludes with some observations. 1.1 Conducting polymer-ferrite nanocomposites Nature has mastered the use of nanocomposites, and researchers, as usual, are learning from their natural surroundings. In 1998, Chemistry in Britain published an article titled ‘Nano sandwiches’ [1], stating, ‘Nature is a master chemist with incredible talent’. Using natural reagents and polymers such as carbohydrates, lipids, and proteins, nature makes strong composites such as bones, shells, and wood. These are examples of nanocomposites, made www.intechopen.com
Transcript of Designing of Nano Composites of Conducting Polymers …cdn.intechweb.org/pdfs/15415.pdf ·...

19
Designing of Nano Composites of Conducting Polymers for EMI Shielding
S.K. Dhawan, Anil Ohlan and Kuldeep Singh National Physical Laboratory (CSIR), New Delhi –110 012
India
1. Introduction
Enormous progress in nanotechnology has made electronic systems smaller and has increased the density of electrical components within an instrument. The operating frequencies of signals in these systems are also increasing and have created a new kind of problem called electromagnetic interference (EMI). To provide an adequate solution for the EMI problem, the shielding or absorbing of the electromagnetic field is taken into account. It is observed that the high conductivity and dielectric constant of the materials contribute to high EMI shielding efficiency (SE). This article is an evaluation of the ferrite based conducting polymer nanocomposite and underlines the complex interplay of its intrinsic properties with EMI shielding. The unique properties of nanostructured ferrite offer excellent prospects for designing a new kind of shielding materials. The absorption loss in the material is caused by the heat loss under the action between electric dipole and/or magnetic dipole in the shielding material and the electromagnetic field so that the absorption loss is the function of conductivity and the magnetic permeability of the material. The designing of ferrite based conducting polymer nanocomposites increases the shielding effectiveness. Conducting and magnetic properties of conducing polymer-ferrite nanocomposites can be tuned by suitable selection of polymerization conditions and controlled addition of ferrite nanoparticles. The contribution to the absorption value comes mainly due the magnetic losses (┤˝) and dielectric losses (┝˝). The dependence of SEA on magnetic permeability and conductivity demonstrates that better absorption value has been obtained for material with higher conductivity and magnetization. Therefore, it has been concluded that the incorporation of magnetic and dielectric fillers in the polymer matrix lead to better absorbing material which make them futuristic radar absorbing material. This chapter examines the development of ferromagnetic conducting polymer nanocomposite in the context of its application as microwave absorber and concludes with some observations.
1.1 Conducting polymer-ferrite nanocomposites Nature has mastered the use of nanocomposites, and researchers, as usual, are learning from their natural surroundings. In 1998, Chemistry in Britain published an article titled ‘Nano sandwiches’ [1], stating, ‘Nature is a master chemist with incredible talent’. Using natural reagents and polymers such as carbohydrates, lipids, and proteins, nature makes strong composites such as bones, shells, and wood. These are examples of nanocomposites, made
www.intechopen.com
Advances in Nanocomposites - Synthesis, Characterization and Industrial Applications
430
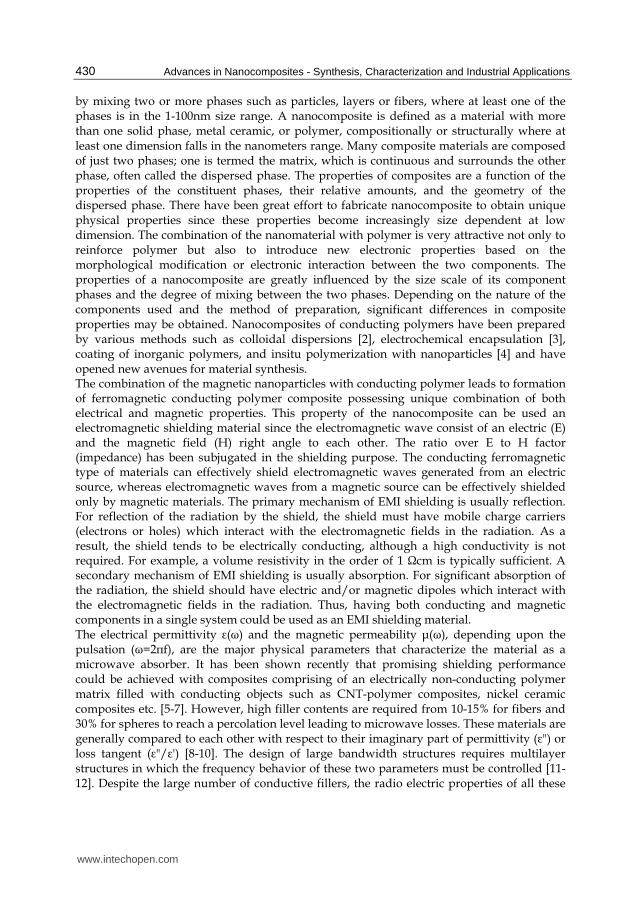
by mixing two or more phases such as particles, layers or fibers, where at least one of the phases is in the 1-100nm size range. A nanocomposite is defined as a material with more than one solid phase, metal ceramic, or polymer, compositionally or structurally where at least one dimension falls in the nanometers range. Many composite materials are composed of just two phases; one is termed the matrix, which is continuous and surrounds the other phase, often called the dispersed phase. The properties of composites are a function of the properties of the constituent phases, their relative amounts, and the geometry of the dispersed phase. There have been great effort to fabricate nanocomposite to obtain unique physical properties since these properties become increasingly size dependent at low dimension. The combination of the nanomaterial with polymer is very attractive not only to reinforce polymer but also to introduce new electronic properties based on the morphological modification or electronic interaction between the two components. The properties of a nanocomposite are greatly influenced by the size scale of its component phases and the degree of mixing between the two phases. Depending on the nature of the components used and the method of preparation, significant differences in composite properties may be obtained. Nanocomposites of conducting polymers have been prepared by various methods such as colloidal dispersions [2], electrochemical encapsulation [3], coating of inorganic polymers, and insitu polymerization with nanoparticles [4] and have opened new avenues for material synthesis. The combination of the magnetic nanoparticles with conducting polymer leads to formation of ferromagnetic conducting polymer composite possessing unique combination of both electrical and magnetic properties. This property of the nanocomposite can be used an electromagnetic shielding material since the electromagnetic wave consist of an electric (E) and the magnetic field (H) right angle to each other. The ratio over E to H factor (impedance) has been subjugated in the shielding purpose. The conducting ferromagnetic type of materials can effectively shield electromagnetic waves generated from an electric source, whereas electromagnetic waves from a magnetic source can be effectively shielded only by magnetic materials. The primary mechanism of EMI shielding is usually reflection. For reflection of the radiation by the shield, the shield must have mobile charge carriers (electrons or holes) which interact with the electromagnetic fields in the radiation. As a result, the shield tends to be electrically conducting, although a high conductivity is not required. For example, a volume resistivity in the order of 1 Ωcm is typically sufficient. A secondary mechanism of EMI shielding is usually absorption. For significant absorption of the radiation, the shield should have electric and/or magnetic dipoles which interact with the electromagnetic fields in the radiation. Thus, having both conducting and magnetic components in a single system could be used as an EMI shielding material. The electrical permittivity ┝(ω) and the magnetic permeability ┤(ω), depending upon the pulsation (ω=2πf), are the major physical parameters that characterize the material as a microwave absorber. It has been shown recently that promising shielding performance could be achieved with composites comprising of an electrically non-conducting polymer matrix filled with conducting objects such as CNT-polymer composites, nickel ceramic composites etc. [5-7]. However, high filler contents are required from 10-15% for fibers and 30% for spheres to reach a percolation level leading to microwave losses. These materials are generally compared to each other with respect to their imaginary part of permittivity (┝") or loss tangent (┝"/┝') [8-10]. The design of large bandwidth structures requires multilayer structures in which the frequency behavior of these two parameters must be controlled [11-12]. Despite the large number of conductive fillers, the radio electric properties of all these
www.intechopen.com
Designing of Nano Composites of Conducting Polymers for EMI Shielding
431
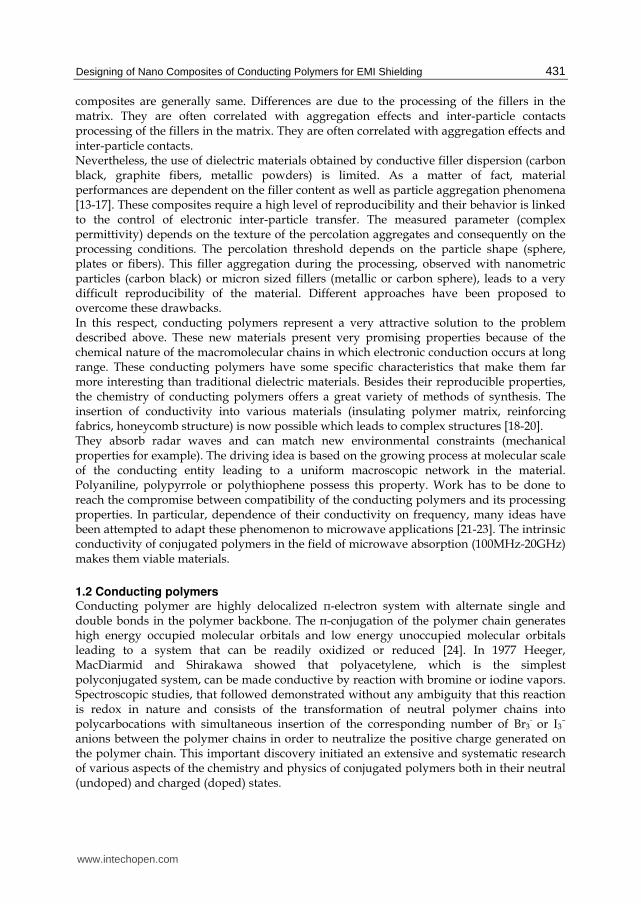
composites are generally same. Differences are due to the processing of the fillers in the matrix. They are often correlated with aggregation effects and inter-particle contacts processing of the fillers in the matrix. They are often correlated with aggregation effects and inter-particle contacts. Nevertheless, the use of dielectric materials obtained by conductive filler dispersion (carbon black, graphite fibers, metallic powders) is limited. As a matter of fact, material performances are dependent on the filler content as well as particle aggregation phenomena [13-17]. These composites require a high level of reproducibility and their behavior is linked to the control of electronic inter-particle transfer. The measured parameter (complex permittivity) depends on the texture of the percolation aggregates and consequently on the processing conditions. The percolation threshold depends on the particle shape (sphere, plates or fibers). This filler aggregation during the processing, observed with nanometric particles (carbon black) or micron sized fillers (metallic or carbon sphere), leads to a very difficult reproducibility of the material. Different approaches have been proposed to overcome these drawbacks. In this respect, conducting polymers represent a very attractive solution to the problem described above. These new materials present very promising properties because of the chemical nature of the macromolecular chains in which electronic conduction occurs at long range. These conducting polymers have some specific characteristics that make them far more interesting than traditional dielectric materials. Besides their reproducible properties, the chemistry of conducting polymers offers a great variety of methods of synthesis. The insertion of conductivity into various materials (insulating polymer matrix, reinforcing fabrics, honeycomb structure) is now possible which leads to complex structures [18-20]. They absorb radar waves and can match new environmental constraints (mechanical properties for example). The driving idea is based on the growing process at molecular scale of the conducting entity leading to a uniform macroscopic network in the material. Polyaniline, polypyrrole or polythiophene possess this property. Work has to be done to reach the compromise between compatibility of the conducting polymers and its processing properties. In particular, dependence of their conductivity on frequency, many ideas have been attempted to adapt these phenomenon to microwave applications [21-23]. The intrinsic conductivity of conjugated polymers in the field of microwave absorption (100MHz-20GHz) makes them viable materials.
1.2 Conducting polymers Conducting polymer are highly delocalized π-electron system with alternate single and double bonds in the polymer backbone. The π-conjugation of the polymer chain generates high energy occupied molecular orbitals and low energy unoccupied molecular orbitals leading to a system that can be readily oxidized or reduced [24]. In 1977 Heeger, MacDiarmid and Shirakawa showed that polyacetylene, which is the simplest polyconjugated system, can be made conductive by reaction with bromine or iodine vapors. Spectroscopic studies, that followed demonstrated without any ambiguity that this reaction is redox in nature and consists of the transformation of neutral polymer chains into polycarbocations with simultaneous insertion of the corresponding number of Br3¯ or I3¯ anions between the polymer chains in order to neutralize the positive charge generated on the polymer chain. This important discovery initiated an extensive and systematic research of various aspects of the chemistry and physics of conjugated polymers both in their neutral (undoped) and charged (doped) states.
www.intechopen.com

Advances in Nanocomposites - Synthesis, Characterization and Industrial Applications
432
SSS
S S
n
HN
NH
NH
HN
HN
n
HN
NH
HN
NH
n
n
n
n
Polythiophene
Polypyrrole
Polyaniline
Polyacetylene
Poly-p-phenylene
Poly (phenylene vinylene)
Fig. 1. Chemical structure of some undoped conjugated polymers
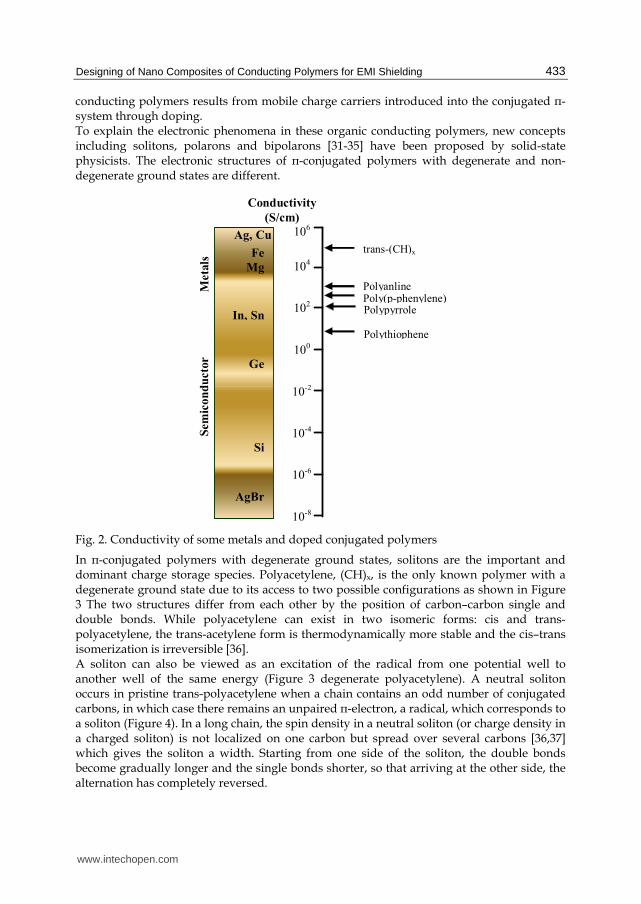
In most of the cases, polymers are insulators in their neutral state and they become conducting only after introduction of electron acceptors/donors by a process known as ‘doping’. The conductivity of a polymer can be tuned by chemical manipulation such as the nature of the dopant, the degree of doping and blending with other polymers. Figure 1 shows the chemical structure of conjugated polymers in their neutral insulating state. Undoped conjugated polymers are semiconductors with band gaps ranging from 1 to 4eV, therefore their room temperature conductivities are very low, typically of the order of 10−8 S/cm or lower. However, doping can leads to an increase in conductivity of polymer by many orders of magnitude [25]. The concept of doping is unique and distinguishes conducting polymers from all other types of polymers [26, 27]. During the doping process, an undoped conjugated polymer having small conductivity, typically in the range of 10−10 to 10−5 S/cm, is converted to a doped conducting polymer, which is in ‘metallic’ conducting regime (1–104 S/cm). The highest value reported to date has been obtained in iodine-doped polyacetylene (>105 S/cm) and the predicted theoretical limit is about 2 × 10⁷, more than an order of magnitude higher than that of copper. Conductivity of other conjugated polymers reaches up to 103 S/cm as shown in Figure 2. Recent advances in the field of intrinsic conducting polymers (ICPs) have led to a variety of materials with great potential for commercial applications such as rechargeable batteries [28-30],
1.3 Mechanism of conductivity Conducting polymers are unusual in that they do not conduct electrons via the same mechanisms used to describe classical semiconductors and hence their electronic properties cannot be explained well by standard band theory. The electronic conductivity of
www.intechopen.com
Designing of Nano Composites of Conducting Polymers for EMI Shielding
433
conducting polymers results from mobile charge carriers introduced into the conjugated π-system through doping. To explain the electronic phenomena in these organic conducting polymers, new concepts including solitons, polarons and bipolarons [31-35] have been proposed by solid-state physicists. The electronic structures of π-conjugated polymers with degenerate and non-degenerate ground states are different.
Conductivity
(S/cm)
Ag, Cu 106
104
102
100
10-2
10-4
10-6
10-8
Fe
Mg
In, Sn
Ge
Si
AgBr
trans-(CH)x
Polyanline
Polypyrrole
Polythiophene
Meta
ls
Sem
ico
nd
ucto
r
Poly(p-phenylene)
Fig. 2. Conductivity of some metals and doped conjugated polymers
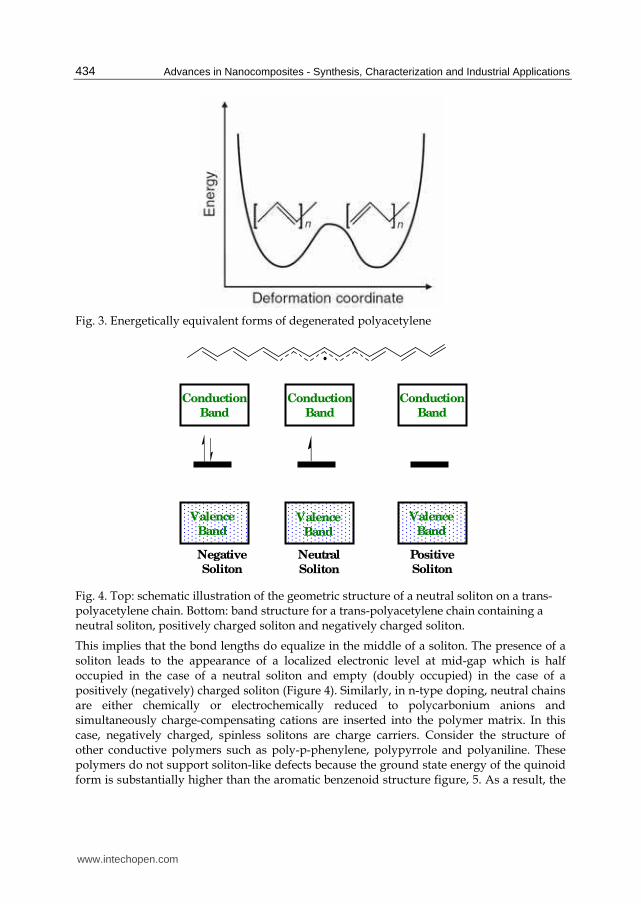
In π-conjugated polymers with degenerate ground states, solitons are the important and dominant charge storage species. Polyacetylene, (CH)x, is the only known polymer with a degenerate ground state due to its access to two possible configurations as shown in Figure 3 The two structures differ from each other by the position of carbon–carbon single and double bonds. While polyacetylene can exist in two isomeric forms: cis and trans-polyacetylene, the trans-acetylene form is thermodynamically more stable and the cis–trans isomerization is irreversible [36]. A soliton can also be viewed as an excitation of the radical from one potential well to another well of the same energy (Figure 3 degenerate polyacetylene). A neutral soliton occurs in pristine trans-polyacetylene when a chain contains an odd number of conjugated carbons, in which case there remains an unpaired π-electron, a radical, which corresponds to a soliton (Figure 4). In a long chain, the spin density in a neutral soliton (or charge density in a charged soliton) is not localized on one carbon but spread over several carbons [36,37] which gives the soliton a width. Starting from one side of the soliton, the double bonds become gradually longer and the single bonds shorter, so that arriving at the other side, the alternation has completely reversed.
www.intechopen.com
Advances in Nanocomposites - Synthesis, Characterization and Industrial Applications
434
Fig. 3. Energetically equivalent forms of degenerated polyacetylene
Fig. 4. Top: schematic illustration of the geometric structure of a neutral soliton on a trans-polyacetylene chain. Bottom: band structure for a trans-polyacetylene chain containing a neutral soliton, positively charged soliton and negatively charged soliton.
This implies that the bond lengths do equalize in the middle of a soliton. The presence of a soliton leads to the appearance of a localized electronic level at mid-gap which is half occupied in the case of a neutral soliton and empty (doubly occupied) in the case of a positively (negatively) charged soliton (Figure 4). Similarly, in n-type doping, neutral chains are either chemically or electrochemically reduced to polycarbonium anions and simultaneously charge-compensating cations are inserted into the polymer matrix. In this case, negatively charged, spinless solitons are charge carriers. Consider the structure of other conductive polymers such as poly-p-phenylene, polypyrrole and polyaniline. These polymers do not support soliton-like defects because the ground state energy of the quinoid form is substantially higher than the aromatic benzenoid structure figure, 5. As a result, the
Conduction
Band
Conduction
Band
Conduction
Band
Valence
Band Valence
Band
Valence
Band
Negative
Soliton
Neutral
Soliton
Positive
Soliton
www.intechopen.com
Designing of Nano Composites of Conducting Polymers for EMI Shielding
435
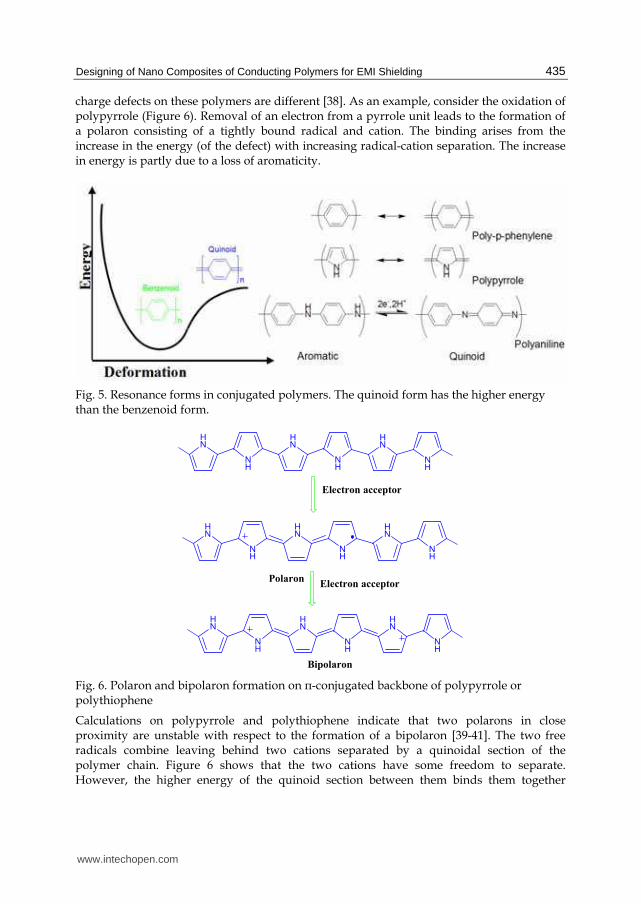
charge defects on these polymers are different [38]. As an example, consider the oxidation of polypyrrole (Figure 6). Removal of an electron from a pyrrole unit leads to the formation of a polaron consisting of a tightly bound radical and cation. The binding arises from the increase in the energy (of the defect) with increasing radical-cation separation. The increase in energy is partly due to a loss of aromaticity.
Fig. 5. Resonance forms in conjugated polymers. The quinoid form has the higher energy than the benzenoid form.
HN
NH
HN
NH
HN
NH
HN
NH
HN
NH
HN
NH
HN
NH
HN
NH
HN
NH
Electron acceptor
Electron acceptor
Bipolaron
Polaron
Fig. 6. Polaron and bipolaron formation on π-conjugated backbone of polypyrrole or polythiophene
Calculations on polypyrrole and polythiophene indicate that two polarons in close proximity are unstable with respect to the formation of a bipolaron [39-41]. The two free radicals combine leaving behind two cations separated by a quinoidal section of the polymer chain. Figure 6 shows that the two cations have some freedom to separate. However, the higher energy of the quinoid section between them binds them together
www.intechopen.com
Advances in Nanocomposites - Synthesis, Characterization and Industrial Applications
436
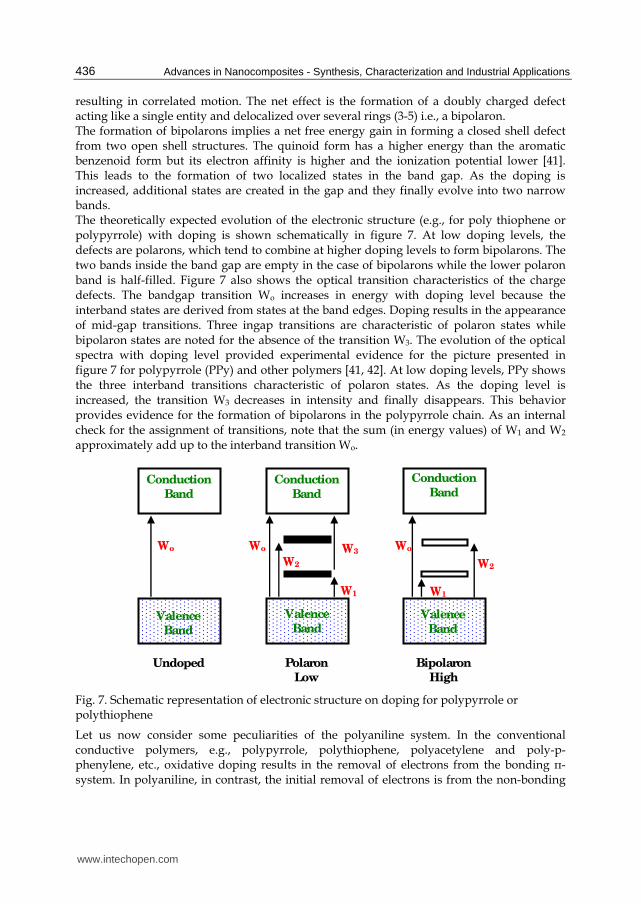
resulting in correlated motion. The net effect is the formation of a doubly charged defect acting like a single entity and delocalized over several rings (3-5) i.e., a bipolaron. The formation of bipolarons implies a net free energy gain in forming a closed shell defect from two open shell structures. The quinoid form has a higher energy than the aromatic benzenoid form but its electron affinity is higher and the ionization potential lower [41]. This leads to the formation of two localized states in the band gap. As the doping is increased, additional states are created in the gap and they finally evolve into two narrow bands. The theoretically expected evolution of the electronic structure (e.g., for poly thiophene or polypyrrole) with doping is shown schematically in figure 7. At low doping levels, the defects are polarons, which tend to combine at higher doping levels to form bipolarons. The two bands inside the band gap are empty in the case of bipolarons while the lower polaron band is half-filled. Figure 7 also shows the optical transition characteristics of the charge defects. The bandgap transition Wo increases in energy with doping level because the interband states are derived from states at the band edges. Doping results in the appearance of mid-gap transitions. Three ingap transitions are characteristic of polaron states while bipolaron states are noted for the absence of the transition W3. The evolution of the optical spectra with doping level provided experimental evidence for the picture presented in figure 7 for polypyrrole (PPy) and other polymers [41, 42]. At low doping levels, PPy shows the three interband transitions characteristic of polaron states. As the doping level is increased, the transition W3 decreases in intensity and finally disappears. This behavior provides evidence for the formation of bipolarons in the polypyrrole chain. As an internal check for the assignment of transitions, note that the sum (in energy values) of W1 and W2 approximately add up to the interband transition Wo.
Fig. 7. Schematic representation of electronic structure on doping for polypyrrole or polythiophene
Let us now consider some peculiarities of the polyaniline system. In the conventional conductive polymers, e.g., polypyrrole, polythiophene, polyacetylene and poly-p-phenylene, etc., oxidative doping results in the removal of electrons from the bonding π-system. In polyaniline, in contrast, the initial removal of electrons is from the non-bonding
Conduction
Band
Conduction
Band
Conduction
Band
Valence
Band
Valence
Band
Valence
Band
Wo WoWo
W2
W1
W3
W1
W2
Undoped Polaron
Low
Bipolaron
High
www.intechopen.com
Designing of Nano Composites of Conducting Polymers for EMI Shielding
437
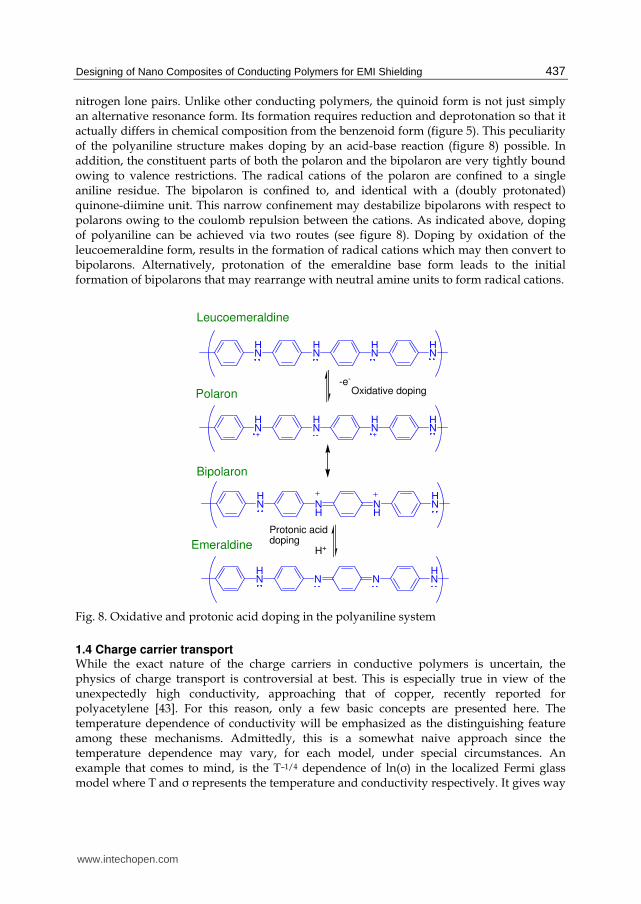
nitrogen lone pairs. Unlike other conducting polymers, the quinoid form is not just simply an alternative resonance form. Its formation requires reduction and deprotonation so that it actually differs in chemical composition from the benzenoid form (figure 5). This peculiarity of the polyaniline structure makes doping by an acid-base reaction (figure 8) possible. In addition, the constituent parts of both the polaron and the bipolaron are very tightly bound owing to valence restrictions. The radical cations of the polaron are confined to a single aniline residue. The bipolaron is confined to, and identical with a (doubly protonated) quinone-diimine unit. This narrow confinement may destabilize bipolarons with respect to polarons owing to the coulomb repulsion between the cations. As indicated above, doping of polyaniline can be achieved via two routes (see figure 8). Doping by oxidation of the leucoemeraldine form, results in the formation of radical cations which may then convert to bipolarons. Alternatively, protonation of the emeraldine base form leads to the initial formation of bipolarons that may rearrange with neutral amine units to form radical cations.
HN N
HNH
HN
HN
HN
HN
HN
HN
HN
HN
HN
HN N N
HN
Leucoemeraldine
Emeraldine
Polaron
Bipolaron
-e-
Oxidative doping
Protonic acid doping
H+
Fig. 8. Oxidative and protonic acid doping in the polyaniline system
1.4 Charge carrier transport While the exact nature of the charge carriers in conductive polymers is uncertain, the physics of charge transport is controversial at best. This is especially true in view of the unexpectedly high conductivity, approaching that of copper, recently reported for polyacetylene [43]. For this reason, only a few basic concepts are presented here. The temperature dependence of conductivity will be emphasized as the distinguishing feature among these mechanisms. Admittedly, this is a somewhat naive approach since the temperature dependence may vary, for each model, under special circumstances. An example that comes to mind, is the T–1/4 dependence of ln(σ) in the localized Fermi glass model where T and σ represents the temperature and conductivity respectively. It gives way
www.intechopen.com
Advances in Nanocomposites - Synthesis, Characterization and Industrial Applications
438
to a T–1/2 law when the assumed smooth varying density of states function is replaced by one with a sharp minimum at the Fermi level [44]. It is possible to differentiate between intra- and intermolecular charge transport mechanisms in conducting polymers [45]. Charge may be delocalized along the polymer backbone but without an efficient intermolecular tunneling or hopping mechanism, conductivity may still be low. Since conducting polymers are generally refractory materials, poor inter particle contacts may further limit conductivity in compressed pellets. Unhomogeneous doping may also lead to a dependence on doping level, which does not reflect intrinsic behavior, but derives from the microscopic topology of the granular dispersion: The conductivity of a dispersion of conducting particles in an insulating matrix shows percolation effects [46]. The composite shows a dramatic rise in conductivity above a threshold loading corresponding to the formation of an ‘infinite’ network of particles in mutual contact. The complicating factor here is that differential thermal expansion coefficients may lead to pseudo temperature dependence. In conductive polymers, soliton and polaron, or bipolaron states can overlap to form bands of states [47]. In principle, a metallic state may result when such bands are partially filled. Overlap of bipolaron bands with the valence band and a regular array of polarons [48] are examples of such metallic states with a finite density of states at the Fermi level. Historically, the concept of a metallic state for the conductive form of PANI was marked by revolutionary change (Figure 8). One of the initial suggestions by MacDiarmid [49] was that the metallic state in PANI derives from a delocalized bipolaron defect. On the other hand, Epstein and coworkers [50,51] favored a metallic state derived from a regular array of polarons (Figure 8). Since the observed temperature dependence for the conductivity is not metallic, they proposed a picture of metallic particles embedded in a dielectric medium. The conductivity of such a granular metal is determined by space charging limited tunneling. At low field strengths, the field dependence is Ohmic with the temperature dependence given by [52]
1/2
exp oo
T
Tσ σ ⎡ ⎤⎛ ⎞⎢ ⎥= −⎜ ⎟⎢ ⎥⎝ ⎠⎣ ⎦
(1)
While at high field strengths
exp oo
E
Eσ σ ⎛ ⎞= −⎜ ⎟⎝ ⎠ (2)
Wudl et al. [53] disagree with the proposed metallic nature for the conductive state in polyaniline. They argue that the relatively low conductivity and high concentration of Curie spins is inconsistent with a true metallic state. According to them, severe disorder in this system results in a continuous density of localized states. For this situation the Fermi glass model [54,55] provides a more appropriate description. The temperature dependence of the conductivity should then follow a T–1/4 law according to the Mott-Davis variable range hopping (VRH) model [43]
1/4
1/2 exp oTAT
Tσ − ⎡ ⎤⎛ ⎞⎢ ⎥= −⎜ ⎟⎢ ⎥⎝ ⎠⎣ ⎦
(3)
www.intechopen.com
Designing of Nano Composites of Conducting Polymers for EMI Shielding
439
The multi phonon hopping mechanism for charge transfer between localized states proposed by Buhks et al. [56] predicts a temperature dependence of the form
3/2 exp aEAT
KTσ − ⎛ ⎞= −⎜ ⎟⎝ ⎠ (4)
In this model, the charge-transfer reorganization energy is estimated from the Marcus relationship [57]. The Marcus equation was first developed for outer sphere electron transfer (redox reactions) in solution [58]. The reorganization energy is a linear function of the medium (solvent) parameter [59]
21 1nτ ε= − (5)
where n is the refractive index and ┝ is the dielectric constant. This suggests that absorbed solvent may influence the conductivity of electroactive polymers. Indeed, the sensitivity of polyaniline conductivity to moisture content is well known [60]. In the more localized models, charge transport occurs via hopping between localized states. Note that in polyacetylene hopping of a single soliton from one chain to another requires high reorganization energy. In contrast, the coordinated hopping of two defects (i.e. a bipolaron) is a low activation energy process. The situation is reversed in polyaniline. Hopping of a polaron requires a single electron transfer with minimal structural rearrangement [61], In PANI, hopping of bipolarons requires a higher activation energy since it involves considerable structural relaxation.
2. Electromagnetic shielding and microwave absorption
The term shielding is usually referred to a metallic enclosure that completely encloses an electronic product or the portion of that product. Therefore, it limits the amount of EMI radiation from the external environment that can penetrate the circuit and conversely, it influences how much EMI energy generated by the circuit can escape into the external environment. There are two functions of a shield: first, to prevent the emissions of the electronics of the product or a portion of those electronics from the radiation outside the boundaries of the product. The motivation here is to either prevent those emissions from causing the product to fail to comply with the radiated emissions limits or to prevent the product from causing interference with the other electronics products. The second purpose of the shield is, to prevent the radiated emission outside the product from coupling to the product electronics that may cause interference in the product. Therefore, a shield is conceptually, a barrier to the transmission of the electromagnetic fields. We can say that the effectiveness of a shield as being the ratio of the magnitude of the electric (magnetic) field that is incident on the barrier to the magnitude of the electric (magnetic) field that is transmitted through the barrier. If sensitive equipment is enclosed within a thin, conductive, spherical shell that is placed in an E-field, it will be shielded because the current setup by the electromagnetic wave does not conduct inside of the shell. This is not because the shell has completely absorbed the field but because the E-field has caused electronic charges of different polarity along the shell. These charges generate an electrical field that will tend to cancel the original field inside the shell [62,63]. The thickness of the shell can be very small when the wave
www.intechopen.com
Advances in Nanocomposites - Synthesis, Characterization and Industrial Applications
440
frequency is high enough. The electromagnetic current takes the path of least-resistance and follows through the exterior of the conductive shell. When it comes to H-fields, shields made of a soft magnetic material with high permeability, ┤>>1, and sufficient thickness attenuate the magnetic field in the shielding shell by providing a low reluctance. That is, the spherical shell of magnetic material with good permeability will reduce the H-field intensity inside because the H-field tends to remain in the magnetic material layer as the magnetic material offers a low-reluctance path [62,64]. Alternatively, a thin shield made of a conductive material with low permeability can also provide effective shielding for H-fields at high frequencies. This is because an alternating H-field will induce eddy currents in the shielding screen, assuming that the shield has adequate conductivity. These eddy currents will themselves create an alternating H- field of the opposite orientation inside the shell. The effect will increase as the frequency increases, resulting in high shielding effectiveness at high frequencies. Therefore, it is relatively difficult to shield against low frequency H-fields. Magnetic absorption shielding typically needs the installation of thick shields constructed of expensive magnetic materials, conductive shields based on the induced current principle may be reasonably effective at power line frequencies. For example, aluminum screens are commonly used to protect against 50 and 60 Hz magnetic fields generated by transformers and other sources [62].
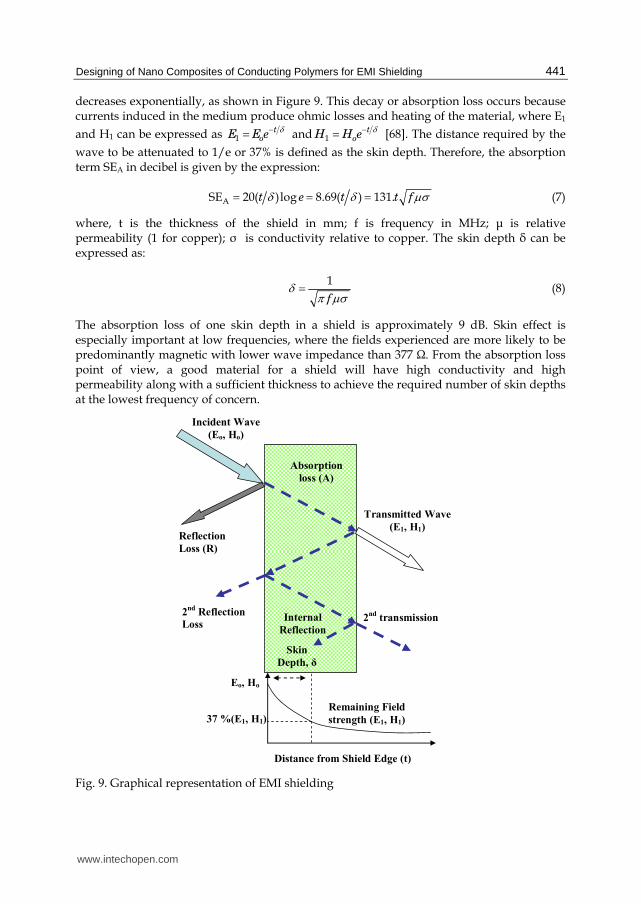
2.1 Shielding effectiveness Shielding can be specified in the terms of reduction in magnetic (and electric) field or plane-wave strength caused by shielding. The effectiveness of a shield and its resulting EMI attenuation are based on the frequency, the distance of the shield from the source, the thickness of the shield and the shield material. Shielding effectiveness (SE) is normally expressed in decibels (dB) as a function of the logarithm of the ratio of the incident and exit electric (E), magnetic (H), or plane-wave field intensities (F): SE (dB) = 20 log (Eo/E1), SE (dB) = 20 log (Ho/H1), or SE (dB) = 20 log (Fo/F1), respectively. With any kind of electromagnetic interference, there are three mechanisms contributing to the effectiveness of a shield. Part of the incident radiation is reflected from the front surface of the shield, part is absorbed within the shield material and part is reflected from the shield rear surface to the front where it can aid or hinder the effectiveness of the shield depending on its phase relationship with the incident wave, as shown in Figure 9. Therefore, the total shielding effectiveness of a shielding material (SE) equals the sum of the absorption factor (SEA), the reflection factor (SER) and the correction factor to account for multiple reflections (SEM) in thin shields [65-68]
SE = SEA + SER + SEM (6)
All the terms in the equation are expressed in dB. The multiple reflection factor SEM, can be neglected if the absorption loss SEA is greater than 10 dB. In practical calculation, SEM can also be neglected for electric fields and plane waves.
2.1.1 Absorption loss Absorption loss SEA, is a function of the physical characteristics of the shield and is independent of the type of source field. Therefore, the absorption term SEA is the same for all three waves. When an electromagnetic wave passes through a medium, its amplitude
www.intechopen.com
Designing of Nano Composites of Conducting Polymers for EMI Shielding
441
decreases exponentially, as shown in Figure 9. This decay or absorption loss occurs because currents induced in the medium produce ohmic losses and heating of the material, where E1 and H1 can be expressed as 1
toE E e
δ−= and 1t
oH H eδ−= [68]. The distance required by the
wave to be attenuated to 1/e or 37% is defined as the skin depth. Therefore, the absorption term SEA in decibel is given by the expression:
ASE 20( )log 8.69( ) 131.t e t t fδ δ μσ= = = (7)
where, t is the thickness of the shield in mm; f is frequency in MHz; ┤ is relative permeability (1 for copper); σ is conductivity relative to copper. The skin depth ├ can be expressed as:
1f
δ π μσ= (8)
The absorption loss of one skin depth in a shield is approximately 9 dB. Skin effect is especially important at low frequencies, where the fields experienced are more likely to be predominantly magnetic with lower wave impedance than 377 Ω. From the absorption loss point of view, a good material for a shield will have high conductivity and high permeability along with a sufficient thickness to achieve the required number of skin depths at the lowest frequency of concern.
Absorption
loss (A)
Incident Wave
(Eo, Ho)
Transmitted Wave
(E1, H1) Reflection
Loss (R)
Internal
Reflection
2nd
Reflection
Loss2
nd transmission
Skin
Depth, δ
Eo, Ho
Distance from Shield Edge (t)
37 %(E1, H1) Remaining Field
strength (E1, H1)
Fig. 9. Graphical representation of EMI shielding
www.intechopen.com

Advances in Nanocomposites - Synthesis, Characterization and Industrial Applications
442
2.1.2 Reflection loss The reflection loss is related to the relative mismatch between the incident wave and the surface impedance of the shield. The computation of refection losses can be greatly simplified by considering shielding effectiveness for incident electric fields as a separate problem from that of electric, magnetic or plane waves. The equations for the three principle fields are given by the expressions [68]
1 3 210logER Kf r
σμ
⎛ ⎞= ⎜ ⎟⎜ ⎟⎝ ⎠ (9)
2
2 10logH
frR K
σμ
⎛ ⎞= ⎜ ⎟⎜ ⎟⎝ ⎠ (10)
310logP
fR K
μσ
⎛ ⎞= ⎜ ⎟⎝ ⎠ (11)
where, RE, RH, and RP are the reflection losses for the electric, magnetic and plane wave fields, respectively, expressed in dB; σ is the relative conductivity relative to copper; f is the frequency in Hz; ┤ is the relative permeability relative to free space; r is the distance from the source to the shielding in meter.
2.1.3 Multiple reflections The factor SEM can be mathematically positive or negative (in practice, it is always negative) and becomes insignificant when the absorption loss SEA > 6 dB. It is usually only important when metals are thin and at low frequencies (i.e., below approximately 20 kHz). The formulation of factor SEM can be expressed as
220log(1 )tMSE e
δ−= − − (12)
3. Theoretical calculations of shielding effectiveness
Calculation of the far-field shielding effectiveness (SE) of a planar barrier is a straightforward exercise in classical electromagnetic theory. It requires calculation of a solution of Maxwell's equations describing the decrease in amplitude of an electromagnetic disturbance that is produced by the presence of the shield of interest. To facilitate this calculation, it is most convenient to choose a field representation in terms of the electric and magnetic field strength vectors E
f and H
f. The components of these two vectors, which are
tangential to the surface of the shield, are continuous across the interface between the shield's exterior and its interior. The magnetic field strength is related to the magnetic induction B
f through the empirical
relation B Hμ=f f. A useful relation between E
f and B
f can be derived from Maxwell's
equation for the Faraday law of induction which relates the spatial variation of Ef
to the temporal variation of B
f:
BE
t
∂∇× = − ∂ff
(13)
www.intechopen.com
Designing of Nano Composites of Conducting Polymers for EMI Shielding
443
To generate an expression for the far-field SE of a planar barrier, consider a linearly polarized plane wave for which the variation in time and space of the vector fields E
f and B
f
are expressed in the usual way:
( . )i t k xoE E e ω ±=f f
(14)
( . )i t k xoB B e ω ±=f f
(15)
(where, oEf
and oBf
are constant vectors giving the wave amplitude, ω is the angular
frequency of the wave, 2 ˆk kπλ=f , is the wave vector, and ┣ is its wavelength), then the
differential equation (10) becomes the time-independent algebraic equation:
ik E i Hωμ× = −f f f∓ (16)
The vector equation (16) can be further simplified using the dispersion relation ω= ck and the relationship between the propagation velocity c and the constants ┝ and ┤ the electric permittivity and the magnetic permeability respectively, of the medium in which the wave propagates):
k E Hk
ωμ× = ±f f f
1Hμεμ= ± f
Hμε= ± f
ZH= ± f (17)
The quantity Zμε= is the wave impedance in the medium of propagation. In the
following discussion, the variable q is used to represent the magnitude of the wave vector in a conducting medium and k is used to represent the magnitude of the wave vector in free space. In terms of the conductivity σ of the medium, its relative permittivity ┝r, and its relative permeability ┤r, q is given by
1 2
q iσω μ ε ω
⎡ ⎤⎛ ⎞= −⎢ ⎥⎜ ⎟⎝ ⎠⎣ ⎦1 2
1r r ic
ω σε μ ωε⎡ ⎤= −⎢ ⎥⎣ ⎦ (18)
Hence, the complex wave function Z in the conducting medium can be written as
Zq
ωμ= 1 2
i
μσμ ε ω
= ⎡ ⎤⎛ ⎞−⎢ ⎥⎜ ⎟⎝ ⎠⎣ ⎦
1 2
1 iμ σε ωε
−⎡ ⎤= −⎢ ⎥⎣ ⎦ (19)
Now, to calculate the far-field shielding of a thin sheet of a conducting material, assume that a plane wave linearly polarized in the y direction is incident from the –x direction onto a sheet of the conductor. The thickness of the sheet is denoted by d, and its orientation is assumed to be such that it lies in the y-z plane. If x increases from left to right, then to the left of the conducting sheet there is an incident wave with electric field strength ikx
oE e−f
and a corresponding reflected wave ikx
oRE ef
where the reflection amplitude R is, in general, a
www.intechopen.com
Advances in Nanocomposites - Synthesis, Characterization and Industrial Applications
444
complex number. To the right of the sheet there is a transmitted wave propagating in the x direction whose electric field strength can be written ikx
oTE e−f
. The shielding effectiveness of the sheet, in dB, is calculated from the (complex) transmission amplitude T according to the following expression:
21
( ) 10.logSE dBT
⎛ ⎞⎜ ⎟= ⎜ ⎟⎝ ⎠ (20)
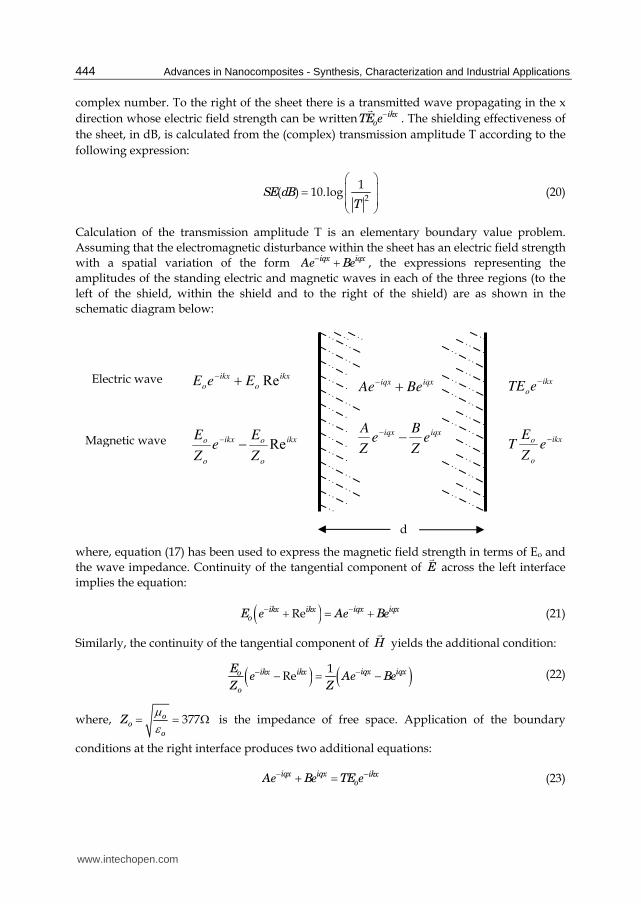
Calculation of the transmission amplitude T is an elementary boundary value problem. Assuming that the electromagnetic disturbance within the sheet has an electric field strength with a spatial variation of the form iqx iqxAe Be− + , the expressions representing the amplitudes of the standing electric and magnetic waves in each of the three regions (to the left of the shield, within the shield and to the right of the shield) are as shown in the schematic diagram below:
where, equation (17) has been used to express the magnetic field strength in terms of Eo and the wave impedance. Continuity of the tangential component of E
f across the left interface
implies the equation:
( )Re iqx iqxikx ikxoE e Ae Be−− + = + (21)
Similarly, the continuity of the tangential component of Hf
yields the additional condition:
( ) ( )1Re iqx iqxikx ikxo
o
Ee Ae Be
Z Z
−− − = − (22)
where, 377oo
o
Zμε= = Ω is the impedance of free space. Application of the boundary
conditions at the right interface produces two additional equations:
iqx iqx ikxoAe Be TE e− −+ = (23)
iqxiqxBeAe +−
iqxiqx eZ
Be
Z
A −−
ikx
o
ikx
o EeE Re+−
ikx
o
oikx
o
o
Z
Ee
Z
ERe−−
ikx
oeTE−
ikx
o
o eZ
ET
−
d
Electric wave
Magnetic wave
www.intechopen.com
Designing of Nano Composites of Conducting Polymers for EMI Shielding
445
( )1 iqx iqx ikxo
o
EAe Be T e
Z Z
− −− = (24)
Now, taking the location of the left interface to be x = 0, equations (21) and (22) can be combined to give Eo in terms of A and B:
1 1
1 12 2
o oo
Z ZE A B
Z Z
⎛ ⎞ ⎛ ⎞= + + −⎜ ⎟ ⎜ ⎟⎝ ⎠ ⎝ ⎠ (25)
Similarly, taking the location of the right interface to be x = d, (23) and (24) give expressions for A and B in terms of T and Eo:
( )11
2i k q d
oo
ZA TE e
Z
− −⎛ ⎞= +⎜ ⎟⎜ ⎟⎝ ⎠ (26)
( )11
2i k q d
oo
ZB TE e
Z
− +⎛ ⎞= −⎜ ⎟⎜ ⎟⎝ ⎠ (27)
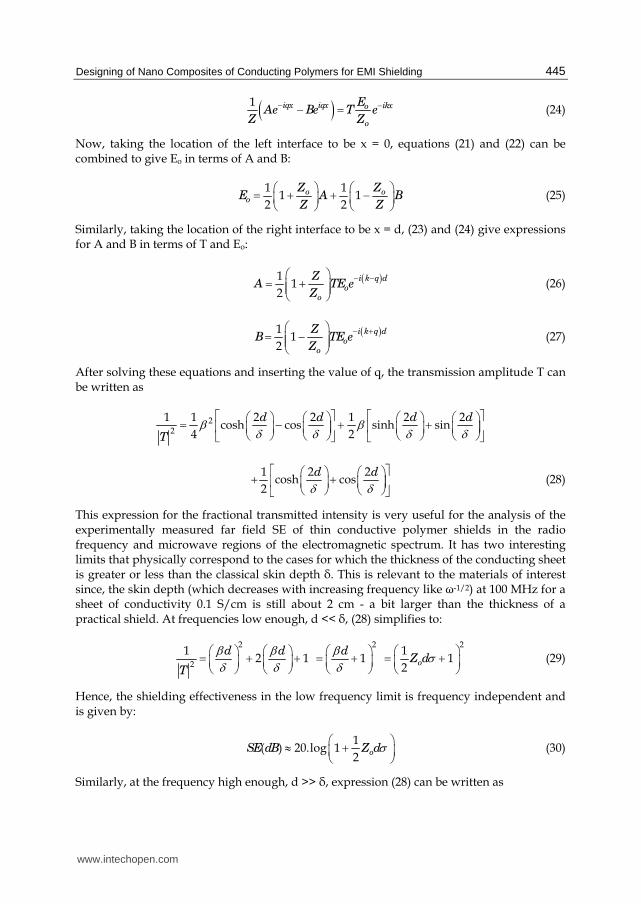
After solving these equations and inserting the value of q, the transmission amplitude T can be written as
22
1 1 2 2 1 2 2cosh cos sinh sin
4 2d d d d
Tβ βδ δ δ δ
⎡ ⎤ ⎡ ⎤⎛ ⎞ ⎛ ⎞ ⎛ ⎞ ⎛ ⎞= − + +⎢ ⎥ ⎢ ⎥⎜ ⎟ ⎜ ⎟ ⎜ ⎟ ⎜ ⎟⎝ ⎠ ⎝ ⎠ ⎝ ⎠ ⎝ ⎠⎣ ⎦ ⎣ ⎦
1 2 2
cosh cos2
d d
δ δ⎡ ⎤⎛ ⎞ ⎛ ⎞+ +⎢ ⎥⎜ ⎟ ⎜ ⎟⎝ ⎠ ⎝ ⎠⎣ ⎦ (28)
This expression for the fractional transmitted intensity is very useful for the analysis of the experimentally measured far field SE of thin conductive polymer shields in the radio frequency and microwave regions of the electromagnetic spectrum. It has two interesting limits that physically correspond to the cases for which the thickness of the conducting sheet is greater or less than the classical skin depth ├. This is relevant to the materials of interest since, the skin depth (which decreases with increasing frequency like ω-1/2) at 100 MHz for a sheet of conductivity 0.1 S/cm is still about 2 cm - a bit larger than the thickness of a practical shield. At frequencies low enough, d << ├, (28) simplifies to:
2
21
2 1d d
T
β βδ δ
⎛ ⎞ ⎛ ⎞= + +⎜ ⎟ ⎜ ⎟⎝ ⎠ ⎝ ⎠ 2
1dβδ
⎛ ⎞= +⎜ ⎟⎝ ⎠ 21
12 oZ dσ⎛ ⎞= +⎜ ⎟⎝ ⎠ (29)
Hence, the shielding effectiveness in the low frequency limit is frequency independent and is given by:
1
( ) 20.log 12 oSE dB Z dσ⎛ ⎞≈ +⎜ ⎟⎝ ⎠ (30)
Similarly, at the frequency high enough, d >> ├, expression (28) can be written as
www.intechopen.com

Advances in Nanocomposites - Synthesis, Characterization and Industrial Applications
446
222
1 18
deT
δβ≈ (31)
leading to the following expression for the SE, which monotonically increases with frequency as a result of the dominance of the second term on the right hand side:
( ) 10.log 20.log .16 2
SE dB e dσ ωμσωε
⎛ ⎞≈ +⎜ ⎟⎝ ⎠ (32)
The first term on the right hand side of this expression can be interpreted as due to reflection of the incident energy while, the second is attributable to attenuation of the incident wave by absorption in the bulk of the sheet. Equations (28) and (32) are plotted in the figure below for the frequency range from 1 MHz to 10 GHz. The sheet thickness d was taken to be 3 mm, and its conductivity σ is 3 S/cm. The upper solid curve represents the high frequency limit of the SE as given by equation (32) which is seen to converge to the actual far-field SE (calculated from the expression in equation (28) and represented below by the lower solid curve) at the frequency ωc at which the skin depth ├ is equal to the sheet thickness d. The two dashed curves shown represent the two terms on the right hand side of equation (32). The low frequency limit of the SE expressed in equation (30) corresponds to the frequency independent portion of the lower solid curve showing the actual far-field SE.
Fig. 10. Theoretical dependence of shielding effectiveness on frequency
In a straightforward way, the analysis of the shielding effectiveness of a thin planar barrier can be extended to an investigation of the effectiveness of two parallel planar barriers with a space between them. Depending on the particular values of the parameters describing this system (barrier thicknesses, inter-barrier spacing, barrier conductivity, signal frequency, etc.), the presence of the space between the barriers will produce interference effects which produce either an enhancement or suppression of the shielding effectiveness.
www.intechopen.com

Designing of Nano Composites of Conducting Polymers for EMI Shielding
447
3.1 Calculations of complex permeability and permittivity There are various approaches for obtaining the permittivity and permeability from s-parameters. Table 1 gives an overview of the conversion techniques utilizing various sets of s-parameters to determine the dielectric properties. Each of the conversion technique has different advantages and limitations. The selection of the technique depends on several factors such as the measured s-parameters, sample length, the desired dielectric properties, speed of conversion and accuracies in the converted results. The details of these techniques are described below
Conversion technique S-parameters Dielectric properties
NRW (S11, S21, S12, S22) or a pair (S11, S21)
┝r and ┤r
NIST iterative (S11, S21, S12, S22) or a pair (S11, S21)
┝r and ┤r = 1
New non-iterative (S11, S21, S12, S22) or a pair (S11, S21)
┝r and ┤r = 1
SCL S11 ┝r
Table 1. Comparison between the conversion techniques
NRW method
Nicholson-Ross-Weir (NRW) technique provides a direct calculation of both the permittivity and permeability from the s-parameters [69-70]. It is the most commonly used technique for performing such conversions. Measurement of reflection coefficient and transmission coefficient requires all four (S11, S21, S12, S22) or a pair (S11, S21) of s-parameters of the material under test to be measured. However, the technique diverges for low loss materials at frequencies corresponding to integer multiples of one-half wavelength in the sample which is due to the phase ambiguity. Hence, it is restricted to optimum sample thickness of ┣g/4 and used preferably for short samples The procedure proposed by NRW method is deduced from the following equations:
( )( )2
11 2 2
1
1
TS
T
Γ −= − Γ and ( )( )2
212 2
11
TS
T
− Γ= − Γ
These parameters can be obtained directly from the network analyzer. The reflection coefficient can be deduced as:
2 1X XΓ = ± − (33)
where, |Γ1| < 1 is required for finding the correct root and in terms of S-parameter
2 211 21
11
12
S SX
S
− += (34)
The transmission coefficient can be written as:
www.intechopen.com

Advances in Nanocomposites - Synthesis, Characterization and Industrial Applications
448
( )11 21
11 211S S
TS S
+ − Γ= − − Γ (35)
The permeability is given as:
( )1
2 2
11 11
r
o c
μλ λ
+ Γ=Λ −Γ −
(36)
where, ┣o is the free space wavelength and ┣c is the cutoff wavelength and
2 2 21 1r r
o c
ε μλ λ
⎛ ⎞= −⎜ ⎟⎜ ⎟Λ ⎝ ⎠ 2
1 1ln
2 L Tπ⎡ ⎤⎛ ⎞= −⎢ ⎥⎜ ⎟⎝ ⎠⎣ ⎦ (37)
The permittivity can be defined as
22
21 1 1
ln2
or
r c L T
λε μ πλ⎛ ⎞⎡ ⎤⎛ ⎞⎜ ⎟= − ⎢ ⎥⎜ ⎟⎜ ⎟⎝ ⎠⎣ ⎦⎝ ⎠
(38)
Equation (37) and (38) have an infinite number of roots since the imaginary part of the term ln(1/T) is equal to i(θ + 2πn) where, n= 0, ± 1, ± 2…, the integer of (L/┣g). The n can be determined by two methods. First method is by analysis of group delay and second is by estimating from ┣g using initial guess values of ┝r* and ┤r* for the sample. From the these methods the permittivity can be obtained as
( )( )
2 2 2
2 2 2
11
1o o
r r
c r c
λ λε μ λ μ λ⎛ ⎞− Γ= − +⎜ ⎟⎜ ⎟+ Γ ⎝ ⎠ (39)
where, L = length of material ┝r = relative permittivity ┤r = relative permeability ┝r* = initial guess permittivity ┤r* = initial guess permeability ┣g = wavelength in sample ┛ = propagation constant of material c = velocity of light f = frequency.
4. Synthesis of conducting ferromagnetic polyaniline-ferrite Composite
Generally polyaniline (PANI) is synthesized via chemical or electrochemical oxidation of a monomer where the polymerization reaction is stoichiometric in electrons. However, number of methods such as photochemical polymerization [71], pyrolysis [72,73], metal-catalyzed polymerization [74-76], solid-state polymerization [77], plasma polymerization [78], ring-forming condensation [79], step-growth polymerization [80, 81], and soluble precursor polymer preparation [82, 83], have been reported in literature for synthesis of conjugated polymers. Here only chemical and electrochemical polymerization are described briefly.
4.1 Chemical polymerization Polyaniline (Different forms of polyaniline are shown in Figure 11) emeraldine salt can be easily obtained as dark green powder by polymerization of aniline in aqueous media using
www.intechopen.com

Designing of Nano Composites of Conducting Polymers for EMI Shielding
449
oxidizing agents such as ammonium persulfate. The main advantage of chemical synthesis is its ease and capability to produce large volumes of polyaniline in good yield. The reaction is mainly carried out in acid medium at pH between 0 and 2. The concentration of the monomer employed varies between 0.01 and 1 M. Generally, a stoichiometric equivalent of oxidant is used to avoid degradation of the polymer. Oxidative chemical polymerization is generally carried out at low temperatures (–15 to 5°C) in order to obtain polyaniline with high molecular weight.
4.2 Electrochemical polymerization The anodic oxidation of aniline is generally carried out on an inert electrode material which is usually platinum. Polymerization of aniline is carried out in a three electrode single compartment containing aqueous acidic solution of aniline. The two commonly employed electrochemical routes are galvanostatic and potentiostatic modes. In the latter case, potential can be fixed (from 0.7 V to 1.2 V) or cycled (in the range of – 0.2 V to 0.9 V). The anodic oxidation is normally carried out in an inert atmosphere at ambient temperature. For many conceivable applications, deposition of the polymer as a thin film or thick coating is desirable which can be easily achieved using electrochemical polymerization.
HN
NH
HN
NH n
HN
N
N
NH n
HN
NH
HN
NH n
N
N
N
N
n
Leucoemerldine
Emeraldine Base
Emeraldine Salt
Pernigraniline
Fig. 11. Different forms of polyaniline; leucoemeraldine (completely reduced polymer); emeraldine base (half-oxidized half-reduced polymer); pernigraniline (fully oxidized polymer)
4.3 Synthesis of conducting ferromagnetic nanocompositec by emulsion polymerization Chemical oxidation of aniline in aqueous acidic media using ammonium persulfate oxidant is the most widely employed method [84, 85]. However, for the synthesis of ferrite
www.intechopen.com

Advances in Nanocomposites - Synthesis, Characterization and Industrial Applications
450
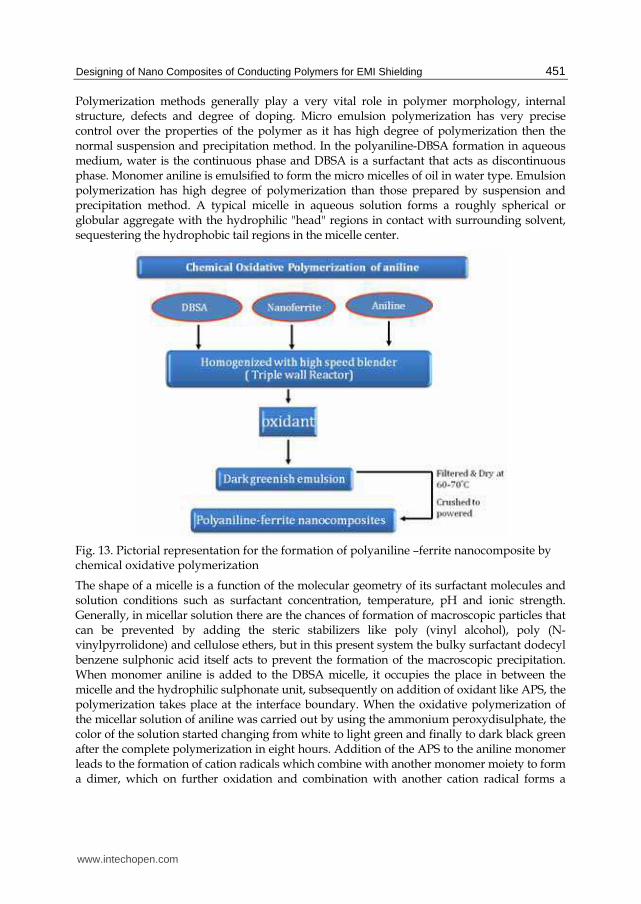
nanocomposite, the chemical oxidation of aniline in the presence of inorganic acid has some limitations like, dissociation of ferrite moieties at lower pH value and settling of ferrite particles due to higher density. Therefore, emulsion polymerization is an appropriate polymerization reaction which takes place in a large number of loci dispersed in a continuous external phase. Emulsion polymerization methods have several distinct advantages over the conventional in situ polymerization. The physical state of the emulsion system makes it easier to control the process. In a typical synthesis process, functional protonic acid such as dodecyl benzene sulphonic acid (DBSA) is used which being a bulky molecule, can act both as a surfactant and as dopant. Surfactants are amphiphilic compounds containing polar (hydrophilic) head and non-polar (hydrophobic) tails [86]. The polymerization of aniline monomer in the presence DBSA (dodecyl benzene sulfonic acid) leads to the formation of emeraldine salt form of polyaniline (figure 12). When the ferrite particles are homogenized with DBSA in aqueous solution, micelles are formed as surfactant form aggregates in which the hydrophobic tail are oriented towards the interior of the micelles leaving the hydrophilic group in contact with the aqueous medium [87]. In emulsion polymerization of intrinsic conducting polymers, the monomer and the ferrite particles assemble themselves in to micelles. The location of the monomer in the micelles is important as it can dictate the reaction mechanism and the properties of the final product [88]. The semipolar aniline monomer locates at the palisade layer (the region between the hydrophilic groups and the first few carbon atoms of the hydrophobic groups) of the micelle with the polar group at the micellar surface and the nonpolar hydrocarbon groups in the micellar. Anilinium cations sit between the individual DBSA molecules near the shell of the micelle complexed with sulfonate ion. When polymerization proceeds, anilinium cations are polymerized within the micelle together with DBSA and ferrite particles resulting in the formation of polyaniline–ferrite nanocomposites. Pictorial representation for the formation of polyaniline-ferrite composite is shown in figure13
Fig. 12. Schematic representation of the polymerization of aniline by formation of micelles
www.intechopen.com
Designing of Nano Composites of Conducting Polymers for EMI Shielding
451
Polymerization methods generally play a very vital role in polymer morphology, internal structure, defects and degree of doping. Micro emulsion polymerization has very precise control over the properties of the polymer as it has high degree of polymerization then the normal suspension and precipitation method. In the polyaniline-DBSA formation in aqueous medium, water is the continuous phase and DBSA is a surfactant that acts as discontinuous phase. Monomer aniline is emulsified to form the micro micelles of oil in water type. Emulsion polymerization has high degree of polymerization than those prepared by suspension and precipitation method. A typical micelle in aqueous solution forms a roughly spherical or globular aggregate with the hydrophilic "head" regions in contact with surrounding solvent, sequestering the hydrophobic tail regions in the micelle center.
Fig. 13. Pictorial representation for the formation of polyaniline –ferrite nanocomposite by chemical oxidative polymerization
The shape of a micelle is a function of the molecular geometry of its surfactant molecules and solution conditions such as surfactant concentration, temperature, pH and ionic strength. Generally, in micellar solution there are the chances of formation of macroscopic particles that can be prevented by adding the steric stabilizers like poly (vinyl alcohol), poly (N-vinylpyrrolidone) and cellulose ethers, but in this present system the bulky surfactant dodecyl benzene sulphonic acid itself acts to prevent the formation of the macroscopic precipitation. When monomer aniline is added to the DBSA micelle, it occupies the place in between the micelle and the hydrophilic sulphonate unit, subsequently on addition of oxidant like APS, the polymerization takes place at the interface boundary. When the oxidative polymerization of the micellar solution of aniline was carried out by using the ammonium peroxydisulphate, the color of the solution started changing from white to light green and finally to dark black green after the complete polymerization in eight hours. Addition of the APS to the aniline monomer leads to the formation of cation radicals which combine with another monomer moiety to form a dimer, which on further oxidation and combination with another cation radical forms a
www.intechopen.com
Advances in Nanocomposites - Synthesis, Characterization and Industrial Applications
452
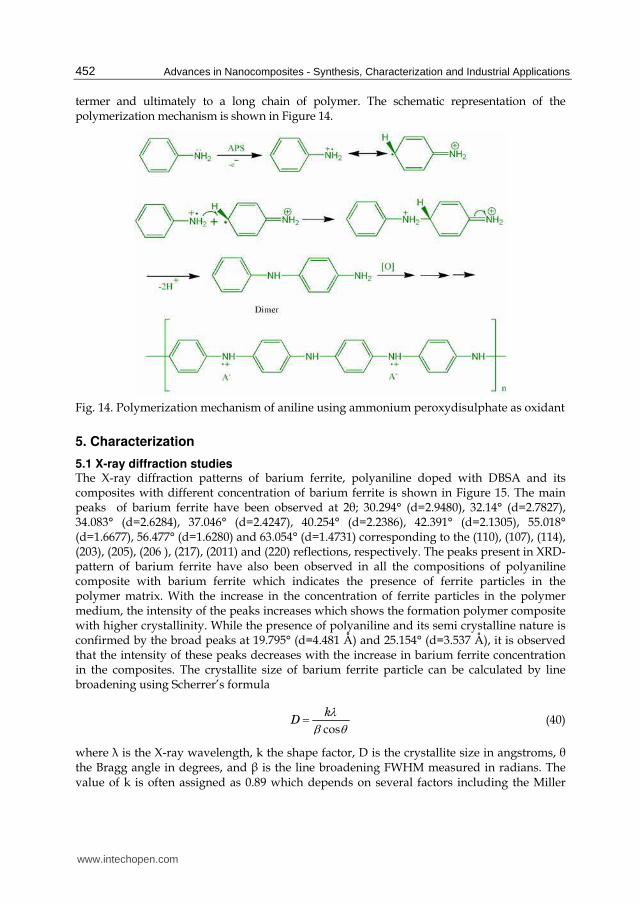
termer and ultimately to a long chain of polymer. The schematic representation of the polymerization mechanism is shown in Figure 14.
Fig. 14. Polymerization mechanism of aniline using ammonium peroxydisulphate as oxidant
5. Characterization
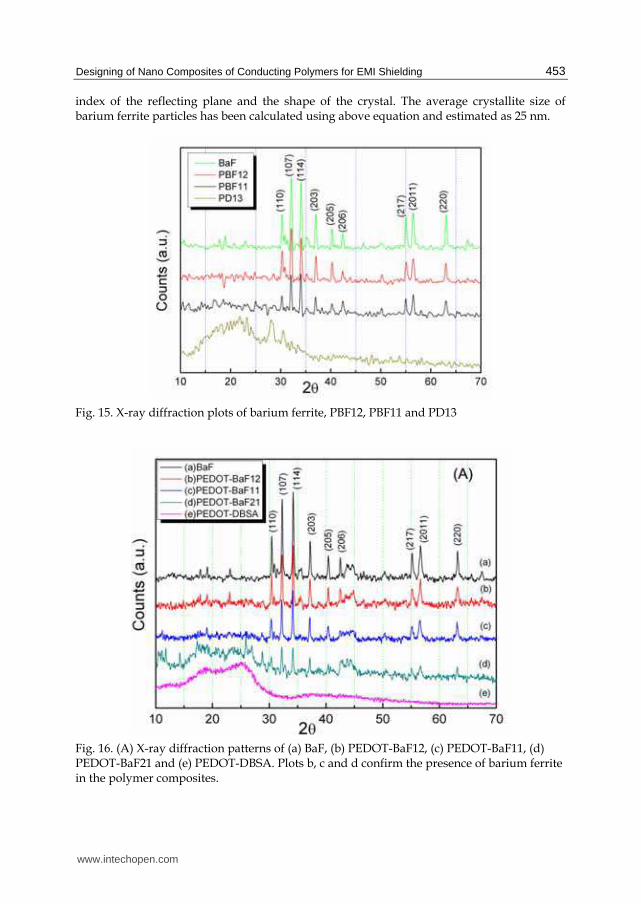
5.1 X-ray diffraction studies The X-ray diffraction patterns of barium ferrite, polyaniline doped with DBSA and its composites with different concentration of barium ferrite is shown in Figure 15. The main peaks of barium ferrite have been observed at 2θ; 30.294° (d=2.9480), 32.14° (d=2.7827), 34.083° (d=2.6284), 37.046° (d=2.4247), 40.254° (d=2.2386), 42.391° (d=2.1305), 55.018° (d=1.6677), 56.477° (d=1.6280) and 63.054° (d=1.4731) corresponding to the (110), (107), (114), (203), (205), (206 ), (217), (2011) and (220) reflections, respectively. The peaks present in XRD-pattern of barium ferrite have also been observed in all the compositions of polyaniline composite with barium ferrite which indicates the presence of ferrite particles in the polymer matrix. With the increase in the concentration of ferrite particles in the polymer medium, the intensity of the peaks increases which shows the formation polymer composite with higher crystallinity. While the presence of polyaniline and its semi crystalline nature is confirmed by the broad peaks at 19.795° (d=4.481 Å) and 25.154° (d=3.537 Å), it is observed that the intensity of these peaks decreases with the increase in barium ferrite concentration in the composites. The crystallite size of barium ferrite particle can be calculated by line broadening using Scherrer’s formula
cosk
Dλ
β θ= (40)
where ┣ is the X-ray wavelength, k the shape factor, D is the crystallite size in angstroms, θ the Bragg angle in degrees, and ┚ is the line broadening FWHM measured in radians. The value of k is often assigned as 0.89 which depends on several factors including the Miller
www.intechopen.com
Designing of Nano Composites of Conducting Polymers for EMI Shielding
453
index of the reflecting plane and the shape of the crystal. The average crystallite size of barium ferrite particles has been calculated using above equation and estimated as 25 nm.
Fig. 15. X-ray diffraction plots of barium ferrite, PBF12, PBF11 and PD13
Fig. 16. (A) X-ray diffraction patterns of (a) BaF, (b) PEDOT-BaF12, (c) PEDOT-BaF11, (d) PEDOT-BaF21 and (e) PEDOT-DBSA. Plots b, c and d confirm the presence of barium ferrite in the polymer composites.
www.intechopen.com
Advances in Nanocomposites - Synthesis, Characterization and Industrial Applications
454
Figure 16 illustrates the X-ray diffraction patterns of PEDOT-DBSA, barium ferrite, PEDOT nanocomposites with different compositions of barium ferrite (PEDOT-BaF). PEDOT-DBSA shows two broad peaks at 2θ = 19° and 25°, which reveals its amorphous nature. With the addition of ferrite particle, the peaks of barium ferrite start appearing in the composite and and lead to enhanced crystallinity.
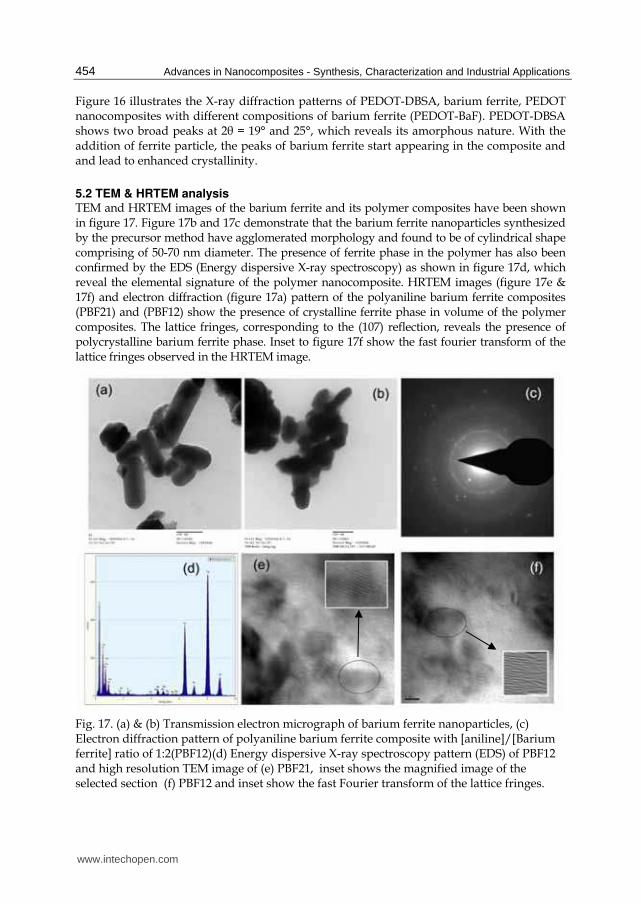
5.2 TEM & HRTEM analysis TEM and HRTEM images of the barium ferrite and its polymer composites have been shown in figure 17. Figure 17b and 17c demonstrate that the barium ferrite nanoparticles synthesized by the precursor method have agglomerated morphology and found to be of cylindrical shape comprising of 50-70 nm diameter. The presence of ferrite phase in the polymer has also been confirmed by the EDS (Energy dispersive X-ray spectroscopy) as shown in figure 17d, which reveal the elemental signature of the polymer nanocomposite. HRTEM images (figure 17e & 17f) and electron diffraction (figure 17a) pattern of the polyaniline barium ferrite composites (PBF21) and (PBF12) show the presence of crystalline ferrite phase in volume of the polymer composites. The lattice fringes, corresponding to the (107) reflection, reveals the presence of polycrystalline barium ferrite phase. Inset to figure 17f show the fast fourier transform of the lattice fringes observed in the HRTEM image.
Fig. 17. (a) & (b) Transmission electron micrograph of barium ferrite nanoparticles, (c) Electron diffraction pattern of polyaniline barium ferrite composite with [aniline]/[Barium ferrite] ratio of 1:2(PBF12)(d) Energy dispersive X-ray spectroscopy pattern (EDS) of PBF12 and high resolution TEM image of (e) PBF21, inset shows the magnified image of the selected section (f) PBF12 and inset show the fast Fourier transform of the lattice fringes.
www.intechopen.com
Designing of Nano Composites of Conducting Polymers for EMI Shielding
455
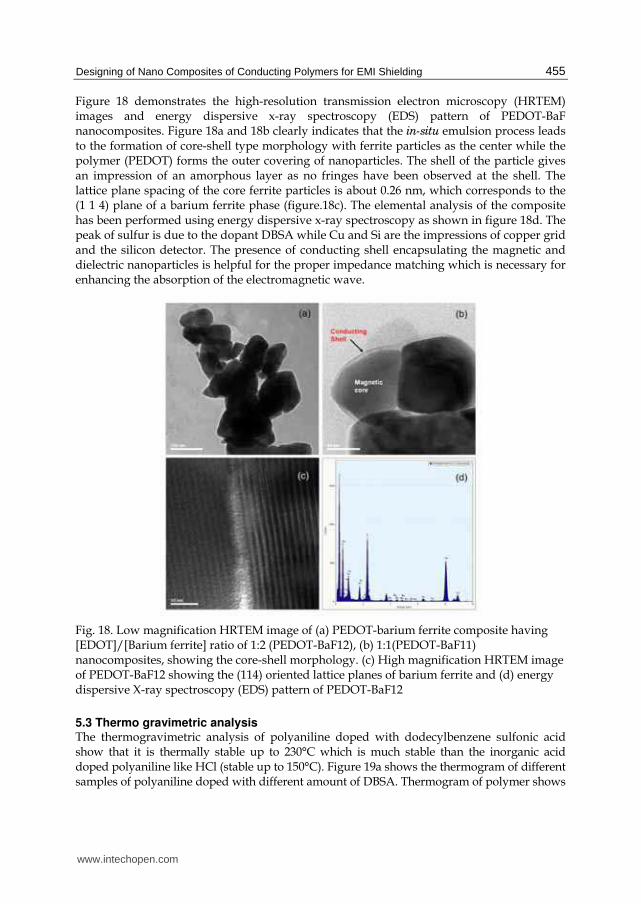
Figure 18 demonstrates the high-resolution transmission electron microscopy (HRTEM) images and energy dispersive x-ray spectroscopy (EDS) pattern of PEDOT-BaF nanocomposites. Figure 18a and 18b clearly indicates that the in-situ emulsion process leads to the formation of core-shell type morphology with ferrite particles as the center while the polymer (PEDOT) forms the outer covering of nanoparticles. The shell of the particle gives an impression of an amorphous layer as no fringes have been observed at the shell. The lattice plane spacing of the core ferrite particles is about 0.26 nm, which corresponds to the (1 1 4) plane of a barium ferrite phase (figure.18c). The elemental analysis of the composite has been performed using energy dispersive x-ray spectroscopy as shown in figure 18d. The peak of sulfur is due to the dopant DBSA while Cu and Si are the impressions of copper grid and the silicon detector. The presence of conducting shell encapsulating the magnetic and dielectric nanoparticles is helpful for the proper impedance matching which is necessary for enhancing the absorption of the electromagnetic wave.
Fig. 18. Low magnification HRTEM image of (a) PEDOT-barium ferrite composite having [EDOT]/[Barium ferrite] ratio of 1:2 (PEDOT-BaF12), (b) 1:1(PEDOT-BaF11) nanocomposites, showing the core-shell morphology. (c) High magnification HRTEM image of PEDOT-BaF12 showing the (114) oriented lattice planes of barium ferrite and (d) energy dispersive X-ray spectroscopy (EDS) pattern of PEDOT-BaF12
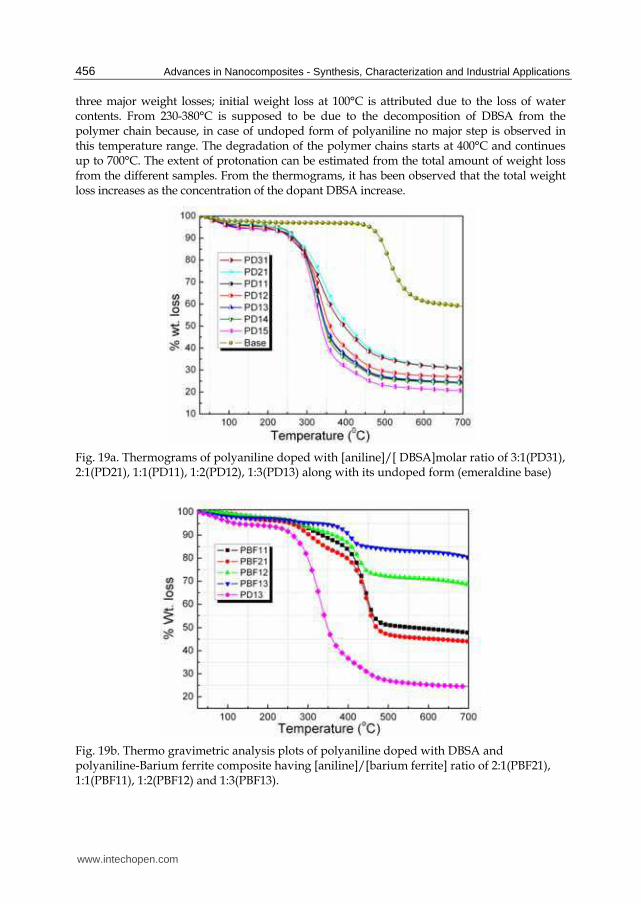
5.3 Thermo gravimetric analysis The thermogravimetric analysis of polyaniline doped with dodecylbenzene sulfonic acid show that it is thermally stable up to 230°C which is much stable than the inorganic acid doped polyaniline like HCl (stable up to 150°C). Figure 19a shows the thermogram of different samples of polyaniline doped with different amount of DBSA. Thermogram of polymer shows
www.intechopen.com
Advances in Nanocomposites - Synthesis, Characterization and Industrial Applications
456
three major weight losses; initial weight loss at 100°C is attributed due to the loss of water contents. From 230-380°C is supposed to be due to the decomposition of DBSA from the polymer chain because, in case of undoped form of polyaniline no major step is observed in this temperature range. The degradation of the polymer chains starts at 400°C and continues up to 700°C. The extent of protonation can be estimated from the total amount of weight loss from the different samples. From the thermograms, it has been observed that the total weight loss increases as the concentration of the dopant DBSA increase.
Fig. 19a. Thermograms of polyaniline doped with [aniline]/[ DBSA]molar ratio of 3:1(PD31), 2:1(PD21), 1:1(PD11), 1:2(PD12), 1:3(PD13) along with its undoped form (emeraldine base)
Fig. 19b. Thermo gravimetric analysis plots of polyaniline doped with DBSA and polyaniline-Barium ferrite composite having [aniline]/[barium ferrite] ratio of 2:1(PBF21), 1:1(PBF11), 1:2(PBF12) and 1:3(PBF13).
www.intechopen.com
Designing of Nano Composites of Conducting Polymers for EMI Shielding
457
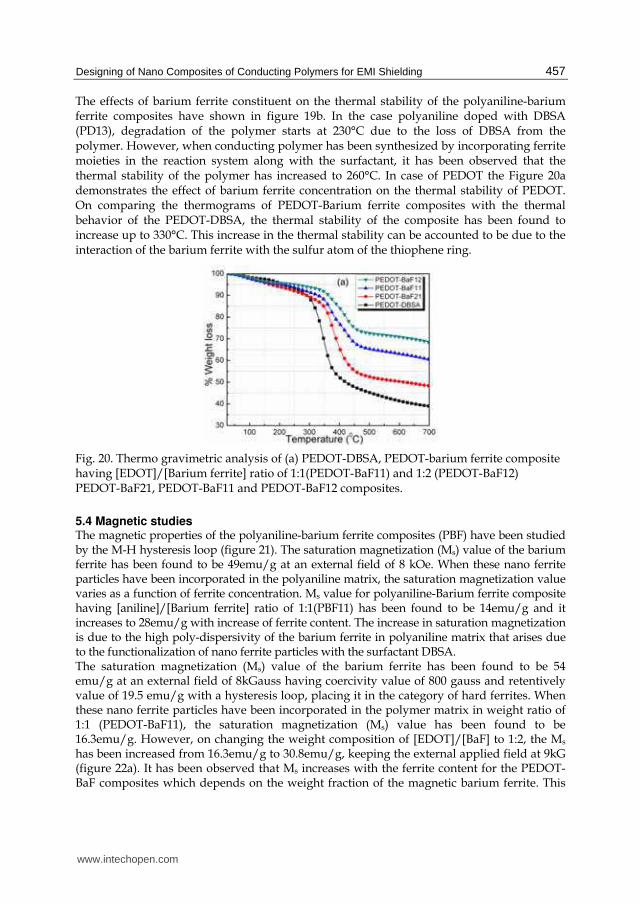
The effects of barium ferrite constituent on the thermal stability of the polyaniline-barium ferrite composites have shown in figure 19b. In the case polyaniline doped with DBSA (PD13), degradation of the polymer starts at 230°C due to the loss of DBSA from the polymer. However, when conducting polymer has been synthesized by incorporating ferrite moieties in the reaction system along with the surfactant, it has been observed that the thermal stability of the polymer has increased to 260°C. In case of PEDOT the Figure 20a demonstrates the effect of barium ferrite concentration on the thermal stability of PEDOT. On comparing the thermograms of PEDOT-Barium ferrite composites with the thermal behavior of the PEDOT-DBSA, the thermal stability of the composite has been found to increase up to 330°C. This increase in the thermal stability can be accounted to be due to the interaction of the barium ferrite with the sulfur atom of the thiophene ring.
Fig. 20. Thermo gravimetric analysis of (a) PEDOT-DBSA, PEDOT-barium ferrite composite having [EDOT]/[Barium ferrite] ratio of 1:1(PEDOT-BaF11) and 1:2 (PEDOT-BaF12) PEDOT-BaF21, PEDOT-BaF11 and PEDOT-BaF12 composites.
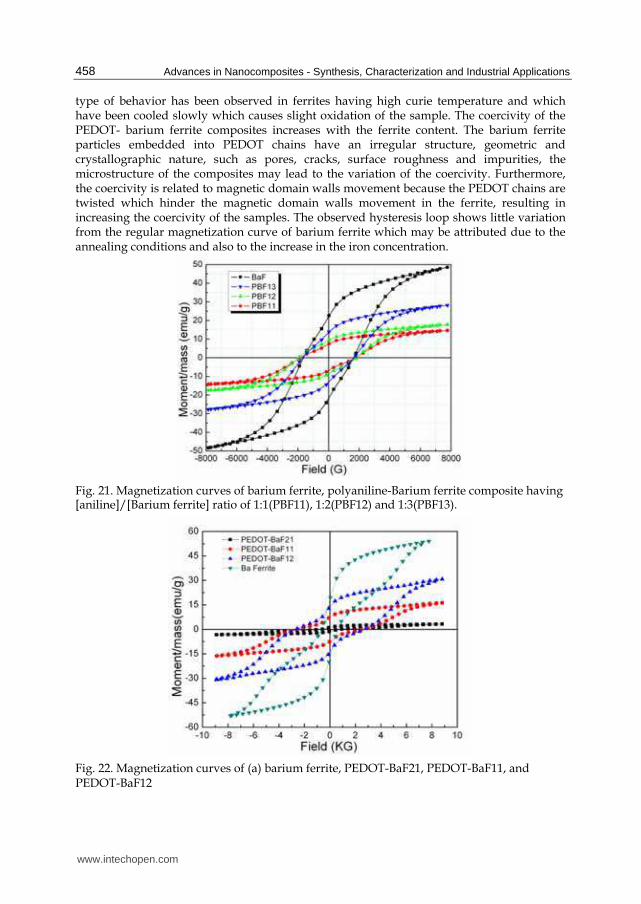
5.4 Magnetic studies The magnetic properties of the polyaniline-barium ferrite composites (PBF) have been studied by the M-H hysteresis loop (figure 21). The saturation magnetization (Ms) value of the barium ferrite has been found to be 49emu/g at an external field of 8 kOe. When these nano ferrite particles have been incorporated in the polyaniline matrix, the saturation magnetization value varies as a function of ferrite concentration. Ms value for polyaniline-Barium ferrite composite having [aniline]/[Barium ferrite] ratio of 1:1(PBF11) has been found to be 14emu/g and it increases to 28emu/g with increase of ferrite content. The increase in saturation magnetization is due to the high poly-dispersivity of the barium ferrite in polyaniline matrix that arises due to the functionalization of nano ferrite particles with the surfactant DBSA. The saturation magnetization (Ms) value of the barium ferrite has been found to be 54 emu/g at an external field of 8kGauss having coercivity value of 800 gauss and retentively value of 19.5 emu/g with a hysteresis loop, placing it in the category of hard ferrites. When these nano ferrite particles have been incorporated in the polymer matrix in weight ratio of 1:1 (PEDOT-BaF11), the saturation magnetization (Ms) value has been found to be 16.3emu/g. However, on changing the weight composition of [EDOT]/[BaF] to 1:2, the Ms has been increased from 16.3emu/g to 30.8emu/g, keeping the external applied field at 9kG (figure 22a). It has been observed that Ms increases with the ferrite content for the PEDOT- BaF composites which depends on the weight fraction of the magnetic barium ferrite. This
www.intechopen.com
Advances in Nanocomposites - Synthesis, Characterization and Industrial Applications
458
type of behavior has been observed in ferrites having high curie temperature and which have been cooled slowly which causes slight oxidation of the sample. The coercivity of the PEDOT- barium ferrite composites increases with the ferrite content. The barium ferrite particles embedded into PEDOT chains have an irregular structure, geometric and crystallographic nature, such as pores, cracks, surface roughness and impurities, the microstructure of the composites may lead to the variation of the coercivity. Furthermore, the coercivity is related to magnetic domain walls movement because the PEDOT chains are twisted which hinder the magnetic domain walls movement in the ferrite, resulting in increasing the coercivity of the samples. The observed hysteresis loop shows little variation from the regular magnetization curve of barium ferrite which may be attributed due to the annealing conditions and also to the increase in the iron concentration.
Fig. 21. Magnetization curves of barium ferrite, polyaniline-Barium ferrite composite having [aniline]/[Barium ferrite] ratio of 1:1(PBF11), 1:2(PBF12) and 1:3(PBF13).
Fig. 22. Magnetization curves of (a) barium ferrite, PEDOT-BaF21, PEDOT-BaF11, and PEDOT-BaF12
www.intechopen.com
Designing of Nano Composites of Conducting Polymers for EMI Shielding
459
5.5 Shielding measurements The EMI shielding effectiveness (SE) of a material is defined as the ratio of transmitted power to the incident power and given by
( ) 10log tPSE dB
Po= − (41)
where, Pt and P0 are the transmitted and incident electromagnetic power, respectively. The amount of attenuation offered by the shield depends on three mechanisms. The first is usually a reflection of a wave from the shields, second is an absorption in to the shields as it passes through the shield and the third one is re-reflection, i.e., multiple reflections at various surface. For a shielding material, total SE is the sum SER + SEA + SEM, where, SER is due to reflection, SEA is due to absorption and SEM is due to multiple reflections [89]. In two-port network analyzer, S-parameters S11 (S22) and S21 (S12) represent the reflection and the transmission coefficients;
2
2 221 12
T
I
ET S S
E= = = (42)
2
2 211 22
R
I
ER S S
E= = = (43)
A = 1 – R – T (44)
Here, it is noted that A is given with respect to the power of the incident EM wave. If the effect of multiple reflection between both interfaces of the material is negligible, the relative intensity of the effectively incident EM wave inside the material after reflection is based on the quantity 1-R. Therefore, the effective absorbance (Aeff) can be described as
11eff
R TA
R
− −= − (45)
with respect to the power of the effectively incident EM wave inside the shielding material. It is convenient that reflectance and effective absorbance are expressed the form of –10log (1–R) and –10log (1–Aeff) in decibel (dB), respectively, which provide the SEA as follows:
10log(1 )RSE R= − − (46)
10log(1 ) 10log1A eff
TSE A
R= − − = − − (47)
Figure 23 shows the shielding effectiveness of polyaniline doped with DBSA in the frequency range of 8.2 to 12.4 GHz. The SER and SEA values have been calculated by using equation 46 and 47. It has been found that on increasing the DBSA concentration during the polymerization of aniline to polyaniline, the SER value decreases from 2.8 to 2.2dB while SEA
increases from 16.3 to 26.5dB calculated at 12.4 GHz. In conducting polymer the absorption part contributes more towards the shielding effectiveness as compared to reflection component which is just reverse of metallic material. Polyaniline with lower concentration
www.intechopen.com

Advances in Nanocomposites - Synthesis, Characterization and Industrial Applications
460
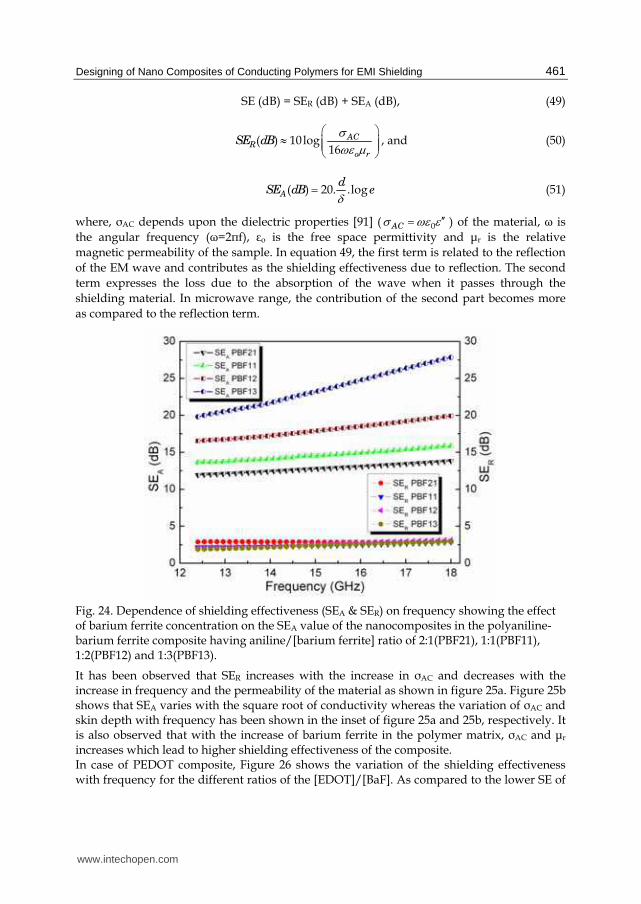
of dopant i.e. [aniline]/[DBDA] in ratio of 3:1 (PD31) has SER value of 2.8dB and SEA value of 16.3dB whereas in ratio of 1:4 (PD14) shows smaller SER of the order of 2.2dB with higher SEA value of the order of 26.5dB. This increase in the shielding effectiveness due to absorption is due to the increase in the conductivity of the polyaniline that leads to increase in the number of free charge carriers which results in higher polarizability and high ac conductivity. These results suggest that the microwave absorption loss in polyaniline depends upon concentration of dopant DBSA. In case of polyaniline-barium ferrite (PBF) nanocomposite (Figure 24) the shielding effectiveness (SE) mainly due to absorption and it is found to increase with ferrite concentration and it stabilizes after the threshold loading. The variation of SEA for the composite having the [aniline] / [Barium ferrite] ratio of 2:1 (PBF21) has been found to be minimum (11.8dB to 13.8dB) whereas the composite with higher ratio for the 1:3 (PBF13), the SEA has been found to be maximum (19.9dB to 28.9dB) while the SE due to reflection has been found to be nominal and its contribution is very little. The calculated value of SER lies between 1.8dB to 3.1dB.
(a) (b)
Fig. 23. Variation of shielding effectiveness due to (a) reflection (SER) and (b) absorption (SEA) in the frequency range of 8.2-12.4GHz of polyaniline having [aniline]/[DBSA] ratio of 3:1( PD31), 2:1(PD21), 1:1(PD11), 1:2(PD12), 1:3 (PD13, 1:4 (PD14.)
The effect of skin depth and AC conductivity on shielding effectiveness has been studied. For a material, the skin depth (├) is the distance up to which the intensity of the electromagnetic wave decreases to 1/e of its original strength. The skin depth is related with the attenuation constant (┚) of the wave propagation vector 1 2 / ACδ β ωμσ= = with the approximations that σ >> ω┝. As ├ ∝ ω-1/2, therefore, at low frequencies, for electrically thin samples (d << ├), the shielding effectiveness of the sample is given as
1
SE (dB) 20log 12 OZ dσ⎛ ⎞= +⎜ ⎟⎝ ⎠ (48)
where, σ is the ac conductivity, Zo is free space impedance and d is the sample thickness. For the higher frequencies, sample thickness (electrically thick samples) is sufficiently greater than skin depth and EMI shielding effectiveness for the plane electromagnetic wave [90] is given by
www.intechopen.com
Designing of Nano Composites of Conducting Polymers for EMI Shielding
461
SE (dB) = SER (dB) + SEA (dB), (49)
( ) 10log16
ACR
o r
SE dBσωε μ
⎛ ⎞≈ ⎜ ⎟⎜ ⎟⎝ ⎠ , and (50)
( ) 20. .logA
dSE dB eδ= (51)
where, σAC depends upon the dielectric properties [91] ( 0ACσ ωε ε ′′= ) of the material, ω is the angular frequency (ω=2πf), ┝o is the free space permittivity and ┤r is the relative magnetic permeability of the sample. In equation 49, the first term is related to the reflection of the EM wave and contributes as the shielding effectiveness due to reflection. The second term expresses the loss due to the absorption of the wave when it passes through the shielding material. In microwave range, the contribution of the second part becomes more as compared to the reflection term.
Fig. 24. Dependence of shielding effectiveness (SEA & SER) on frequency showing the effect of barium ferrite concentration on the SEA value of the nanocomposites in the polyaniline-barium ferrite composite having aniline/[barium ferrite] ratio of 2:1(PBF21), 1:1(PBF11), 1:2(PBF12) and 1:3(PBF13).
It has been observed that SER increases with the increase in σAC and decreases with the increase in frequency and the permeability of the material as shown in figure 25a. Figure 25b shows that SEA varies with the square root of conductivity whereas the variation of σAC and skin depth with frequency has been shown in the inset of figure 25a and 25b, respectively. It is also observed that with the increase of barium ferrite in the polymer matrix, σAC and ┤r increases which lead to higher shielding effectiveness of the composite. In case of PEDOT composite, Figure 26 shows the variation of the shielding effectiveness with frequency for the different ratios of the [EDOT]/[BaF]. As compared to the lower SE of
www.intechopen.com

Advances in Nanocomposites - Synthesis, Characterization and Industrial Applications
462
Fig. 25. (a) Variation of SER as a function of log σAC while the inset shows the variation of σAC with the increase in frequency and (b) variation of SEA as function of (σAC)1/2 while the inset shows the change in skin depth (├) with the increase in frequency for the polyaniline - barium ferrite having[aniline]/[barium ferrite] ratio of 1:2( PBF12).
PEDOT-DBSA, the SE of the composite increases with the ferrite content exhibiting excellent frequency stability in the measured frequency range. PEDOT with higher ratio of [EDOT]/[Barium ferrite] of 1:2 (PEDOT-BaF12) has higher SEA of 22.4 dB with nominal SER of 2dB as compared to SEA value of 8dB and comparable reflection SER of 6dB for the PEDOT-DBSA. This shows that incorporation of the ferrite particles in the copolymer matrix leads to the improvement in the microwave absorption properties. The dependence of SE on complex permittivity and permeability can be expressed as [90]
( ) 20 log 20 .log2
r ACA
dSE dB e d e
μ ωσδ= = (52)
0
( ) 10log16
ACR
r
SE dBσωμ ε
⎛ ⎞= ⎜ ⎟⎜ ⎟⎝ ⎠ (53)
www.intechopen.com
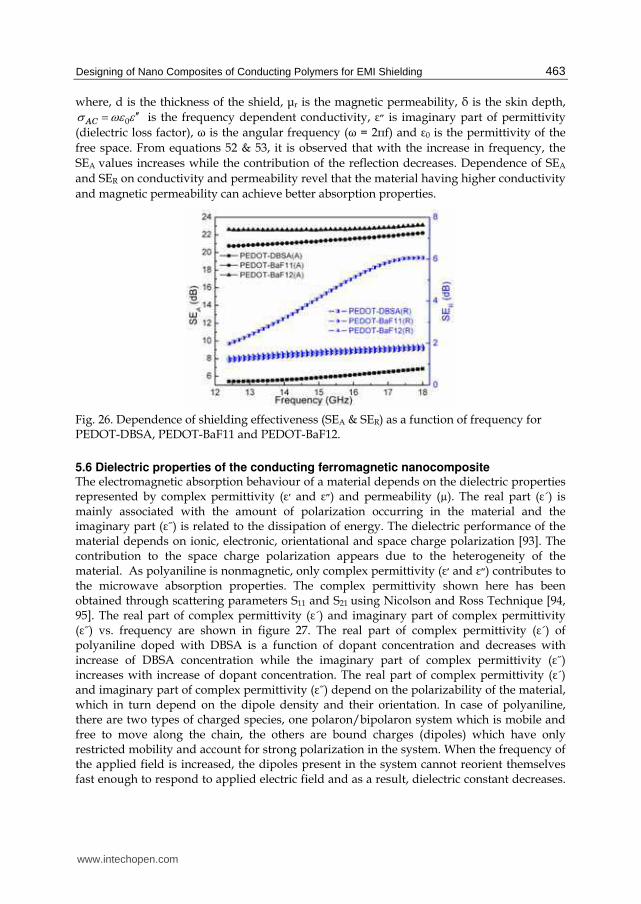
Designing of Nano Composites of Conducting Polymers for EMI Shielding
463
where, d is the thickness of the shield, ┤r is the magnetic permeability, ├ is the skin depth, 0ACσ ωε ε ′′= is the frequency dependent conductivity, ┝∞ is imaginary part of permittivity
(dielectric loss factor), ω is the angular frequency (ω = 2πf) and ┝0 is the permittivity of the free space. From equations 52 & 53, it is observed that with the increase in frequency, the SEA values increases while the contribution of the reflection decreases. Dependence of SEA and SER on conductivity and permeability revel that the material having higher conductivity and magnetic permeability can achieve better absorption properties.
Fig. 26. Dependence of shielding effectiveness (SEA & SER) as a function of frequency for PEDOT-DBSA, PEDOT-BaF11 and PEDOT-BaF12.
5.6 Dielectric properties of the conducting ferromagnetic nanocomposite The electromagnetic absorption behaviour of a material depends on the dielectric properties represented by complex permittivity (┝≧ and ┝∞) and permeability (µ). The real part (┝´) is mainly associated with the amount of polarization occurring in the material and the imaginary part (┝˝) is related to the dissipation of energy. The dielectric performance of the material depends on ionic, electronic, orientational and space charge polarization [93]. The contribution to the space charge polarization appears due to the heterogeneity of the material. As polyaniline is nonmagnetic, only complex permittivity (┝≧ and ┝∞) contributes to the microwave absorption properties. The complex permittivity shown here has been obtained through scattering parameters S11 and S21 using Nicolson and Ross Technique [94, 95]. The real part of complex permittivity (┝´) and imaginary part of complex permittivity (┝˝) vs. frequency are shown in figure 27. The real part of complex permittivity (┝´) of polyaniline doped with DBSA is a function of dopant concentration and decreases with increase of DBSA concentration while the imaginary part of complex permittivity (┝˝) increases with increase of dopant concentration. The real part of complex permittivity (┝´) and imaginary part of complex permittivity (┝˝) depend on the polarizability of the material, which in turn depend on the dipole density and their orientation. In case of polyaniline, there are two types of charged species, one polaron/bipolaron system which is mobile and free to move along the chain, the others are bound charges (dipoles) which have only restricted mobility and account for strong polarization in the system. When the frequency of the applied field is increased, the dipoles present in the system cannot reorient themselves fast enough to respond to applied electric field and as a result, dielectric constant decreases.
www.intechopen.com

Advances in Nanocomposites - Synthesis, Characterization and Industrial Applications
464
With the increase in the dopant concentration, the number of mobile charges increases which results in the higher dielectric loss (┝˝) while the values of real part decreases. The polyaniline synthesized with monomer to dopant concentration of 3:1 (PD31) has dielectric constant (┝´ = 22.5 to 19.1) with dielectric loss (┝˝= 26.9 to 24.1) while the polyaniline with higher concentration ie molar ratio of monomer to dopant of 1:4(PD14) has dielectric constant (┝´=7.6 to 5.8) with imaginary permittivity (┝˝= 51.9 to 34.9).
(a) (b)
Fig. 27. (a) Dielectric constant (┝≧) and (b) dielectric loss (┝∞) of polyaniline having [aniline/DBSA] ratio of 3:1(PD31), 2:1(PD21), 1:1( PD11), 1:2( PD12) and 1:4 (PD14)
In case of polyaniline composite with barium ferrite, the real part (┝´) has been found to be decreasing with the increase in frequency (Figure 28). The presence of insulating barium ferrite in the conducting matrix results in the formation of more interface and heterogeneous system due to which some space charge accumulates at the interface which contributes towards the higher microwave absorption in the composites. The contribution to the orientational polarization comes due to the presence of bound charges (dipoles). Firstly, in polyaniline, strong polarization occurs due to the presence of polaron/bipolaron and other bound charges which leads to high value of ┝≧ & ┝∞. With the increase in frequency, the dipoles present in the system cannot reorient themselves along with the applied electric field therefore, dielectric constant decreases. Secondly, for the magnetic nanoparticles effective anisotropy, which includes magneto crystalline anisotropy and shape anisotropy, rotation of domain may become more difficult. Furthermore, the particle size of barium ferrite is in the range of nanometer. The surface area, number of dangling bond atoms and unsaturated coordination on the surface are all enhanced. These variations lead to the interface polarization and multiple scattering which are useful for the absorption of large number of microwaves [96, 97]. In polyaniline composites, both the phenomenon happen together resulting in high SEA value. The polyaniline composite having higher ratio of 1:3 monomer to ferrite (PBF13) has lower dielectric constant (┝´=17) but higher dielectric loss (┝˝=34) and magnetic permeability (µ´=2.2) which corresponds to enhanced value of shielding effectiveness due to absorption. In case of PEDOT, both, real and imaginary part of the permittivity remains constant in the measured frequency range (figure 29a & 29b) while in case of PEDOT-barium ferrite nanocomposites the incorporation of insulating barium ferrite in the conducting matrix shows higher values of ┝´ and ┝˝ as compared to PEDOT-DBSA and decreases with the
www.intechopen.com

Designing of Nano Composites of Conducting Polymers for EMI Shielding
465
Fig. 28. Variation of (a) real and (b) imaginary part of permittivity with frequency. Figures c & d show the variation of real and imaginary part of magnetic permeability with frequency for the samples having [aniline/Barium ferrite] ratio of 2:1( PBF21), 1:1( PBF11), 1:2( PBF12) and 1:3( PBF13)
.
Fig. 29. Behavior of (a) real and (b) imaginary part of complex permittivity PEDOT-BaF composites as a function of frequency.
www.intechopen.com

Advances in Nanocomposites - Synthesis, Characterization and Industrial Applications
466
frequency. The higher values of ┝´ and ┝˝ arise due to the difference in the relative dielectric constant of barium ferrite and the PEDOT which results in the accumulation of more space charge and strong orientational polarization that consequently leads to the improved values of microwave absorption. The variation in the real (┤´) and imaginary (┤˝) part of permeability with frequency for the PEDOT-BaF composites with different [EDOT]/[Barium Ferrite] ratios is shown in Figure 30 Real part of the permeability remains constant with a little fluctuation in the measured frequency range whereas the magnetic loss part slightly decreases with the frequency. Higher values of ┤˝ have been observed for PEDOT-BaF12 as compared to PEDOT-BaF11 which confirms the existence of greater magnetic losses in PEDOT-BaF12 nanocomposite. The magnetic loss expressed by the imaginary part of complex permeability, mainly occur because of magnetic hysteresis and domain-wall displacement in the material.
Fig. 30. Variation of real and imaginary part of magnetic permeability of PEDOT-barium ferrite composite having [EDOT]/[Barium ferrite] ratio of 1:1(PEDOT-BaF11) and 1:2 (PEDOT-BaF12) s as a function of frequency
The permeability for the hexagonal ferrites having the c-axis as the preferred direction of magnetization is defined as [98]
( 1) 2
4 3
Ms
HA
μπ− ⎛ ⎞= ⎜ ⎟⎝ ⎠ (54)
where, Ms is the saturation magnetization and HA is the anisotropy field. As the frequency increases, ┤ remains equal to its static (dc) value up to a critical frequency and then decreases with the further increase in frequency. Whereas, the imaginary part of permeability (┤˝) starts increasing near the critical frequency and has a maxima at the resonance frequency which demonstrates the maximum power loss. The larger the static value of ┤, the lower is the frequency at which this decrease occurs as given by Snoek`s law [99]. The frequency of this precession depends on how strongly the magnetization is bound to the easy axis. The stronger the coupling, higher is the natural frequency of precession. The strength of this coupling depends on the value of the magneto-crystalline anisotropy K or the anisotropy field HA, which is proportional to Ms [98]. In barium ferrite, due to the large anisotropy field, the coupling of the magnetic dipole is strong. When the frequency of
www.intechopen.com

Designing of Nano Composites of Conducting Polymers for EMI Shielding
467
the applied field increases, the magnetic dipole try to rotate with the frequency but at higher frequency due to strong anisotropy, the induced magnetization (B) lags behind the applied field (H) which results in magnetic losses. The larger is the anisotropy, higher is the difference in B and H and more are the magnetic losses occurring in the material [100]. In magnetic nanoparticles, the rotation of domains becomes difficult due to the effective anisotropy (magneto-crystalline anisotropy and shape anisotropy). The effective anisotropy coefficient can be enhanced significantly with decreasing particle size due to the surface effect and microstructure defects [101, 102]. Therefore, the increase in barium ferrite content in the polymer matrix leads to higher magnetic loss which in turn enhances absorption of the microwaves. The dielectric and magnetic loss in the whole frequency range provides the balanced property of EM matching in the composite suggesting that the enhanced microwave absorption properties unambiguously results from the cooperative effect of PEDOT shell and ferrite cores.
6. Improvement in electromagnetic shielding properties of conducting ferromagnetic nanocomposites via dielectric filler TiO2
Polymeric materials with high dielectric constants are highly desirable for use in actuators, artificial muscles and charge-storage devices [103,104]. To raise the dielectric constant of polymers, high-dielectric constant ceramic powders such as BaTiO3 and PbTiO3 have been added to the polymers to form nanocomposites [105-110]. The electrical properties of polyaniline could be modified by the addition of inorganic fillers [111–116]. Nanoscale fillers are the most attractive due to the intriguing properties arising from the nanosize and large surface area. The insertion of nanoscale fillers may improve the electrical and dielectric properties of host materials. A high-dielectric constant up to 3700 for polyaniline–TiO2 nanocomposite materials has been reported by Dey et al. [115]. However, high-dielectric constants are usually accompanied with high-dielectric losses. Xu et al. [117] noticed that the electrical conductivity of a polyaniline-TiO2 nanocomposite with a low TiO2 content is much higher than of polyaniline. Su et al. [118] reported that the polyaniline-TiO2 nanocomposite has suitable conductivity (1–10 S/cm) and increases after thermal treatment at 80°C for 1h. Due to moderate conductivity and high dielectric losses, these polymer composites found its application as microwave absorber.
Fig. 31. Schematic representation of the interaction of microwave with PBT nanocomposites incorporating barium ferrite and TiO2 nanoparticles
www.intechopen.com

Advances in Nanocomposites - Synthesis, Characterization and Industrial Applications
468
In this section, the effect of TiO2 nanoparticles on the dielectric and microwave absorption properties of the polyaniline-barium ferrite composite has been discussed. The incorporation of dielectric filler and magnetic filler in the polyaniline matrix enhances the absorption of the microwave to a large extent. The interaction of microwave with TiO2 incorporated polyaniline –Barium ferrite (PBT) nanocomposites is shown in figure 31.
6.1 Incorporation of TiO2 nanoparticles in polyaniline–barium ferrite nanocomposite The nano-sized barium ferrites along with TiO2 nanoparticles have been homogenized in 0.3M aqueous solution of dodecyl benzene sulfonic acid (DBSA) to form a whitish brown emulsion solution. Appropriate amount of aniline (0.1M) has been added to the above solution and again homogenized for 2-3 hours to form micelles of aniline with barium ferrite and TiO2. The micelles so formed have been polymerized at -2°C by emulsion polymerization using (NH4)2S2O8 (0.1 M) which act as oxidant (figure 32). The product so obtained has been demulsified by treating it with equal amount of isopropyl alcohol. The precipitates so obtained have been filtered out, washed with alcohol and dried at 60-65°C in vacuum oven.
Fig. 32. Schematic representation of polymerization of micellar solution of DBSA containing the barium ferrite and TiO2 nanoparticles using APS as oxidant
6.2 X-ray diffraction studies Figure 33 shows the X-ray diffraction patterns of TiO2, barium ferrite and Polyaniline-barium ferrite-TiO2 (PBT) nanocomposites. The main peaks for TiO2 have been observed at 2θ value 25.283° (d=3.520 Å), 37.784° (d=2.379 Å), 38.530° (d=2.335 Å), 48.032° (d=1.893 Å), 53.874° (d=1.700 Å), 55.025° (d=1.667 Å) and 62.660° (d=1.481 Å) corresponding to (101), (004), (112), (200), (105), (211) and (204) reflections, respectively (curve a). For barium ferrite, main peaks have been observed at 2θ value of 30.294° (d=2.9480), 32.141° (d=2.7827), 34.083° (d=2.6284), 37.046° (d=2.4247), 40.254° (d=2.2386), 42.391° (d=2.1305), 55.018° (d=1.6677), 56.477° (d=1.6280) and 63.054° (d=1.4731) corresponding to the (110), (107), (114), (203), (205), (206 ), (217), (2 01) and (22 0) reflections, respectively (curve f). The peaks of barium ferrite have been observed in all the compositions of polyaniline composites with TiO2 and barium ferrite which indicate the presence of ferrite particles in the polymer matrix. The increase in the intensity of the peaks demonstrates the increase in the ratio of barium ferrite. The presence of peaks of TiO2 and barium ferrite shows the formation of composite having separate phases of both the compounds dispersed in the polymer matrix.
www.intechopen.com
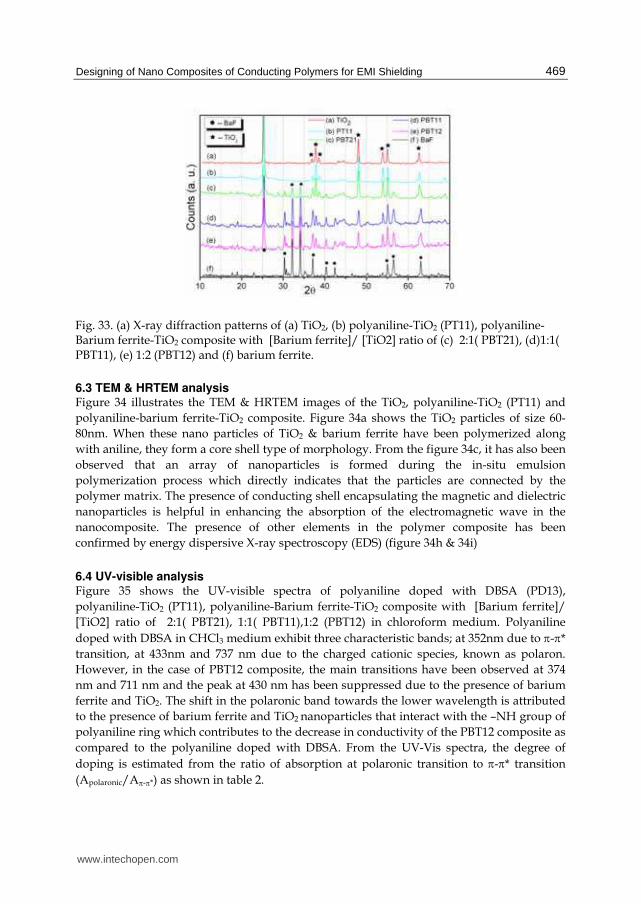
Designing of Nano Composites of Conducting Polymers for EMI Shielding
469
Fig. 33. (a) X-ray diffraction patterns of (a) TiO2, (b) polyaniline-TiO2 (PT11), polyaniline-Barium ferrite-TiO2 composite with [Barium ferrite]/ [TiO2] ratio of (c) 2:1( PBT21), (d)1:1( PBT11), (e) 1:2 (PBT12) and (f) barium ferrite.
6.3 TEM & HRTEM analysis Figure 34 illustrates the TEM & HRTEM images of the TiO2, polyaniline-TiO2 (PT11) and polyaniline-barium ferrite-TiO2 composite. Figure 34a shows the TiO2 particles of size 60-80nm. When these nano particles of TiO2 & barium ferrite have been polymerized along with aniline, they form a core shell type of morphology. From the figure 34c, it has also been observed that an array of nanoparticles is formed during the in-situ emulsion polymerization process which directly indicates that the particles are connected by the polymer matrix. The presence of conducting shell encapsulating the magnetic and dielectric nanoparticles is helpful in enhancing the absorption of the electromagnetic wave in the nanocomposite. The presence of other elements in the polymer composite has been confirmed by energy dispersive X-ray spectroscopy (EDS) (figure 34h & 34i)
6.4 UV-visible analysis Figure 35 shows the UV-visible spectra of polyaniline doped with DBSA (PD13), polyaniline-TiO2 (PT11), polyaniline-Barium ferrite-TiO2 composite with [Barium ferrite]/ [TiO2] ratio of 2:1( PBT21), 1:1( PBT11),1:2 (PBT12) in chloroform medium. Polyaniline doped with DBSA in CHCl3 medium exhibit three characteristic bands; at 352nm due to π-π* transition, at 433nm and 737 nm due to the charged cationic species, known as polaron. However, in the case of PBT12 composite, the main transitions have been observed at 374 nm and 711 nm and the peak at 430 nm has been suppressed due to the presence of barium ferrite and TiO2. The shift in the polaronic band towards the lower wavelength is attributed to the presence of barium ferrite and TiO2 nanoparticles that interact with the –NH group of polyaniline ring which contributes to the decrease in conductivity of the PBT12 composite as compared to the polyaniline doped with DBSA. From the UV-Vis spectra, the degree of doping is estimated from the ratio of absorption at polaronic transition to π-π* transition (Apolaronic/Aπ-π*) as shown in table 2.
www.intechopen.com
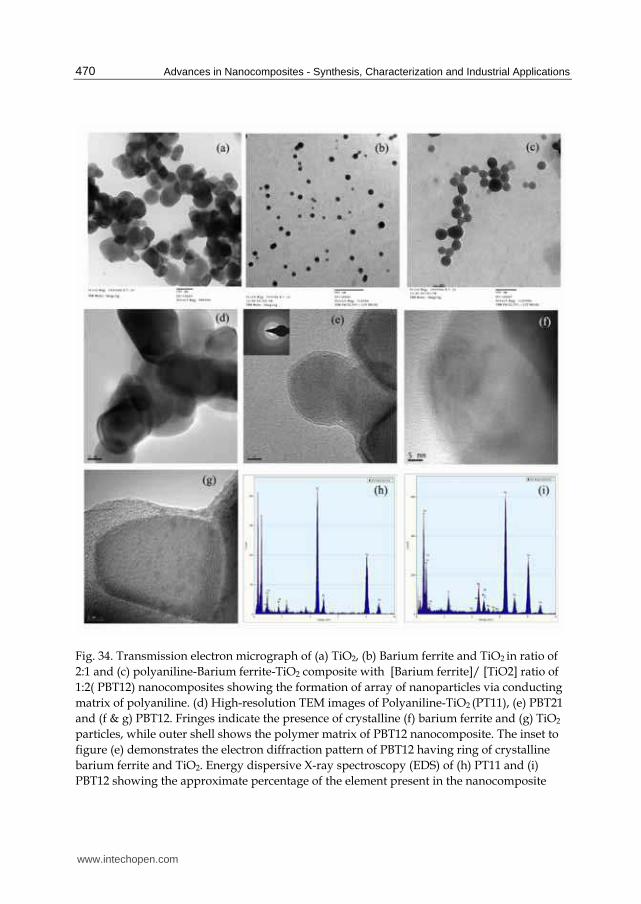
Advances in Nanocomposites - Synthesis, Characterization and Industrial Applications
470
Fig. 34. Transmission electron micrograph of (a) TiO2, (b) Barium ferrite and TiO2 in ratio of 2:1 and (c) polyaniline-Barium ferrite-TiO2 composite with [Barium ferrite]/ [TiO2] ratio of 1:2( PBT12) nanocomposites showing the formation of array of nanoparticles via conducting matrix of polyaniline. (d) High-resolution TEM images of Polyaniline-TiO2 (PT11), (e) PBT21 and (f & g) PBT12. Fringes indicate the presence of crystalline (f) barium ferrite and (g) TiO2
particles, while outer shell shows the polymer matrix of PBT12 nanocomposite. The inset to figure (e) demonstrates the electron diffraction pattern of PBT12 having ring of crystalline barium ferrite and TiO2. Energy dispersive X-ray spectroscopy (EDS) of (h) PT11 and (i) PBT12 showing the approximate percentage of the element present in the nanocomposite
www.intechopen.com

Designing of Nano Composites of Conducting Polymers for EMI Shielding
471
Fig. 35. UV/Visible spectra of PBT12, PBT11, PBT21, PT11, PBF12 nanocomposites and DBSA doped polyaniline (PD13)
UV-visible bands Sample
name
Conductivity
at 300K (S/cm) Polaronic bands π-π* Degree of doping
(Apolaronic/Aπ-π*)
PD13 2.2 737, 430 353 2.24
PT11 0.13 730 374 0.24
PBF12 0.08 729 384 0.11
PBT21 0.4 713 378 0.68
PBT11 0.27 716 362 1.25
PBT12 0.3 711 374 0.75
Table 2. Room temperature conductivity, UV-Vis. bands and the degree of doping for different samples.
6.5 Conductivity measurement
The temperature dependent dc conductivity (σdc) of the PT11 and PBT composites having different weight ratio of barium ferrite has been measured in the temperature range of 30-300K. The variation of logσdc as function of T-1/4 has been plotted in figure 36 whereas, inset shows the logσdc vs. 1000/T plot. From the inset, it is evident that the dc conductivity tends to saturate in the low temperature region. In order to explain the conduction mechanism,
www.intechopen.com

Advances in Nanocomposites - Synthesis, Characterization and Industrial Applications
472
Mott’s variable range hopping (VRH) model has been used. In hopping conduction process each state can have only one charge carrier for each spin direction. In the case of strong localization, the charge carrier will hop to a nearest neighboring state and the hopping conductivity will be proportional to Boltzmann’s factor exp( )BW K T− , where, W is the difference of energy between two states and is called hopping energy or activation energy required for a charge carrier to hop from one site to another site. However, when charge carriers are not strongly localized, a charge carrier can jump to the sites for which the activation energy is small and can reside further away and then the transport occurs by variable range hopping. According to Mott’s VRH model [43], the conductivity can be expressed as
( ) exp OO
TT
T
γσ σ ⎡ ⎤⎛ ⎞⎢ ⎥= −⎜ ⎟⎢ ⎥⎝ ⎠⎣ ⎦ (55)
where, σo and To are constants and exponent ┛ is the dimensionality factor having values 1/2, 1/3, 1/4 for 1 dimension, 2 dimensions and 3 dimension conduction mechanism. In order to calculate the exponent ┛, logσdc vs. T-1/4 is plotted which yields a linear behavior for the temperature range of 70-300K. To satisfy the Mott’s equation, activation energy [119-121]
{ }ln(1 / )A
BE
K Tσ−∂= ∂ (56)
of the samples has been calculated from the slope of logσdc vs. 1000/T plot. The hopping conduction has been confirmed from the logσdc vs. 1000/T curve which shows that the activation energy of the polymer composites changes with temperature. For 3-D conduction mechanism, the values of Mott characteristic temperature (To) and σo (conductivity at T= ∞) are given by
( )316O B FT k N Eα ⎡ ⎤= ⎣ ⎦ (57)
( )2 2O ph Fe R N Eσ ν= (58)
( ){ } 1/49 8 B FR K TN Eπα⎡ ⎤= ⎣ ⎦ (59)
where, R is the average hopping distance, ┙-1 is the localization length, N(EF) is the density of states at the Fermi level, and νph is the phonon frequency (~1013 Hz). ). The average hopping energy W can be estimated by knowing the average hopping distance R and the density of states at the Fermi level N(EF) by the following relation
34 R F
W π= 3Ν(Ε ) (60)
Using the above equations, various Mott’s parameters can be calculated. The conductivity data fits for the 3D- VRH model having ┛ =1/4, the linearity factor of 0.9997 for PT11, 0.9991 for PBT11 and 0.998 for PBT12 nanocomposite has been calculated from 300-70K. It is observed from figure 36 that the variation of conductivity deviates from the linear
www.intechopen.com
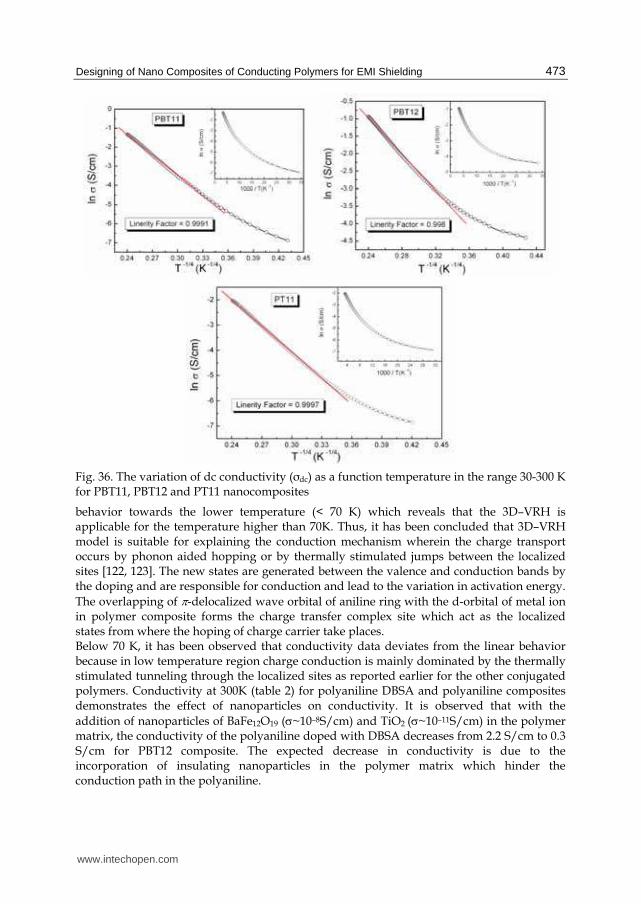
Designing of Nano Composites of Conducting Polymers for EMI Shielding
473
Fig. 36. The variation of dc conductivity (σdc) as a function temperature in the range 30-300 K for PBT11, PBT12 and PT11 nanocomposites
behavior towards the lower temperature (< 70 K) which reveals that the 3D–VRH is applicable for the temperature higher than 70K. Thus, it has been concluded that 3D–VRH model is suitable for explaining the conduction mechanism wherein the charge transport occurs by phonon aided hopping or by thermally stimulated jumps between the localized sites [122, 123]. The new states are generated between the valence and conduction bands by the doping and are responsible for conduction and lead to the variation in activation energy. The overlapping of π-delocalized wave orbital of aniline ring with the d-orbital of metal ion in polymer composite forms the charge transfer complex site which act as the localized states from where the hoping of charge carrier take places. Below 70 K, it has been observed that conductivity data deviates from the linear behavior because in low temperature region charge conduction is mainly dominated by the thermally stimulated tunneling through the localized sites as reported earlier for the other conjugated polymers. Conductivity at 300K (table 2) for polyaniline DBSA and polyaniline composites demonstrates the effect of nanoparticles on conductivity. It is observed that with the addition of nanoparticles of BaFe12O19 (σ~10–8S/cm) and TiO2 (σ~10–11S/cm) in the polymer matrix, the conductivity of the polyaniline doped with DBSA decreases from 2.2 S/cm to 0.3 S/cm for PBT12 composite. The expected decrease in conductivity is due to the incorporation of insulating nanoparticles in the polymer matrix which hinder the conduction path in the polyaniline.
www.intechopen.com
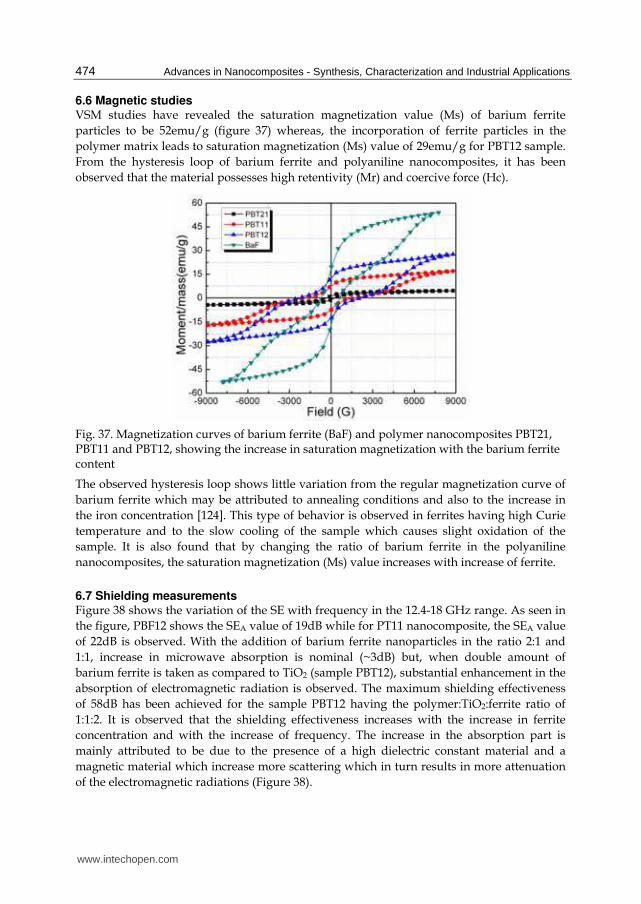
Advances in Nanocomposites - Synthesis, Characterization and Industrial Applications
474
6.6 Magnetic studies VSM studies have revealed the saturation magnetization value (Ms) of barium ferrite particles to be 52emu/g (figure 37) whereas, the incorporation of ferrite particles in the polymer matrix leads to saturation magnetization (Ms) value of 29emu/g for PBT12 sample. From the hysteresis loop of barium ferrite and polyaniline nanocomposites, it has been observed that the material possesses high retentivity (Mr) and coercive force (Hc).
Fig. 37. Magnetization curves of barium ferrite (BaF) and polymer nanocomposites PBT21, PBT11 and PBT12, showing the increase in saturation magnetization with the barium ferrite content
The observed hysteresis loop shows little variation from the regular magnetization curve of barium ferrite which may be attributed to annealing conditions and also to the increase in the iron concentration [124]. This type of behavior is observed in ferrites having high Curie temperature and to the slow cooling of the sample which causes slight oxidation of the sample. It is also found that by changing the ratio of barium ferrite in the polyaniline nanocomposites, the saturation magnetization (Ms) value increases with increase of ferrite.
6.7 Shielding measurements Figure 38 shows the variation of the SE with frequency in the 12.4-18 GHz range. As seen in the figure, PBF12 shows the SEA value of 19dB while for PT11 nanocomposite, the SEA value of 22dB is observed. With the addition of barium ferrite nanoparticles in the ratio 2:1 and 1:1, increase in microwave absorption is nominal (~3dB) but, when double amount of barium ferrite is taken as compared to TiO2 (sample PBT12), substantial enhancement in the absorption of electromagnetic radiation is observed. The maximum shielding effectiveness of 58dB has been achieved for the sample PBT12 having the polymer:TiO2:ferrite ratio of 1:1:2. It is observed that the shielding effectiveness increases with the increase in ferrite concentration and with the increase of frequency. The increase in the absorption part is mainly attributed to be due to the presence of a high dielectric constant material and a magnetic material which increase more scattering which in turn results in more attenuation of the electromagnetic radiations (Figure 38).
www.intechopen.com

Designing of Nano Composites of Conducting Polymers for EMI Shielding
475
Fig. 38. Dependence of shielding effectiveness (SEA & SER) on frequency showing the effect of barium ferrite concentration on the SEA value of the nanocomposites
Figure 39a (inset) shows the variation of σAC with the frequency for the sample PBT11, calculated from the dielectric measurements ( 0acσ ωε ε ′′= ).To correlate σAC with the shielding parameters of the material, SER is plotted against log σAC (figure 39a). Higher value of conductivity is required for high shielding effectiveness due to reflection. For the absorption part, the skin depth of the samples has been calculated using the relation, 2 / ACδ ωμσ= and its variation with frequency is shown in figure 39b (inset). It has been observed that the skin depth decreases with frequency which demonstrates that mainly surface conduction exists at the higher frequencies. The dependence of skin depth on the conductivity and magnetic permeability reveal that, for highly conducting and magnetic material, the skin depth is very small. The dependence of SEA on (σAC) 1/2 is shown in figure 39b.
6.8 Dielectric & permeability studies The main characteristic feature of TiO2 is that it has high dielectric constant with dominant dipolar polarization and the associated relaxation phenomenon constitutes the loss mechanism [93]. With the addition of barium ferrite and TiO2 in polyaniline matrix, significant increase in the imaginary part of complex permittivity has been observed. The higher values of the dielectric loss is attributed to the more interfacial polarization due to the presence of insulating barium ferrite particles and high dielectric constant (TiO2) particles which consequently leads to more shielding effectiveness due to absorption. Figure 40 (c & d) shows the variation of real part and imaginary part of magnetic permeability with frequency. The magnetic permeability of all the samples decreases with the increase in frequency whereas, higher magnetic loss has been observed for higher percentage of barium ferrite (PBT12) in the polymer matrix. The magnetic loss is caused by the time lag of magnetization vector (M) behind the magnetic field vector. The change in magnetization vector is generally brought about by the rotation of magnetization and the domain wall displacement.These motions lag behind the change of the magnetic field and
www.intechopen.com
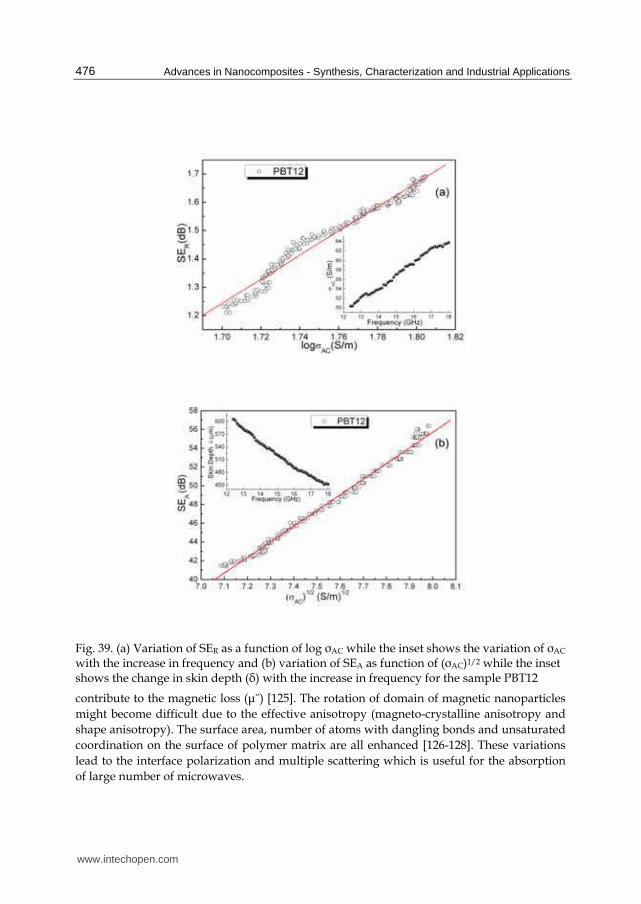
Advances in Nanocomposites - Synthesis, Characterization and Industrial Applications
476
Fig. 39. (a) Variation of SER as a function of log σAC while the inset shows the variation of σAC with the increase in frequency and (b) variation of SEA as function of (σAC)1/2 while the inset shows the change in skin depth (├) with the increase in frequency for the sample PBT12
contribute to the magnetic loss (┤˝) [125]. The rotation of domain of magnetic nanoparticles might become difficult due to the effective anisotropy (magneto-crystalline anisotropy and shape anisotropy). The surface area, number of atoms with dangling bonds and unsaturated coordination on the surface of polymer matrix are all enhanced [126-128]. These variations lead to the interface polarization and multiple scattering which is useful for the absorption of large number of microwaves.
www.intechopen.com

Designing of Nano Composites of Conducting Polymers for EMI Shielding
477
Fig. 40. Behavior of (a) real and (b) imaginary part of permittivity. Figures (c) & (d) show the variation of real and imaginary part of magnetic permeability with the change in frequency for the samples PBT12 (▲), PBT11 (●), PBT21 (■), PBF12 (◄) and PT11 (▼)
7. Conclusion
The enhancement in the microwave shielding and absorption properties of the polyaniline nanocomposite has been achieved by the incorporation of dielectric filler (TiO2) along with the magnetic filler (barium ferrite) in the polyaniline matrix. TEM and HRTEM images demonstrate that in the polyaniline-barium ferrite-TiO2 (PBT) nanocomposites, barium ferrite and TiO2 nanoparticles form the array of nanoparticles connected via conducting polyaniline system. These conducting paths of polyaniline between the magnetic and dielectric nanoparticles increase the absorption of the electromagnetic wave to a large extent. The high shielding effectiveness of 58dB due to absorption has been achieved for these composites. The contribution to the absorption value comes mainly due the magnetic losses (┤˝) in barium ferrite and dielectric losses (┝˝) in TiO2 and polyaniline. The dependence of SEA on magnetic permeability and conductivity demonstrates that better absorption value can be obtained for materials with higher conductivity and magnetization. Therefore, from the present studies, it can be concluded that the incorporation of magnetic
www.intechopen.com

Advances in Nanocomposites - Synthesis, Characterization and Industrial Applications
478
and dielectric fillers in the polymer matrix lead to better absorbing material which make them futuristic radar absorbing material. In spite of these interesting developments, a lot remains to be done with regard to both fundamental understanding and the much needed improvement of the method of the designing of electromagnetic shielding materials to operate at higher frequencies for their application.
8. References
[1] Maeda, S. & Armes, S.P. (1995) Chem. Mater., 7, 171. [2] Jarjeyes, O.; Fries, P.H. & Bidan, G. (1995) Synth. Met., 69, 43. [3] Huang, C. L. & Matijevic, E. (1995) J. Mater. Res., 10, 1327. [4] Wu, K. H.; Shin, M. & Yang, C. C. (2006) J. Polym. Sci. Part A – Polym. Chem., 44, 2657. [5] Zhang, H.; Zeng, G.; Ge, Y.; Chen, T. & Hu, L. (2009) J. Appl. Phys., 105, 054314. [6] Gao, B.; Qiao, L.; Wang, J.; Liu, Q.; Li, F.; Feng, J. & Xue, D. (2008) J. Phys. D: Appl. Phys.,
41, 125303. [7] Seo, M. A.; Yim, J. H.; Ahn, Y. H.; Rotermund, F.; Kim, D. S.; Lee, S. & Lim, H. (2008)
Appl. Phys. Lett., 93, 231905 [8] Saleha, M. H. A. & Sundararaj, U. (2009) Polym. Adv. Technol. DOI: 10.1002/pat.1526 [9] Zhao, D. L.; Li, X. & Shen, Z. M. (2008) Compos. Sci. Technol., 68, 2902. [11] Abbas, S. M.; Chandra, M.; Verma, A.; Chatterjee, R. & Goel, T. C. (2006) Compos. Part A:
Appl. Sci. Manufacturing, 37, 2148. [11] Zhihua, P.; Jingcui, P.; Yanfeng, P.; Yangyu, O. & Yantao, N. (2008) Phys. Lett. A, 372,
3714. [12] Shen, G.; Xu, M. & Xu, Z. (2007) Mater. Chem. Phys. 105, 268. [13] Park, J. G. et al. (2009) Nanotechnology, 20, 415702 [14] Bi, H.; Kou, K. C.; Ostrikov, K. K; Yan, L. K. & Wang, Z. C. (2009) J. Alloys Compd. 478,
796. [15] Zhao, D. L.; Li, X. & Shen, Z. M. (2009) J. Alloys Compd. 471, 457. [16] Shi, S. L. & Liang, J. (2008) Nanotechnology, 19, 255707 [17] Zhang, X. F.; Dong, X. L.; Huang, H.; Lv, B.; Lei, J. P. & Choi, C. J. (2007) J. Phys. D: Appl.
Phys., 40, 5383. [18] Håkansson, E.; Amiet, A.; Nahavandi, S. & Kaynak, A. (2007) Eur. Polym. J., 43, 205. [19] Dhawan, S. K.; Singh, N. & Venkatachalam, S. (2002) Synth. Met., 129, 261. [20] Håkansson, E.; Amiet, A. & Kaynak, A. (2006) Synth. Met., 156, 917. [21] Kaynak, A.; Håkansson, E. & Amiet, A. (2009) Synth. Met., 159, 1373. [22] Chandrasekhar, P. & Naishadham, K. (1999) Synth. Met., 105, 115. [23] Hoang, N. H.; Wojkiewicz, J. L.; Miane, J. L. & Biscarro, R. S. (2007) Polym. Adv. Technol.,
18, 257. [24] Diaz, A. F.; Rubinson, J. F. & Mark, Jr. H. B. (1988) Adv. Polym. Sci., 84, 113. [25] Skotheim, T. A.; Elsenbaumer, R. L. & Renolds, J. R. (1998) Handbook of Conducting
Polymers, 2nd Ed., Marcel Dekker, New York. [26] Gold, V.; Loening, K.; Macnaught, A. & Sehni, P. (1987) Compendium of Chemical
Terminology/IUPAC recommendations (Backwell Scientific Publication, Inc., Palo Alto,
California)
www.intechopen.com

Designing of Nano Composites of Conducting Polymers for EMI Shielding
479
[27] Swager, T. M. (2002) Chem. Res. Toxicol., 15, 125. [28] Cao, Y.; Smith, P. & Heeger, A. J. (1992) Synth. Met., 48, 91. [29] Geng, M.; Cai, Z. & Tang, Z. (2004) J. Mater. Sci., 39, 4001. [30] Cheng, F.; Tang, W.; Li, C.; Chen, J.; Liu, H.; Shen, P. & Dou, S. (2006) Chem. Eur. J., 12,
3082. [31] Su, W. P.; Schrieffer, J. R. & Heeger, A. J. (1979) Phys. Rev. Lett., 42, 1698. [32] Su, W. P.; Schrieffer, J. R. & Heeger, A. J. (1980) Condense Matter Mater. Phys., 22, 2099. [33] Su, W. P. & Schrieffer, J. R. (1980) Proc. National Academy Sci. USA, 77, 5626. [34] Bishop, A. R.; Campbell, D. K. & Fesser, K. (1981) Mol. Cryst. Liq. Cryst., 77, 253. [35] Bredas, J. L.; Chance, R. R. & Silbey, R. (1981) Mol. Cryst. Liq. Cryst., 77, 319. [36] Boudreaux, D. S.; Chance, R. R.; Bredas, J. L. & Silbey, R. (1983) Phys. Rev. B, 28, 6927. [37] Thomann, H.; Dalton, L. R.; Tomkiewicz, Y.; Shiren, N. S. & Clarke, T. C. (1983) Phys.
Rev. Lett., 50, 533. [38] Bredas, J. L.; Chance, R. R. & Silbey, R. (1982) Phys. Rev B, 26, 5843. [39] Bredas, J. L.; Scott, J. C.; Yakushi, K. & Street, G. B. (1984) Phys Rev. B, 30, 1023. [40] Bredas, J. L.; Themans, B.; Andre, J. M.; Chance, R. R. & Silbey, R. (1984) Synth. Met., 9,
265. [41] Bredas, J. L. & Street, G. B. (1985) Accounts Chem. Res., 18, 309. [42] Kaufman, J. H.; Colanari, N.; Scott, J. C.; Kanazawa, K. K. & Street, G. B. (1985) Mol.
Cryst Liq. Cryst., 118, 171. [43] Mott, N. F. & Davis, E. A. (1979) Electronic Processing Non-Crystalline Materials, 2nd Ed.,
Clarendon press, Oxford. [44] Fleishman, L. & Anderson, P. W. (1980) Phys. Rev. B, 21, 2366. [45] Baughman, R. H. & Shacklette, L. W. (1987) Synth. Met., 17, 173. [46] Wegner, G. (1981) Angew. Chem. Int. Ed., 20, 361. [47] Horovitz, B. (1985) Phys. Rev. Lett., 55, 1429. [48] Kivelson S. & Heeger, A. J. (1985) Phys. Rev. Lett., 55, 308. [49] Chance, J. C. & MacDiarmid, A. G. (1986) Synth. Met., 13, 193. [50] Epstein, A. J.; Ginder, J. M.; Zhuo, F.; Gibelow, R. W.; Woo, H. S.; Tanner, D. B.; Richter,
A. F.; Huang, W. S. & MacDiarmid, A.G. (1987) Synth. Met., 18, 303. [51] Epstein, A. J.; Ginder, J. M.; Richter, A. F. & MacDiarmid, A. G. (1987) Proc. NATO
workshop on conducting polymers- Special Applications, Alcacer, Reidel L., Dordrecht. [52] Sheng, P.; Abeles, B. & Arie, Y. (1973) Phys. Rev. Lett. 31, 44. [53] Wudl, F.; Angus, R. O.; Lu, F. L.; Allemand, P. M.; Vachon, D. J.; Nowak, M.; Liu, Z. X.
& Heeger, A. J. (1987) J. Am. Chem. Soc., 109, 3677. [54] Anderson, P. W. (1970) Comm. Solid State Phys., 2, 193. [55] Fritsche, L.; Hara, T.; Hyodo, Y. & Harada, I. (1986) Synth Met., 16, 189. [56] Buhks, E. & Hodge, I. M. (1985) J. Chem. Phys., 83, 5976. [57] Albery, W. J. (1980) Ann. Rev. Phys. Chem., 31, 227. [58] Marcus, R. A. (1965) Ann. Rev. Phys. Chem., 15, 155. [59] Gramp, G. & Jaenicke, W. (1985) J. Chem. Soc. Faraday Trans., 81, 1035. [60] Doriomedoff, M.; Hautiere-Cristofini, F.; De Surville, R.; Jzefowicz, M.; Yu, L. T. &
Burvet, R. (1986) J. Chin. Phys. Lett., 131, 82 [61] Wnek, G. E. (1986) Synth. Met., 15, 213
www.intechopen.com

Advances in Nanocomposites - Synthesis, Characterization and Industrial Applications
480
[62] Bjorklof, D. (1999) Shielding for EMC. Compliance Engineering. [63] Bridges, J. E. (1988) IEEE Trans. EMC, 30, 289. [64] Duffin, W. J. (1968) Advanced Electricity and Magnetism, London: McGraw-Hill [65] Schelkunoff, S. A. (1943) Electromagnetic Waves, Van Nostrand, NJ . [66] Schulz, R. B.; Plantz, V. C. & Brush, D. R. (1988) Shielding theory and practice, IEEE Trans.
Electromagn. Compat. EMC, 30, 187. [67] C. R. Paul, (2004) Electromagnetics for Engineers, Wiley, Hoboken, NJ. [68] Ott, H. W. (1988) Noise Reduction Techniques in Electronic Systems, 2nd ed. New York:
John Wiley & Sons. [69] Nicolson, A. M. & Ross, G. F. (1970) IEEE Trans. Instrum. Meas., 19, 377 [70] Weir, W. B. (1974) Proc. IEEE, 62, 33 [71] Segawa, H.; Shimadzu, T. & Honda, M. (1989) J. Chem. Soc. Chem. Commun. 132 [72] Coleman, M. M. & Petanck, R. J. (1986) J. Polym. Sci. 16, 821. [73] Chen, C. K. & Liepins, R. (1987) Electrical Properties of Polymers, Hanser Publisher
Munich, 274. [74] Natta, G.; Mazzanti, G. & Corradini, P. (1958) Atti Accad. Naz Linceic. Sci. Fis. Mat. Nat
Rend. 2, 25. [75] Saxman, A. M.; Liepins, R. & Aldissi, M. (1985) Prog. Polym. Sci., 11, 57. [76] Kovacic, P. & Kyriakis, A. (1962) Tetrahedron Lett., 467. [77] G. M. Carter, ; M. K. Thakur, ; Y. J. Chen, & J. V. Hryniewicz, Appl. Phys. Lett. 47 (1985)
457. [78] Thomas, B.; Pillai, M. G. K. & Jayalakshmi, S. (1988) J. Phys. D: Appl Phys., 21, 503. [79] Snow, A. W. (1981) Nature, 292, 40. [80] Yamamoto, T.; Hayashi, Y. & Yamamoto, A. (1978) Bull. Chem. Soc. Japan, 51, 2091. [81] Rahman, S.; Mahapatra, M.; Maiti, M. M. & Maiti, S. (1989) J. Polym. Mater., 6, 135. [82] Soga, K.; Nakamura, M.; Kobayashi, Y. & Ikeda, S. (1983) Synth. Met., 6, 275. [83] Karasz, F. E.; Capistran, J. D.; Gagnon, D. R. & Lenz, R. W. (1985) Mol. Cryst. Liq. Cryst.,
118, 327. [84] MacDiarmid, A. G. & Heeger, A. J. (1987/88) Synth. Met., 1, 101 [85] Skotheim, T. A. 1986 Handbook of Conducting Polymers, Vol. 1 & 2, Marcel Dekker, New
York [86] Huang, H. L. & Lee, W. M. G. (2001) Chemoshere, 44, 963 [87] Shaw, D. J. (1991) Introduction to Colloid and Surface Chemistry, Oxford Butterworth-
Heinemann Ltd. [88] Han, M. G.; Cho, S. K.; Oh, S. G. & Im, S. S. (2002) Synth. Met., 126, 53 [89] Singh, K.; Ohlan, A.; Saini, P. & Dhawan, S. K. (2008) Polym. Adv. Technol., 19, 229. [90] Colaneri, N. F. & Shacklette, L.W. (1992) IEEE Trans. Instru. Meas., 41, 291 [91] Singh, R.; Kumar, J.; Singh, R. K.; Rastogi, R. C. & Kumar, V. (2007) New J. Phys., 9, 40 [92] Yusoff, A. N.; Abdullah, M. H.; Ahmad, S. H.; Jusoh, S. F.; Mansor, A. A. & Hamid, S. A.
A. (2002) J. Appl. Phys., 92, 876. [93] Phang, S. W.; Hino, T.; Abdullah, M. H. & Karamoto, N. (2007) Mater. Chem. Phys. 104,
327. [94] Nicolson, A. M. & Ross, G. F. (1970) IEEE Trans. Instrum. Meas., 19, 377. [95] Weir, W. B. (1974) Proceedings of the IEEE, 62, 33
www.intechopen.com
Designing of Nano Composites of Conducting Polymers for EMI Shielding
481
[96] Dimitrov, D. A. & Wysin, G. M. (1995) Phys. Rev. B, 51, 11947 [97] Shilov, V. P.; Bacri, J. C.; Gazeau, F.; Gendron, F.; Perzynski, R. & Raikher, Y. L. (1999) J.
Appl. Phys., 85, 6642
[98] Smit, J. & Wijn, H. P. J. (1959) Ferrites physical properties of ferrimagnetic oxides in relation to
their technical applications: Philips Technical Library, Netherlands 244 [99] Snoek, J. L. (1948) Physica (Amsterdam), 14, 207. [100] Ishino, K. & Narumiya, Y. (1987) Ceram. Bull., 66, 1469. [101] Dimitrov, D. A. & Wysin, G. M. (1995) Phys. Rev. B, 51, 11947. [102] Shilov, V. P.; Bacri, J. C.; Gazeau, F.; Gendron, F.; Perzynski, R. & Raikher, Y. L. (1999)
J. Appl. Phys., 85, 6642. [103] Nalwa, H. S. (1999) Handbook of low and high dielectric constant materials and their
applications, Academic, San Diego, CA [104] Yoseph, B. C. (2004) Electroactive polymer (EAP) actuators as artificial muscles: reality
potential and challenges, SPIE, WA [105] Banno, H. & Ogura, K. (1989) Ferroelectrics, 95, 111. [106] Huang, X. X.; Chen, Z. F.; Zou, W. Q.; Liu, Y. S. & Li, J. D. (1990) Ferroelectrics, 101, 111. [107] Ngoma, J. B.; Cavaille, J. Y.; Paletto, J.; Perez, J. & Macchi, F. (1990) Ferroelectrics, 109,
205. [108] Dilip, K. D. (1991) Ferroelectrics, 118, 165. [109] Wei, B. & Daben, Y. (1994) Ferroelectrics, 157, 427. [110] Chan, H. L. W.; Cheung, M. C. & Choy, C. L. (1999) Ferroelectrics, 224, 113. [111] Bae, W. J.; Kim, K. H. & Jo, W. H. (2004) Macromolecules, 37, 9850. [112] Bandara, W. M. A. T.; Krishantha, D. M. M.; Perera, J. S. H. Q.; Rajapakse, R. M. G. &
Tennakoon, D. T. B. (2005) J. Compos. Mater., 39, 759. [113] Aranda, P.; Darder, M.; Fernandez-Saavedra, R.; Lopez-Blanco, M. & Ruiz-Hitzky,E.
(2006) Thin Solid Films, 495, 104. [114] Sung, J. H. & Choi, H. J. (2005) J. Macromol. Sci. B: Phys., 44, 365. [115] Dey, A.; De, S.; De, A. & De, S. K. (2004) Nanotechnology, 15, 1277. [116] Huang, C. & Zhang, Q. M. (2005) Adv. Mater., 17, 1153. [117] Xu, J. C.; Liu, W. M. & Li, H. L. (2005) Mater. Sci. Eng. C, 25, 444. [118] Su, S. J. & Kuramoto, N. (2000) Synth. Met.,114, 147 [119] Sanjai, B.; Raghunath, A.; Natrajan, T. S.; Rangarajan, G. S.; Thomas, P. V. P. &
Venkatachalam, S. (1997) Phys. Rev. B, 55, 10734. [120] Singh, R.; Arora, V.; Tandon, R. P.; Chandra, S.; Kumar, N. & Mansingh, A. (1997)
Polymer, 38, 4897. [121] Singh, R.; Arora, V.; Tandon, R. P.; Mansingh, A. & Chandra, S. (1999) Synth. Met. 104,
137. [122] Pinto, N. J.; Kahol, P. K.; McCormick, B. J.; Dalal, N. S. & Han, H. (1994) Phys. Rev. B,
49, 13983. [123] Reghu, M.; Cao, Y.; Moses, D. & Heeger, A. J. (1993) Phys. Rev. B, 47, 1758. [124] Heidenreich, R. D.; Nesbitt, E. A. & Burbank, R. D. (1959) J. Appl. Phys., 30, 995. [125] Ishino, K. & Narumiya, Y. (1987) Ceram. Bull., 66, 1469. [126] Dimitrov, D. A. & Wysin, G. M. (1995) Phys. Rev. B, 51, 11947.
www.intechopen.com

Advances in Nanocomposites - Synthesis, Characterization and Industrial Applications
482
[127] Shilov, V. P.; Bacri, J. C.; Gazeau, F.; Gendron, F.; Perzynski, R. & Raikher, Y. L. (1999) J. Appl. Phys., 85, 6642.
[128] Zhang, X. F.; Dong, X. L.; Huang, H.; Liu, Y. Y.; Wang, W. N.; Zhu, X. G.; Lv, B.; Lei, J. P. & Lee, C. G. (2006) Appl. Phys. Lett., 89, 053115.
www.intechopen.com
Advances in Nanocomposites - Synthesis, Characterization andIndustrial ApplicationsEdited by Dr. Boreddy Reddy
ISBN 978-953-307-165-7Hard cover, 966 pagesPublisher InTechPublished online 19, April, 2011Published in print edition April, 2011
InTech EuropeUniversity Campus STeP Ri Slavka Krautzeka 83/A 51000 Rijeka, Croatia Phone: +385 (51) 770 447 Fax: +385 (51) 686 166www.intechopen.com
InTech ChinaUnit 405, Office Block, Hotel Equatorial Shanghai No.65, Yan An Road (West), Shanghai, 200040, China
Phone: +86-21-62489820 Fax: +86-21-62489821
Advances in Nanocomposites - Synthesis, Characterization and Industrial Applications was conceived as acomprehensive reference volume on various aspects of functional nanocomposites for engineeringtechnologies. The term functional nanocomposites signifies a wide area of polymer/material science andengineering, involving the design, synthesis and study of nanocomposites of increasing structuralsophistication and complexity useful for a wide range of chemical, physicochemical and biological/biomedicalprocesses. "Emerging technologies" are also broadly understood to include new technological developments,beginning at the forefront of conventional industrial practices and extending into anticipated and speculativeindustries of the future. The scope of the present book on nanocomposites and applications extends farbeyond emerging technologies. This book presents 40 chapters organized in four parts systematicallyproviding a wealth of new ideas in design, synthesis and study of sophisticated nanocomposite structures.
How to referenceIn order to correctly reference this scholarly work, feel free to copy and paste the following:
S.K. Dhawan, Anil Ohlan and Kuldeep Singh (2011). Designing of Nano Composites of Conducting Polymersfor EMI Shielding, Advances in Nanocomposites - Synthesis, Characterization and Industrial Applications, Dr.Boreddy Reddy (Ed.), ISBN: 978-953-307-165-7, InTech, Available from:http://www.intechopen.com/books/advances-in-nanocomposites-synthesis-characterization-and-industrial-applications/designing-of-nano-composites-of-conducting-polymers-for-emi-shielding