Designing Networks of Marine - Ecology Action
46
Designing Networks of Marine Protected Areas in DFO’s Three Atlantic Bioregions Presentation for Indigenous Protected Areas Workshop Max Westhead, DFO and Adrian Gerhartz-Abraham, Dalhousie March 29, 2017
Transcript of Designing Networks of Marine - Ecology Action

Designing Networks of Marine Protected Areas in DFO’s Three
Atlantic Bioregions
Presentation for Indigenous Protected Areas Workshop
Max Westhead, DFO and Adrian Gerhartz-Abraham, Dalhousie
March 29, 2017

2
Outline
1. Setting the Stage for MPA Network Design
2. MPA Network Design Analysis
3. Timelines and Opportunities
Bioregions

Challenge
• In each bioregion, use the extensive amount of available ecological and human-use data to design a comprehensive, resilient, and representative network of marine protected areas
Respect existing rights and activities
Meet conservation goals while minimizing potential socio-economic impacts
4

Part 1: Setting the Stage
• A structured process is needed for consistency across bioregions
• Objectives hierarchy:
» National Goals
» Strategic Objectives
» Conservation Priorities
»Design Strategies (Targets)
Broad
Specific
5

National Goals
High-level statements that outline what the National MPA Network aims to achieve:
1) To provide long-term protection of marine biodiversity, ecosystem function and special natural features.
2) To support the conservation and management of Canada's living marine resources and their habitats, and the socio-economic values and ecosystem services they provide.
3) To enhance public awareness and appreciation of Canada's marine environments and rich maritime history and culture.
6

Objectives hierarchy:
» National Goals
»Strategic Objectives
»Conservation Priorities
»Design Strategies (Targets)
7

Strategic Objectives
• Statements that outline what a regional MPA network aims to achieve.
• Slightly different in each bioregion to take into account differences in environments and regional context
• Guide the identification of specific Conservation Priorities to be captured in the network
8
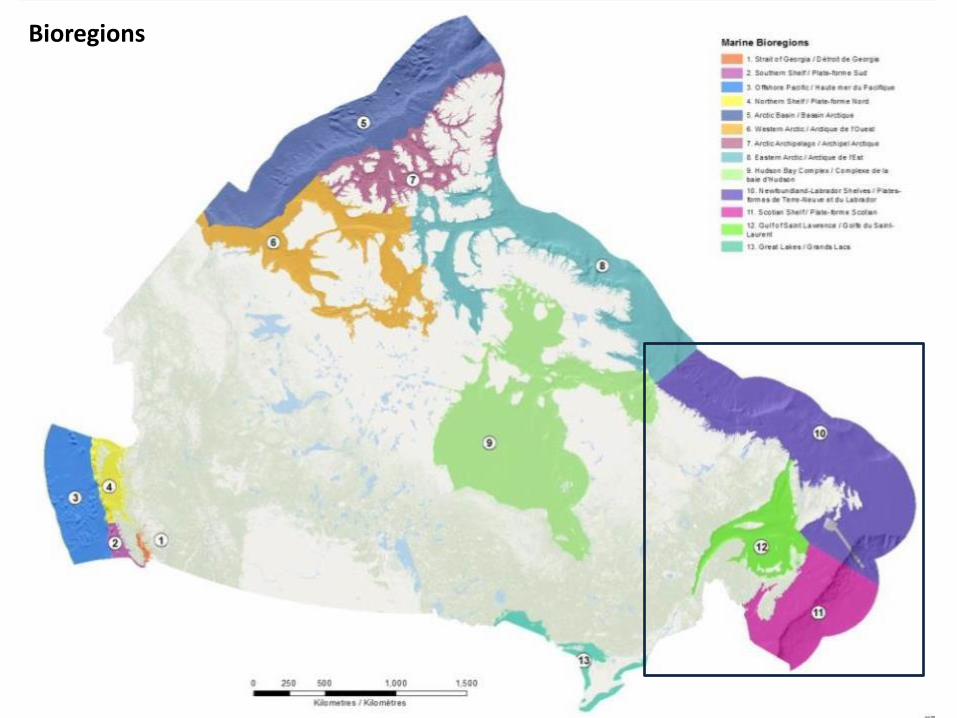
Examples of Strategic Objectives
• Help maintain ecosystem structure, functioning and resilience within the bioregion
• Provide protection for marine areas that contain unique or rare features (populations, communities, species or habitats)
• Protect representative examples of identified ecosystem and habitat types in the bioregion
• Help protect species at risk and their habitats to ensure their survival and possibly improve their state
9

Objectives hierarchy:
» National Goals
»Strategic Objectives
»Conservation Priorities
»Design Strategies (Targets)
10

Conservation Priorities
• Individual populations or species, groups of species, habitats, communities, ecological processes or other ecological features
• Selection of Conservation Priorities guided by:
– The Strategic Objectives
– Data availability
– Data quality
– Suitability of feature for spatial protection
11

• Eelgrass beds
• Atlantic cod distribution
• Vazella pourtalesi (sponge) concentrations
• Areas of high fish species richness
• Representative oceanographic areas
• Species of Aboriginal importance
• Forage fish species (capelin)
Examples of Conservation Priorities
12

Examples of Conservation Priorities

Objectives hierarchy:
» National Goals
»Strategic Objectives
»Conservation Priorities
»Design Strategies (Targets)
14

Design Strategies
• Statements that specify the type and target for each Conservation Priority
– i.e., what specifically is being targeted, and how much should be captured in the network?
Vazella sponge example:
Type: Significant concentrations of Vazella
Target: Capture 80-100% of this feature in the network
15

Design Strategies
• Specifying targets:
–Helps to measure success in capturing Conservation Priorities in the network
– Increases transparency in decision-making
• Science meetings (CSAS) in each bioregion to inform Design Strategies
– Indigenous information identified as a gap in Maritimes Region
16

Part 2: Network Design Analysis
• All 3 bioregions using Marxan to help design an MPA network that:
– Meets the ecological targets
– Minimizes socio-economic impacts
• Marxan does not give the final solution!
– Helps to identify key areas and explore trade-offs
– Good starting point for discussions
17

Marxan
Decision Support Tool in Conservation Planning
Adrian Gerhartz-Abraham

What is Marxan?
1. Most widely used decision support software for conservation planning globally
2. Intended to solve reserve design problem known as the ‘minimum set problem’ (i.e., capture a set amount of biodiversity for the least cost)
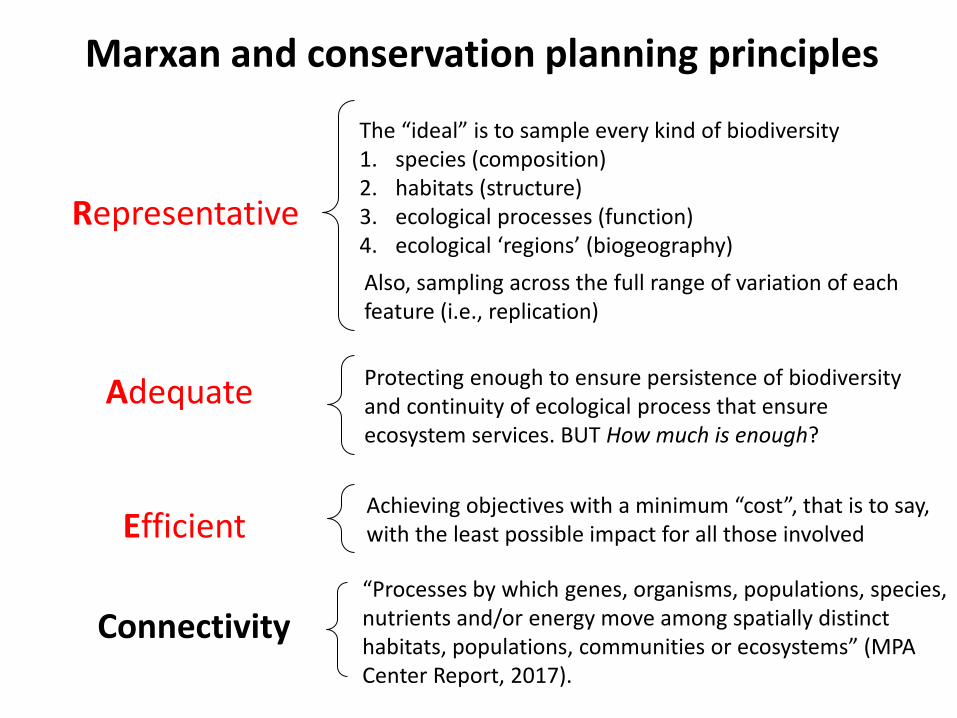
Representative Adequate Efficient
The “ideal” is to sample every kind of biodiversity 1. species (composition) 2. habitats (structure) 3. ecological processes (function) 4. ecological ‘regions’ (biogeography)
Protecting enough to ensure persistence of biodiversity and continuity of ecological process that ensure ecosystem services. BUT How much is enough?
Also, sampling across the full range of variation of each feature (i.e., replication)
Achieving objectives with a minimum “cost”, that is to say, with the least possible impact for all those involved
Marxan and conservation planning principles
Connectivity
“Processes by which genes, organisms, populations, species, nutrients and/or energy move among spatially distinct habitats, populations, communities or ecosystems” (MPA Center Report, 2017).

2. Quantitative information (area) of each conservation priority for
each PU
3. Quantitative targets for each conservation priority that the system
will aim to capture
0.2 0.4 0.8
How does a DST (e.g., Marxan) work in Protected Area planning?
1. The management area needs to be subdivided into
planning units (PU)
e.g., 33% (~1 Km2) target of habitat distribution to be captured in the system
1km2
0.6
1
2
3
e.g., Nursery habitat Kelp distribution = 3 km2
4. A cost associated to each PU (e.g., Area as a surrogate of management cost; Landings value as a surrogate of importance for fisheries; etc.)
4
0.6 0.4

High Fishing Activity
• Identifies a group of sites which meet conservation
targets for a range of biodiversity features for a
minimal cost
• Marxan does not provide final answers but it is a
tool to support decision-making
What does Marxan do?
Scenarios
Most efficient D:
target met with the
smallest impact
A B C D
Low Fishing Activity
0.4 0.8
0.6 0.6 0.4 0.2
Problem : Protect 1 km2 of kelp habitat for the least impact
0.4 0.8
0.6 0.6 0.4
0.2 0.4 0.8
0.6 0.6 0.4
0.2 0.4 0.8
0.6 0.6 0.4
0.2 0.4 0.8
0.6 0.6 0.4
0.2
Low impact but Target not met
Target met but medium impact
Target met but high Impact

Marxan Objective:
1. Minimize:
a) The total “Cost” of the reserve network b) Total “Boundary” of the reserve network
2. While meeting all conservation targets (i.e., minimizing the penalties for not adequately representing conservation features)
In Summary

• Useful to see how goals/objectives translate into reserve options
• Provides many good solutions and can be flexible for stakeholder engagement
• Incorporates different kinds of data to solve complex reserve design problems
• Identification of ‘key’ locations (both for conservation and for not allocating reserves)
Benefits of using Marxan

Benefits of using Marxan
• Addresses core conservation planning principles (Representation; Adequacy; Efficiency)
• Selects areas in a systematic, repeatable and transparent manner
• Facilitates the exploration of trade-offs between socio-economic and ecological objectives

Marxan Analysis
• Data inputs:
– Ecological data layers representing each Conservation Priority
– Human-use data layers
• For use in Marxan, human-use data must be:
– Georeferenced
– Converted to the same unit
26

Fisheries Data
• Commercial fisheries data is the main human-use input into Marxan
– Data available for most commercial fisheries
– Want to avoid the most important areas for commercial fisheries where possible
– Data can easily be converted into the same units (e.g., landing by weight)
27

Fisheries Data Examples
Other Human-Use Data • Other examples of human-use data to be
considered at the network design stage (either in Marxan or post-Marxan):
– Culturally important areas and uses
– Aquaculture sites
– Oil and gas production and significant discovery licenses
– Utility corridors (e.g., under sea cables)
– Other industrial developments (e.g., tidal energy)
– Shipping traffic
29

30
• Different approach being used in the coastal planning area – not using Marxan
• Ecological data in the coast is mostly descriptive in nature, with many gaps
– Relying on the use of Ecologically and Biologically Significant Areas (EBSAs) as a starting point
– 54 EBSAs described in the coast based on expert opinion and local knowledge
Coastal Process in the Scotian Shelf Bioregion
Coastal EBSAs and Eco-Units
Data Gaps
Work is being done to fill information gaps, such as:
• Indigenous information
• Connectivity data
• Spatial gaps (e.g., deep waters)
31
The MPA Network Design
• A network design is not the final picture
–Gives a general idea of priority sites for future protection
• It is a long-term plan for each bioregion
–Will be adjusted over time as new information comes in
32

The MPA Network Design
• New AOIs to be selected based on the draft MPA network designs starting in 2017
• Each new MPA will have distinct information collection and consultation processes
33
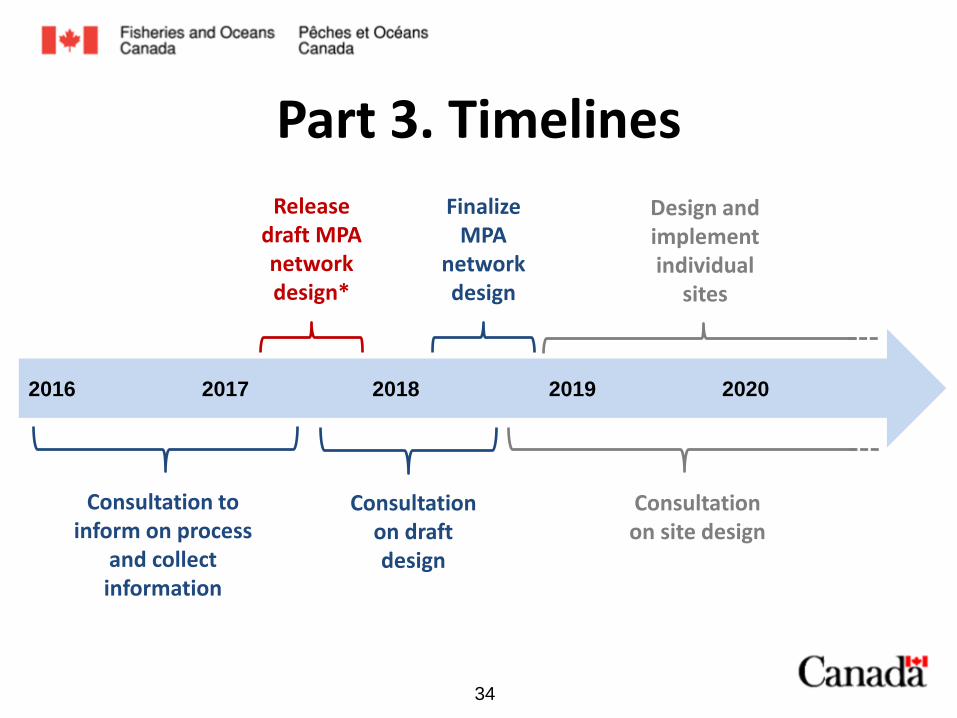
Part 3. Timelines
Consultation to inform on process
and collect information
Finalize MPA
network design
Release draft MPA network design*
Consultation on draft design
2016 2017 2018 2020 2019
Design and implement individual
sites
Consultation on site design
34

Opportunities
• Still considering new information for development of draft MPA network designs (2017)
• Opportunity for input during consultation period on draft designs (2018), including Indigenous information
• New scientific data, Indigenous information, and human-use information will factor into future iterations of the MPA network designs (2018-onward) and at site level implementation
35

Thank you
Maxine Westhead

Resource Slides

How Oceans Act MPAs are Created Step 1: Select Area of Interest (AOI) • Engage stakeholders (ongoing during the designation process) • Create a multi-stakeholder advisory body
Step 2: Conduct overview and assessment of AOI • Overview of available ecological and human use information • Assess potential risk of human activities to the ecosystem
Step 3: Develop regulatory intent • Describes proposed boundaries and management scenario • Cost benefit analysis • Consult through advisory body and other mechanisms
Step 4: Develop regulatory documents and designate the MPA • Publish in Canada Gazette (includes public consultation period)
Step 5: MPA management • Research and monitoring, education and outreach, activity approvals, etc.

Advance opportunities
Phase 1
Gather data &
information
Phase 2
Design MPA
network
Phase 3
Create and implement
Action Plan
Phase 4
Monitor and manage sites
2015 2016 2017 2018 2020 2019
Consult on potential MPA Network Design Scenarios
Finalize MPA Network Design
Consult
MPA Network Development in NL Shelves Bioregion (proposed timeline)
Gather information and consult on MPA Network
Objectives

• From 1996 to 2009 twenty-two individual LEK data collection exercises were undertaken which cover the entire DFO NL Region
• This is a spatial database collected through interviews with local residents with an interest in participating. Mostly commercial fishers
• Data collected on the following themes, Groundfish, Pelagics, Shellfish Marine Mammals, Aquatic Plants, Aquaculture, Infrastructure, Culture Tourism and Recreation, Shoreline Classification (Scale 1:50,000)
40
NL Shelves Bioregion: Community-based Coastal Resource Inventory

Examples of Stakeholder Identified Conservation Priorities in the
NL Shelves Bioregion
1. Atlantic Cod
2. Coral and Sponges
3. At Risk Species
4. Marine Habitats
5. Marine birds
6. Cetaceans
7. Species of Aboriginal Importance
8. Forage Fish Species (capelin)
42
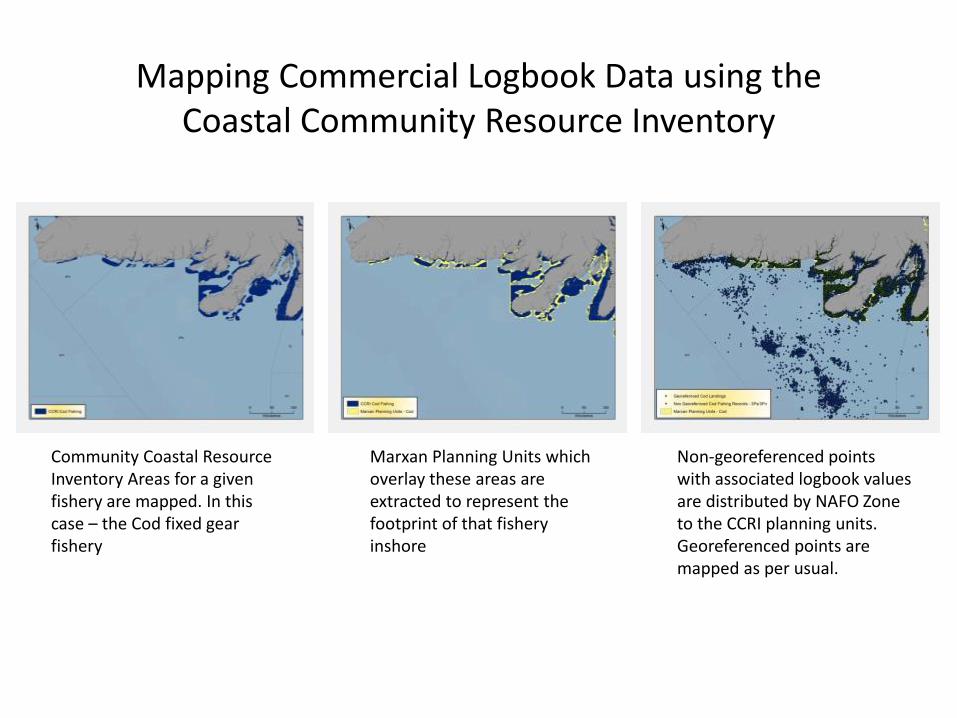
Community Coastal Resource Inventory Areas for a given fishery are mapped. In this case – the Cod fixed gear fishery
Marxan Planning Units which overlay these areas are extracted to represent the footprint of that fishery inshore
Non-georeferenced points with associated logbook values are distributed by NAFO Zone to the CCRI planning units. Georeferenced points are mapped as per usual.
Mapping Commercial Logbook Data using the Coastal Community Resource Inventory
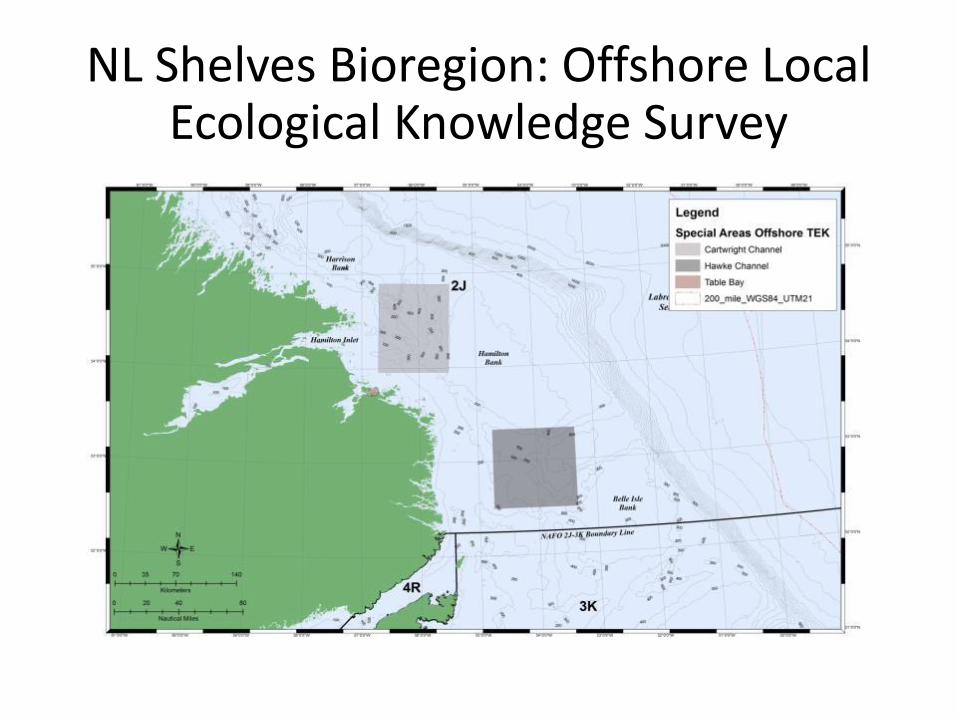
• In 2012 a LEK survey was conducted through a personal services contract
• Fifteen fishers were interviewed from several communities along the southern Labrador coast
• Extra emphasis was placed on trying to identify special areas or areas worthy of conservation attention
NL Shelves Bioregion: Offshore Local Ecological Knowledge Survey

Identifying Design Strategies (EGSL)
What?
Percentage associated to each CP
Why?
It quantifies strategic conservation objectives
Helps measure the achievement of results for the MPA network
How?
Different scenarios = various conservation levels

Identifying Design Strategies (EGSL)
Minimum target = 10% • - CBD expert workshop (Nagoya, 2010) • - Québec City (2011) • - "medium" and "high" targets
Targets selected for basic scenarios for all
conservation priorities: 10% - 20 % - 30%
Defining criteria for assigning higher targets

Identifying Design Strategies (cont.)
• Different CPs, different conservation level:
Increase targets if the conservation level is higher, e.g., species at risk:
• 20% - 30% - 40%
• Other criteria for assigning higher targets than those in basic scenarios:
Number of COs per CP Species of particular interest "Direct" vs. "substitute" data "Integrated" or "non-integrated" data