CHEMISTRY SEPTEMBER 30, 2014 SI/SIGNIFICANT FIGURES/SCIENTIFIC NOTATIONS.

Please, find and click on this icon on your computer:
Designing effective scientific figuresIntroduction to Inkscape to finalise figures
Aiora Zabala, based on slides by Simon Andrews and Boo Virk

What is Inkscape?
• Vector Graphics Editor
• Free Software• Cross Platform• Easy to use• Good for:– Compositing– Drawing
• Not for:– Bitmap editing

Bitmap and vector graphics
Images are made by points and their connections. Connections can be straight or smooth
Images are made of pixels and a colour value

Bitmap and vector graphics
• No inherent resolution• Fully editable

Scaling figures
• Vector images can be scaled freely without loss of quality
• Bitmap images can be scaled down, but not up

Exercise 1: set up a canvas
• File > Document Properties– Shows page in view– Doesn’t restrict
drawing– Useful as a guide
• Change background colour to white
• Change to landscape

Moving around
● Panning– Scroll bars on bottom / right– Scroll up/down, Shift+scroll for left/right
● Zooming in / out– Click to zoom in, shift+click to zoom out– Control + Scroll Up/Down to zoom in/out to cursor
● Shortcuts– Fit page, drawing, selection in window

• Selection tool, F1• Edit nodes tool, F2• Sculpt tool• Zoom tool, F3• Measurement tool• Make rectangles, F4• Make 3D boxes• Make ellipses / arcs, F5• Make polygons / stars• Make spirals, F9
Draw freehand lines, F6Draw straight lines / curvesCalligraphy toolAdd text, F8Sculpt with sprayEraseFillEdit gradientsSelect colourCreate diagram connectors
The main toolbar

Create basic shapes
• Select tool from toolbar• Click and drag on canvas– Box selects the bounds of the new shape– Colours are remembered from the last shape
• Basic options appear in top toolbar– Number of spokes on stars– Rounded corners on rectangles– Circle vs segment vs arc

Control nodes
• Use the Edit Nodes tool• Two types of control points, squares and circles– Squares generally change the size of the shape– Circles change the appearance
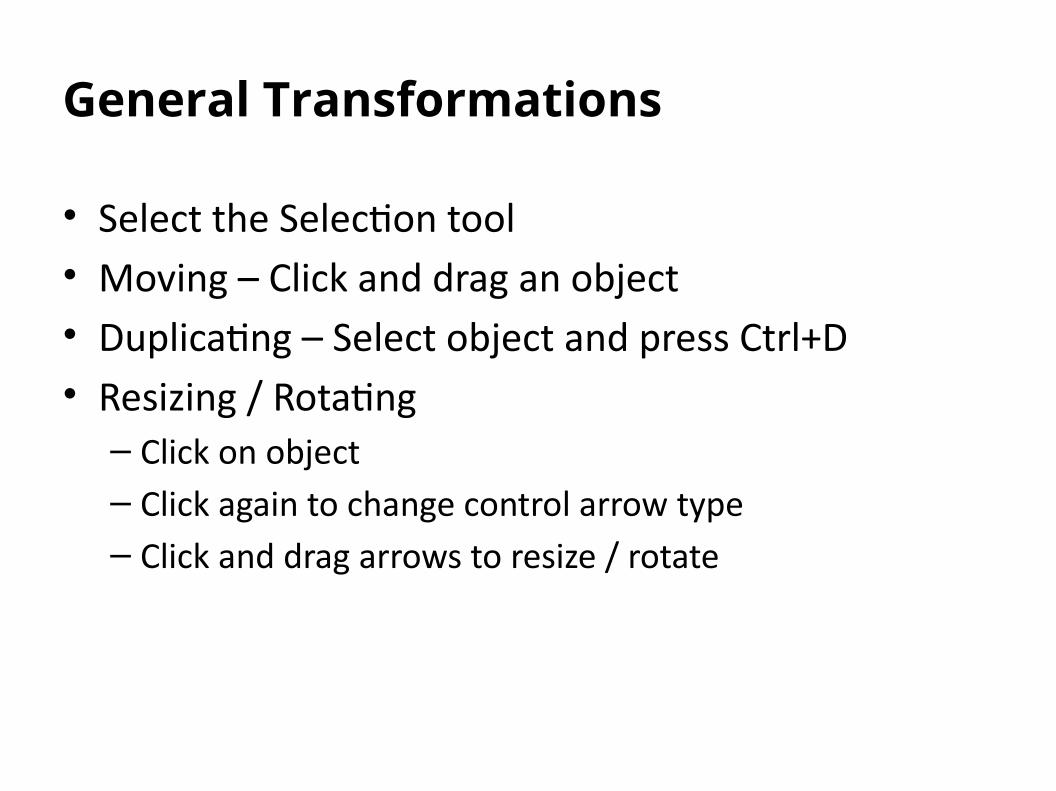
General Transformations
• Select the Selection tool• Moving – Click and drag an object• Duplicating – Select object and press Ctrl+D• Resizing / Rotating– Click on object– Click again to change control arrow type– Click and drag arrows to resize / rotate

Resize / Rotate
• Can use shift/control keyboard modifiers as before• For rotation you can move the crosshair to change
the centre of rotation
Resize Rotate

Transform Shortcuts
• Rotate 90 degrees anticlockwise• Rotate 90 degrees clockwise• Mirror object around the vertical axis• Mirror object around the horizontal axis
or
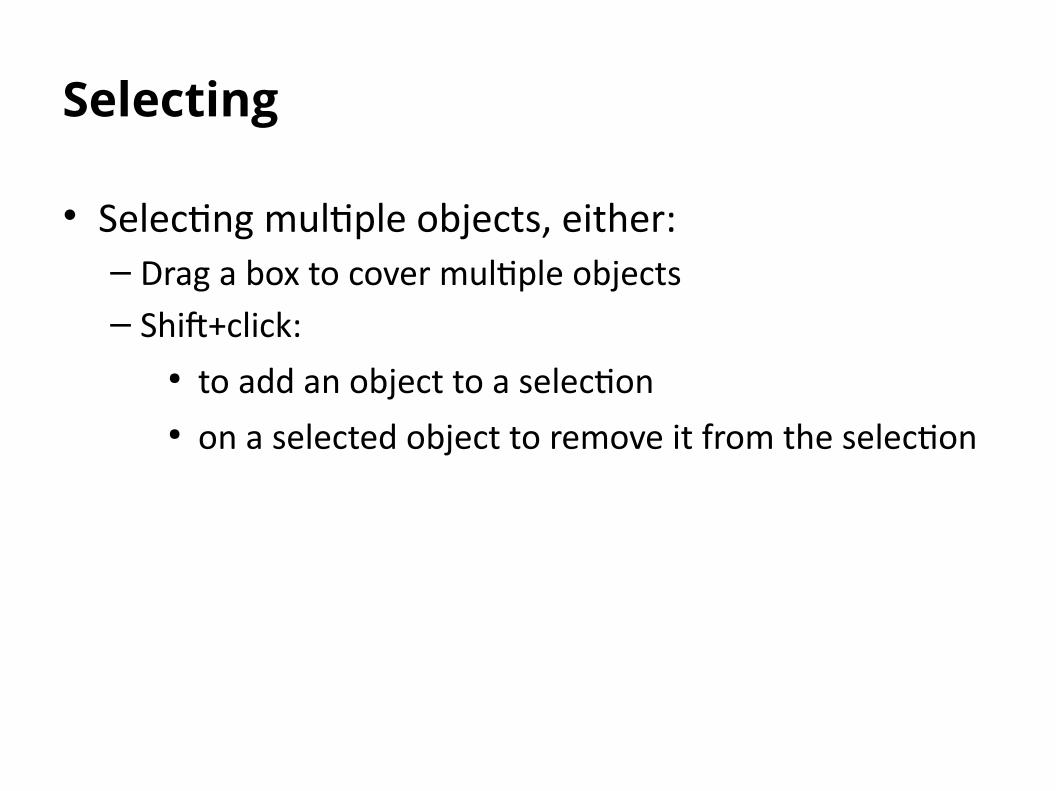
Selecting
• Selecting multiple objects, either:– Drag a box to cover multiple objects– Shift+click:
● to add an object to a selection● on a selected object to remove it from the selection
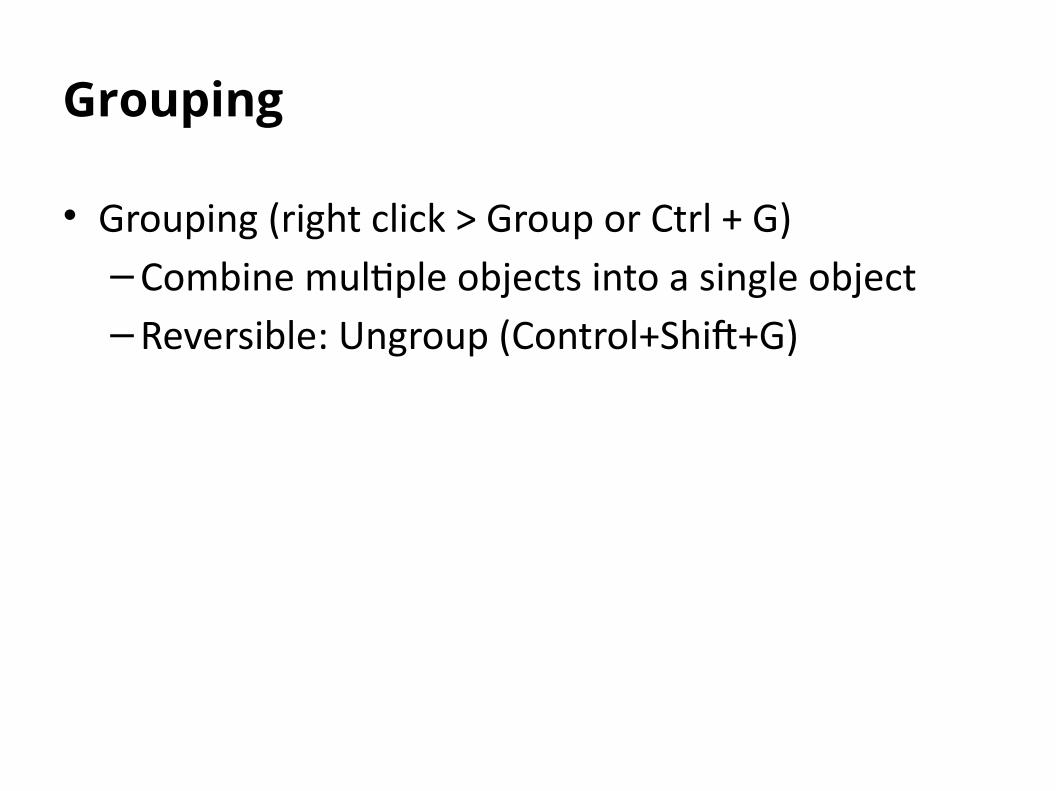
Grouping
• Grouping (right click > Group or Ctrl + G)–Combine multiple objects into a single object–Reversible: Ungroup (Control+Shift+G)
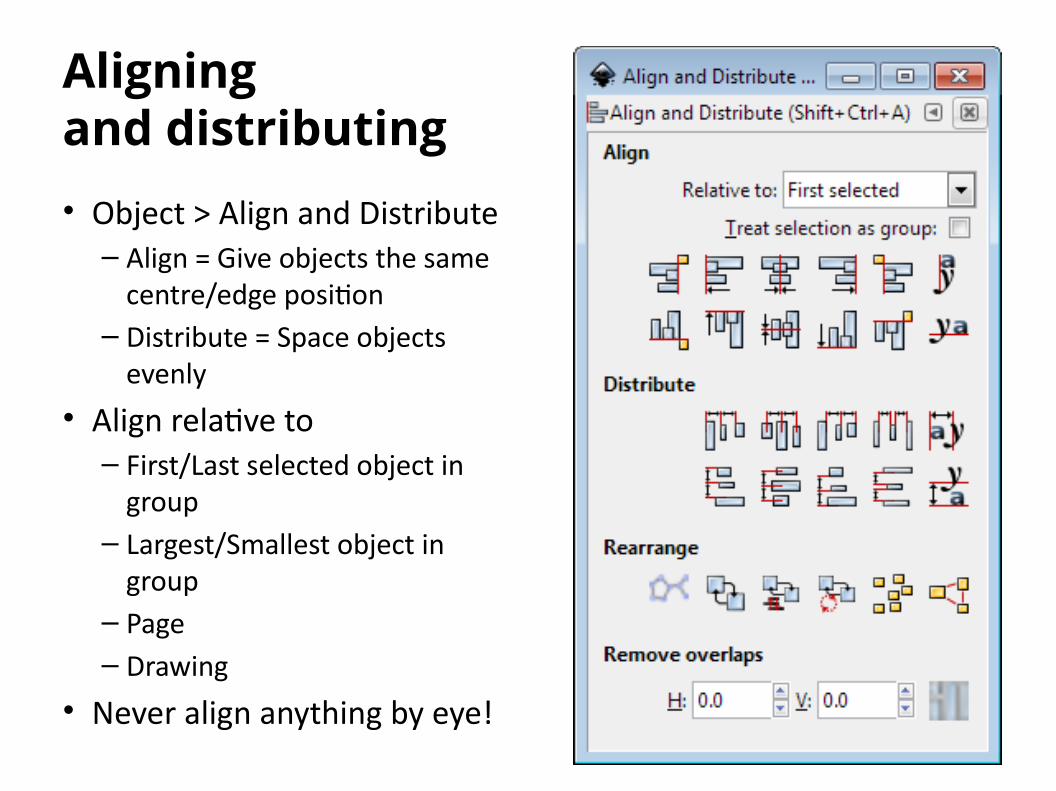
Aligning and distributing• Object > Align and Distribute– Align = Give objects the same
centre/edge position– Distribute = Space objects
evenly
• Align relative to– First/Last selected object in
group– Largest/Smallest object in
group– Page– Drawing
• Never align anything by eye!

Fill and Stroke
• Fill = Colour/ Gradient/ Pattern within a shape
• Stroke = The line around a shape
• Object > Fill and Stroke (Shift+Ctrl+F)
• Edit– Colours– Opacity– Blur

Fill and Stoke
• Fill types– Flat colour– Linear gradient– Circular gradient– Pattern fill– Swatch (bitmap) fill
– Specify colour and alpha (opacity)

Stroke Options
• Width of line• Shape of corners• Shape of line ends• Dashes• Arrowheads

Create this:
Draw a rectangle with curved corners, duplicate it as necessary, align the figures
Exercise 2: create and align shapes
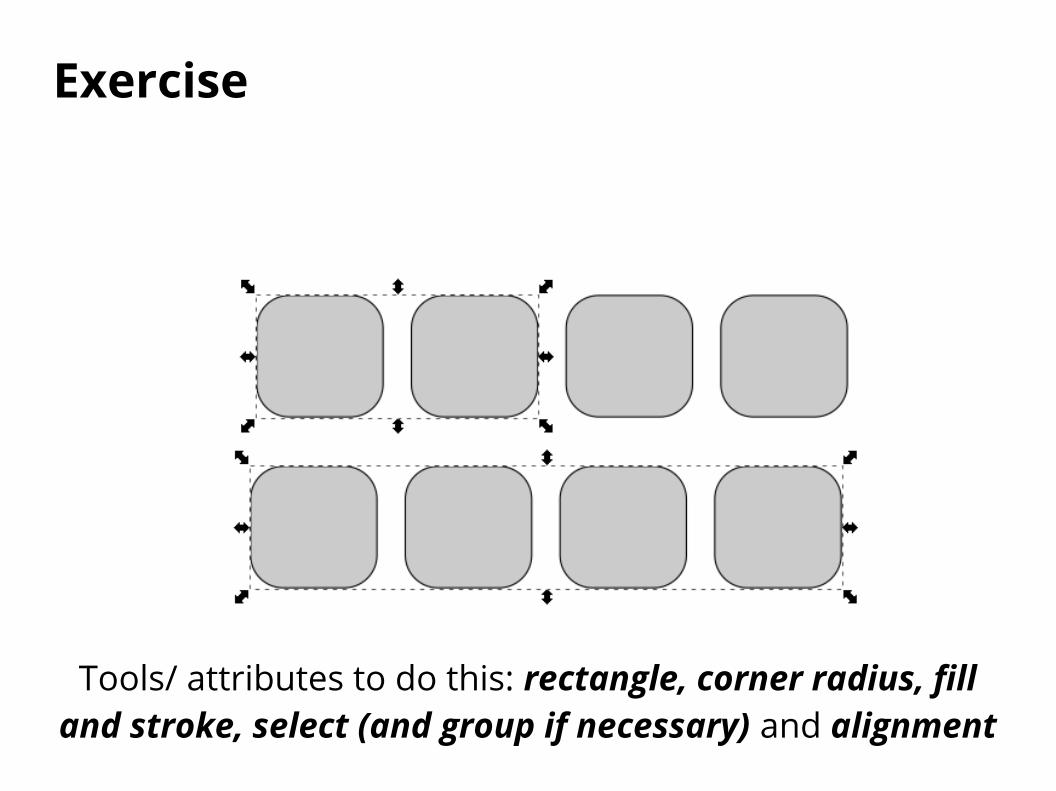
Exercise
Tools/ attributes to do this: rectangle, corner radius, fill and stroke, select (and group if necessary) and alignment

Creating and Editing Paths
• Created using freehand or line tool• Can convert other objects to become a path
• Paths are composed of nodes and segments• There are different types of node and
segment

Nodes and Segments
• Segment types– Lines (1)– Curves (2)
• Node types– End (3)– Corner (4)– Smooth (5)• Normal• Symmetric• Auto
1
22
2
3 3
4
5

Editing nodes
• Use nodes toolbar to add, remove or convert nodes or segments
• Select nodes or segments to make their handles visible
• Drag handles to change the arc of curves

• Freehand drawings tend to have large numbers of nodes, and be quite messy
• Write your name using the freehand tool (with your mouse) and edit to make it smoother:
– Use simplification (Path > Simplify, Ctl+L)
– Edit nodes directly on the simplified version
Exercise 3: freehand drawing
Combining paths
• Often want to add or subtract objects from each other
• Have to do this as paths (Path > Object to Path)
• Lots of options for joining paths together

Combining Paths
Union Difference
Intersection Exclusion

● Create two shapes● Copy & paste them
four or more times● Apply path
combinations to each pair of shapes
Exercise 4: path combinations

Opacity / Blur
• Applies to whole object• Separate from alpha in colours• Works on all Objects

Gradients
• Standard colour option• Set multiple colours / opacities to go through• Set the direction and extent of the gradient
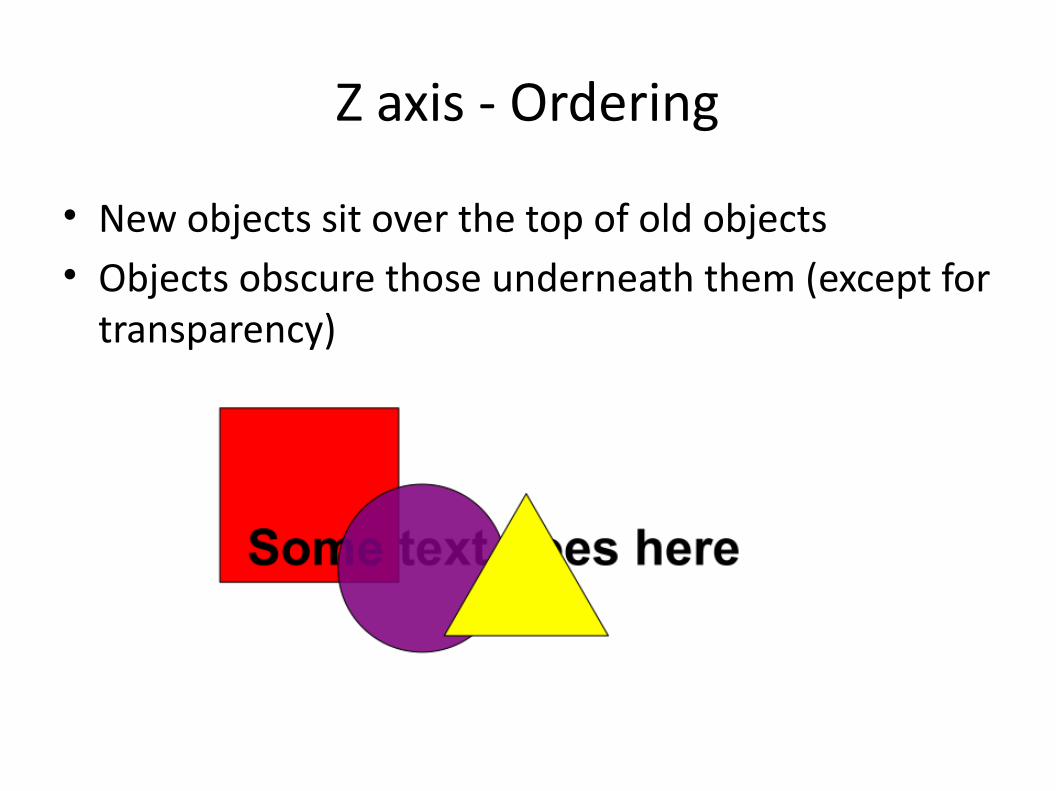
Z axis - Ordering
• New objects sit over the top of old objects• Objects obscure those underneath them (except for
transparency)

Z-axis Ordering
• Send object to bottom of z-stack• Lower object one level• Raise object one level• Bring object to top

Working with bitmaps (photos)
• Inkscape can include bitmaps in images• Appear as objects alongside vector objects• Can’t edit the images• Can’t increase the resolution of the image• Transparency (from PNG etc) is preserved
• File > Import• Formats: PNG, JPEG, SVG, PDF etc.

• Use the text tool to add text.• Click and type to generate text• Text can be scaled or rotated as any other object– Always hold Ctrl when scaling otherwise the aspect ratio
will be messed up
Exercise 5: add text

Text options
Text toolbar
Text and font settings: font, alignment, spacing

● Create a standard page layout and figures using block shapes.● Open Inkscape and go to document properties: File > Document
Properties● Set the page template to be a landscape A4 page.● Alter the view so that it is zoomed and centred on the page you have
just created.● Draw the flags below, using basic shapes:
Japan Iceland Turkey
● Make sure all flags are the same size. Use the appropriate tools to ensure that regions supposed to be aligned or symmetrical really are
Exercise 6: basic shapes

Copy and paste the image below into your Inkscape project:
In the PDF viewer, press Shift + Print screen and hold them while you select the image with your mouse. Then Save to clipboard.
In Inkscape, press Ctrl + V (or Paste)
Scale it to an appropriate size and use the image as a template for you to draw a vector illustration.There are two main options:
● Draw the initial sections freehand using either the drawing or curves tool
● Draw the main curves and shapes using Add shape tools, and then combining paths
Then use simplification and node editing to create a more refined image.Once you’re happy with the image you can delete the original photo to leave just your vector drawing.Finally you can label the major components of the eye: iris, pupil, eye lid, tear duct, eyelashes.
Exercise 9: freehand drawing & editing

Exporting, saving & importing files

File formats
Vectors: for anything that has been generated by a computer: graphs, illustrations and text.
File Types: File Types:
.svg .png
.eps .jpg / .jpeg
.pdf .gif
.ai .bmp
.tif / .tiff
Bitmaps: for figure components generated by a camera (e.g. microscopy or blot photos).

File formats
● Bitmap images can be embedded within a vector image.
● Ideally, publication figures should be vector graphics for assembly and annotation of figure panels, with bitmap images embedded within.
– This ensures that no resolution will be lost
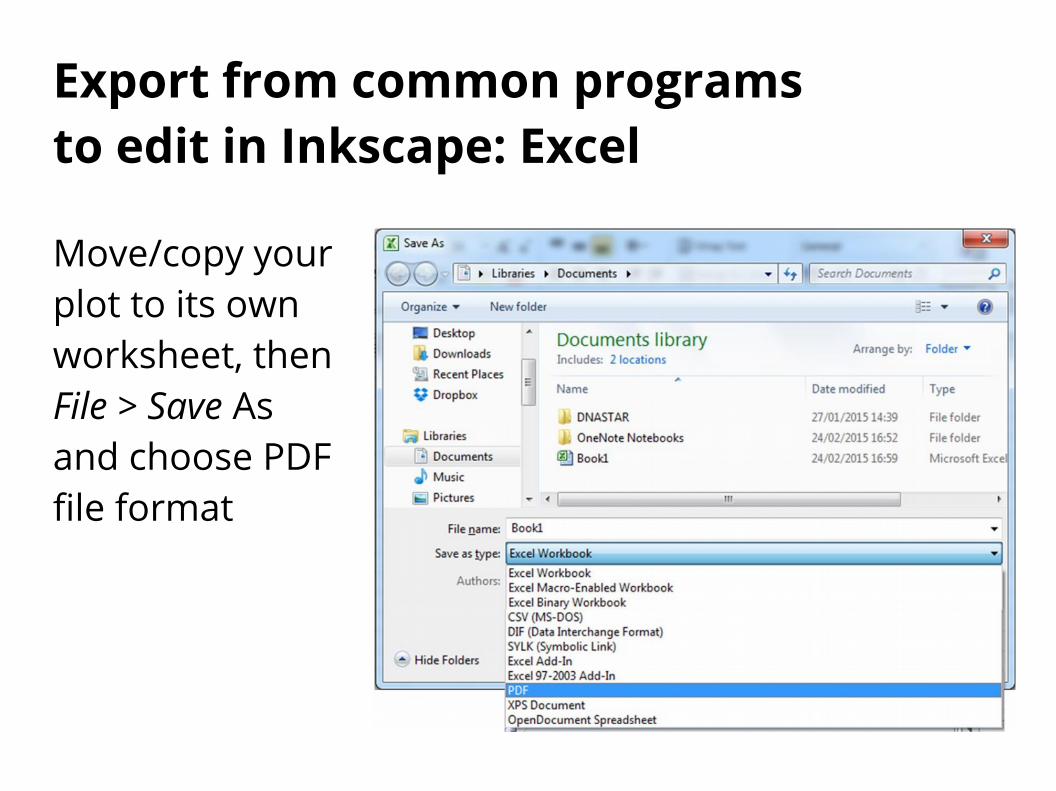
Export from common programs to edit in Inkscape: Excel
Move/copy your plot to its own worksheet, then File > Save As and choose PDF file format

Export from R to edit in Inkscape
In PDF:getwd() # Make sure you know where the figure is savedpdf(file="myplot.pdf") # … code of plot heredev.off()
Other formats:png()jpeg()bmp()tiff()svg()
postscript() Alternative to PDF, when they are too large to render if plots contain many data points
They all have arguments to set dimensions, resolution, etc. although the syntax can vary slightly.Remember to always close graphic devices by using dev.off()

Export from R to edit in Inkscape
● From Rstudio (only for quick & dirty)
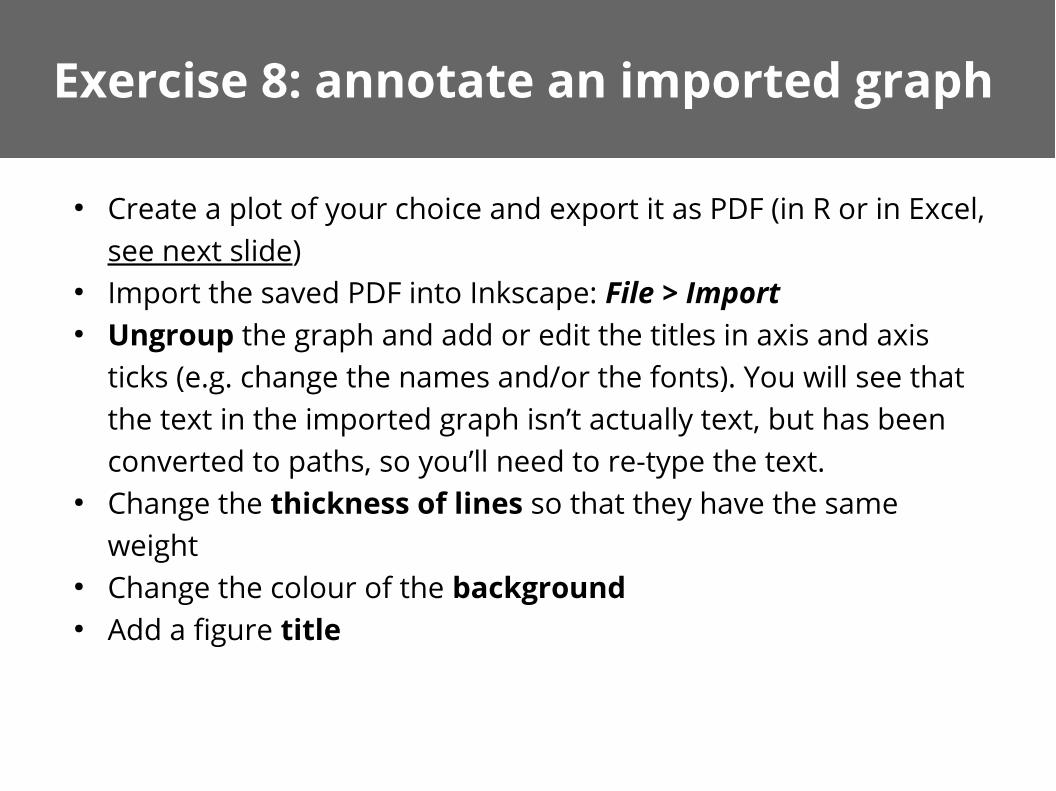
● Create a plot of your choice and export it as PDF (in R or in Excel, see next slide)
● Import the saved PDF into Inkscape: File > Import● Ungroup the graph and add or edit the titles in axis and axis
ticks (e.g. change the names and/or the fonts). You will see that the text in the imported graph isn’t actually text, but has been converted to paths, so you’ll need to re-type the text.
● Change the thickness of lines so that they have the same weight
● Change the colour of the background● Add a figure title
Exercise 8: annotate an imported graph
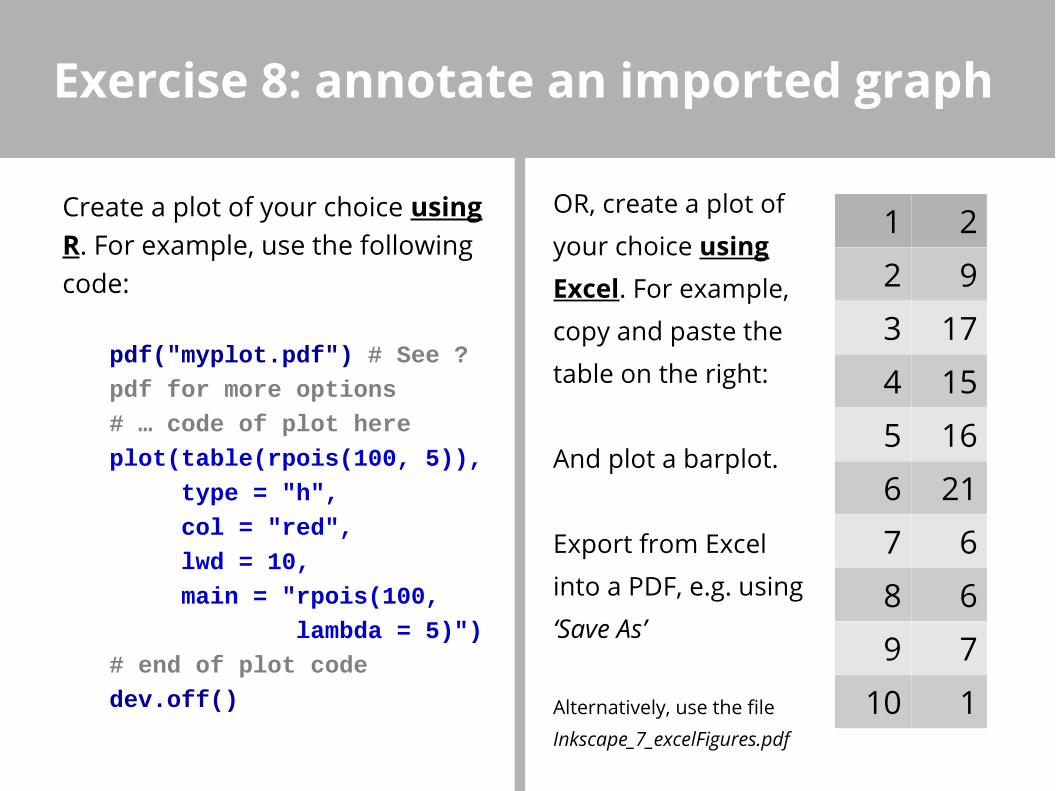
Create a plot of your choice using R. For example, use the following code:
pdf("myplot.pdf") # See ?
pdf for more options
# … code of plot here
plot(table(rpois(100, 5)),
type = "h",
col = "red",
lwd = 10,
main = "rpois(100,
lambda = 5)")
# end of plot code
dev.off()
Exercise 8: annotate an imported graph
OR, create a plot of
your choice using Excel. For example,
copy and paste the
table on the right:
And plot a barplot.
Export from Excel
into a PDF, e.g. using ‘Save As’
Alternatively, use the file Inkscape_7_excelFigures.pdf
1 2
2 9
3 17
4 15
5 16
6 21
7 6
8 6
9 7
10 1
Saving files in Inkscape
• Saving– File > Save (As)– Default is Scalable Vector Graphics (SVG)– Adds custom extensions to SVG standard– Can select plain SVG for maximum compatibility– Can compress SVG (svgz) for disk space saving

• In theory, SVGs can be seen in any web browser, however it has some caveats.
• To share the figure in vectorial format, PDF is appropriate
• File > Save (As), select PDF
Exporting files from Inkscape: Vector

• Figures with a lot of the surface covered with photos, or where the figure has many elements (e.g. millions of data points), saving as a bitmap can make files smaller and faster to render
• Inkscape exports high quality PNGs
• File > Export PNG Image
Exporting files from Inkscape: Bitmap

Saving vs Exporting
● In Inkscape (and any other vector software) distinguish between working or editable files (e.g. SVG), which are best seen with the software that created them, and files for sharing or publication (e.g. PDF or TIFF), which do not keep full editing features
● Save the file frequently while working on it● Export the file once it’s ready to share

Submitting to journals

Preparing for Submission
• Initially figures will be assessed by reviewers• At this stage figures do not need to be print
quality production• Most reviewers will print figures out on a
laser or inkjet printer on normal copy paper• If accepted for publication, high quality
figures will be required

Basic Steps in Preparation
• Determine the final size of the figure• Heights of text, thickness of lines• Figure in colour, grayscale or black and white• Resolution• Acceptable File format: choose the best one• Colourspace: CMYK or RGB

Journal Guidelines
• Most journals have guidelines for initial submission• These differ so it’s worth checking:– Nature: JPEG, 150 dpi, included in the manuscript, fit to
column width– Science: PDF, 150 – 300 dpi, included in manuscript, fit
to A4 page– BMC Biology: Several, 300 dpi, separate from
manuscript, fit to A4 page

● In Inkscape, open the SVG file ‘Inkscape_9_palmitic_acid.svg’. This is a reconstruction, in vectorial format, of the figure used as an example at the beginning of the course
● Using the tools you have learnt in Inkscape, improve the figure. – For example, reorganising, using alignments, making the text
labels consistent, etc.● Tip for using grids: you can set a grid in File > Document
Properties > Grid. You can also use the Snap tools in order to align the objects to the grid (View > Show/hide > Snap control bars).
● Remember to save working copies of your files in an appropriate format, i.e. SVG.
● Export your final figure in an appropriate format.
Exercise 9: composing for publication