Designing an efficient Project Portfolio Management...
69
Department of Applied Information Technology CHALMERS UNIVERSITY OF TECHNOLOGY Gothenburg, Sweden 2017 Designing an efficient Project Portfolio Management tool Creating a Project Portfolio Management tool using interaction design and the Asp.Net framework Master’s thesis in Interaction Design and Technologies MAGNUS JUNGHARD HUTTU
Transcript of Designing an efficient Project Portfolio Management...
Department of Applied Information Technology
CHALMERS UNIVERSITY OF TECHNOLOGY
Gothenburg, Sweden 2017
Designing an efficient Project Portfolio
Management tool Creating a Project Portfolio Management tool using
interaction design and the Asp.Net framework
Master’s thesis in Interaction Design and Technologies
MAGNUS JUNGHARD HUTTU

i
ii
REPORT NO. xxxx/xxxx
Designing an efficient Project
Portfolio Management tool Creating a Project Portfolio Management tool
using interaction design and
the Asp.Net framework
MAGNUS JUNGHARD HUTTU
iii
Designing an efficient Project Portfolio Management tool. Creating a Project Portfolio Management tool using interaction design.MAGNUS JUNGHARD HUTTU
© Magnus Junghard Huttu, May 2017
Technical report no xxxx:xx Department of Applied Information Technology Chalmers University of Technology SE-412 96 Göteborg Sweden Telephone + 46 (0)31-772 1000
Department of Applied Information Technology
Göteborg, Sweden 1999
May 2017
iv
Abstract In this thesis we walk through the steps of creating a modern web design for a tool aiding
project portfolio management and the resource management that follows. This is done by
using interaction design methodology which helps finding relevant information in the context
of where the tool will be used. The outcome of the research is used as a basis for the design
and will affect design choices and functionality in the final prototype.
In the beginning theory will be gathered and researched to give a deeper view into the subject
of project portfolio management and its underlying definitions. The theory will be used in
interviews conducted at companies using the processes of project portfolio management, to
find better questions regarding needs in the tools they use and to better understand the
findings of the interviews.
The interviews will be analysed and used in the following prototyping phase where the design
and its functionalities will be iterated on. These are later implemented in the final prototype
which then is evaluated and based on the results of the evaluation it will be argued for if the
prototype is a step in the right direction of creating efficient web tools for project portfolio
management.
v
Glossary
AJAX – Asynchronous JavaScript and XML
MVC – Model View Controller
PPM – Project Portfolio Management
RM – Resource Management
R&D – Research and Development
6
Acknowledgements
I would like to thank my supervisor Khanh-Duy Le for guiding me throughout
the process of this thesis and for always being kind and helpful.
I would also like to aim my gratitude to Montell & Partners and my two
supervisors there, Carl Christian Lamm and Martin Tennman. Thank you for
making it possible for me to do this thesis and for putting aside time to help me
whenever I needed.
I also want to thank the people at Company A and Company B (you know who
you are!) for letting me interview some of the staff and for being so cooperative.
7
Table of Contents 1. Introduction ...................................................................................................................... 9
1.1. Background ......................................................................................................................... 101.2. Project goals ........................................................................................................................ 111.3. Thesis scope ......................................................................................................................... 111.4. Thesis outline ...................................................................................................................... 121.5. Ethics ................................................................................................................................... 12
2. Theory ............................................................................................................................. 13
2.1. Project Portfolio Management (PPM) .............................................................................. 132.2. Successful portfolios ........................................................................................................... 132.3. Resource planning .............................................................................................................. 142.4. Supporting PPM software ................................................................................................. 14
3. Methodology ................................................................................................................... 17
3.1. Contextual Design ............................................................................................................... 17
4. Planning .......................................................................................................................... 20
4.1. Changes to the plans ........................................................................................................... 204.2. Interviews ............................................................................................................................ 204.3. Data consolidation .............................................................................................................. 204.4. Prototype ............................................................................................................................. 20
5. Research process ............................................................................................................ 21
5.1. Literature study .................................................................................................................. 215.2. Interviews ............................................................................................................................ 215.3. Contextual inquiries ........................................................................................................... 235.4. Data consolidation .............................................................................................................. 235.5. Ideation ................................................................................................................................ 285.6. Validation ............................................................................................................................ 35
6. Web application prototype ............................................................................................ 37
6.1. Project leader functionality ............................................................................................... 376.2. Resource manager functionality ....................................................................................... 406.1. Evaluation ........................................................................................................................... 42
7. Result ............................................................................................................................... 47
7.1. Basic requirements ............................................................................................................. 477.2. Requirements for varying portfolios ................................................................................ 47
8
7.3. Design requirements ........................................................................................................... 48
8. Discussion ....................................................................................................................... 49
8.1. Interviews ............................................................................................................................ 498.2. Affinity diagram ................................................................................................................. 508.3. Iterated ideation ................................................................................................................. 508.4. Final prototype ................................................................................................................... 518.5. Results .................................................................................................................................. 52
9. Conclusion ...................................................................................................................... 54
10. References ................................................................................................................... 55
11. Appendix ..................................................................................................................... 58
Appendix A: Interview question template (in Swedish) .............................................................. 58Appendix B: List of input from interviewees ................................................................................ 60Appendix C: Summative Usablitiy testing process ....................................................................... 67
9
1. IntroductionAs the market grows more competitive, companies are pressured to make their employees
work as effective as possible in order to get ahead of the competition. This is what have made
resource management so important for companies at the peak of competition. Resource
management can be seen as a big process of how to get as much value from an employee as
possible. It can sound very simple, however there is a big number of aspects to consider in
resource management such as just the well-being of the employees. It is unfortunately not
obvious to everyone that things like an employee’s well-being and engagement are extremely
important to build a healthy bond between an employee and their workplace. However, a
study by Gallup, a public opinion measurement website, show us that these two are the keys
for employee performance. The study also highlights that only 32% of the workers in the U.S.
actually are engaged in their place of work, which is easily missed when not using a structure
such as resource management (Gallup, 2017).
A tool is necessary in terms of overviewing time and work which an employee spends on
specific projects as well as planning future projects and the use of resources on the projects.
The best Project Portfolio Management (PPM) tools offer interfaces focusing user-
friendliness and functionality as well as comforting analytics (LeanKit, 2017). There are
hundreds of different software dealing with the problematics of PPM, each with a different
approach to scheduling and algorithms for planning resources with ease (G2 Crowd, 2017).
This also brings the question of what actually differs in these tools, which will be answered
further into the thesis.
The PPM tool developed in this thesis project will be written in ASP.NET MVC with support
from the Microsoft Azure cloud solutions. ASP.NET is Microsoft’s open source framework
for building web application development (The Official Microsoft ASP.NET Site, 2017) with
a huge support from their Integrated Development Environment (IDE) Visual Studio (Visual
Studio, 2017) and from the community, making it easy and fast for the prototyping.
By structuring the thesis from the four basic processes in Interaction Design described by
Helen Sharp et al. (2007) a tool can be forged from the basics of resource management and
10
apply it with the input from users who deal with these tools on daily basis. Because of the
user-focused processes such as interviews and contextual inquiries hidden patterns can be
captured which the users are unaware of.
In this thesis the studies will be conducted very closely with some people that use these tools
on a daily basis, this allows for the use of the design process called contextual design.
Contextual design uses the interaction design methods that are used in the context of the
research, for example, interviewing users at their workplace where they use related data for
the interview.
Contextual design is a design process developed by Hugh Beyer and Karen Holtzblatt which
contributes to innovative design by making the researcher dig deep into in-depth field
research (Beyer and Holtzblatt, 1999). This is a structured design process within the field of
interaction design which has a focus on research from the aspect of the user’s context, which
is used throughout this thesis.
1.1. BackgroundMany research and development (R&D) organizations have implemented IT systems to
support resource management and planning. However, there are many organizations that still
struggle to get a complete view of future resource utilization and proper decision support to
know when there are resources available for new projects. Since resource planning is a vital
part of controlling your project pipeline, poor resource management will deteriorate the
complete R&D portfolio management.
There are many existing IT systems targeting Resource Management, but these tools are often
part of a larger IT platform where the resource management functionality is far too complex
and detailed. The administrative burden to handle the data is too high, and this makes stake
holders like resource owners, project managers, portfolio and program managers, struggle to
keep the information up to date.
The key to get resource management working is to find the optimal balance where the
complexity and time needed to manage the data is kept to a minimum while still providing
11
enough detailed data to support proper decision making and reporting. This should be
achievable by a very clean, efficient and user friendly interface.
Some of the most popular tools used today are distributed by Microsoft, Clarity Software and
SAP. These all have one thing in common and that is the complexity, the time needed to be
invested becomes too great and the efficiency falters.
1.2. ProjectgoalsThe objectives of this thesis is to find the basics of resource management tool functionality
and applying the process of contextual design with the use of interaction design methods.
Gathering data for an implementation of a tool deployed in the cloud will be taking place and
the goal will be to have it fully functional featuring all key functions from the generated
design. The tool should be a web application using latest technology when maintaining the
core functionality.
Following the goals of the project the following research question is brought into light:
• What are the design requirements for an efficient PPM tool that is used for a
varying project portfolios?
This questions will be answered with the information gathered throughout the research
process and summarized in chapter 7 called Result.
1.3. ThesisscopeThe definition of a PPM tool in this thesis will be a software supporting only the process of
managing resources and a portfolio of projects.
The prototype will focus on resource management in the meaning of planning man hours. In a
broader meaning, resources management also includes planning of all other project costs, but
this is not in the primary scope.
The prototype will focus on the interface experienced by active users like Project Managers
and Resource Owners. Administrative interfaces for managing master data and system
configurations are not in primary scope.
12
The analysis, interviews and prototype work will focus on the central concepts of Resource
Management, and not Project Management in general. Many existing systems covers a wide
range of project management functionality, which is not the intention with the prototype.
1.4. ThesisoutlineThe aim of the first chapter in this thesis is to introduce and create curiosity about the subject.
The second chapter is where the related theory is located. This is where the reader can read
up on information related to the context of the thesis. The third chapter describes the
methodology behind the research, every process will be thoroughly described. The fourth
chapter outlines the plan and schedule that was being used throughout the research and
explains changes together with special cases. The fifth chapter describes the process of
actually doing the research, starting at the very beginning of the project where the literature
study opens the chapter. The sixth chapter describes the web tool design and functionality
created from the resulting guidelines of this thesis. The seventh chapter narrates the outcomes
of the research. The eight chapter is used to discuss different aspects of the thesis. The ninth
chapter concludes the thesis.
1.5. EthicsConfidential information is handled with discretion and there is no reporting about names,
information that can be tied with businesses or other harmful data. The thesis focus lies on
researching an interface for management of project portfolios and nothing else. However, the
interviews and contextual inquiries have been sound recorded if the interviewee has agreed on
it which will produce a privacy issue. This is handled by me signing a confidentiality
document.
Two major companies having different techniques when dealing with resource management
have been giving input in forms of interviews and contextual inquiries. However, they wish to
be anonymous in the thesis and therefore they will be referred to as Company A and
Company B.
13
2. TheoryResource management is a widespread term which can be applied to many contexts. For
example, human resource management, which focuses on scheduling workers and planning
their time to efficiently fit them into ongoing projects as well as making sure the staff are up
to date on techniques and work related knowledge (Whatishumanresource.com, 2017). The
term human resources management is often used with product line projects, also known as a
group of products collected under the same brand (Staff, 2017).
Managing resources is what this thesis is focusing on but also taking a bigger perspective
where portfolios of projects are considered in the calculation, also known as Project Portfolio
Management (Levine, 2005).
2.1. ProjectPortfolioManagement(PPM)
Whilst dealing with different projects within a company PPM is combining different business
strategies which, applied onto a project pipeline, will help sort out bad projects and create
space for better projects (Levine, 2005). One can simply from the name conclude that Project
Portfolio Management is defined by grouping projects. Archer and Ghasemzadeh describes it
even more elaborately, adding to it that it is also the carrying out of the portfolio under the
management of a company or business (Archer and Ghasemzadeh, 1999).
2.2. Successfulportfolios
A successful portfolio of projects is when each and every project in the portfolio can create
value independently from other projects (Kodukula, 2014). There is a need of sorting out bad
projects which is done by prioritization. In the means of prioritization there must be some
value created from a project. If there is no value generated then there is nothing to compare a
project against the other projects in a portfolio (Kodukula, 2014). A project might be a
support project, creating value by being useful for other projects, however then it should be
included in the other projects by creating a bigger project with sub-projects in it (Kodukula,
2014).
14
In an article by LaBrosse (2010), she describes best practices with the manager first needing
to gather an inventory of all the projects and resources, and fill them with as many details as
possible. The projects are then prioritized and from the prioritization scored so that the most
necessary projects get their resources. The score together with a cost versus benefit ratio is
used to create an optimized project-portfolio mix (LaBrosse, 2010).
2.3. ResourceplanningIt is not uncommon that a portfolio contains more projects than there are available resources
(Blichfeldt and Eskerod, 2008). However, PPM is a major factor in harmonizing resources
and efficiently planning these into projects. It provides structure and oversight of strategies,
processes, resources and projects (Levine, 2005). In terms of resource planning, PPM’s needs
to have the skills most important to a project in consideration before quantity (Kodukula,
2014).
Planning the resources of a portfolio is most commonly made in waves (Kodukula, 2014).
Iterating the process until a satisfactory result is in place. This is most often called Rolling
Wave Planning, and is effectively used at a higher view such as the portfolio level. Basically
you plan the most critical resources for the project in full-time equivalents (FTE) which
stands for a ratio of workload per quarter of a year, a whole FTE unit (1) means that all
working hours are spent on that project. A quarter of a year represents one wave in Rolling
Wave Planning (Kodukula, 2014).
2.4. SupportingPPMsoftware
There are many different types of software supporting the processes of PPM, however finding
the right ones, the ones that responds to a specific organization’s demands is eloquently
described by Mark Price Perry (2011) as “putting together the pieces of a complex jigsaw
puzzle, blindfolded” (Perry M, 2011, p.235).
2.4.1. ProjectPortfolioManagementTools
MS Project, Trello and Atlassian JIRA are three of the top five most used PPM tools today
(G2 Crowd, 2017) which are described shortly below.
15
MS Project is a tool made by Microsoft which shares a similar user interface and several
features in common with MS Excel, a co-existing software. The application is an advanced
tool with a focus on creating tables and using these to structure the projects and resources. MS
Project is not an application developed for the web, however, Microsoft has evolved the
product into an online web based product that is called Project Online Professional
(Products.office.com, 2017). The tool was first released in 1984 and has been improved upon
since, which makes it one of the oldest project management tools out there. The tool is
unfortunately very maintenance heavy which means that the company using it has to put a lot
of time into the tool to update the documents and to create content. Specific tasks and dates
are hard to derive since this demands the time and effort put into the tool from both
administrators and the managers who updates the details when something happens. Many
companies usually skip this tool because of the high time demand.
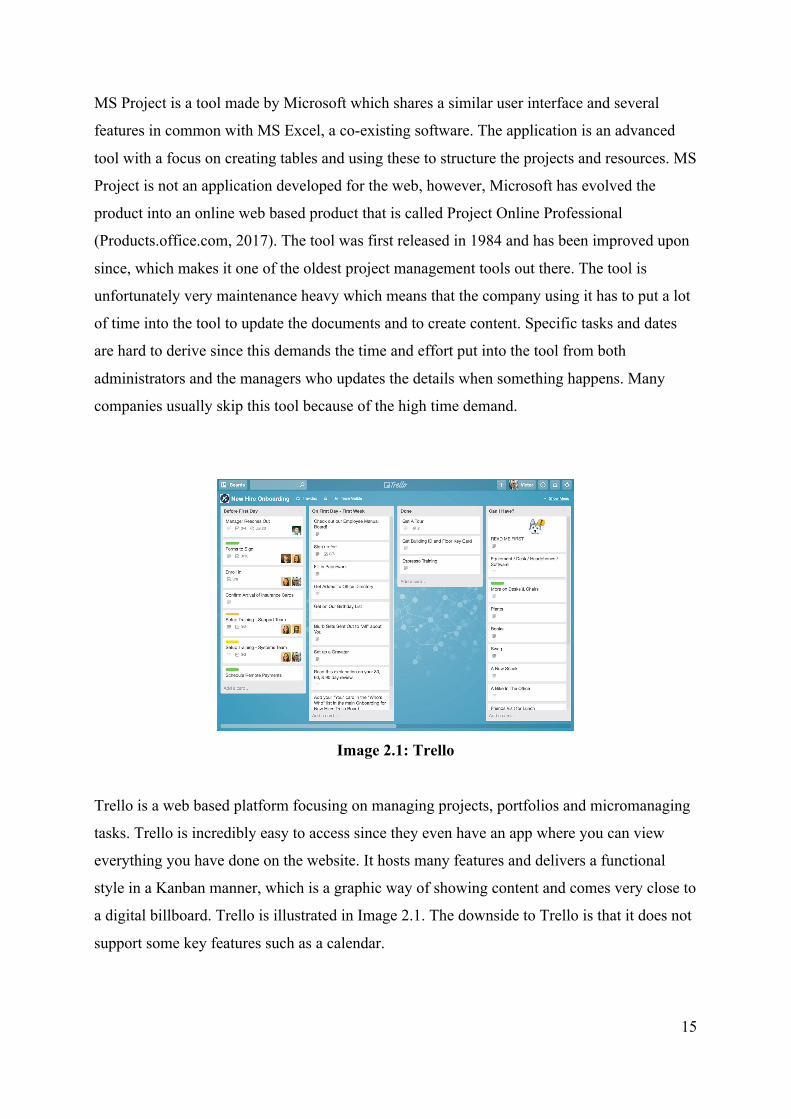
Image 2.1: Trello
Trello is a web based platform focusing on managing projects, portfolios and micromanaging
tasks. Trello is incredibly easy to access since they even have an app where you can view
everything you have done on the website. It hosts many features and delivers a functional
style in a Kanban manner, which is a graphic way of showing content and comes very close to
a digital billboard. Trello is illustrated in Image 2.1. The downside to Trello is that it does not
support some key features such as a calendar.
16
Atlassian JIRA is a web based PPM tool which focuses on being incredibly easily understood
and visually appealing. They mix the use of Kanban style with issue tracking for agile
projects, git management support and a lot of small extra features focused around helping
software development. This is a perfect solution for small agile projects where the focus lies
in developing software. Bigger companies often have varying projects and the software
development is not always priority in which cases there are other software more adjusted for
their needs.
17
3. MethodologyThe aim of this chapter is to describe the methods used in the process of the research in this
thesis.
3.1. ContextualDesignA design process developed by Hugh Beyer and Karen Holtzblatt which contributes to
innovative design by helping the researcher dig deep into in-depth field research (Beyer and
Holtzblatt, 1999). There are three basic steps in contextual design which are field research,
consolidation and ideation, and design together with validation. These are used as a basis for
the prototyping phase and can be applied for almost any technical product (Beyer and
Holtzblatt, 1999).
3.1.1. Interviews&Contextualinquiries
A contextual inquiry is conducted with the interviewee either before or after the interview,
most preferably before. This is to increase the knowledge around the tool and also because of
letting the interviewer get a view of how the current tools are used. The contextual inquiries
are also conducted to be able to ask the interviewee about reasons behind usage and being
able to understand how they think when they are using the tools. Basically finding needs. The
contextual inquiries lets the interviewee show how they work with the tool while another
person stands behind or somehow studies the user while they are performing ordinary work,
hopefully showing some habits they themselves are unaware of.
The interviews are focusing on finding interesting input on the PPM tool which the
interviewee is using on a daily basis. The interviewed users will mostly consist of project
managers and resource managers handling one or more cost centres, which can be described
as divisions that resources work under.
It is important to note that humans do not have perfect memory and they tend to create
memories from how they think the experience might have been (The Interaction Design
Foundation, 2017).
18
3.1.1.1. Methods
To be able to gather as much data as possible during the interviews they will be recorded by
sound if allowed by the interviewee, this will make it easier not to disturb the flow of the
discussion and instead let the interviewer focus on probing around the questions. The
interviews will be held at the workplace or in another contextual location to both enable the
interviewee to relate to objects, events or other matters that the context might make them
highlight.
During the contextual inquiry the observer shall let the user work without being interrupted to
obtain an experience as close to the reality as possible.
3.1.1.2. Interviewpreparations
Before the interviews a structure is prepared and a list of questions will be iteratively
constructed (See Appendix A).
3.1.2. Dataconsolidation&Ideation
Data collected from the interviews will be analysed and information about the fundamentals
of a PPM tool will be gathered in this part of the contextual design. This step in the big
process of contextual design can be seen as a bridge between information and design, the big
step of understanding context. A common method to use in this analytical phase is to make an
Affinity diagram with the help of post its where key information is grouped from the data
gathered during earlier stages. This will reveal problems and features that are either wanted
or unwanted.
The ideation phase will be one of the most important parts where using methods like
brainstorming using post its will find many features and important design choices for the
product. After a brainstorming session it is wise to use the KJ-method to narrow all the ideas
down to the best ones. These parts are iterated through until a satisfactory result is gained.
It is important to note that this is done in a one-man team which makes it harder to discuss
outcomes and only one person’s opinions on the groupings will be gained.
19
3.1.2.1. Method
An affinity diagram is approached because of the many inputs from the interviews. It is
necessary to group these and make the data understandable. The affinity diagram will show
where the focus needs to lie when designing the PPM tool.
3.1.3. Design&validation
The design will be prototyped from sketching to actual development using C# in a Microsoft
Visual studio environment. The framework will be ASP.NET Core version 1.1, which is the
latest in the moment of writing.
The iterative outcomes will be conducted by remote testing with supervisors until an
acceptable design has been produced. The prototype will be given a month of coding before a
test will be performed to see if the design has become more efficient than the current tools
used by Company A. This is thought of as a necessity because the development phase will
also be an iteration and from prototyping in this manner functionality is thought to come
forward which was not found in earlier stages.
The evaluation will be approached using Summative Usability Testing which is an empirical
study most commonly used to benchmark and to measure how well an application, for
example, does compared to another application (Usabilitybok.org, 2017). Summative
Usability Testing will be used to evaluate how well the new design performs in comparison to
the current tools used in Company A. The evaluation will be built on top of some
hypothesises and will be structured by first letting a tester conduct a number of use cases.
After the use cases have been done or a set time limit has been reached, there will be an
interview which elaborates on the design and outcome of the prototype in comparison to the
other tool it is compared to.
20
4. PlanningThe schedule was created during the proposition phase of the thesis. Here changes are
described and possible causes to delays.
4.1. ChangestotheplansThe biggest change of dates was the interviews. There were however some other impacts on
the planning as well, such as holidays which were not taken into account in the beginning.
4.2. Interviews
Unfortunately, the last interviews were conducted a lot later than anticipated and therefore the
design phase was pushed into a later time. The last interview was planned to take place in
February, however things don’t always go as planned and it was instead conducted in late
mars.
4.3. DataconsolidationThe data consolidation was started after the first interview but because the interviews got very
spread timewise it mostly got pushed a month forward, starting in April instead of late
February.
4.4. PrototypeThe prototype only had about two weeks instead of two months, which was very unfortunate.
However, one cannot anticipate everything, there are always unknown events that is
impossible to see from the beginning. Impacting on the prototype coding was also that it was
written on a virtual machine that was running on a server which made it impossible to be
writing without an internet connection, fortunately this was only an issue while on the train to
Malmö and otherwise places with internet connection were always possible to find.
21
5. ResearchprocessThis chapter elaborates on the process of the research and describes all the steps along the
way from the beginning of the research to the final prototype.
5.1. LiteraturestudyTo understand the concept of a project portfolio management tool it would be wise to first
scope into project portfolio management. Project portfolio management includes resource
management on top of project management of a portfolio of projets. Resource management
focuses on planning workers and scheduling their time to effectively fit them into ongoing
projects. Resource management is often used with product line projects.
Project management basically plans resources into projects based on needs, availability and
priority. Project portfolio management is project management but with an overview of all
projects and resources, with different solutions on how to optimize workload for all resources
as well as always having enough resources on each project. It is the most attractive approach
to companies having lots of projects on the go at the same time.
There are no writings on efficient design for PPM tools at the time of writing. This makes it
harder to find an area to touch in the whole design part of these tools, instead the report will
have to touch upon each part of the design functionalities as it is a new ground.
5.2. InterviewsThe interviews were conducted at two major companies, they have asked to be anonymous
and therefore they will be called Company A and Company B.
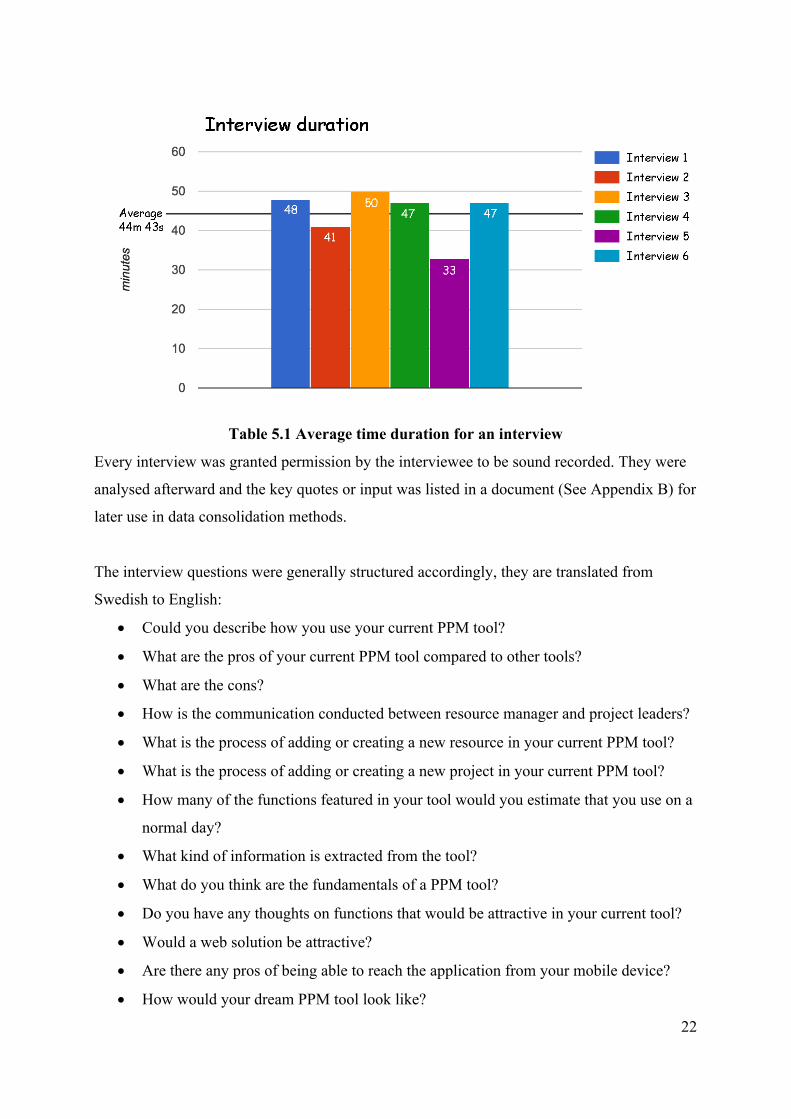
There were six interviews and the people consisted of project leaders, resource managers and
administrators. The average time of an interview was 44 minutes and 43 seconds.
22
Table 5.1 Average time duration for an interview
Every interview was granted permission by the interviewee to be sound recorded. They were
analysed afterward and the key quotes or input was listed in a document (See Appendix B) for
later use in data consolidation methods.
The interview questions were generally structured accordingly, they are translated from
Swedish to English:
• Could you describe how you use your current PPM tool?
• What are the pros of your current PPM tool compared to other tools?
• What are the cons?
• How is the communication conducted between resource manager and project leaders?
• What is the process of adding or creating a new resource in your current PPM tool?
• What is the process of adding or creating a new project in your current PPM tool?
• How many of the functions featured in your tool would you estimate that you use on a
normal day?
• What kind of information is extracted from the tool?
• What do you think are the fundamentals of a PPM tool?
• Do you have any thoughts on functions that would be attractive in your current tool?
• Would a web solution be attractive?
• Are there any pros of being able to reach the application from your mobile device?
• How would your dream PPM tool look like?
23
The questions were thought to improve the overall knowledge of how current workflow was
conducted together with finding needs that were obvious to the interviewees but the
interviewer was oblivious of. They were also aimed to be a compensation for the lack of
contextual inquiries.
5.3. Contextualinquiries
The inquiries were conducted during the interviews and became more of a showcase of the
tool than a contextual inquiry. These were supposed
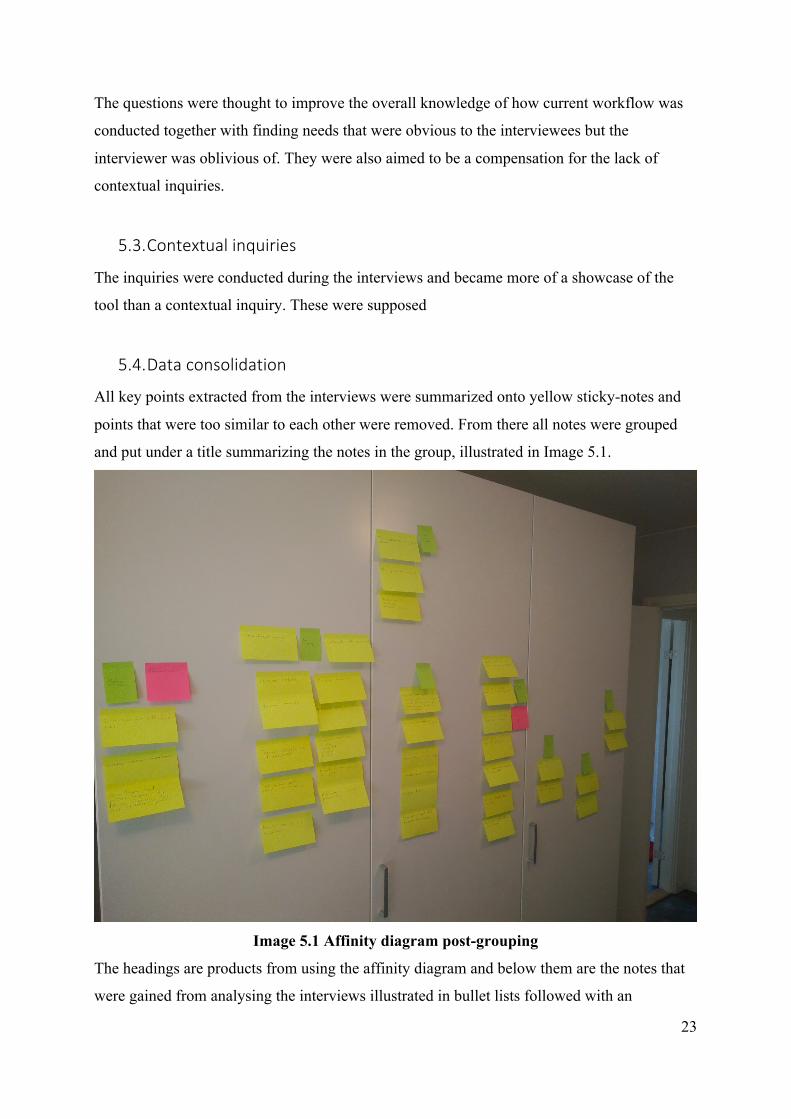
5.4. DataconsolidationAll key points extracted from the interviews were summarized onto yellow sticky-notes and
points that were too similar to each other were removed. From there all notes were grouped
and put under a title summarizing the notes in the group, illustrated in Image 5.1.
Image 5.1 Affinity diagram post-grouping
The headings are products from using the affinity diagram and below them are the notes that
were gained from analysing the interviews illustrated in bullet lists followed with an
24
elaborated motivation. These headings are later used and referred to as needs found from the
interviews.
5.4.1. Roles
• Administrator
• Core team members
• Restrictions among roles
• Core team members can write requests for resources
• Log who made the last changes
• Teams can be shown as a resource
Something every interviewee agreed should exist in a PPM tool is roles, there needs to be at
least two basic roles in a resource management tool and these two are project leader and
resource manager. The key concepts can be found from analysing the core of the resource
management systems that are used at the two companies that has been interviewed and
analysed. Firstly, the projects should be able to borrow or hire resources from a resource
manager, which creates a need of a project manager or project owner, sometimes this is the
responsibility of the project leader. Secondly, a resource manager who should be able to lend
out the resources to projects and should be efficiently having every resource in work. Having
three roles instead of two, namely adding an administrator would mean removing a lot of
weight from the resource managers and the project leaders.
5.4.2. Projectsattributesanddetails
• Comparison of projects
• Project priorities
• Project timeline
• Project details
• Different project phases
• Project statuses – started, not started, ongoing, finished
The projects should be able to give fast answers to detailed questions so that quick check-ups
can be made on exact numbers. This should also include being able to change numbers if
needed.
25
In theory there could be an unlimited number of attributes in a project, therefore you need to
be able to find those that matter fast and easy. The reason for using a PPM tool in the first
place should be to increase efficiency and save time, which you will not do if you have to
search for a needle in a haystack.
5.4.3. Planning
• Plan resources ahead
• Plan resources a year ahead
• Resource statuses – vacancy, sickness, parental leave
Many of the interviews have indicated on a need for planning of both projects and resources.
Planning ahead is a must to know how much resources a company needs and to know that
every resource will be put to work.
5.4.4. Overview
• Dashboard with overview
• Graphs and diagrams
• Separate documents for projects leaders and resources managers
• Same PPM tool for whole organization
• Filter resources in projects
An overview should be accessible for the managers for monthly check ups, report generation
and for meetings where overall data is viewed so that you can easily view the most relevant
topics for discussion. To save time a quick overview of the projects and the resources should
be made available in form of info graphs. An overview is also necessary in order to compare
data.
5.4.5. Outsidethetoolcommunicationspreferred
• Physical discussions emphasized
• Monthly meetings about how projects are going
• Monthly meetings about how well the resources are performing
26
• International use
• Cost centre and project communicates
The interviewees have shown persistent interest in having physical meet ups between resource
managers and project leaders. Reasons have been that they want a connection between the
workers so that employees can get to know each other. This is especially good for improving
the relations between employees. This does, however, only work when project leaders and
resource managers are on the same location, if the two needs to communicate over a longer
distance phone or email has been the most common mediation tool. This could be included in
the tool, for example by a messaging feature, but the tool should also be limited so that the
physical meet ups are still preferred by the project leader and the resource manager.
Communications between resource managers and project leaders are occurring physically in
the present. In the most basic point of view a project sends a request for a person, with
information such as what competence they want and when they need it, this should not take
much time to do which it will if the project leaders have to walk away and talk to the resource
manager.
5.4.6. History
• Follow up on budgets and results for projects
• Follow up on how good resources perform
• Cost of projects
• Future estimations based on historical data
Even though this was lacking in one of the companies, both showed interest in having a
follow up on the projects in terms of feedback on the planned data. There should be indicators
of how well the recent month has been taking place. An important aspect of human nature is
to be able to learn from one’s mistakes. If no feedback is given from historical aspects then
there is no room for improvement, the project leaders cannot either give feedback to their
team members on how well they have worked or if they need to step up a notch.
5.4.7. EasytousewithSAPssystem
• Actuals from SAP
• Report new projects to SAP
27
• Extract report from the tool
Many organizations use SAP which is a system to manage financials. Projects can report their
expenses and employees are expected to report their hours of work. It seems as commonplace
to extract and analyse the financials from SAP every month. The resource management tool
could have an input which could give feedback to both resources and projects on the results
from the last month. This thesis is, however, limited from going into the aspect of handling
third-party software and will therefore not go further into the financial scope.
5.4.8. Efficientalgorithms
• Much data to process
• Redundant processes need elimination
In a system that uses many resources and has many projects there are bound to be much data.
There should be a plan on how to work with bigger datasets if companies want to expand or
use the resource tool in more places with more projects without risking crashing your
computer because of the amount of data requested.
5.4.9. Confirmationsandrequestsarenecessary
• Confirm allocations of resources for a project
• Requests competences and resources
• Notifications if projects don’t get all resources they want
There needs to be a clear confirmation that resources have been handed out to projects. The
same applies the other way around, the projects should be able to make requests on what
competence they want and when. There have been discussions if projects should be able to
choose which individual they want instead of competence. People forget what they said when
they talked to each other, which is why there needs to be a confirmation and a request
somewhere in the tool.
28
5.5. IdeationThe prototype ideation phase started off by creating paper sketches. From discussing different
aspect of these sketches we came to the conclusion of the final product. After a couple of
iterations, the fidelity was improved upon and after the paper sketches a tool called
Moqups.com (2017) was used to continue the sketches digitally. Photoshop was lastly used in
the sketching phase to create prototypes of the tool as close as they could be to a real tool
without using code.
5.5.1. Firstiteration
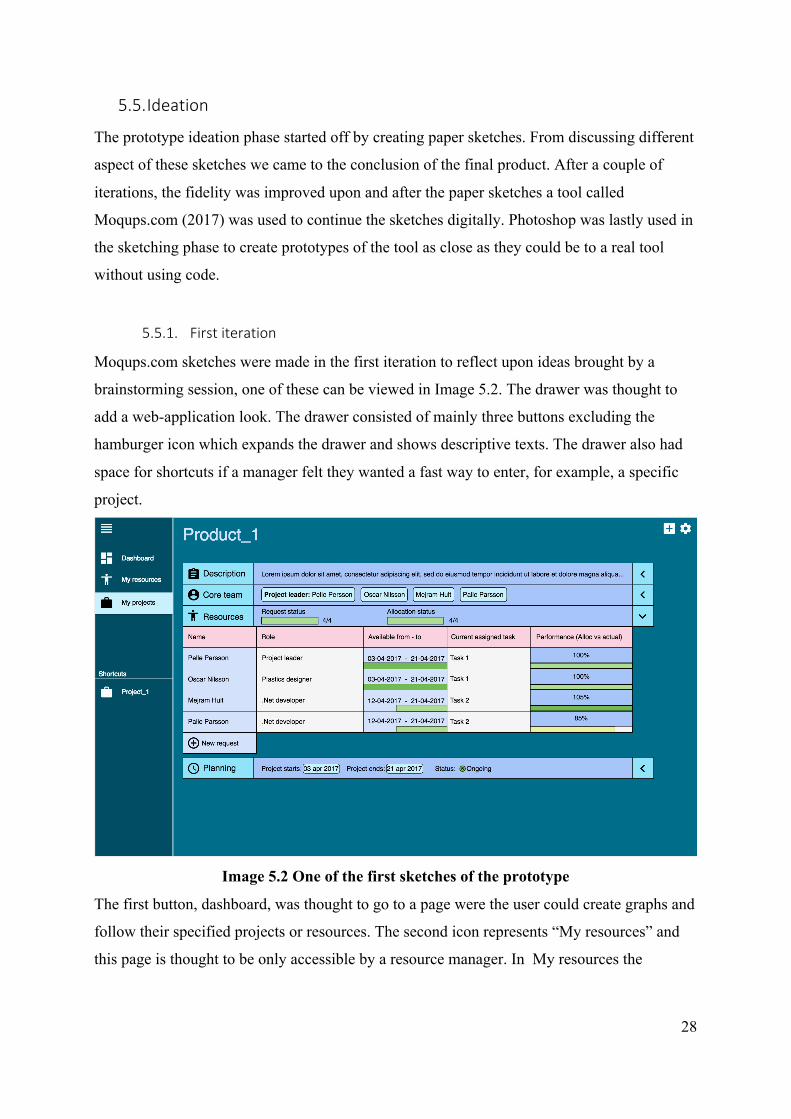
Moqups.com sketches were made in the first iteration to reflect upon ideas brought by a
brainstorming session, one of these can be viewed in Image 5.2. The drawer was thought to
add a web-application look. The drawer consisted of mainly three buttons excluding the
hamburger icon which expands the drawer and shows descriptive texts. The drawer also had
space for shortcuts if a manager felt they wanted a fast way to enter, for example, a specific
project.
Image 5.2 One of the first sketches of the prototype
The first button, dashboard, was thought to go to a page were the user could create graphs and
follow their specified projects or resources. The second icon represents “My resources” and
this page is thought to be only accessible by a resource manager. In My resources the
29
resource manager was first thought to handle all personnel matters such as allocating a
resource on to a project or editing resources among other things.
The last icon represents projects, accessible only to project leaders. This tab was intended to
let project managers edit their projects in terms of dates, descriptions, and titles. This is also
where they went to request and manage resources for the project.
5.5.2. Guidelinesgainedfromtheiterationprocess
The images 5.3 and 5.4 represents the different screens and scenarios that a project leader can
come across in the prototype. The images 5.5 and 5.6 are the two different screens that the
resource manager can come across.
The iteration process brought a number of basic functionalities. These was important in order
to perform basic actions, required by a resource management tool. The most general
functionalities are as follows:
v Roles, header 5.4.1, are a fundamental part of a resource management tool, the roles
that are implemented in this tool are project leader and resource manager.
v Visual illustrations of data allow fast and efficient data management, a product of
header 5.4.2, 5.4.4 and 5.4.6. Visual illustration such as charts make it possible to plan
ahead more efficiently as well, which is demanded by heading 5.4.3.
v Header 5.4.5 shows that there is a need to be able to handle much of the
communication in a physical manner to boost other aspects of a company such as
social interactions between workers, this is thought to be advocated in the design
v Header 5.4.8 has a smaller focus because of the scope being design of the tool and not
the study of efficient algorithms. However, the design is thought to boost the
efficiency of the tool and might need complex solutions in terms of algorithms.
v Header 5.4.9 is implemented in the visual feedback in the design in terms of the charts
and smart illustrations in design choices.
5.5.2.1. Projectleadertools
In the iteration process of creating project leader functionality for the tool, the following
needs were found and are based on the interviews and inquiries from the earlier stages of the
research:
30
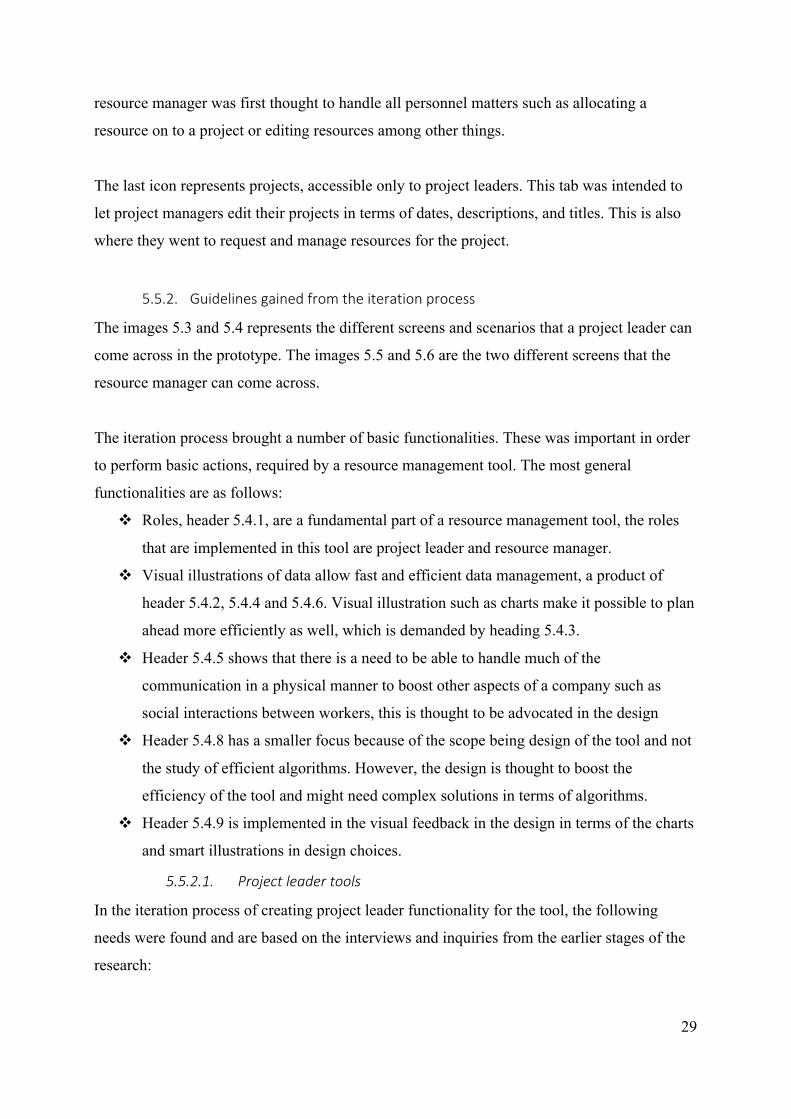
v An overview is necessary for the project leaders to quickly see were management is
needed, derived from heading 5.4.4 and 5.4.2. This is also of great need if the projects
are to be compared in any way (heading 5.4.6).
v Basic functions such as removing and adding resources to the project are trivial
necessities, which also corresponds to heading 5.4.3 and heading 5.4.9.
v Editing project attributes such as start- and end-date, description, title heading 5.4.3.
Image 5.3 The projects overview page
The project overview page, which is only accessible as the role of project leader, is illustrated
in image 5.3. The found interaction design patterns that fit their purpose was the following:
Ø A small dashboard with the contents shown in a chart and in the moment of writing
the two most critical data to be viewed are resources and request. The chart should
contain viewable data of the known differences and in this case the differences will be
in how many resources or requests there are in relation to time.
Ø There should be an easy way of selecting a project of the purpose to edit its details.
The solution was found to be a scrollable list view, listing all the projects available for
the project leader.
Ø The drawer has no other purpose than creating the feeling of a web application. It is
however made with a colour coded section pattern in mind.
31
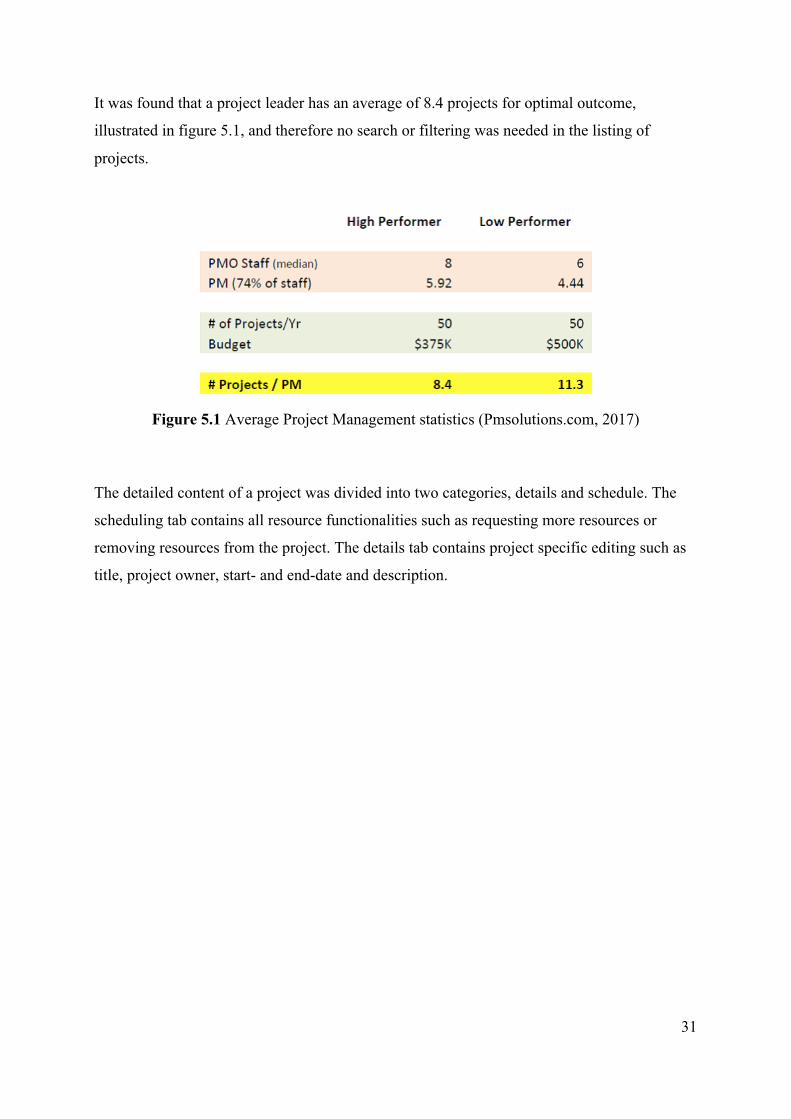
It was found that a project leader has an average of 8.4 projects for optimal outcome,
illustrated in figure 5.1, and therefore no search or filtering was needed in the listing of
projects.
Figure 5.1 Average Project Management statistics (Pmsolutions.com, 2017)
The detailed content of a project was divided into two categories, details and schedule. The
scheduling tab contains all resource functionalities such as requesting more resources or
removing resources from the project. The details tab contains project specific editing such as
title, project owner, start- and end-date and description.
32
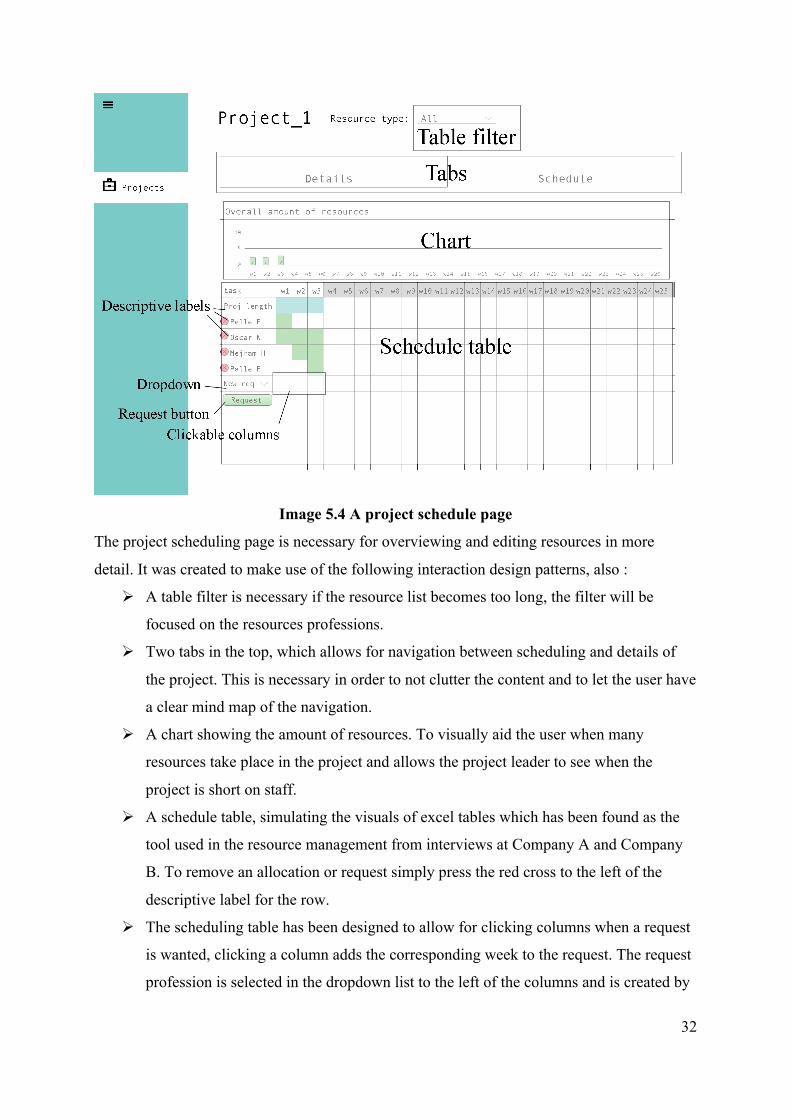
Image 5.4 A project schedule page
The project scheduling page is necessary for overviewing and editing resources in more
detail. It was created to make use of the following interaction design patterns, also :
Ø A table filter is necessary if the resource list becomes too long, the filter will be
focused on the resources professions.
Ø Two tabs in the top, which allows for navigation between scheduling and details of
the project. This is necessary in order to not clutter the content and to let the user have
a clear mind map of the navigation.
Ø A chart showing the amount of resources. To visually aid the user when many
resources take place in the project and allows the project leader to see when the
project is short on staff.
Ø A schedule table, simulating the visuals of excel tables which has been found as the
tool used in the resource management from interviews at Company A and Company
B. To remove an allocation or request simply press the red cross to the left of the
descriptive label for the row.
Ø The scheduling table has been designed to allow for clicking columns when a request
is wanted, clicking a column adds the corresponding week to the request. The request
profession is selected in the dropdown list to the left of the columns and is created by
33
clicking the request button. This is thought to follow with a modal box where the user
is prompted to select a workload for the request as well.
5.5.2.2. Resourcemanagertools
The iteration process found the basic functionality for a resource manager as follows:
v Overview of the resources is a necessity for being able to assess them to projects,
argued by heading 5.4.4 and 5.4.3.
v Heading 5.4.2 tells us that attributes in projects should be easy to view, however it is
argued that the resource manager is of equal need to view resource attributes.
v Trivial functions such as deciding when a resource can be allocated as well as how
much workload the resource can be assessed together with the allocation.
v The resource should also be editable in terms of name, profession, max workload and
the allocations that has been put on them.
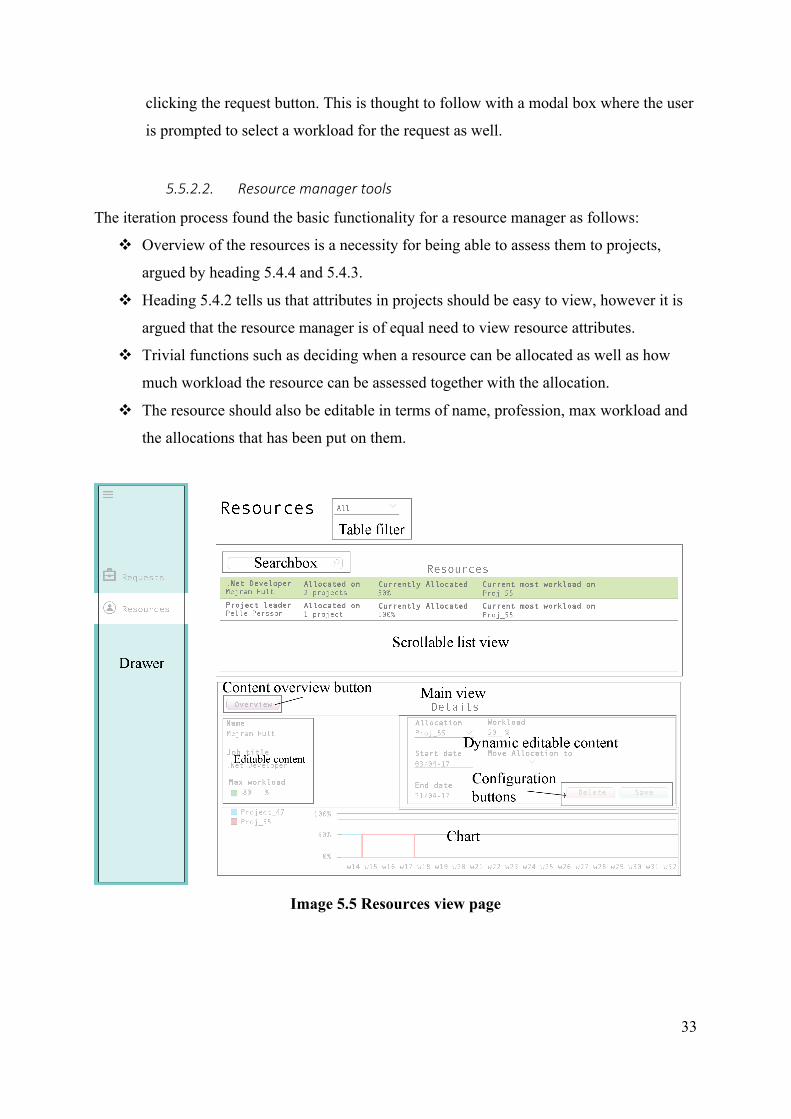
Image 5.5 Resources view page
34
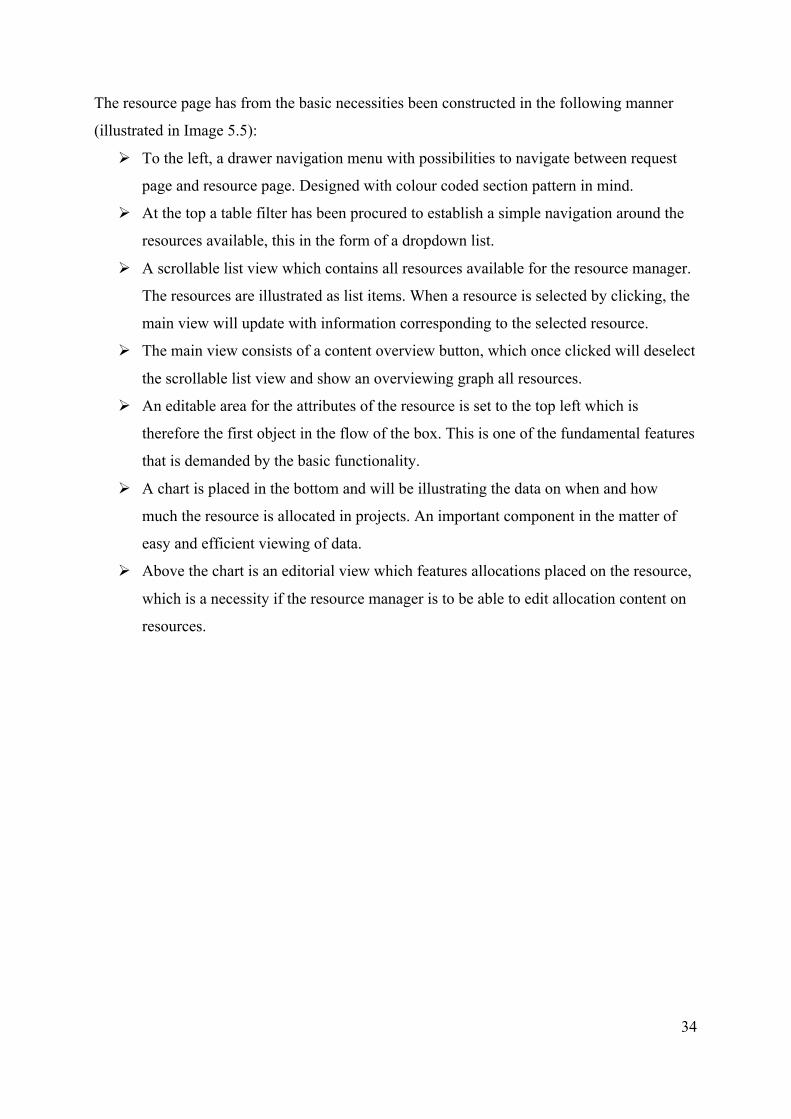
The resource page has from the basic necessities been constructed in the following manner
(illustrated in Image 5.5):
Ø To the left, a drawer navigation menu with possibilities to navigate between request
page and resource page. Designed with colour coded section pattern in mind.
Ø At the top a table filter has been procured to establish a simple navigation around the
resources available, this in the form of a dropdown list.
Ø A scrollable list view which contains all resources available for the resource manager.
The resources are illustrated as list items. When a resource is selected by clicking, the
main view will update with information corresponding to the selected resource.
Ø The main view consists of a content overview button, which once clicked will deselect
the scrollable list view and show an overviewing graph all resources.
Ø An editable area for the attributes of the resource is set to the top left which is
therefore the first object in the flow of the box. This is one of the fundamental features
that is demanded by the basic functionality.
Ø A chart is placed in the bottom and will be illustrating the data on when and how
much the resource is allocated in projects. An important component in the matter of
easy and efficient viewing of data.
Ø Above the chart is an editorial view which features allocations placed on the resource,
which is a necessity if the resource manager is to be able to edit allocation content on
resources.
35
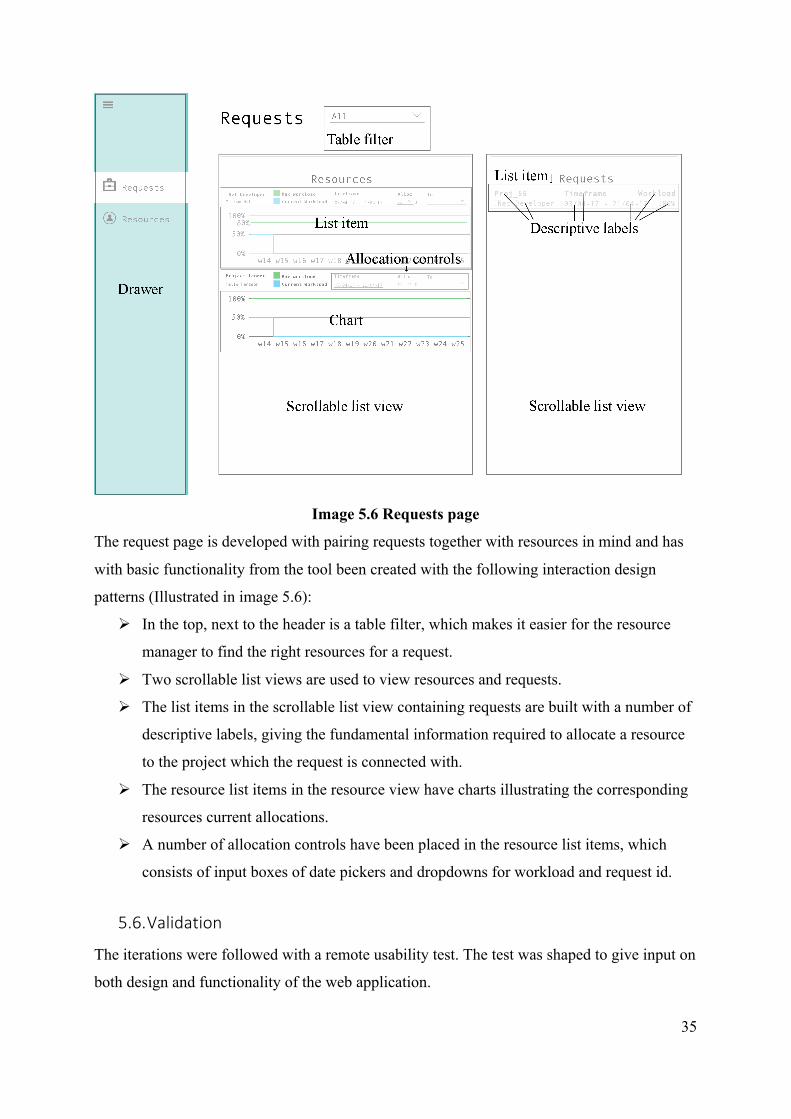
Image 5.6 Requests page
The request page is developed with pairing requests together with resources in mind and has
with basic functionality from the tool been created with the following interaction design
patterns (Illustrated in image 5.6):
Ø In the top, next to the header is a table filter, which makes it easier for the resource
manager to find the right resources for a request.
Ø Two scrollable list views are used to view resources and requests.
Ø The list items in the scrollable list view containing requests are built with a number of
descriptive labels, giving the fundamental information required to allocate a resource
to the project which the request is connected with.
Ø The resource list items in the resource view have charts illustrating the corresponding
resources current allocations.
Ø A number of allocation controls have been placed in the resource list items, which
consists of input boxes of date pickers and dropdowns for workload and request id.
5.6. Validation
The iterations were followed with a remote usability test. The test was shaped to give input on
both design and functionality of the web application.
36
The tests were conducted using a remote desktop software which allowed the tester to see
how the application was developing and to introduce new function and design to the testers,
which were also two of the supervisors. The testers then gave feedback on what they thought
should be improved and how they thought the application design was feeling.
This allowed for discussions where, in some cases new functionalities would be found, which
could be implemented in the next iteration. There were also problems found such as bugs and
inconsistencies which could have easily been missed.
37
6. WebapplicationprototypeThe resulting application deployed to the web found new functions that save a number of
clicks for the users. The application was built with ASP.NET Core version 1.1 which is a light
weight cross platform development framework. An MVC structure was followed and together
with AJAX and JQuery the features were completed. A database deployed on Azure was used
and the web application was also deployed on Azure. The design was made in CSS together
with pre-designed styles from the popular Bootstrap style sheets.
The web application was built with the roles of project leader and resource manager in mind
and for ease of development all pages were accessible in the drawer to the left.
The application was built with the prototypes from the iteration process in mind, but in some
places new and better functionality has been found and will be explained as well as argued for
in this chapter.
6.1. Projectleaderfunctionality
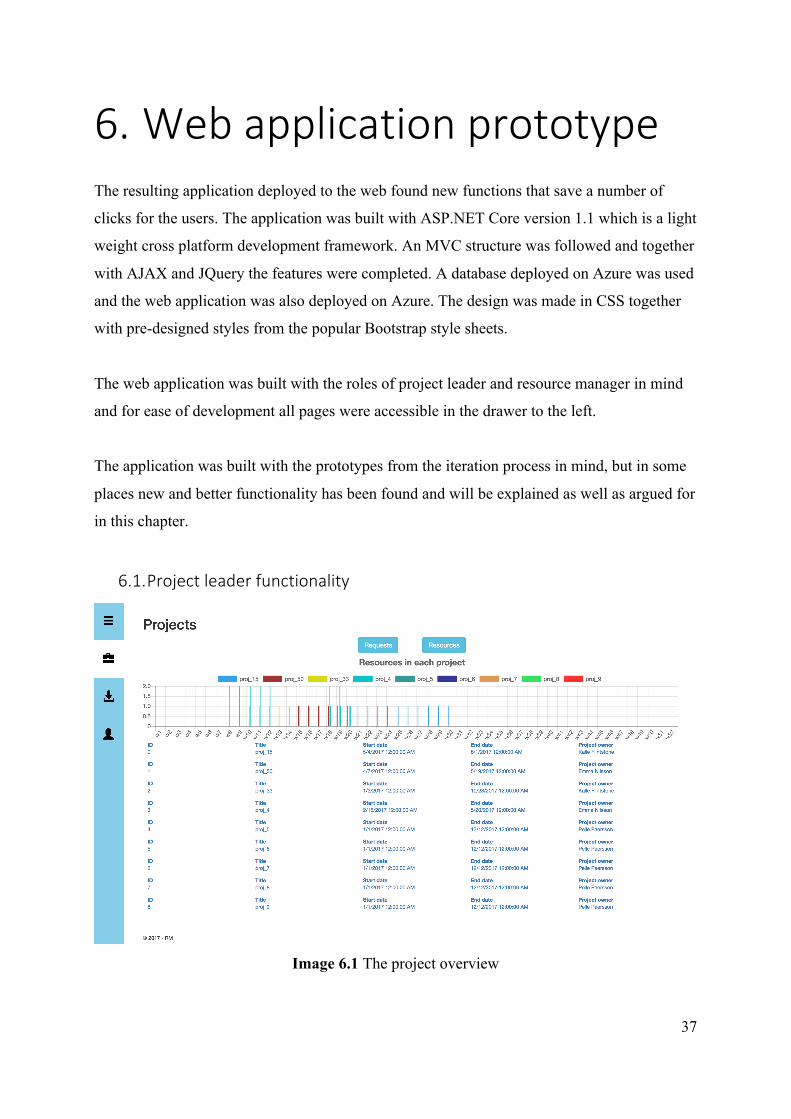
Image 6.1 The project overview
38
As seen in Image 6.1 the projects are listed under a chart with overview on the resources of
the projects. Two buttons are accessible above the chart where the user can switch between
requests and resources for easy comparison. The chart also features filtering projects by
clicking them in the labels positioned above it.
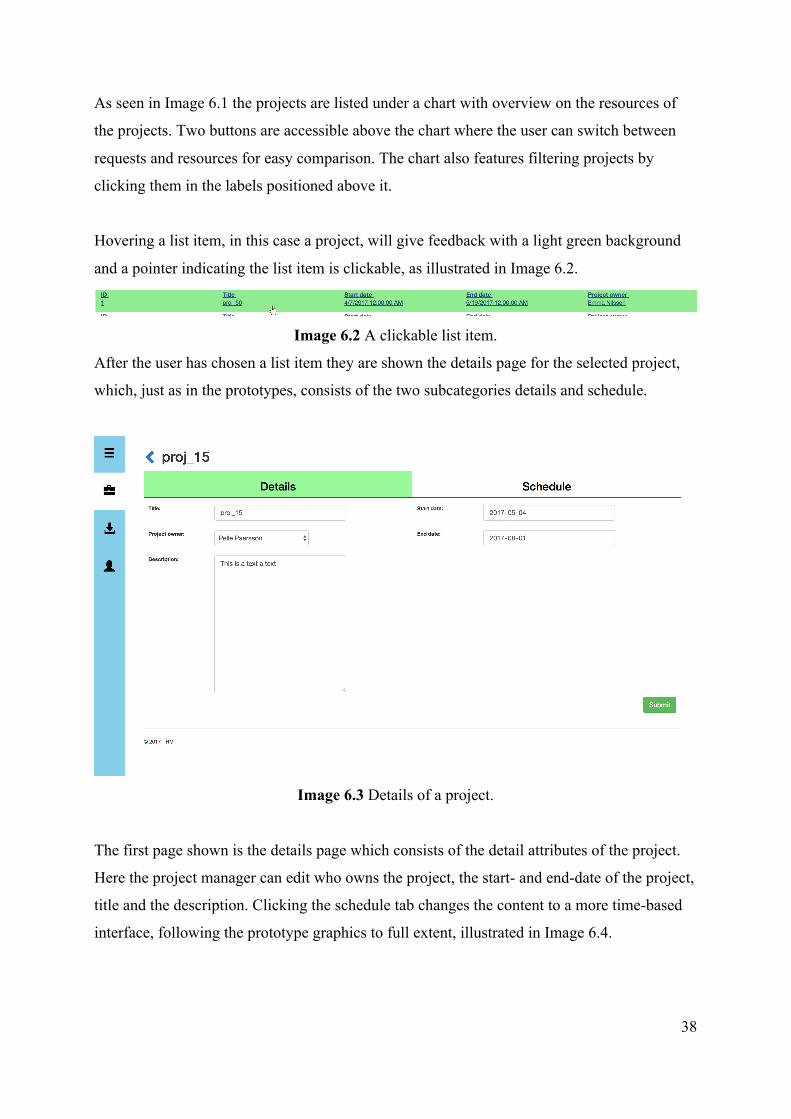
Hovering a list item, in this case a project, will give feedback with a light green background
and a pointer indicating the list item is clickable, as illustrated in Image 6.2.
Image 6.2 A clickable list item.
After the user has chosen a list item they are shown the details page for the selected project,
which, just as in the prototypes, consists of the two subcategories details and schedule.
Image 6.3 Details of a project.
The first page shown is the details page which consists of the detail attributes of the project.
Here the project manager can edit who owns the project, the start- and end-date of the project,
title and the description. Clicking the schedule tab changes the content to a more time-based
interface, following the prototype graphics to full extent, illustrated in Image 6.4.
39
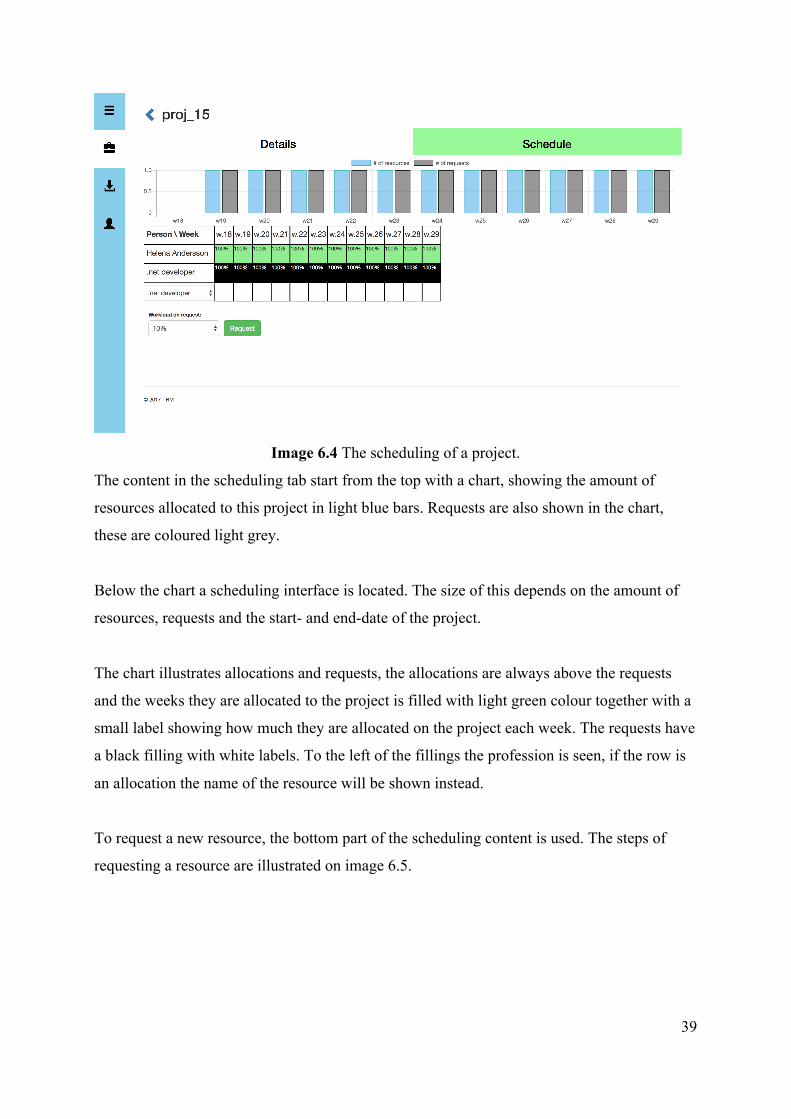
Image 6.4 The scheduling of a project.
The content in the scheduling tab start from the top with a chart, showing the amount of
resources allocated to this project in light blue bars. Requests are also shown in the chart,
these are coloured light grey.
Below the chart a scheduling interface is located. The size of this depends on the amount of
resources, requests and the start- and end-date of the project.
The chart illustrates allocations and requests, the allocations are always above the requests
and the weeks they are allocated to the project is filled with light green colour together with a
small label showing how much they are allocated on the project each week. The requests have
a black filling with white labels. To the left of the fillings the profession is seen, if the row is
an allocation the name of the resource will be shown instead.
To request a new resource, the bottom part of the scheduling content is used. The steps of
requesting a resource are illustrated on image 6.5.
40
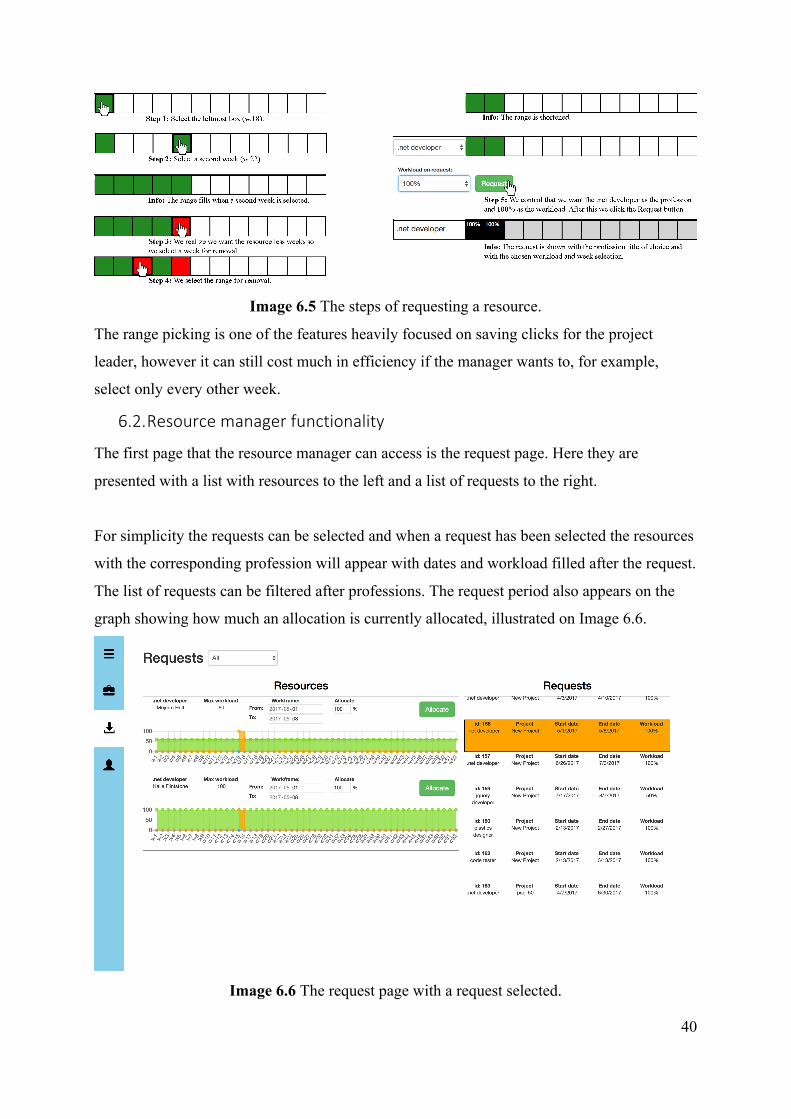
Image 6.5 The steps of requesting a resource.
The range picking is one of the features heavily focused on saving clicks for the project
leader, however it can still cost much in efficiency if the manager wants to, for example,
select only every other week.
6.2. Resourcemanagerfunctionality
The first page that the resource manager can access is the request page. Here they are
presented with a list with resources to the left and a list of requests to the right.
For simplicity the requests can be selected and when a request has been selected the resources
with the corresponding profession will appear with dates and workload filled after the request.
The list of requests can be filtered after professions. The request period also appears on the
graph showing how much an allocation is currently allocated, illustrated on Image 6.6.
Image 6.6 The request page with a request selected.
41
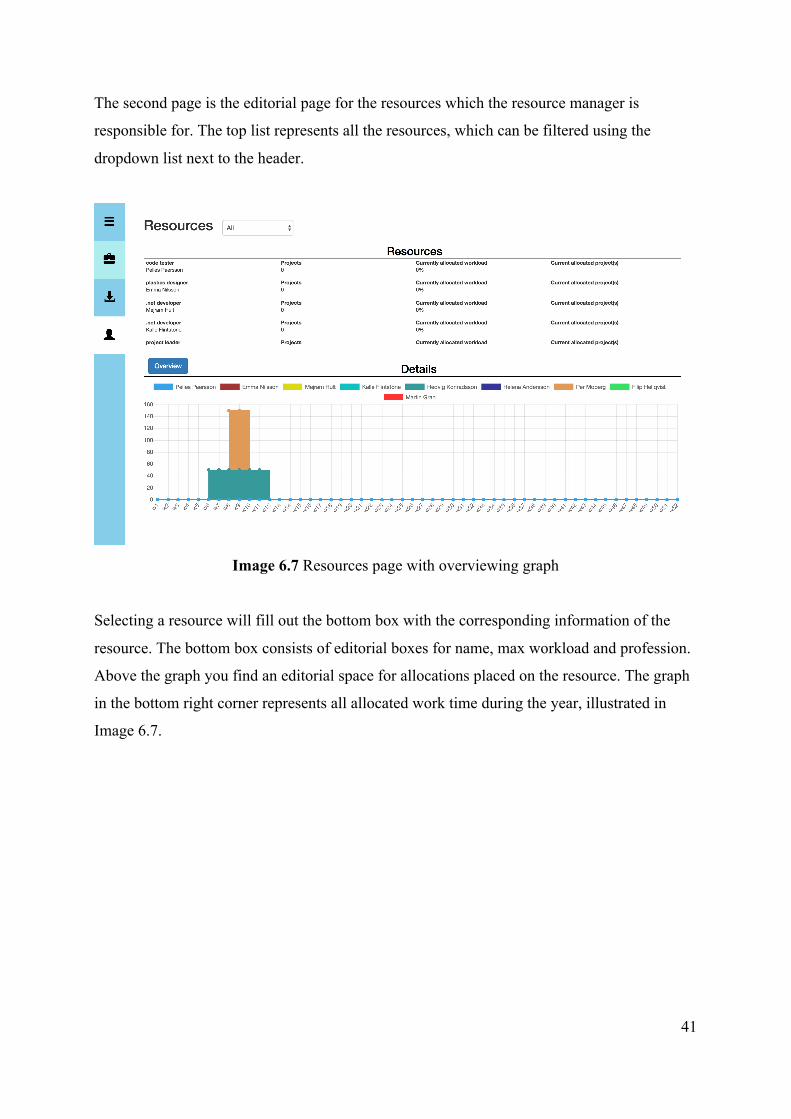
The second page is the editorial page for the resources which the resource manager is
responsible for. The top list represents all the resources, which can be filtered using the
dropdown list next to the header.
Image 6.7 Resources page with overviewing graph
Selecting a resource will fill out the bottom box with the corresponding information of the
resource. The bottom box consists of editorial boxes for name, max workload and profession.
Above the graph you find an editorial space for allocations placed on the resource. The graph
in the bottom right corner represents all allocated work time during the year, illustrated in
Image 6.7.
42
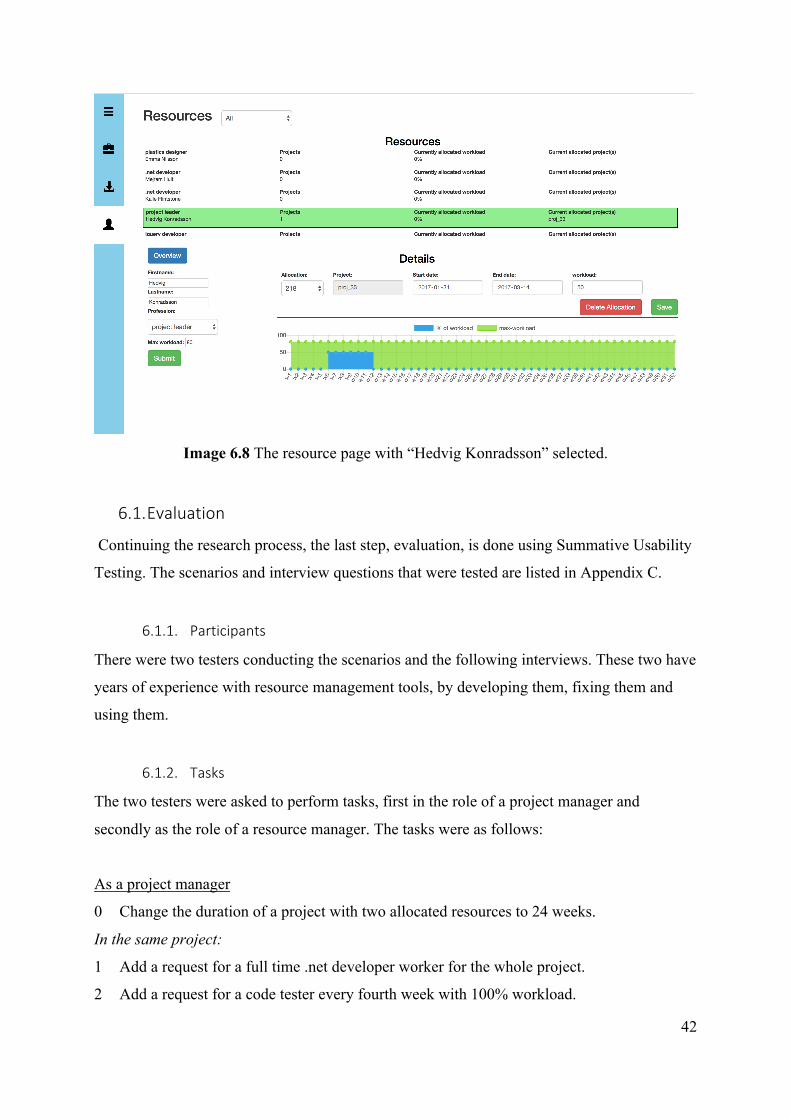
Image 6.8 The resource page with “Hedvig Konradsson” selected.
6.1. Evaluation Continuing the research process, the last step, evaluation, is done using Summative Usability
Testing. The scenarios and interview questions that were tested are listed in Appendix C.
6.1.1. Participants
There were two testers conducting the scenarios and the following interviews. These two have
years of experience with resource management tools, by developing them, fixing them and
using them.
6.1.2. Tasks
The two testers were asked to perform tasks, first in the role of a project manager and
secondly as the role of a resource manager. The tasks were as follows:
As a project manager
0 Change the duration of a project with two allocated resources to 24 weeks.
In the same project:
1 Add a request for a full time .net developer worker for the whole project.
2 Add a request for a code tester every fourth week with 100% workload.
43
In another project with no requests or resources:
3 Change the title of a project “New project”.
4 Add a request for a management expert with 100% workload for eight weeks.
5 Add a request for a jquery developer with 50% workload for the last three weeks.
6 Remove the request for a management expert.
7 Create a new request for a plastics designer instead with 100% workload and for the first
four weeks.
As a resource manager
0 Change the profession of a project leader to a code tester.
Use the same resource to:
1 Allocate all the code tester requests.
Use a resource who has other allocations to:
2 Allocate the request of a .net developer.
Use a resource without any previous allocations to:
3 Allocate the request of a jquery developer.
4 Allocate the request of a plastics designer.
6.1.3. Measure
The test was measured in two variables, namely the number of clicks combined with key
presses and the amount of time it took from beginning the first task to completing the last.
These variables are later compared between the current PPM tool in Company A and the final
prototype.
6.1.4. Procedure
The first step was to introduce the test to the participant, letting them read through the tasks
they are to do in the prototypes and if they have any questions about any of the tasks this is
the time they can ask them.
When they felt ready a timer was started and the test holder would use an app to measure the
number of clicks and key presses. The tester was allowed to freely move around the web
application and perform the tasks through the steps they sought optimal. Meanwhile the test
44
holder only was allowed to observe and not to give any indications on how to use the
application.
After the test an interview was made to evaluate the design of the prototype. This was thought
to be the best approach since time was of an essence and the test on the tool of Company A
would have to be made remotely.
The test for the tool used in Company A was made with the test holder at a remote location
and the testers gave the results when they had finished.
6.1.5. Apparatus
The study was performed on the testers own portable computers, they would go to the website
where the application was held at the time of the test. To count clicks an application was
installed on the test holders phone, creating the ability to click to add a click. The timer used
to see how long the test took was also an application on the phone.
6.1.6. Results
The interview was divided into three parts, overall design, charts and functionality. The
results were summarized as following:
Overall functionality:
✣ General feel was that the tool was efficient, however, it might need some time to get
used to the more advanced features in the tool
✣ It can be hard to connect the weeks in project details to real dates.
✣ The scaling of the app on larger screens was not very satisfactory.
Charts
✣ Both interviewees were satisfied with the locations, information and how easy it was
to understand the charts.
✣ Some charts showed too many weeks and the text became too small following from
the number of weeks.
Functionality
✣ The two most effective functionalities with the tool was the requesting of resources, in
project scheduling, and the allocation of resources from the resource manager’s point
of view.
45
✣ The colour connections throughout the page was very helpful.
✣ The interviewees had differing thoughts on if the tool was useful for a varying project
portfolio, the argument against was mainly you want to be able to request on more
varying basis’s than the week basis which is currently implemented.
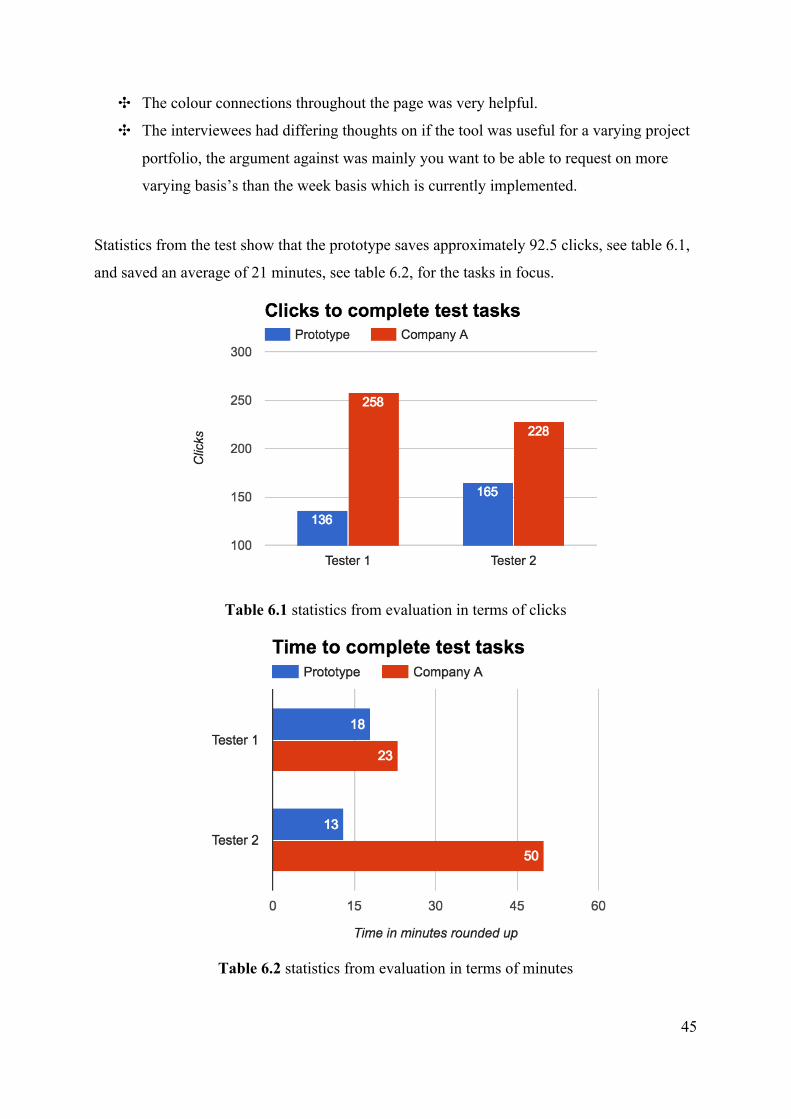
Statistics from the test show that the prototype saves approximately 92.5 clicks, see table 6.1,
and saved an average of 21 minutes, see table 6.2, for the tasks in focus.
Table 6.1 statistics from evaluation in terms of clicks
Table 6.2 statistics from evaluation in terms of minutes
46
6.1.7. Lessonslearned
It is always best to be prepared that the methods might take more time than thought in the
beginning. Always plan to have margins when conducting these evaluations.
Think carefully beforehand what variables are to be tested, even though it might seem like it
is the most obvious choice to test time and some other variable, like in this test clicks. There
are many other variables as well that could be tested or that could impact the test, such as
model of computer or version of web browser.
47
7. ResultHere the results are presented, moulded from the research process in an attempt of answering
the research question.
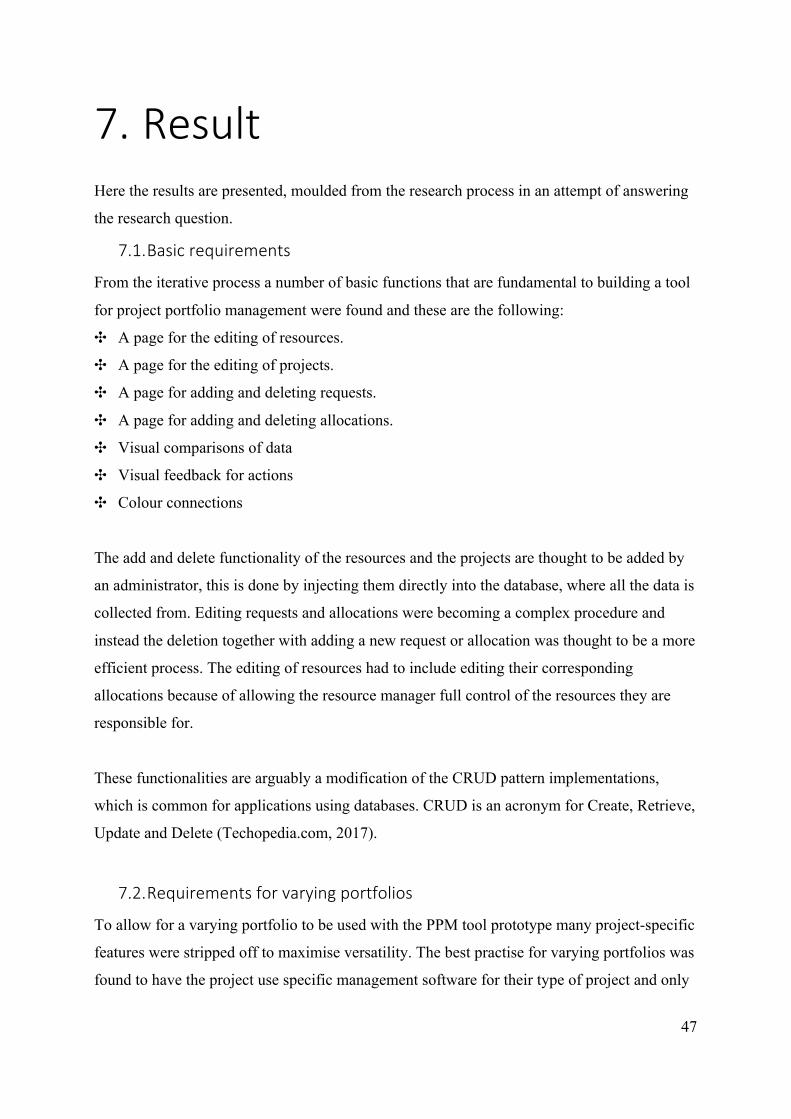
7.1. Basicrequirements
From the iterative process a number of basic functions that are fundamental to building a tool
for project portfolio management were found and these are the following:
✣ A page for the editing of resources.
✣ A page for the editing of projects.
✣ A page for adding and deleting requests.
✣ A page for adding and deleting allocations.
✣ Visual comparisons of data
✣ Visual feedback for actions
✣ Colour connections
The add and delete functionality of the resources and the projects are thought to be added by
an administrator, this is done by injecting them directly into the database, where all the data is
collected from. Editing requests and allocations were becoming a complex procedure and
instead the deletion together with adding a new request or allocation was thought to be a more
efficient process. The editing of resources had to include editing their corresponding
allocations because of allowing the resource manager full control of the resources they are
responsible for.
These functionalities are arguably a modification of the CRUD pattern implementations,
which is common for applications using databases. CRUD is an acronym for Create, Retrieve,
Update and Delete (Techopedia.com, 2017).
7.2. Requirementsforvaryingportfolios
To allow for a varying portfolio to be used with the PPM tool prototype many project-specific
features were stripped off to maximise versatility. The best practise for varying portfolios was
found to have the project use specific management software for their type of project and only
48
use the PPM tool to plan resources without the micromanagement it would create from
allocating resources to tasks within the project.
The evaluation showed that a requirement to handle varying project portfolios should also be
to make data dynamically available as not only weeks but days, months and also years.
7.3. Designrequirements
From the research and iteration processes a number of design requirements were found and
these are the most significant:
✣ Comparison of data should be incorporated visually, such as by charts
✣ Basic functionality should be easily accessed
✣ Visual feedback is necessary for the user to understand functionality
✣ Filter functionality is important when data is visualized in a large scale
Basic functionality in this list refers to the basic requirements under header 7.1.
The design in terms of buttons and input fields are extracted from a Bootstrap library of
styles, which is easy and in many terms pretty. All other design choices where created from
the ground and changed along when new parts of the tool were constructed.
49
8. DiscussionThis chapter aims to discuss different parts of the report.
8.1. InterviewsThe interviews served as a great information gathering method which gave a huge amount of
information. From the data gathered in the interviews one can very well argue for the
efficiency factor at least at the two companies that these were conducted in. It was very
interesting to see the difference in the two companies, they varied a lot in how strict and
defined the structure of roles were.
As far as efficiency goes you could see in the PPM tools used in the companies how
important it was to define the key components of projects and manage different parts of the
companies so that you were entirely sure that everything was going in the right direction. This
is of course only logical to do since it is important for companies to gain as much money as
possible on their assets.
In the period of interviewing the picture of all the basics for the tool started to take form. It
was a firm start on the thesis and a great gathering of data that one could invest a lot of time
on analysing later. One thing that I regret is having another person with me, during the
interviews, someone who could have taken notes. The sound recordings were alright but there
were a lot of data that were missed. I think that if I would have had someone taking notes, I
could have urged them to also look for when the person showed feelings about a topic, for
example by making gestures with their hands or smiling. This would have been great to
evaluate what features the interviewees would have wanted unconsciously. As a one-man
team, however, the sound recording worked great in terms of helping the flow of the
interview. It was also great because of the fact that I could focus on forming follow up
questions.
Initially it was thought that there would be contextual inquiries after or before the interviews,
the problem was only that this tool that I would be observing the use of, is only used about
one or two times a month. On top of the low usage ratio, the time spent on it was found to be
30 minutes to 90 minutes per usage, which was hard to time with the interviewee’s.
50
8.2. Affinitydiagram
The suggested method to evaluate interviews by Beyer, H. and Holtzblatt, K (1999) was to do
an affinity diagram to find out what the interviews actually was focusing around. The affinity
diagram gave a lot of results that could have been interpreted in different ways and a lot of the
notes that gave the headers their names could have been put into other groups. What made
these groups might be influenced from reading about resource management and finding out a
lot of information before processing the notes.
It is interesting to see how much the prototype has changed from the initial drawing, it also
makes you question what the prototype would have looked like if we were to do the
prototyping during a much longer phase. The most significant change was probably in
iteration three when we went from using Moqups.com to creating the prototype in Photoshop.
The affinity diagram notes came from listening to the interviews and from the experience of
the interviews. This was a part where I had to try and sort out quotes and information from the
interviews and find which where the most relevant and significant to the thesis and the subject
that was to be investigated. Listening to the interviews and finding the key points might have
been one of the most time consuming parts of the thesis, if I would do interviews again I
would probably take notes during and after the interview instead.
8.3. IteratedideationThe most engaging part of the research process must have been the ideation. Designing and
thinking of how the design will support different features of the application is a difficult task
and takes a lot of time. However, the significance and difficulty may be the two things that
make this part so fun. This is also where I could let my creativity free and just try all sorts of
crazy ideas.
Two critical aspects of a project that weren’t talked about in the thesis would arguably have
been the cost and monetization. However, since the scope of the project excluded economy
there was no data in the database that could have shown the aspect of the project economy
and therefore this was hard to illustrate in the chart in the project overview page.
51
An alternative approach for the listing of projects in the overview for project leaders in Image
5.3 would have been the use of cards, however, this would from my point of view only have
been favourable if the projects were allowed to have a representing imagery.
The drawer came with some interesting ideas, the first thought was to allow the project leader
to add shortcuts to his or her projects, however, this was found to be unnecessary since the list
is always only one click away and it is arguably a cleaner approach to remove clutter from
having too many shortcuts in the drawer menu.
In the last iteration of the tool all the borders creating different boxes were removed to create
a cleaner look thus making the design have less clutter and is much more easy on the eye.
This was thought to improve the time spent for the user to find the information he was
looking for, it also created a lot of space which creates a fresh feeling.
8.4. FinalprototypeThe final prototype was a difficult part of the thesis, mostly because of the lack of experience
I had beforehand of ASP.NET but also because ASP.NET development was not very
supported in OSX at the time of development. This led to the solution of doing the prototype
on a virtual computer on a server which the supervisors at Montell & Partners helped me set
up and let me use.
The development of the final prototype was not just a coding part of the thesis, it was actually
also an iteration on the prototype sketches that were made to support this development. Many
new features were found in this process as well. The most significant features regarding
making the tool efficient were found in this process, one of them is the request part in the
projects tab.
In the process of this prototype other languages had to be consulted for helping with some of
the functions in the tool. One of these were Javascript, which is a language that can be used
for dynamically changing the page after it has been loaded. A library that was used together
with Javascript was ChartJS which is used to create all the charts in the application. ChartJS
was not the first library tested in the process of finding a way to create graphical and dynamic
52
charts. However, it was the first and only one that was lightweight and easy to implement
without much pre-knowledge.
The request page where the resource manager is pairing resources with requests was a part of
the tool which required much thought. It was first thought that some drag and drop function
would be the easiest way of use, however, this requires some experience and additional
libraries, therefore the functionality of clicking the request and then clicking the resource was
thought of. Instead of only having to use one click for the drag and drop, two clicks for this
functionality feels like it is a decent alternative.
The results from testing the prototype showed that the prototype would do great in terms of
efficiency against the tool used in Company A. It is however important to have in mind that
the test was formed for the prototype in this thesis and not for the tasks that you can perform
in the tool at Company A, which might have impacted the times and clicks somewhat. The
test scenarios where although made with basic functionalities that I think should be possible
to do in any PPM tool. One could of course argue that since I was the one that built the
prototype and sat with nothing but the prototype for almost a month, I could be a little biased
when creating the scenarios.
8.5. ResultsOne thing to consider with the results is that they are only backed up by two testers and this is
certainly not optimal for finding the best feedback from the evaluation. However, since we
only had two testers we also did interviews in the end of the tests instead of questionnaires
and this was thought to improve the response and gain qualitative insight of the prototype test
instead of a quantitative. The two testers also have years of experience with resource
management tools which gives a good ground for the results, even if the testers only were
two.
The results show the parts of the tool which were seen as most significant both in terms of
fundamentality and in terms of efficiency. These are thought to be needed in terms of creating
a PPM tool were the efficiency is in focus. I think that the charts are one of the major impacts
helping the tool in being efficient and fresh, however, the charts can be hard to read if there
are too much information in them. This is also commented by one testers. The argument for
53
having much information in some of the charts is though that in the cases where there is 52
weeks crammed in on a small chart, the general thought is to be able to see patterns and that
they might not be fully allocated even though it can be hard to see when the allocations start
and stop.
The basic requirements are thought of as a basic structure which can be built upon in many
different ways, the thought is that these can be used when planning on what the fundamentals
are when creating a tool for PPM. The final prototype in this thesis is one of the approaches
based on the basic structure.
8.6. FutureworkThe tool could be improved in many ways depending on what seems necessary at the
workplace, however, the most appealing first step would probably be to add a messaging
functionality to the tool.
Another future addition to the application would be to have an undo button because if
something was changed into something undesirable this would make it very helpful in terms
of undoing the wrong step.
A smaller change to the application would be to look over the charts and make the colour
coding be more synchronized between all the pages. At the time of writing the colours can be
a little differing between components, for example in the project schedule page where the
schedule uses green colours to show that a resource has been allocated while the chart uses a
blue colour for the same thing.
54
9. ConclusionThe interviews gave a very good picture of what was missing in currently used tools and
analysing these combined with iterating on the fundamental design of a PPM tool a new
efficient tool was created. The research always used knowledge gathered from previous steps
and therefore the prototype is a product from all the steps combined.
Efficiency is the main focus in the thesis and from the Summative Usability Testing an
attempt is made to see if the prototype is efficient at all. Because of the tests being positive it
will be presumed that the prototype is in the correct path to efficiency, however, more testing
is needed to conclude how efficient it is.
The monetization of projects and costs for resources would have given an additional input on
the prioritization factor. It is although an entirely different part of PPM and would demand at
least another study to decide what costs and priority attributes should be considered.
For future use of this thesis it would be logical to start the work with usability testing to see
that the results here match the results of the desired product to be prototyped or researched.
55
10. ReferencesArcher, N. and Ghasemzadeh, F. (1999). An integrated framework for project portfolio
selection. International Journal of Project Management, [online] 17(4), pp.207-216.
Available at: http://ac.els-cdn.com/S0263786398000325/1-s2.0-S0263786398000325-
main.pdf?_tid=9134b16c-33d2-11e7-9360-
00000aacb35d&acdnat=1494236693_8cd5a8e2feb38fccda41546603322983 [Accessed 8 May
2017].
Beyer, H. and Holtzblatt, K. (1999). Contextual design. interactions, 6(1), pp.32-42.
Blichfeldt, B. and Eskerod, P. (2008). Project portfolio management – There’s more to it than
what management enacts. International Journal of Project Management, [online] 26(4),
pp.357-365. Available at:
http://www.sciencedirect.com/science/article/pii/S026378630700097X [Accessed 8 May
2017].
Gallup, I. (2017). Well-Being Enhances Benefits of Employee Engagement. [online]
Gallup.com. Available at: http://www.gallup.com/businessjournal/186386/enhances-benefits-
employee-engagement.aspx [Accessed 7 May 2017].
G2 Crowd. (2017). Best Project Portfolio Management (PPM) Software in 2017 | G2 Crowd.
[online] Available at: https://www.g2crowd.com/categories/project-portfolio-management-
ppm [Accessed 2 Mar. 2017].
Helen Sharp. Yvonne Rogers. Jenny Preece. (2007). Interaction Design: Beyond Human-
Computer Interaction; Second Edition. 1st ed. John Wiley & Sons.
LaBrosse, M. (2010). Project-portfolio management. Employment Relations Today, 37(2),
p.75-79.
56
LeanKit. (2017). What is Project Portfolio Management?. [online] Available at:
https://leankit.com/learn/kanban/project-portfolio-management/ [Accessed 7 May 2017].
Levine, H. (2005). Project portfolio management. 1st ed. San Francisco, CA: Jossey-Bass Inc.
Michael Bible & Susan Bivins., (2010). Mastering project portfolio management : a systems
approach to achieving strategic objectives. 1st ed. J. Ross Publishing.
Moqups.com. (2017). Online Mockup, Wireframe & UI Prototyping Tool · Moqups. [online]
Available at: https://moqups.com/ [Accessed 26 May 2017].
Pennypacker, E. (2009). Project Portfolio Management : A View from the Management
Trenches. 1st ed. John Wiley & Sons.
Perry, M. (2011). Business driven project portfolio management. 1st ed. Ft. Lauderdale, Fla.:
J. Ross Pub.
Pmsolutions.com. (2017). Optimal Project Manager Load | PM Solutions. [online] Available
at: http://www.pmsolutions.com/blog/view/optimal-project-manager-load/ [Accessed 25 May
2017].
Prasad Kodukula., (2014). Organizational Project Portfolio Management: A Practitioner's
Guide. 1st ed. J. Ross Publishing.
Products.office.com. (2017). Projektledningsprogram | Microsoft Project. [online] Available
at: https://products.office.com/sv-se/project/project-and-portfolio-management-software
[Accessed 2 Mar. 2017, 7 May 2017].
Staff, I. (2017). Product Line. [online] Investopedia. Available at:
http://www.investopedia.com/terms/p/product-line.asp [Accessed 6 May 2017].
Techopedia.com. (2017). What is Create, Retrieve, Update and Delete (CRUD)? - Definition
from Techopedia. [online] Available at: https://www.techopedia.com/definition/25949/create-
retrieve-update-and-delete-crud [Accessed 25 May 2017].
57
The Interaction Design Foundation. (2017). How to Conduct User Interviews. [online]
Available at: https://www.interaction-design.org/literature/article/how-to-conduct-user-
interviews [Accessed 11 May 2017].
The Official Microsoft ASP.NET Site. (2017). The Official Microsoft ASP.NET Site. [online]
Available at: https://www.asp.net/ [Accessed 3 Mar. 2017].
Usabilitybok.org. (2017). Summative Usability Testing | Usability Body of Knowledge.
[online] Available at: http://www.usabilitybok.org/summative-usability-testing [Accessed 27
Jun. 2017].
Visual Studio. (2017). Visual Studio IDE. [online] Available at:
https://www.visualstudio.com/vs/ [Accessed 3 Mar. 2017].
Vredenburg, K., Mao, J., Smith, P. & Carey, T. 2002, "A survey of user-centered design
practice", ACM, , pp. 471.
Whatishumanresource.com. (2017). Human Resource l Concepts l Topics l Definitions l
Labour Laws. [online] Available at: http://www.whatishumanresource.com/ [Accessed 6 May
2017].
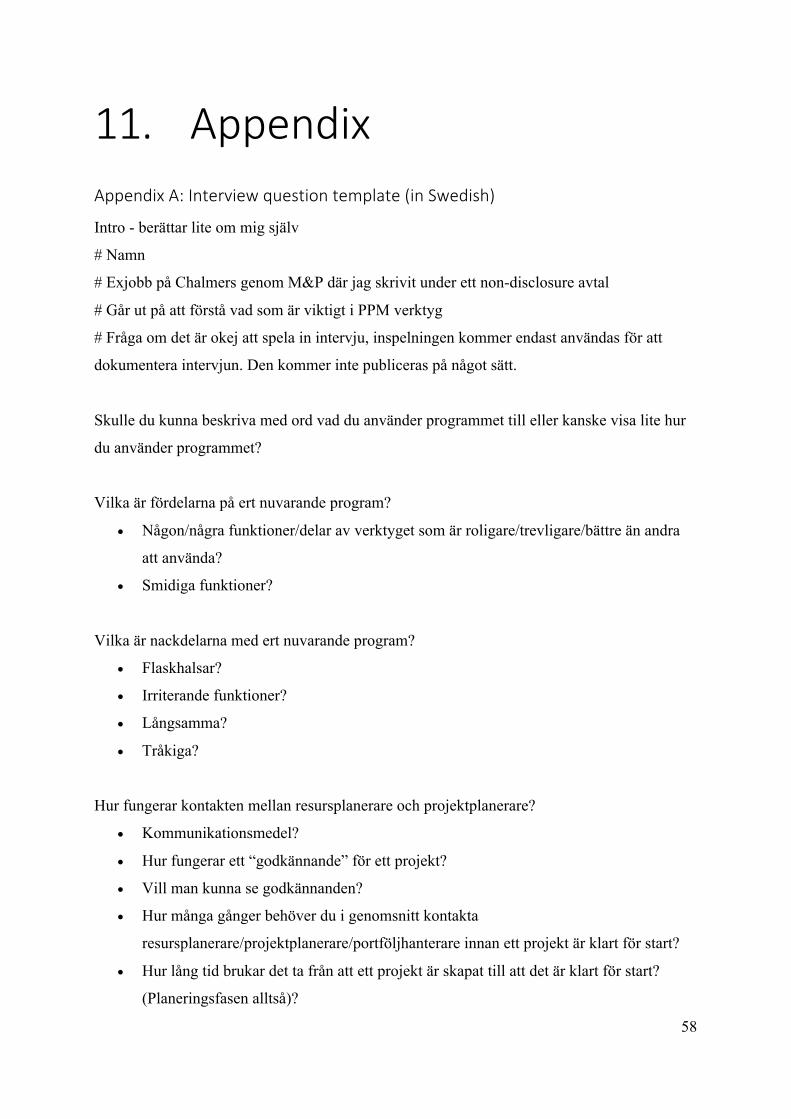
58
11. AppendixAppendixA:Interviewquestiontemplate(inSwedish)
Intro - berättar lite om mig själv
# Namn
# Exjobb på Chalmers genom M&P där jag skrivit under ett non-disclosure avtal
# Går ut på att förstå vad som är viktigt i PPM verktyg
# Fråga om det är okej att spela in intervju, inspelningen kommer endast användas för att
dokumentera intervjun. Den kommer inte publiceras på något sätt.
Skulle du kunna beskriva med ord vad du använder programmet till eller kanske visa lite hur
du använder programmet?
Vilka är fördelarna på ert nuvarande program?
• Någon/några funktioner/delar av verktyget som är roligare/trevligare/bättre än andra
att använda?
• Smidiga funktioner?
Vilka är nackdelarna med ert nuvarande program?
• Flaskhalsar?
• Irriterande funktioner?
• Långsamma?
• Tråkiga?
Hur fungerar kontakten mellan resursplanerare och projektplanerare?
• Kommunikationsmedel?
• Hur fungerar ett “godkännande” för ett projekt?
• Vill man kunna se godkännanden?
• Hur många gånger behöver du i genomsnitt kontakta
resursplanerare/projektplanerare/portföljhanterare innan ett projekt är klart för start?
• Hur lång tid brukar det ta från att ett projekt är skapat till att det är klart för start?
(Planeringsfasen alltså)?
59
Hur går det till när ni skapar/lägger till en ny resurs i verktyget?
• Behöver man göra samma saker varje gång som tar mycket tid?
Hur går det till när ni skapar/lägger till ett nytt projekt i verktyget?
• Behöver man göra samma saker varje gång som tar mycket tid?
Hur många funktioner av de befintliga skulle du uppskatta att du använder under en vanlig
dag?
Används informationen från programmet till portföljhanteraren?
• vad för information summeras uppåt?
Vad tycker du är grundpelarna för ett projekt/resursplaneringsverktyg?
Har du några tankar/idéer på saker som skulle kunna göra att det nuvarande program ni
använder skulle kunna användas snabbare/mindre tid per dag?
Vilken plattform skulle ni föredra? Web, datorprogram, excel etc.
Finns det fördelar med att komma åt programmet genom mobilen?
Hur skulle ditt drömresurshanteringsverktyg se ut?
• Skulle det ha någon speciell design?
• Finns det något PPM verktyg som är mer lockande än det ni använder här?
Finns det någonting du känner att jag har glömt fråga eller som jag kan ta med mig till
kommande intervjuer
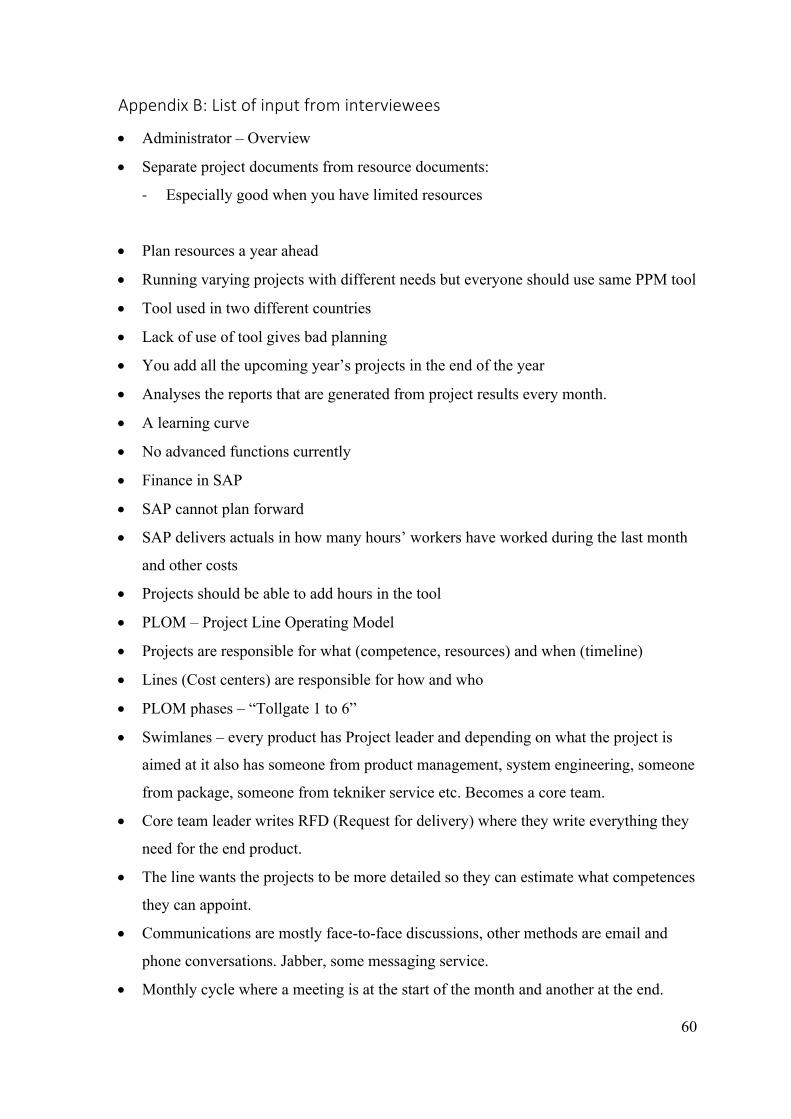
60
AppendixB:Listofinputfrominterviewees• Administrator – Overview
• Separate project documents from resource documents:
- Especially good when you have limited resources
• Plan resources a year ahead
• Running varying projects with different needs but everyone should use same PPM tool
• Tool used in two different countries
• Lack of use of tool gives bad planning
• You add all the upcoming year’s projects in the end of the year
• Analyses the reports that are generated from project results every month.
• A learning curve
• No advanced functions currently
• Finance in SAP
• SAP cannot plan forward
• SAP delivers actuals in how many hours’ workers have worked during the last month
and other costs
• Projects should be able to add hours in the tool
• PLOM – Project Line Operating Model
• Projects are responsible for what (competence, resources) and when (timeline)
• Lines (Cost centers) are responsible for how and who
• PLOM phases – “Tollgate 1 to 6”
• Swimlanes – every product has Project leader and depending on what the project is
aimed at it also has someone from product management, system engineering, someone
from package, someone from tekniker service etc. Becomes a core team.
• Core team leader writes RFD (Request for delivery) where they write everything they
need for the end product.
• The line wants the projects to be more detailed so they can estimate what competences
they can appoint.
• Communications are mostly face-to-face discussions, other methods are email and
phone conversations. Jabber, some messaging service.
• Monthly cycle where a meeting is at the start of the month and another at the end.
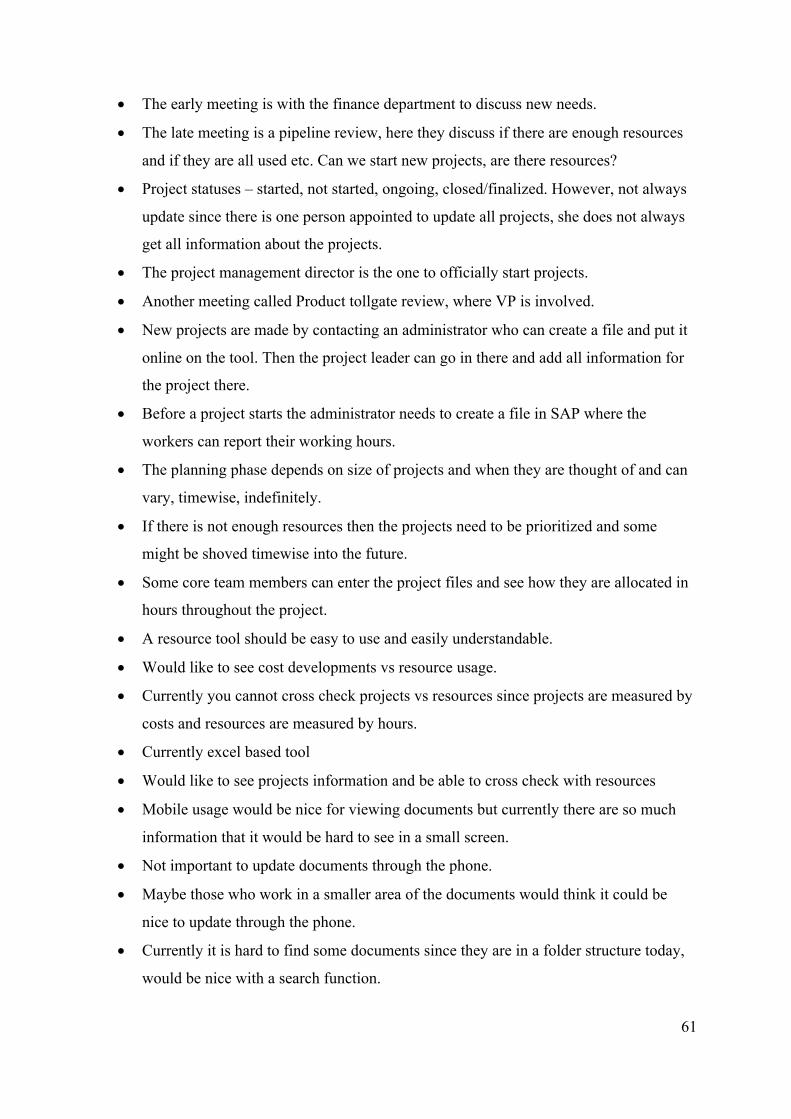
61
• The early meeting is with the finance department to discuss new needs.
• The late meeting is a pipeline review, here they discuss if there are enough resources
and if they are all used etc. Can we start new projects, are there resources?
• Project statuses – started, not started, ongoing, closed/finalized. However, not always
update since there is one person appointed to update all projects, she does not always
get all information about the projects.
• The project management director is the one to officially start projects.
• Another meeting called Product tollgate review, where VP is involved.
• New projects are made by contacting an administrator who can create a file and put it
online on the tool. Then the project leader can go in there and add all information for
the project there.
• Before a project starts the administrator needs to create a file in SAP where the
workers can report their working hours.
• The planning phase depends on size of projects and when they are thought of and can
vary, timewise, indefinitely.
• If there is not enough resources then the projects need to be prioritized and some
might be shoved timewise into the future.
• Some core team members can enter the project files and see how they are allocated in
hours throughout the project.
• A resource tool should be easy to use and easily understandable.
• Would like to see cost developments vs resource usage.
• Currently you cannot cross check projects vs resources since projects are measured by
costs and resources are measured by hours.
• Currently excel based tool
• Would like to see projects information and be able to cross check with resources
• Mobile usage would be nice for viewing documents but currently there are so much
information that it would be hard to see in a small screen.
• Not important to update documents through the phone.
• Maybe those who work in a smaller area of the documents would think it could be
nice to update through the phone.
• Currently it is hard to find some documents since they are in a folder structure today,
would be nice with a search function.
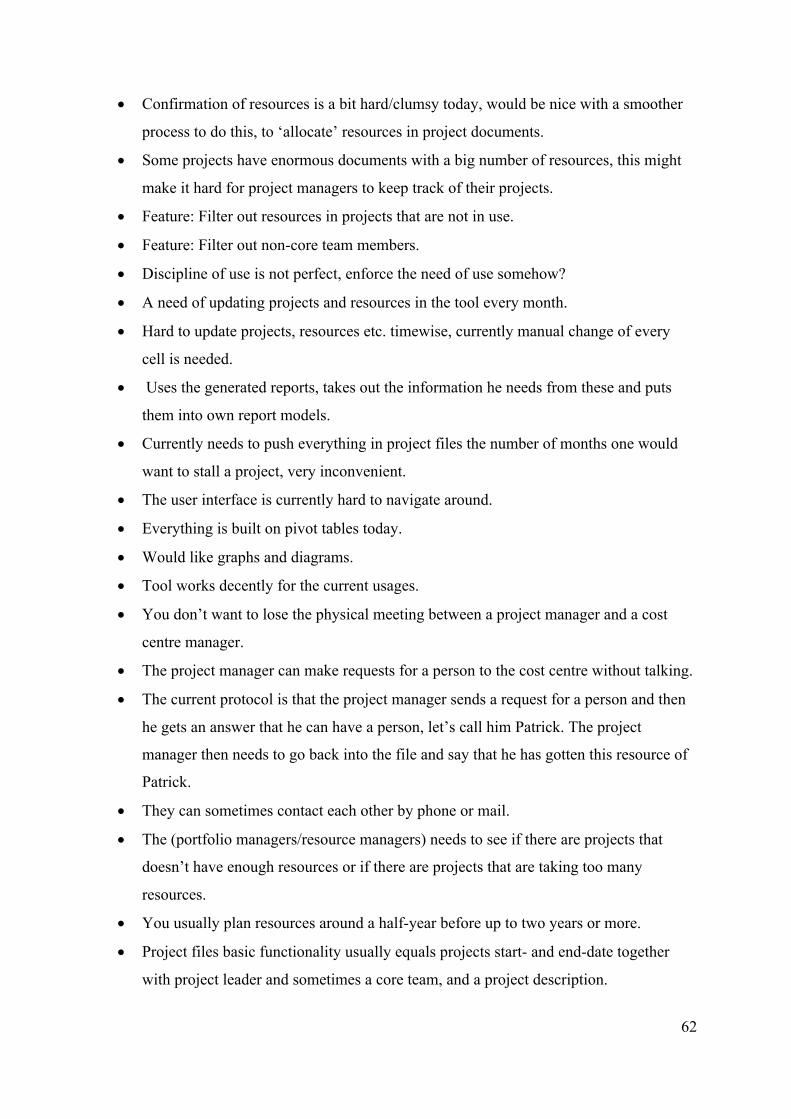
62
• Confirmation of resources is a bit hard/clumsy today, would be nice with a smoother
process to do this, to ‘allocate’ resources in project documents.
• Some projects have enormous documents with a big number of resources, this might
make it hard for project managers to keep track of their projects.
• Feature: Filter out resources in projects that are not in use.
• Feature: Filter out non-core team members.
• Discipline of use is not perfect, enforce the need of use somehow?
• A need of updating projects and resources in the tool every month.
• Hard to update projects, resources etc. timewise, currently manual change of every
cell is needed.
• Uses the generated reports, takes out the information he needs from these and puts
them into own report models.
• Currently needs to push everything in project files the number of months one would
want to stall a project, very inconvenient.
• The user interface is currently hard to navigate around.
• Everything is built on pivot tables today.
• Would like graphs and diagrams.
• Tool works decently for the current usages.
• You don’t want to lose the physical meeting between a project manager and a cost
centre manager.
• The project manager can make requests for a person to the cost centre without talking.
• The current protocol is that the project manager sends a request for a person and then
he gets an answer that he can have a person, let’s call him Patrick. The project
manager then needs to go back into the file and say that he has gotten this resource of
Patrick.
• They can sometimes contact each other by phone or mail.
• The (portfolio managers/resource managers) needs to see if there are projects that
doesn’t have enough resources or if there are projects that are taking too many
resources.
• You usually plan resources around a half-year before up to two years or more.
• Project files basic functionality usually equals projects start- and end-date together
with project leader and sometimes a core team, and a project description.
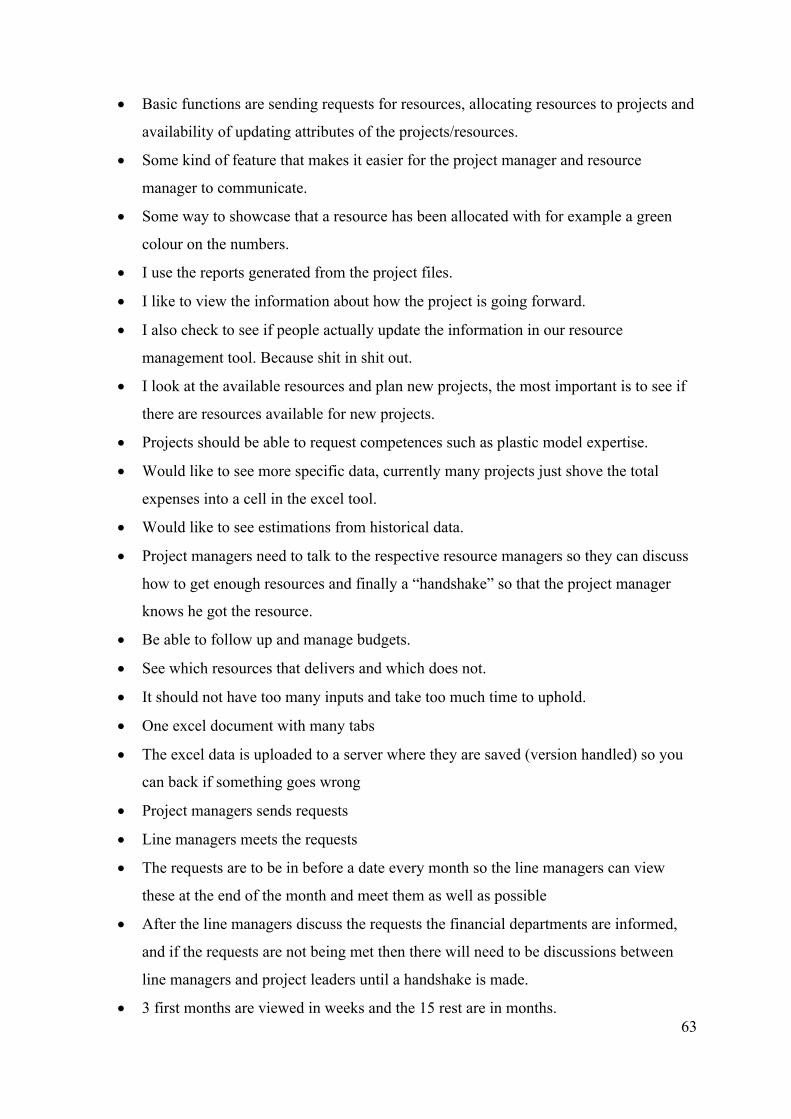
63
• Basic functions are sending requests for resources, allocating resources to projects and
availability of updating attributes of the projects/resources.
• Some kind of feature that makes it easier for the project manager and resource
manager to communicate.
• Some way to showcase that a resource has been allocated with for example a green
colour on the numbers.
• I use the reports generated from the project files.
• I like to view the information about how the project is going forward.
• I also check to see if people actually update the information in our resource
management tool. Because shit in shit out.
• I look at the available resources and plan new projects, the most important is to see if
there are resources available for new projects.
• Projects should be able to request competences such as plastic model expertise.
• Would like to see more specific data, currently many projects just shove the total
expenses into a cell in the excel tool.
• Would like to see estimations from historical data.
• Project managers need to talk to the respective resource managers so they can discuss
how to get enough resources and finally a “handshake” so that the project manager
knows he got the resource.
• Be able to follow up and manage budgets.
• See which resources that delivers and which does not.
• It should not have too many inputs and take too much time to uphold.
• One excel document with many tabs
• The excel data is uploaded to a server where they are saved (version handled) so you
can back if something goes wrong
• Project managers sends requests
• Line managers meets the requests
• The requests are to be in before a date every month so the line managers can view
these at the end of the month and meet them as well as possible
• After the line managers discuss the requests the financial departments are informed,
and if the requests are not being met then there will need to be discussions between
line managers and project leaders until a handshake is made.
• 3 first months are viewed in weeks and the 15 rest are in months.
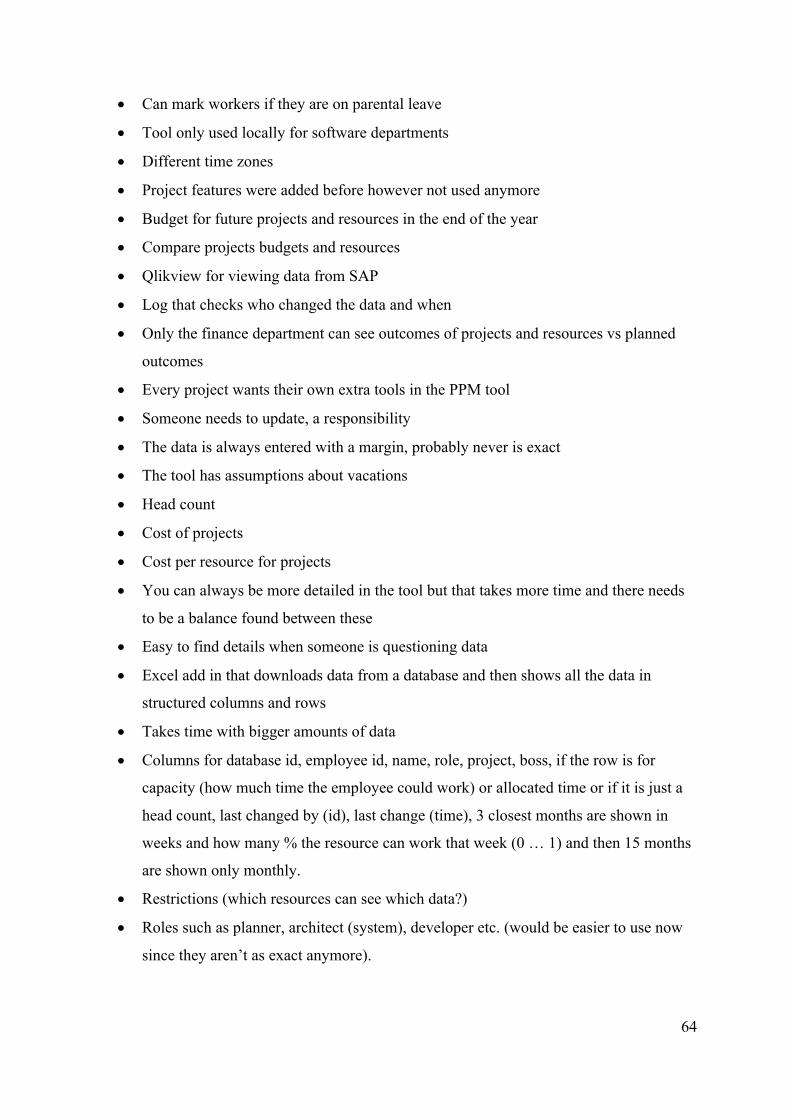
64
• Can mark workers if they are on parental leave
• Tool only used locally for software departments
• Different time zones
• Project features were added before however not used anymore
• Budget for future projects and resources in the end of the year
• Compare projects budgets and resources
• Qlikview for viewing data from SAP
• Log that checks who changed the data and when
• Only the finance department can see outcomes of projects and resources vs planned
outcomes
• Every project wants their own extra tools in the PPM tool
• Someone needs to update, a responsibility
• The data is always entered with a margin, probably never is exact
• The tool has assumptions about vacations
• Head count
• Cost of projects
• Cost per resource for projects
• You can always be more detailed in the tool but that takes more time and there needs
to be a balance found between these
• Easy to find details when someone is questioning data
• Excel add in that downloads data from a database and then shows all the data in
structured columns and rows
• Takes time with bigger amounts of data
• Columns for database id, employee id, name, role, project, boss, if the row is for
capacity (how much time the employee could work) or allocated time or if it is just a
head count, last changed by (id), last change (time), 3 closest months are shown in
weeks and how many % the resource can work that week (0 … 1) and then 15 months
are shown only monthly.
• Restrictions (which resources can see which data?)
• Roles such as planner, architect (system), developer etc. (would be easier to use now
since they aren’t as exact anymore).
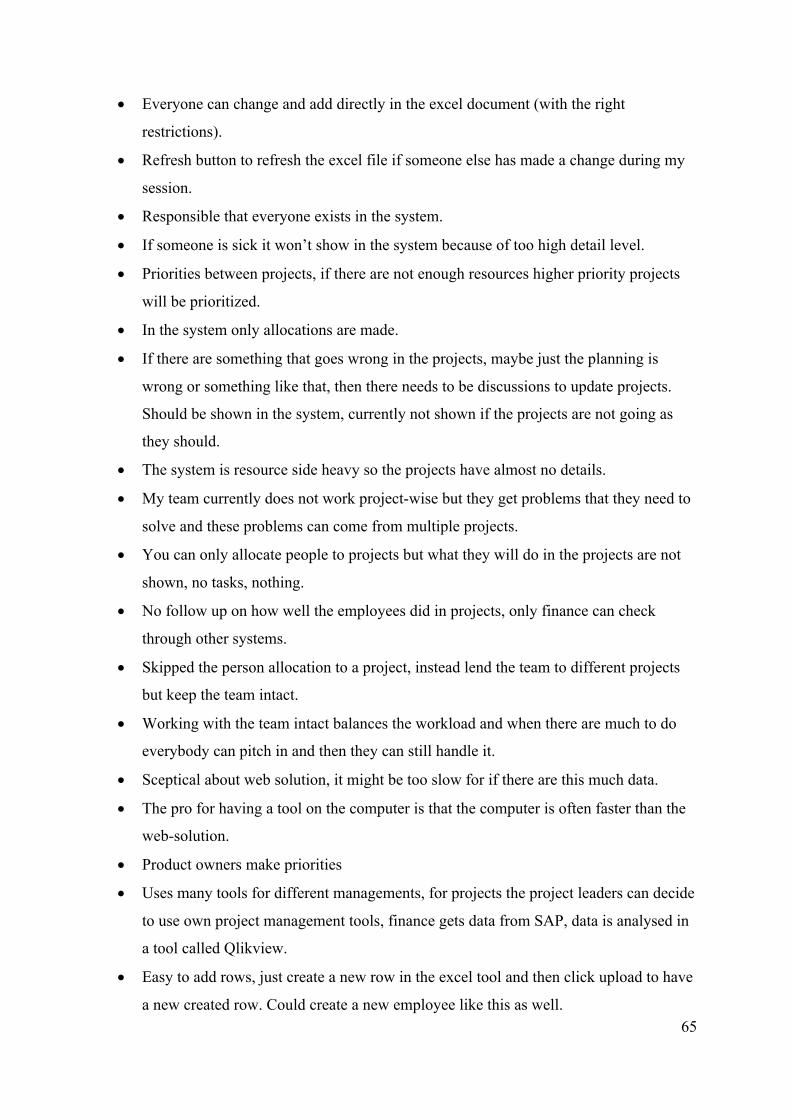
65
• Everyone can change and add directly in the excel document (with the right
restrictions).
• Refresh button to refresh the excel file if someone else has made a change during my
session.
• Responsible that everyone exists in the system.
• If someone is sick it won’t show in the system because of too high detail level.
• Priorities between projects, if there are not enough resources higher priority projects
will be prioritized.
• In the system only allocations are made.
• If there are something that goes wrong in the projects, maybe just the planning is
wrong or something like that, then there needs to be discussions to update projects.
Should be shown in the system, currently not shown if the projects are not going as
they should.
• The system is resource side heavy so the projects have almost no details.
• My team currently does not work project-wise but they get problems that they need to
solve and these problems can come from multiple projects.
• You can only allocate people to projects but what they will do in the projects are not
shown, no tasks, nothing.
• No follow up on how well the employees did in projects, only finance can check
through other systems.
• Skipped the person allocation to a project, instead lend the team to different projects
but keep the team intact.
• Working with the team intact balances the workload and when there are much to do
everybody can pitch in and then they can still handle it.
• Sceptical about web solution, it might be too slow for if there are this much data.
• The pro for having a tool on the computer is that the computer is often faster than the
web-solution.
• Product owners make priorities
• Uses many tools for different managements, for projects the project leaders can decide
to use own project management tools, finance gets data from SAP, data is analysed in
a tool called Qlikview.
• Easy to add rows, just create a new row in the excel tool and then click upload to have
a new created row. Could create a new employee like this as well.
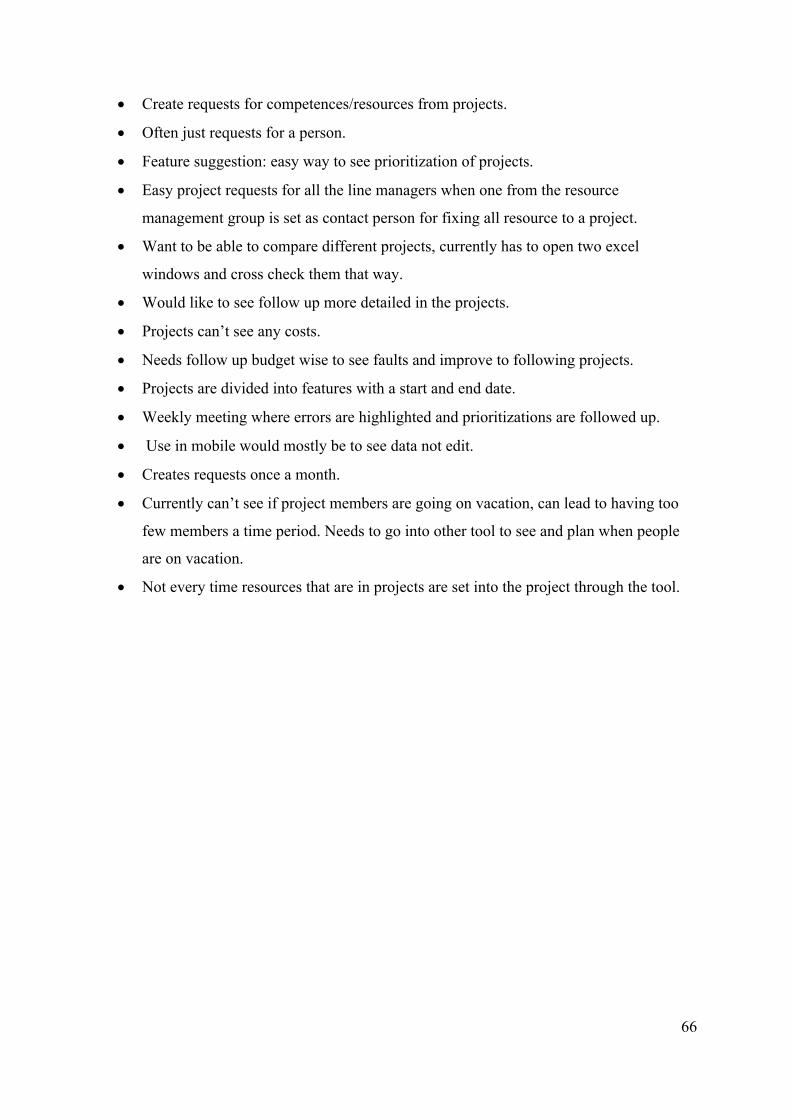
66
• Create requests for competences/resources from projects.
• Often just requests for a person.
• Feature suggestion: easy way to see prioritization of projects.
• Easy project requests for all the line managers when one from the resource
management group is set as contact person for fixing all resource to a project.
• Want to be able to compare different projects, currently has to open two excel
windows and cross check them that way.
• Would like to see follow up more detailed in the projects.
• Projects can’t see any costs.
• Needs follow up budget wise to see faults and improve to following projects.
• Projects are divided into features with a start and end date.
• Weekly meeting where errors are highlighted and prioritizations are followed up.
• Use in mobile would mostly be to see data not edit.
• Creates requests once a month.
• Currently can’t see if project members are going on vacation, can lead to having too
few members a time period. Needs to go into other tool to see and plan when people
are on vacation.
• Not every time resources that are in projects are set into the project through the tool.
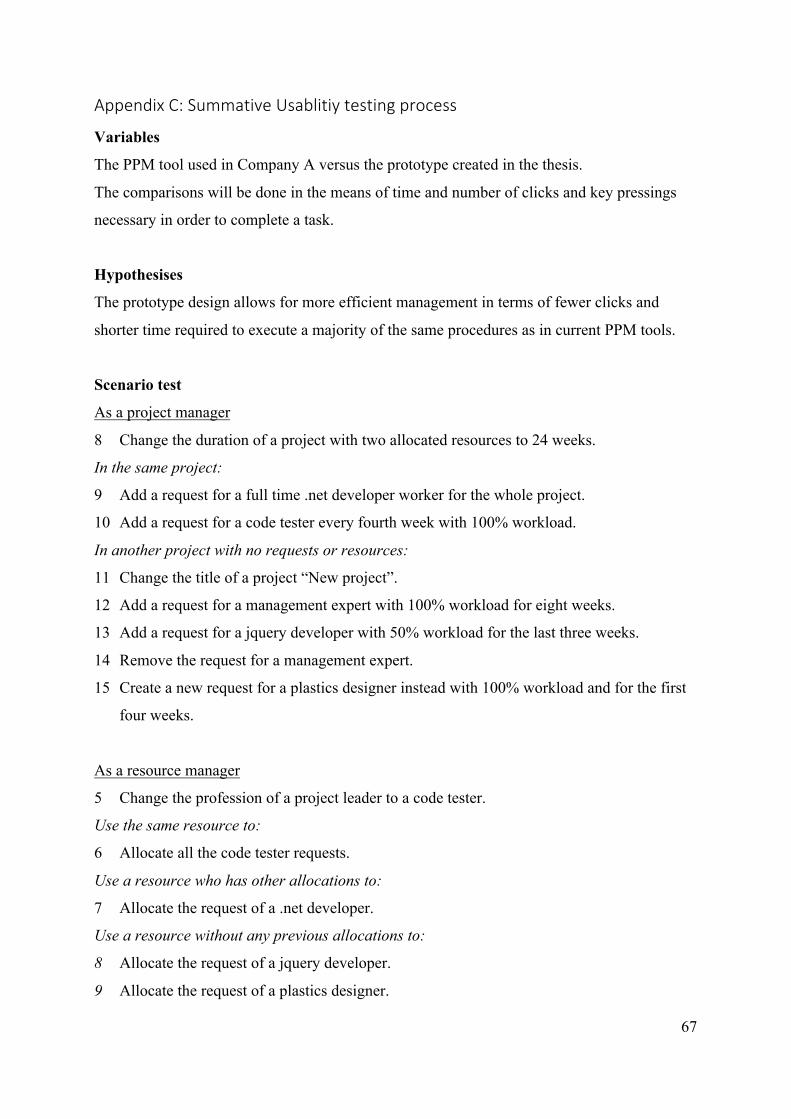
67
AppendixC:SummativeUsablitiytestingprocess
Variables
The PPM tool used in Company A versus the prototype created in the thesis.
The comparisons will be done in the means of time and number of clicks and key pressings
necessary in order to complete a task.
Hypothesises
The prototype design allows for more efficient management in terms of fewer clicks and
shorter time required to execute a majority of the same procedures as in current PPM tools.
Scenario test
As a project manager
8 Change the duration of a project with two allocated resources to 24 weeks.
In the same project:
9 Add a request for a full time .net developer worker for the whole project.
10 Add a request for a code tester every fourth week with 100% workload.
In another project with no requests or resources:
11 Change the title of a project “New project”.
12 Add a request for a management expert with 100% workload for eight weeks.
13 Add a request for a jquery developer with 50% workload for the last three weeks.
14 Remove the request for a management expert.
15 Create a new request for a plastics designer instead with 100% workload and for the first
four weeks.
As a resource manager
5 Change the profession of a project leader to a code tester.
Use the same resource to:
6 Allocate all the code tester requests.
Use a resource who has other allocations to:
7 Allocate the request of a .net developer.
Use a resource without any previous allocations to:
8 Allocate the request of a jquery developer.
9 Allocate the request of a plastics designer.
68
Interview
Overall design
How did the design feel?
Was there something missing from the design?
o Which could have increased the efficiency?
Did the design feel like it was easily understandable?
Did the tool generally feel efficient?
Charts
Did the charts show useful information?
Were the charts located on useful places?
Was it hard to understand the data from the charts?
Were there enough charts?
Functionality
What parts of the design did you think was most impactful?
o Name two specific functions
Did you have trouble with anything?
Did you find the filtering features useful?
Do you think it is suitable for varying project portfolios?