Design Wind Speed Maps for the Caribbean Commentary by ...
55
Design Wind Speed Maps for the Caribbean | 1 Design Wind Speed Maps for the Caribbean Commentary by Tony Gibbs FREng In June 2008 the document “Development of Design Wind Speed Maps for the Caribbean for Application with the Wind Load Provisions of ASCE 7” was published. This was the result of a project funded by the United States Agency for International Development (Tim Callaghan and Julie Leonard) and executed by the Pan American Health Organisation (Dr Dana van Alphen). The principal researchers were Applied Research Associates (Dr Peter J Vickery and D Wadhera) and the regional coordinator was Tony Gibbs (CEP International Ltd). The information from that study has been incorporated formally in the building codes of 10 Caribbean countries and has been used on an ad hoc basis in several other Caribbean countries. Towards the end of 2017 there was a rethink of the wind hazard levels following the very active and severe hurricane season of that year. A decision was taken in 2018 to initiate a formal review of the wind hazard throughout the Caribbean Basin. Dr Peter Vickery of Applied Research Associates (in Raleigh, North Carolina) was once again approached to undertake the study. In justifying the need for a new study it was pointed out that the model used in the 2008 study was largely based on ~ 1960 to 2008 data (49 years) and in 2018 there was another 10 more years of available records (a ~ 20% increase in data). The report of the new study is titled “Development of Design Wind Speed Maps for the Caribbean for Application with the Wind Load Provisions of ASCE 7-16 and Later” prepared by L A Mudd, A Liu and P J Vickery of Applied Research Associates Inc. The full report is available at http://bit.ly/2kt62xu. The Introduction to the report of the study states: “The objective of this study is to develop estimates of wind speeds as a function of return period for locations in the Caribbean Basin that can be used in conjunction with the design wind provisions used in the US wind loading standards that reference ASCE 7-16 and later. Maps of hurricane induced wind speeds are developed using a peer reviewed hurricane simulation model as described in Vickery et al. (2000a, 2000b, 2006, 2009a, 2009b), and Vickery and Wadhera (2008). The hurricane simulation model used here is an updated version of that described in Vickery et al. (2009a, 2009b) and Vickery and Wadhera (2008) which was used to produce the design wind speeds used in ASCE 7-10 and ASCE 7-16, the current version.” Predictions of hurricane wind speeds as a function of return period were used to produce maps of hurricane wind speeds for return periods of 300-, 700-, 1,700- and 3,000-years. These wind speeds are meant to be used without modification with the wind loading provisions of ASCE 7-
Transcript of Design Wind Speed Maps for the Caribbean Commentary by ...

Design Wind Speed Maps for the Caribbean | 1
Design Wind Speed Maps for the Caribbean Commentary by Tony Gibbs FREng In June 2008 the document “Development of Design Wind Speed Maps for the Caribbean for Application with the Wind Load Provisions of ASCE 7” was published. This was the result of a project funded by the United States Agency for International Development (Tim Callaghan and Julie Leonard) and executed by the Pan American Health Organisation (Dr Dana van Alphen). The principal researchers were Applied Research Associates (Dr Peter J Vickery and D Wadhera) and the regional coordinator was Tony Gibbs (CEP International Ltd). The information from that study has been incorporated formally in the building codes of 10 Caribbean countries and has been used on an ad hoc basis in several other Caribbean countries. Towards the end of 2017 there was a rethink of the wind hazard levels following the very active and severe hurricane season of that year. A decision was taken in 2018 to initiate a formal review of the wind hazard throughout the Caribbean Basin. Dr Peter Vickery of Applied Research Associates (in Raleigh, North Carolina) was once again approached to undertake the study. In justifying the need for a new study it was pointed out that the model used in the 2008 study was largely based on ~ 1960 to 2008 data (49 years) and in 2018 there was another 10 more years of available records (a ~ 20% increase in data). The report of the new study is titled “Development of Design Wind Speed Maps for the Caribbean for Application with the Wind Load Provisions of ASCE 7-16 and Later” prepared by L A Mudd, A Liu and P J Vickery of Applied Research Associates Inc. The full report is available at http://bit.ly/2kt62xu. The Introduction to the report of the study states:
“The objective of this study is to develop estimates of wind speeds as a function of return period for locations in the Caribbean Basin that can be used in conjunction with the design wind provisions used in the US wind loading standards that reference ASCE 7-16 and later. Maps of hurricane induced wind speeds are developed using a peer reviewed hurricane simulation model as described in Vickery et al. (2000a, 2000b, 2006, 2009a, 2009b), and Vickery and Wadhera (2008). The hurricane simulation model used here is an updated version of that described in Vickery et al. (2009a, 2009b) and Vickery and Wadhera (2008) which was used to produce the design wind speeds used in ASCE 7-10 and ASCE 7-16, the current version.”
Predictions of hurricane wind speeds as a function of return period were used to produce maps of hurricane wind speeds for return periods of 300-, 700-, 1,700- and 3,000-years. These wind speeds are meant to be used without modification with the wind loading provisions of ASCE 7-

Design Wind Speed Maps for the Caribbean | 2
16 and the upcoming ASCE 7-22. The wind speeds are 3-second gust wind speeds at a height of 10 metres in flat open terrain (Exposure C in ASCE 7-16). For buildings located within 600 feet of the coast, the wind speeds should be adjusted for Exposure D. The report of the study does not specifically address the effects of climate change on wind speeds or the frequency of wind events. There continues to be significant controversy regarding the impact of climate change on the hurricane wind hazard. The 2008 World Bank funded and CCCCC executed project undertaken by Georgia Tech (Curry and Webster), Applied Research Associates (Vickery) and Tony Gibbs recommended enhancement factors for wind speeds for the Eastern Caribbean of 1.10 for Category III and IV buildings and 1.15 for Category II buildings. Until better information or guidance becomes available, it would be conservative to use those values with the wind speeds in the current report. The following Figures 3.1 to 3.48 contain the detailed information for the Caribbean islands (excluding the USA territories) and Belize. The overall picture for the Caribbean Basin, including the coastal regions of South America and Central America, are provided in Figures 3.49 to 3.52. The contours do not extend to Guyana and Suriname. The hurricane risk in those countries is extremely low. The tropical cyclone wind hazard for Guyana and Suriname would be negligible compared to the thunderstorm hazard. Nevertheless, the lowest contours on those four maps could be used as very conservative guidance in determining wind speeds for structural design in those two countries. This note on the correlation of Basic Wind Speeds averaged over 3 seconds with the Saffir-Simpson Scale which uses 1-minute averages is based on the Commentary in the American Society of Civil Engineers (ASCE) document “Minimum Design Loads for Buildings and Other Structures” ASCE 7. The hurricane reports from the National Hurricane Center include the Saffir-Simpson Hurricane Categories 1 to 5. This scale is relied on by local emergency management agencies in order to warn the populations of the need to prepare for upcoming severe weather systems. The Saffir-Simpson Hurricane Scale has wide acceptance and popularity. Its five Categories are based on wind speed intensity and barometric pressure at the centre of the storm. The quoted wind speeds determining the various Categories are sustained wind speeds with a 1-minute averaging time at 33 ft over open water. It is understood that the wind speeds categorising the hurricanes are the most intense in the system – typically in the north-east eye wall. Those speeds are not necessarily the ones impacting on any particular island or part of an island. It is important to note that the wind speeds reported by the National Hurricane Centre are not the same as those determined by researchers specifically for use in the design of structures. The American Society of Civil Engineers ASCE 7 standard commonly used by engineers for wind-resistant design purposes in the USA and the Caribbean uses a 3-second gust speed at 33 ft above ground in open terrain with scattered obstructions having heights generally less than 30

Design Wind Speed Maps for the Caribbean | 3
feet – commonly associated with flat open country and grasslands. This is known as Exposure C. The wind speed thus defined is the Basic Wind Speed for use in structural design. It is useful to have approximate relationships between the Basic Wind Speed and the Saffir-Simpson Scale. This is provided by ASCE in a Table in the Commentary section of ASCE 7. The essential parts of that Table are reproduced below:
Saffir-Simpson Hurricane Category
Sustained Wind Speed (1-minute average)
Over Water MPH
Gust Wind Speed (3-second average)
Over Water MPH
Gust Wind Speed (3-second average)
Over Land MPH
1 74–95 90–116 81–105
2 96–110 117–134 106–121
3 111–129 135–157 122–142
4 130–156 158–190 143–172
5 >157 >191 >173 At the coast the “over water” equivalents should be used. But Dr Peter Vickery states: “The winds transition from an over water surface to an over land terrain pretty quickly. About 70% of the transition is complete after 1 km.” He adds: “As the wind speeds we have produced are on land, although not fully transitioned to open terrain wind speeds, the relationship between the gust wind speeds is closer to those given in the Over Land column of the attached Table from ASCE 7-16. The actual values vary with distance from the sea-land interface.” A fuller explanation of this correlation of Basic Wind Speeds with the Saffir-Simpson Scale can be obtained in the ASCE 7 Commentary. This document is available from: https://www.asce.org/templates/publications-book-detail.aspx?id=24136. These notes are presented to help users to understand more-clearly wind speeds shown on the maps when compared with the wind speeds reported by weather forecasters and the news media, who commonly use the Saffir-Simpson Hurricane Scale. The gust wind speed values given in the Table that are associated with a given sustained wind speed should be used as a guide only. The gust wind speeds associated with a given sustained wind speed may vary with storm size and intensity.

18 Final Report May 28, 2019
Figure 3-1. Contours of predicted 300-year return period wind speeds (mph) at a height of 10
m above flat open terrain for the Islands of Aruba, Bonaire and Curacao.

19 Final Report May 28, 2019
Figure 3-2. Contours of predicted 700-year return period wind speeds (mph) at a height of 10
m above flat open terrain for the Islands of Aruba, Bonaire and Curacao.
20 Final Report May 28, 2019
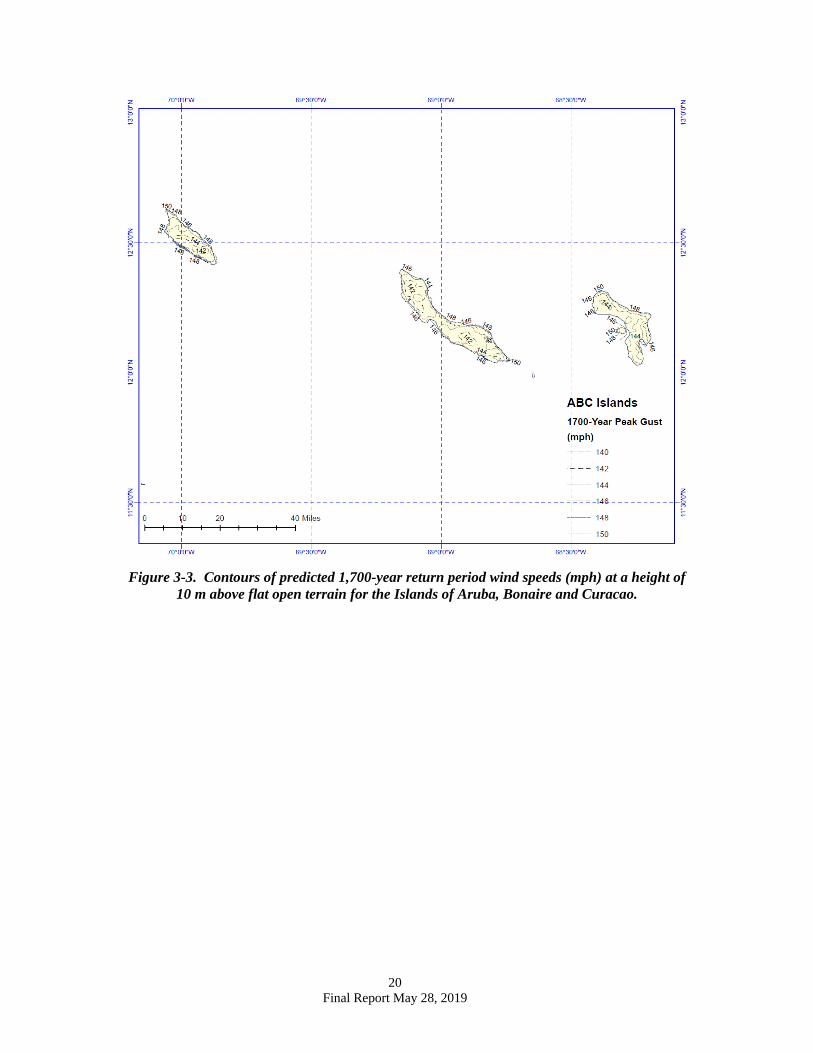
Figure 3-3. Contours of predicted 1,700-year return period wind speeds (mph) at a height of
10 m above flat open terrain for the Islands of Aruba, Bonaire and Curacao.

21 Final Report May 28, 2019
Figure 3-4. Contours of predicted 3,000-year return period wind speeds (mph) at a height of
10 m above flat open terrain for the Islands of Aruba, Bonaire and Curacao.
22 Final Report May 28, 2019
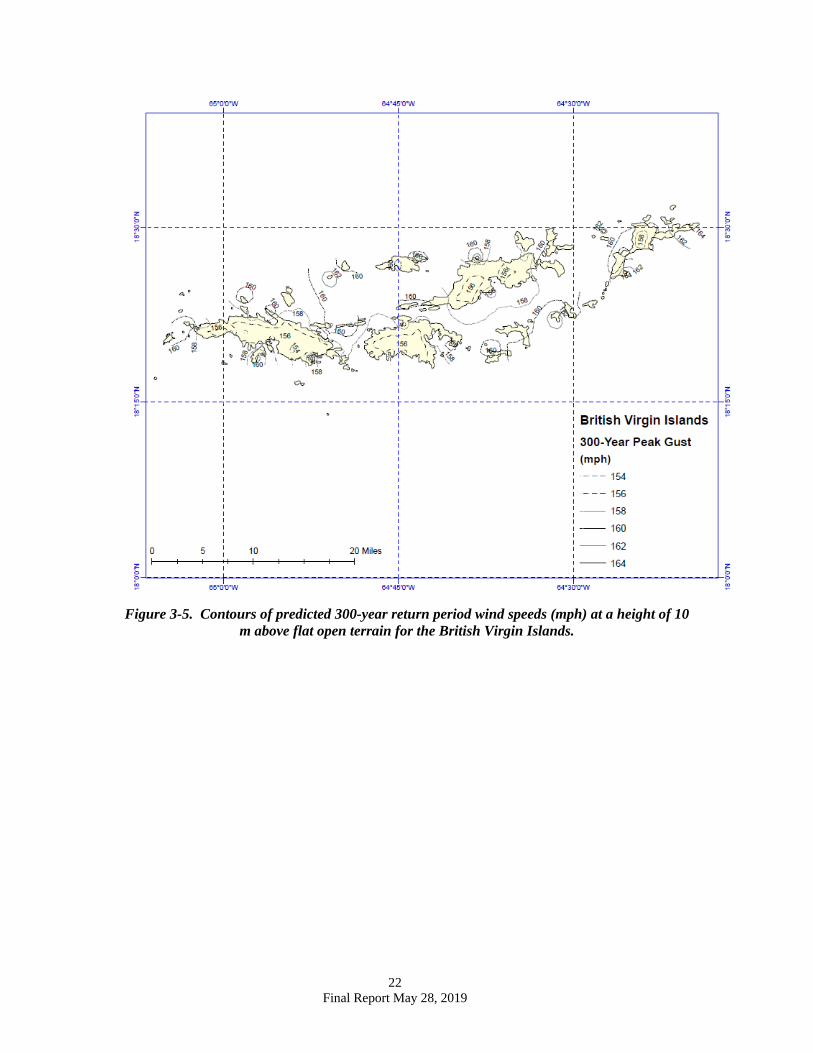
Figure 3-5. Contours of predicted 300-year return period wind speeds (mph) at a height of 10
m above flat open terrain for the British Virgin Islands.

23 Final Report May 28, 2019
Figure 3-6. Contours of predicted 700-year return period wind speeds (mph) at a height of 10
m above flat open terrain for the British Virgin Islands.

24 Final Report May 28, 2019
Figure 3-7. Contours of predicted 1,700-year return period wind speeds (mph) at a height of
10 m above flat open terrain for the British Virgin Islands.

25 Final Report May 28, 2019
Figure 3-8. Contours of predicted 3,000-year return period wind speeds (mph) at a height of
10 m above flat open terrain for the British Virgin Islands.
26 Final Report May 28, 2019
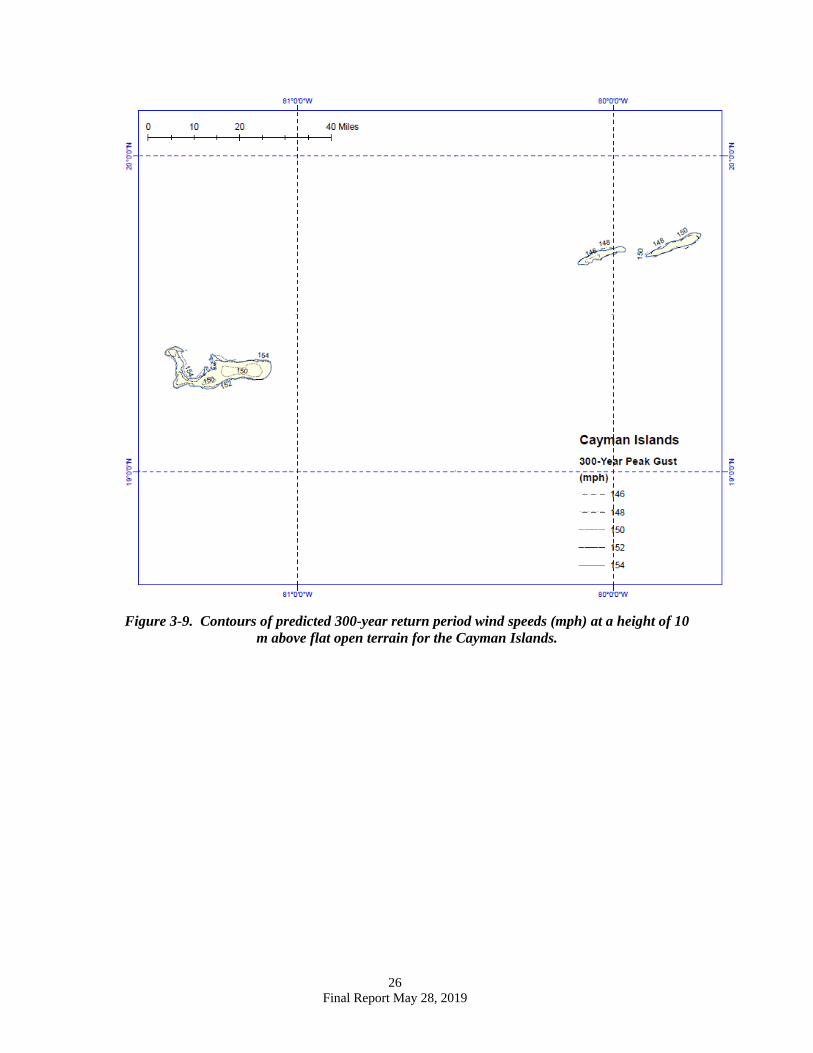
Figure 3-9. Contours of predicted 300-year return period wind speeds (mph) at a height of 10
m above flat open terrain for the Cayman Islands.
27 Final Report May 28, 2019
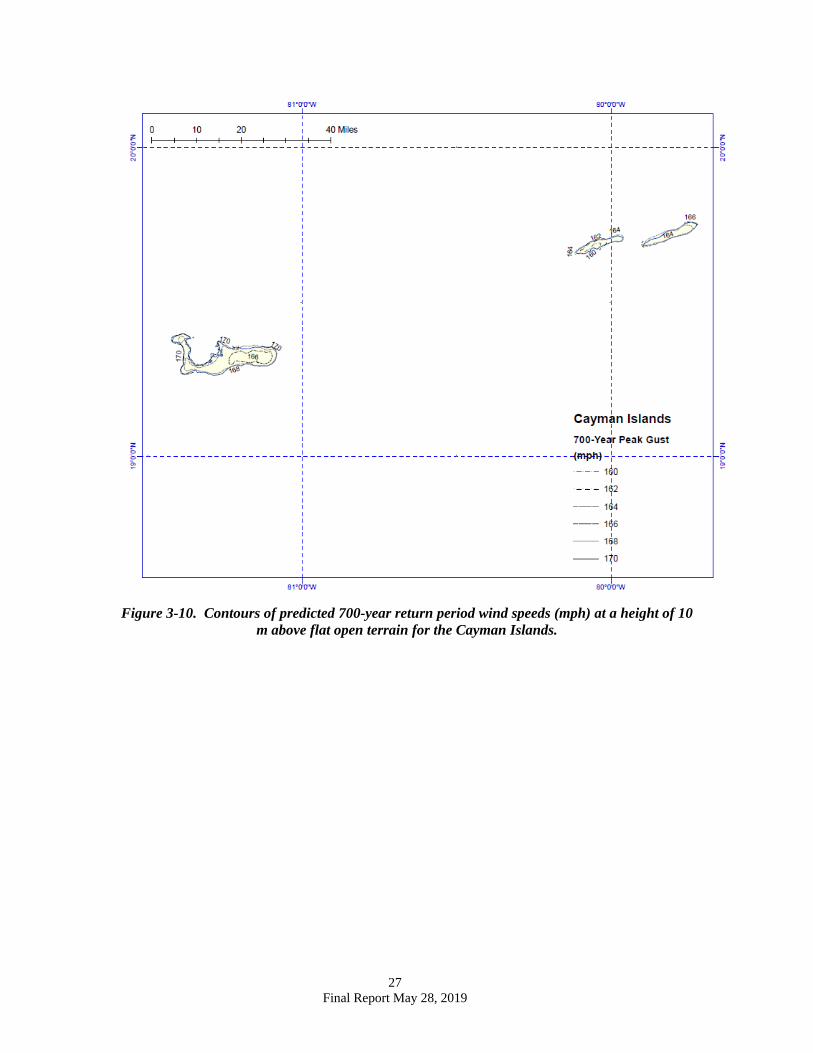
Figure 3-10. Contours of predicted 700-year return period wind speeds (mph) at a height of 10
m above flat open terrain for the Cayman Islands.
28 Final Report May 28, 2019
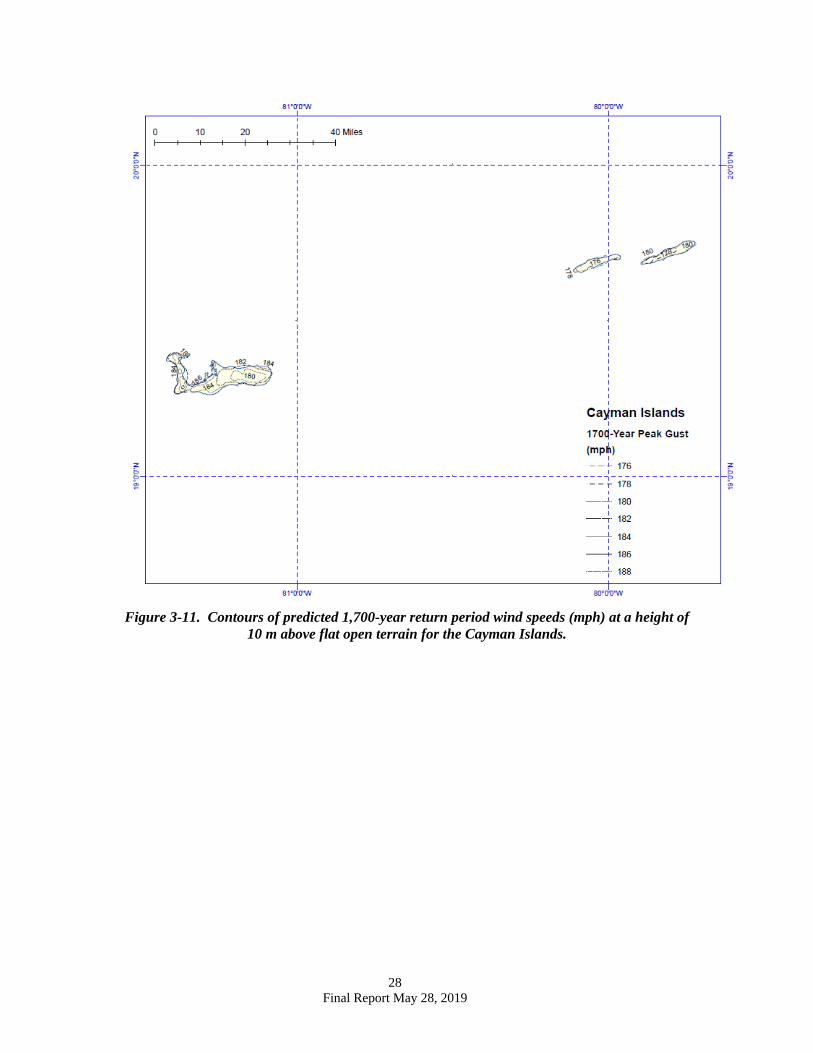
Figure 3-11. Contours of predicted 1,700-year return period wind speeds (mph) at a height of
10 m above flat open terrain for the Cayman Islands.
29 Final Report May 28, 2019
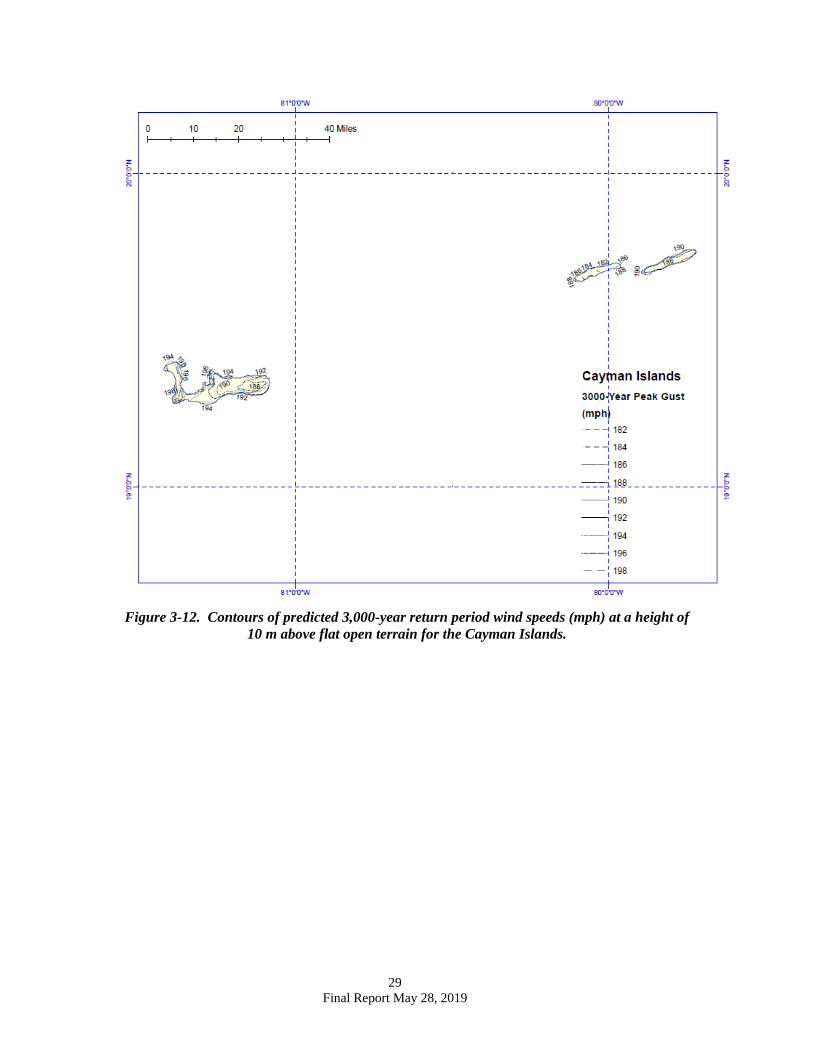
Figure 3-12. Contours of predicted 3,000-year return period wind speeds (mph) at a height of
10 m above flat open terrain for the Cayman Islands.
30 Final Report May 28, 2019
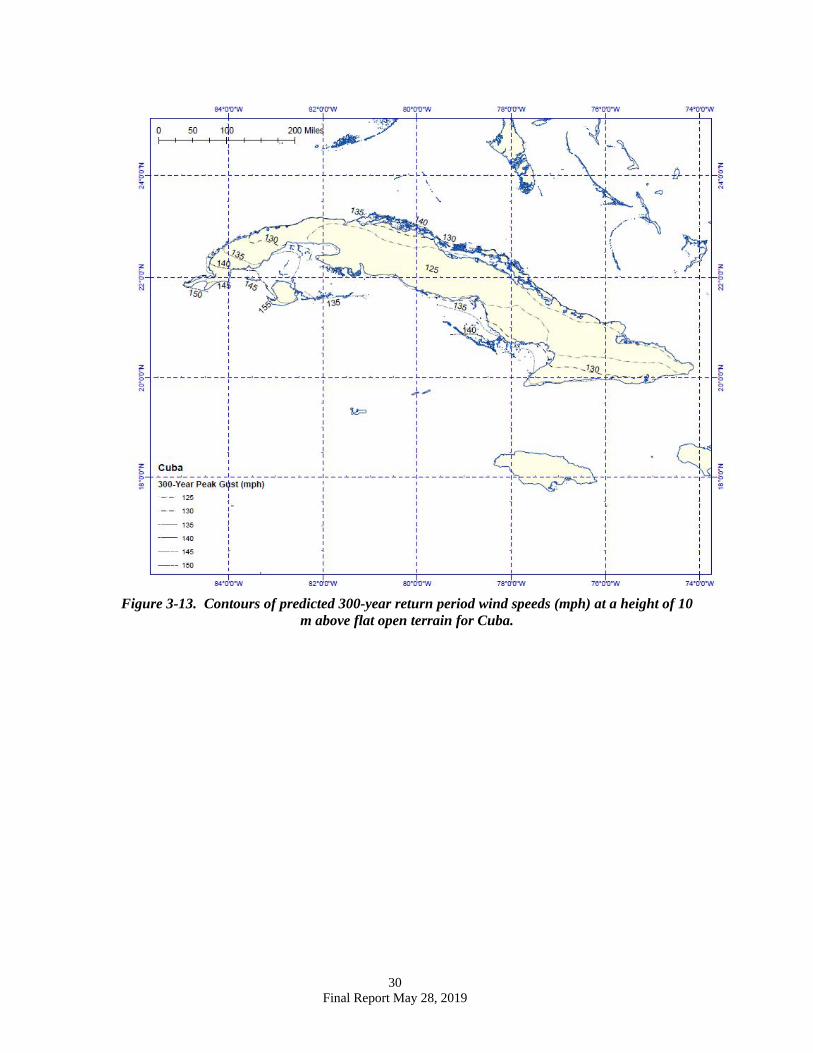
Figure 3-13. Contours of predicted 300-year return period wind speeds (mph) at a height of 10
m above flat open terrain for Cuba.
31 Final Report May 28, 2019
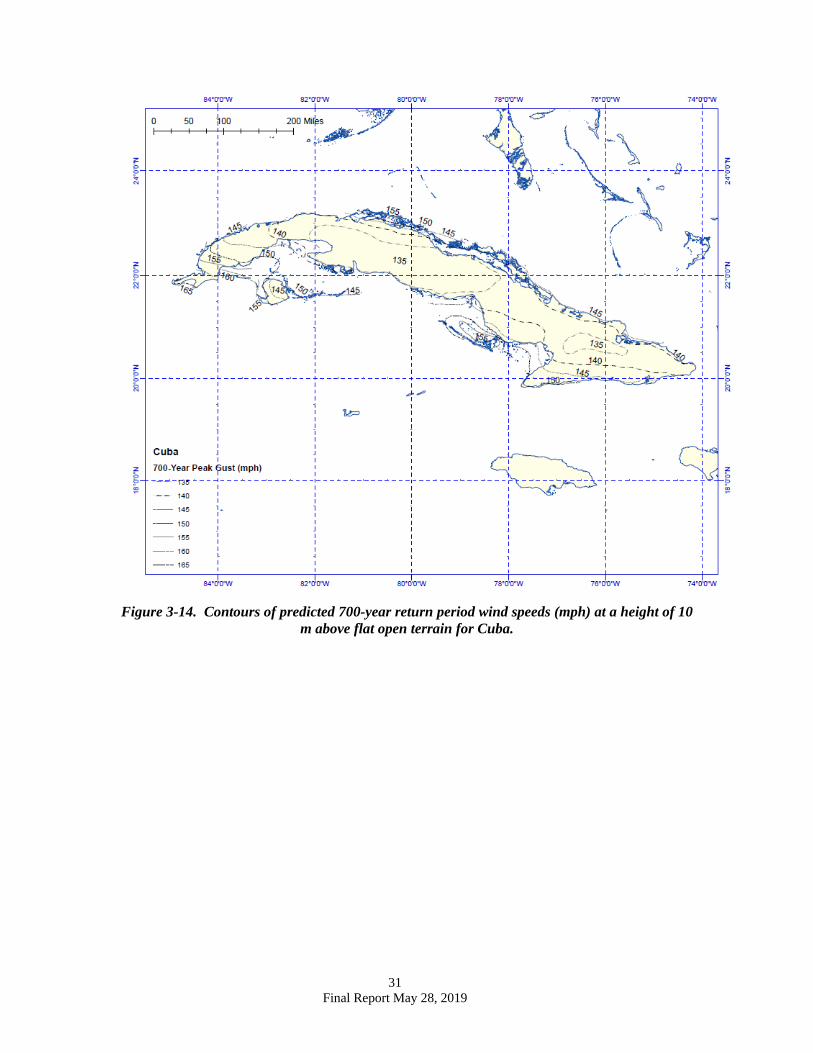
Figure 3-14. Contours of predicted 700-year return period wind speeds (mph) at a height of 10
m above flat open terrain for Cuba.

32 Final Report May 28, 2019
Figure 3-15. Contours of predicted 1,700-year return period wind speeds (mph) at a height of
10 m above flat open terrain for Cuba.
33 Final Report May 28, 2019
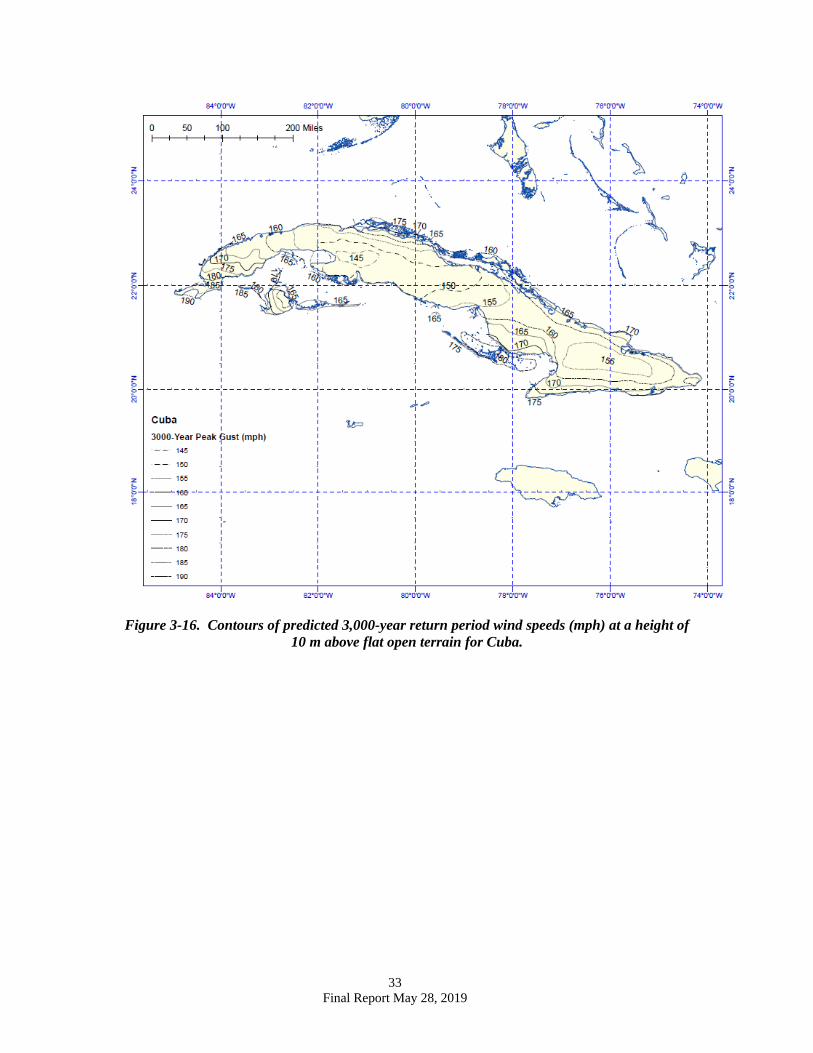
Figure 3-16. Contours of predicted 3,000-year return period wind speeds (mph) at a height of
10 m above flat open terrain for Cuba.
34 Final Report May 28, 2019
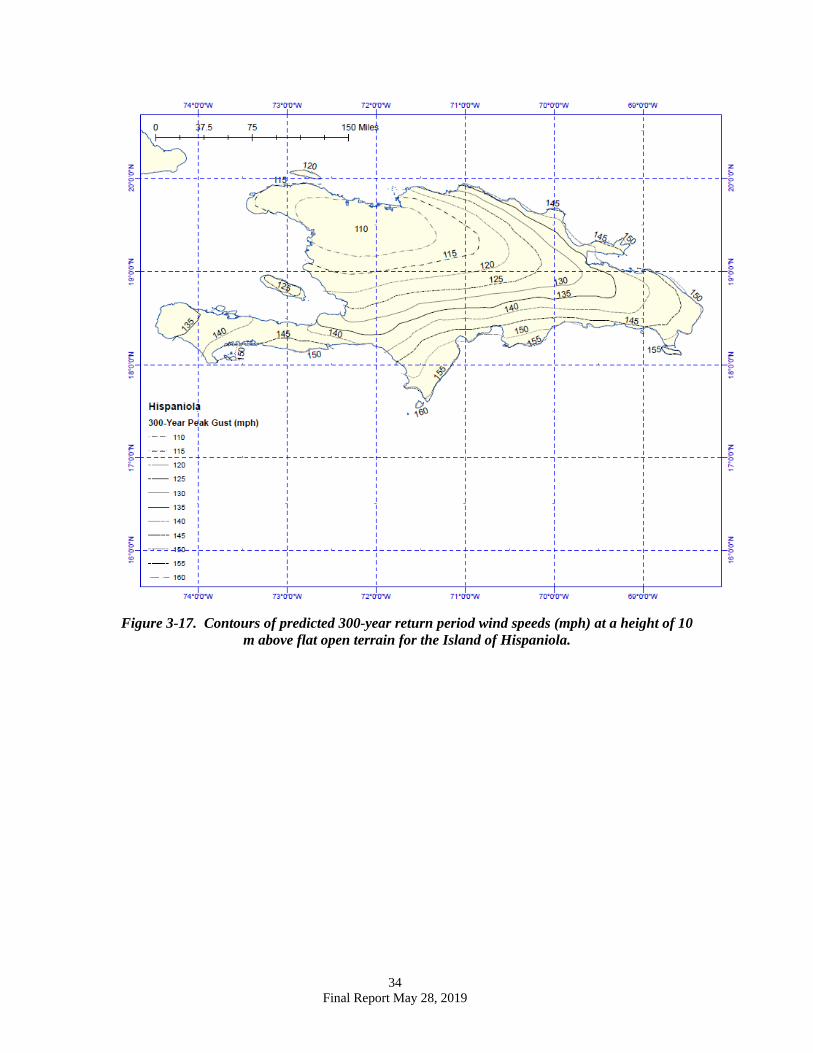
Figure 3-17. Contours of predicted 300-year return period wind speeds (mph) at a height of 10
m above flat open terrain for the Island of Hispaniola.

35 Final Report May 28, 2019
Figure 3-18. Contours of predicted 700-year return period wind speeds (mph) at a height of 10
m above flat open terrain for the Island of Hispaniola.

36 Final Report May 28, 2019
Figure 3-19. Contours of predicted 1,700-year return period wind speeds (mph) at a height of
10 m above flat open terrain for the Island of Hispaniola.
37 Final Report May 28, 2019
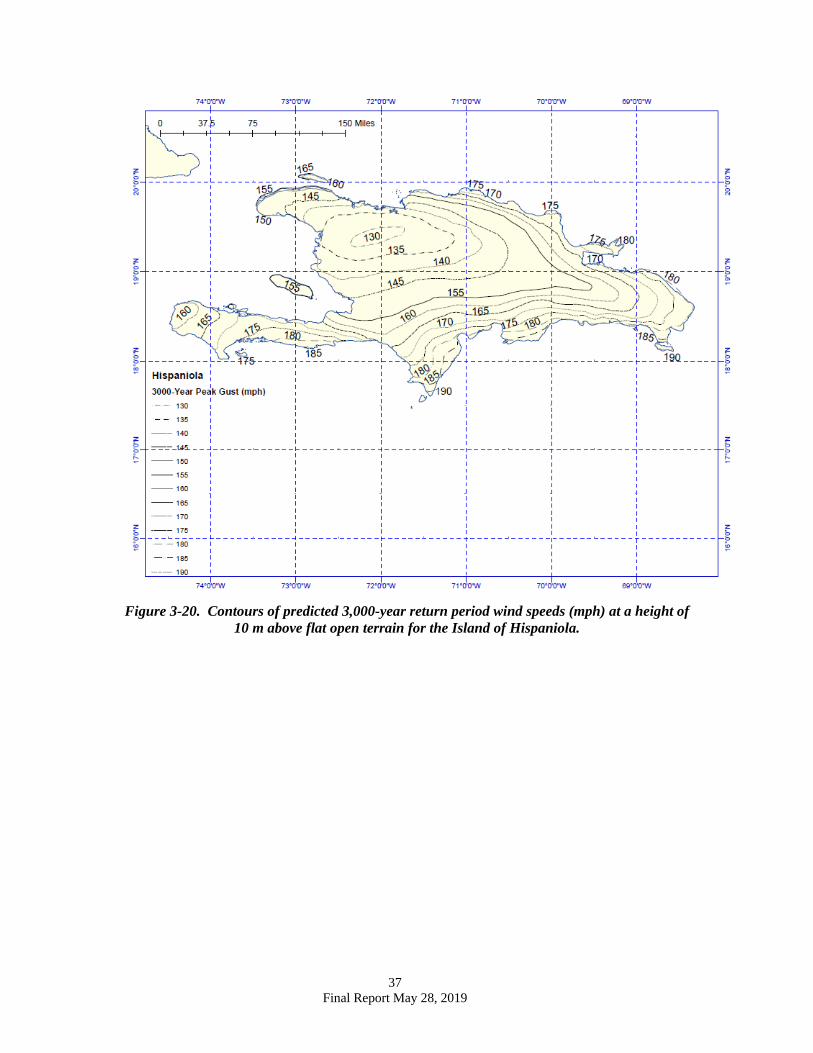
Figure 3-20. Contours of predicted 3,000-year return period wind speeds (mph) at a height of
10 m above flat open terrain for the Island of Hispaniola.

38 Final Report May 28, 2019
Figure 3-21. Contours of predicted 300-year return period wind speeds (mph) at a height of 10
m above flat open terrain for Isla Margarita.
39 Final Report May 28, 2019
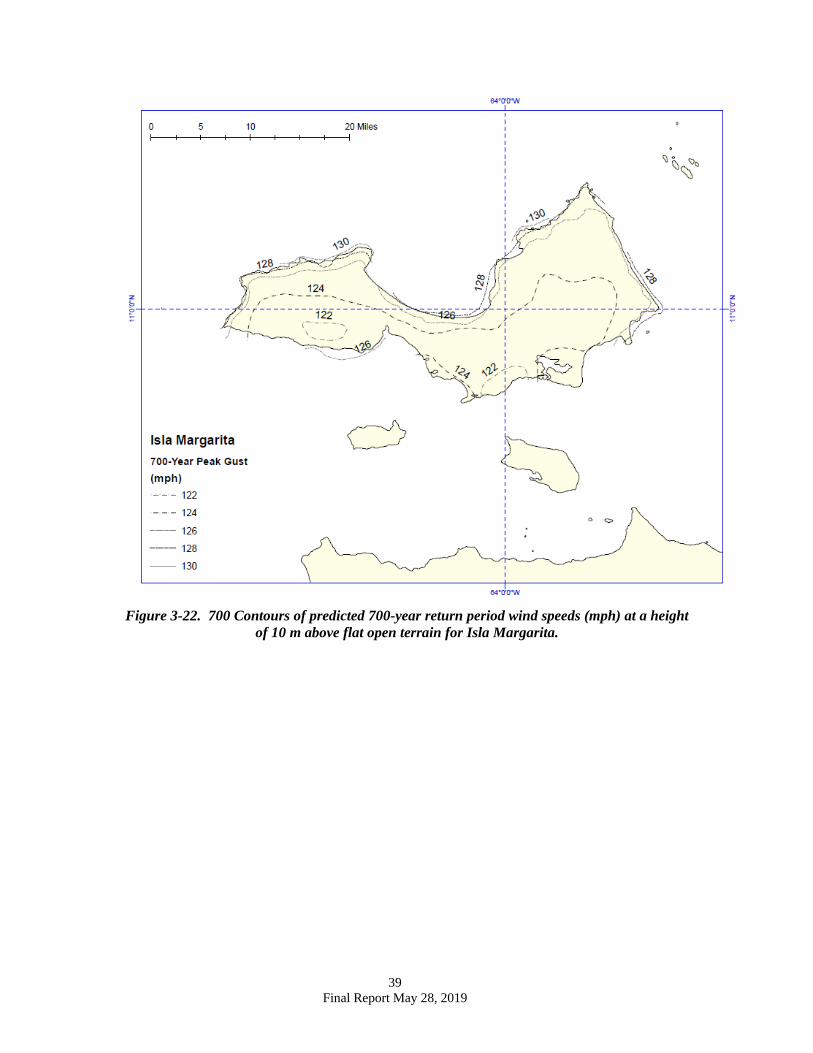
Figure 3-22. 700 Contours of predicted 700-year return period wind speeds (mph) at a height
of 10 m above flat open terrain for Isla Margarita.
40 Final Report May 28, 2019
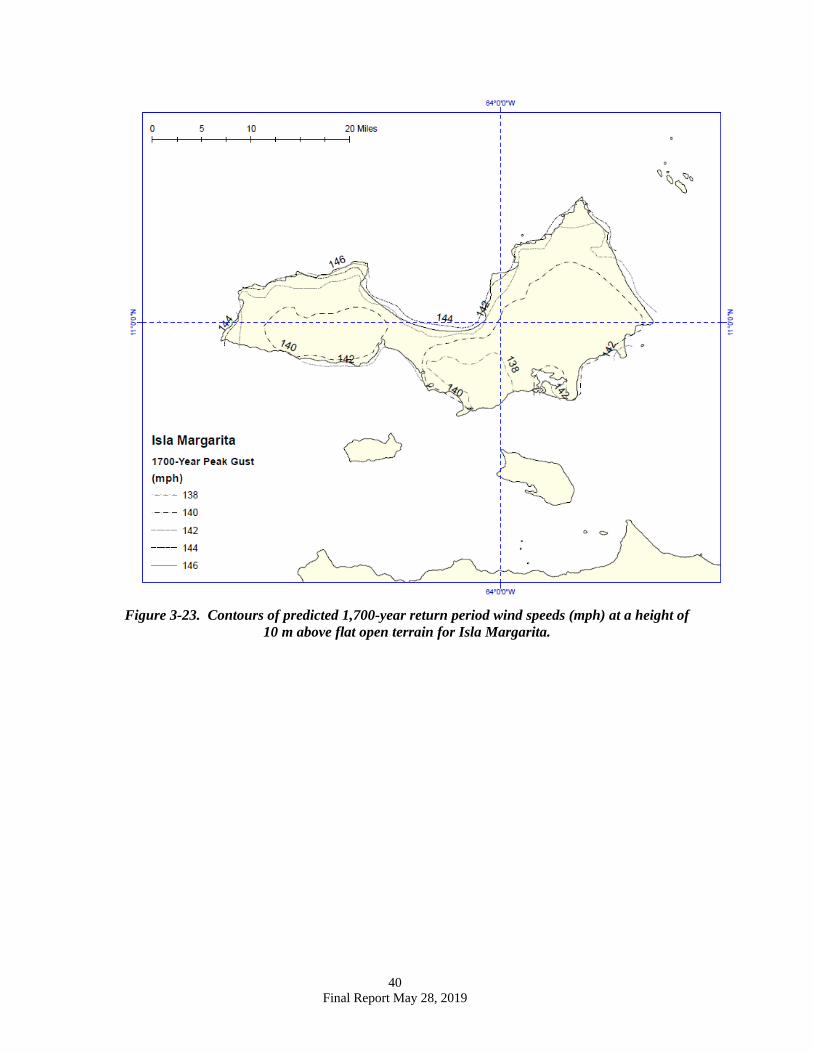
Figure 3-23. Contours of predicted 1,700-year return period wind speeds (mph) at a height of
10 m above flat open terrain for Isla Margarita.
41 Final Report May 28, 2019
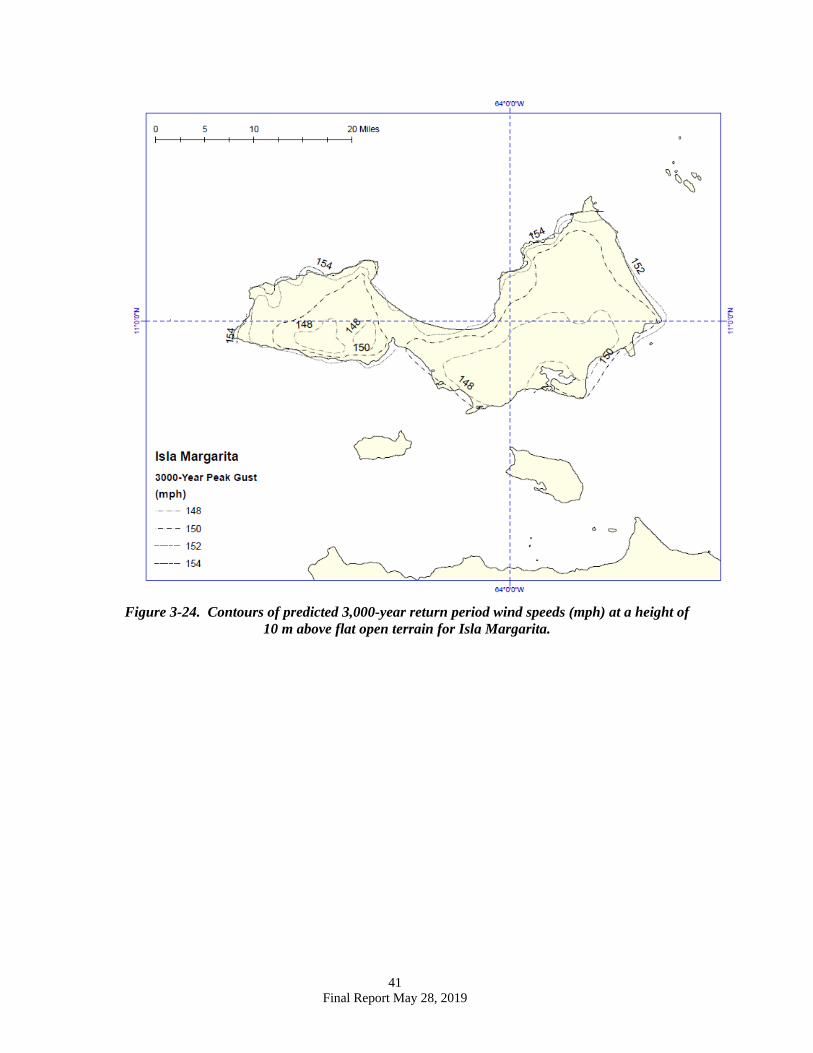
Figure 3-24. Contours of predicted 3,000-year return period wind speeds (mph) at a height of
10 m above flat open terrain for Isla Margarita.

42 Final Report May 28, 2019
Figure 3-25. Contours of predicted 300-year return period wind speeds (mph) at a height of 10
m above flat open terrain for Jamaica.
43 Final Report May 28, 2019
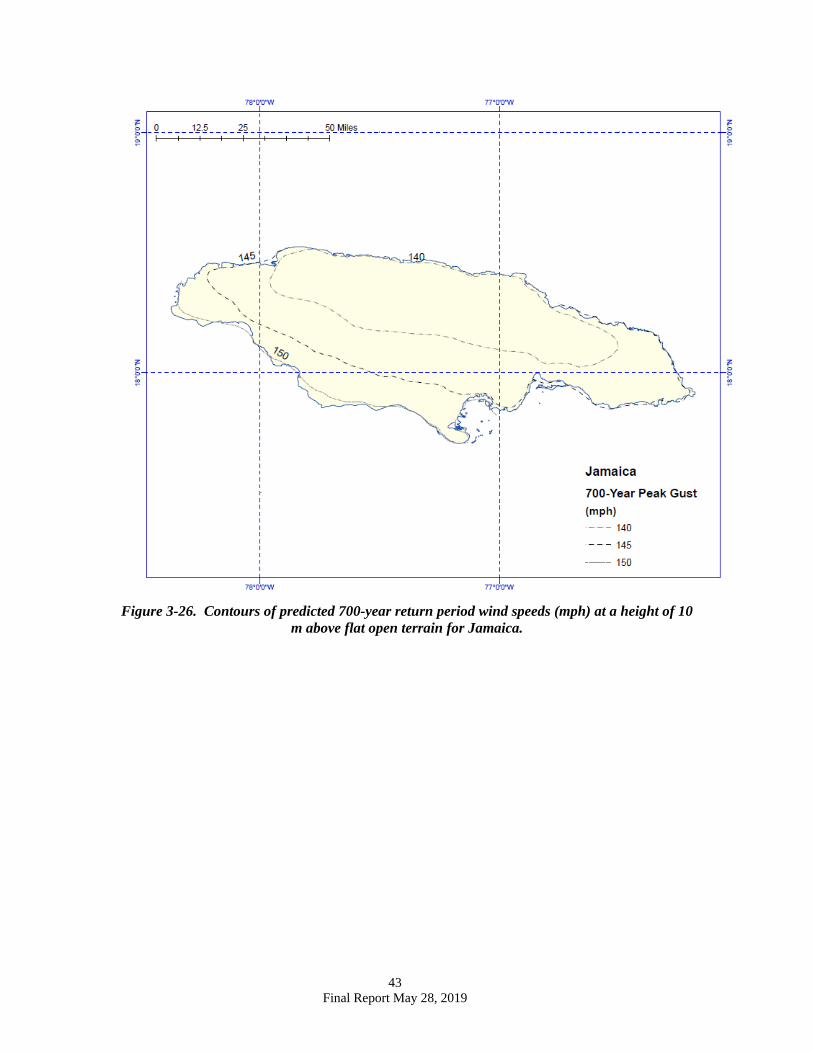
Figure 3-26. Contours of predicted 700-year return period wind speeds (mph) at a height of 10
m above flat open terrain for Jamaica.
44 Final Report May 28, 2019
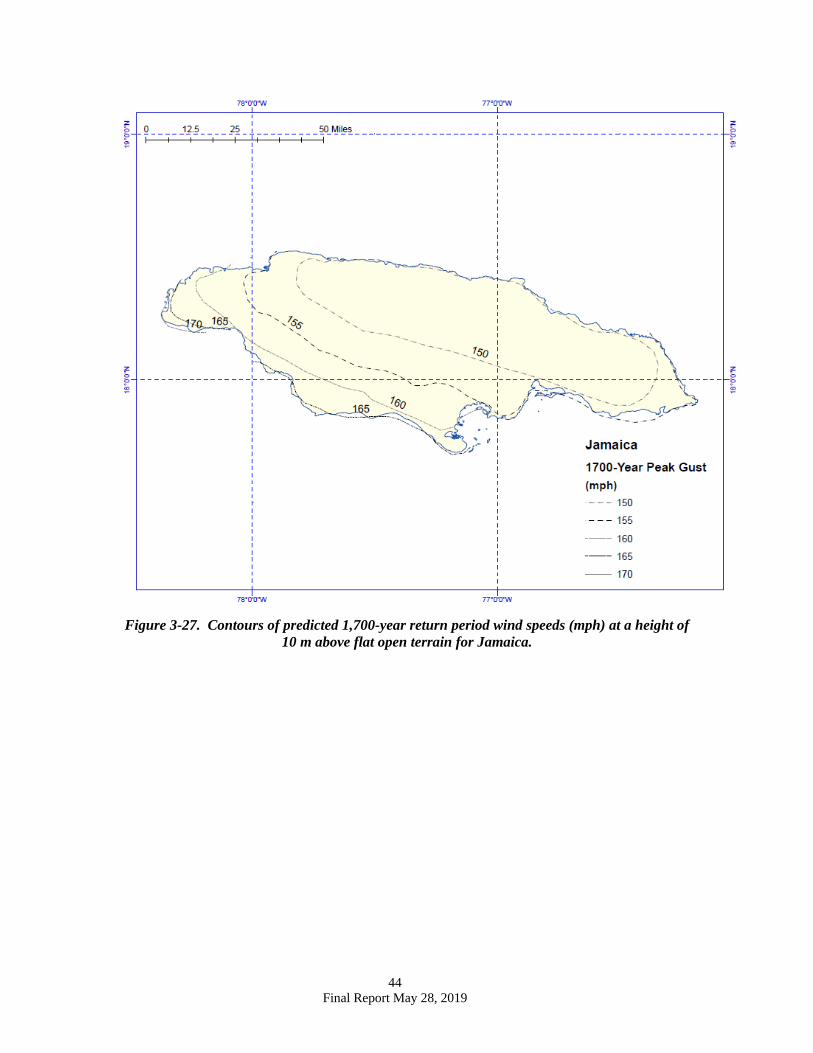
Figure 3-27. Contours of predicted 1,700-year return period wind speeds (mph) at a height of
10 m above flat open terrain for Jamaica.

45 Final Report May 28, 2019
Figure 3-28. Contours of predicted 3,000-year return period wind speeds (mph) at a height of
10 m above flat open terrain for Jamaica.

46 Final Report May 28, 2019
Figure 3-29. Contours of predicted 300-year return period wind speeds (mph) at a height of 10
m above flat open terrain for Trinidad and Tobago.
47 Final Report May 28, 2019
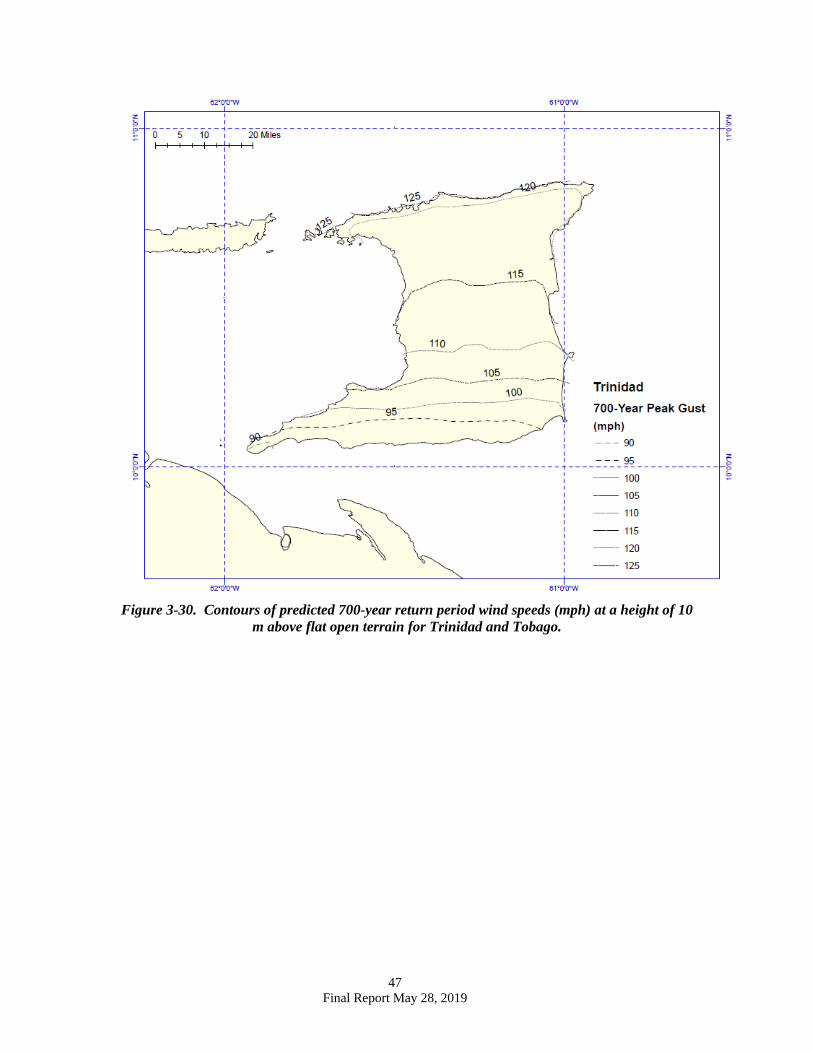
Figure 3-30. Contours of predicted 700-year return period wind speeds (mph) at a height of 10
m above flat open terrain for Trinidad and Tobago.

48 Final Report May 28, 2019
Figure 3-31. Contours of predicted 700-year return period wind speeds (mph) at a height of 10
m above flat open terrain for Trinidad and Tobago.

49 Final Report May 28, 2019
Figure 3-32. Contours of predicted 3,000-year return period wind speeds (mph) at a height of
10 m above flat open terrain for Trinidad and Tobago.
50 Final Report May 28, 2019
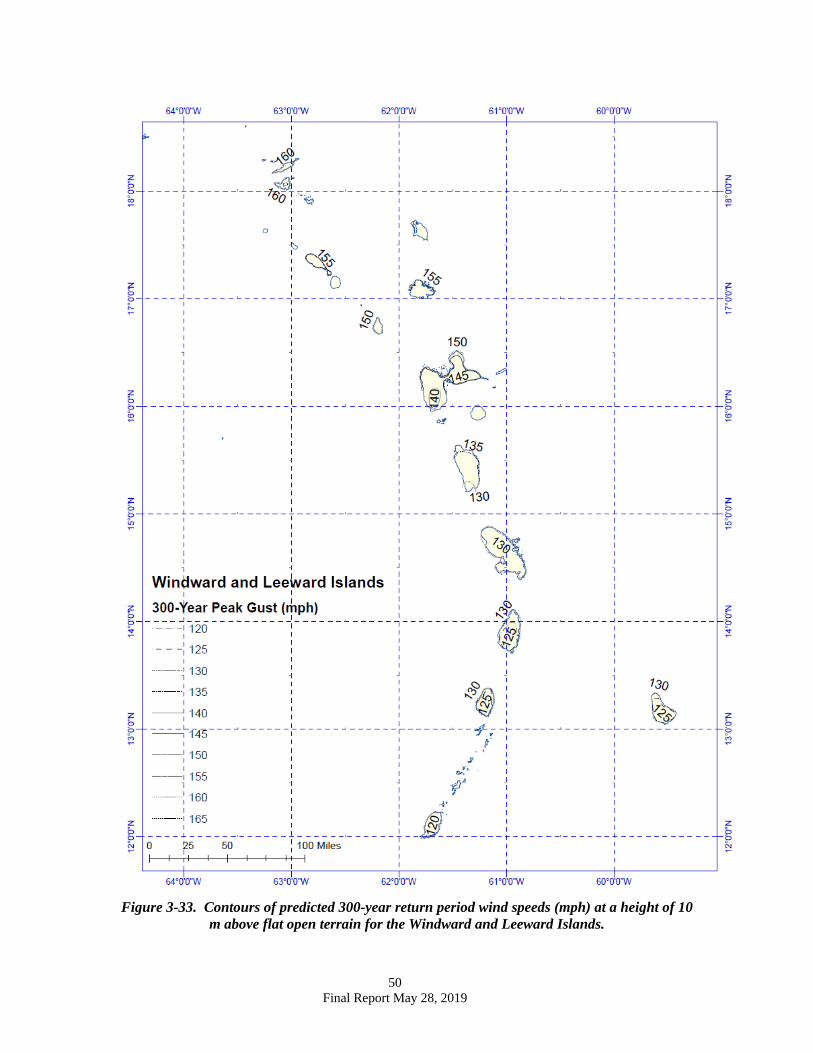
Figure 3-33. Contours of predicted 300-year return period wind speeds (mph) at a height of 10
m above flat open terrain for the Windward and Leeward Islands.
51 Final Report May 28, 2019
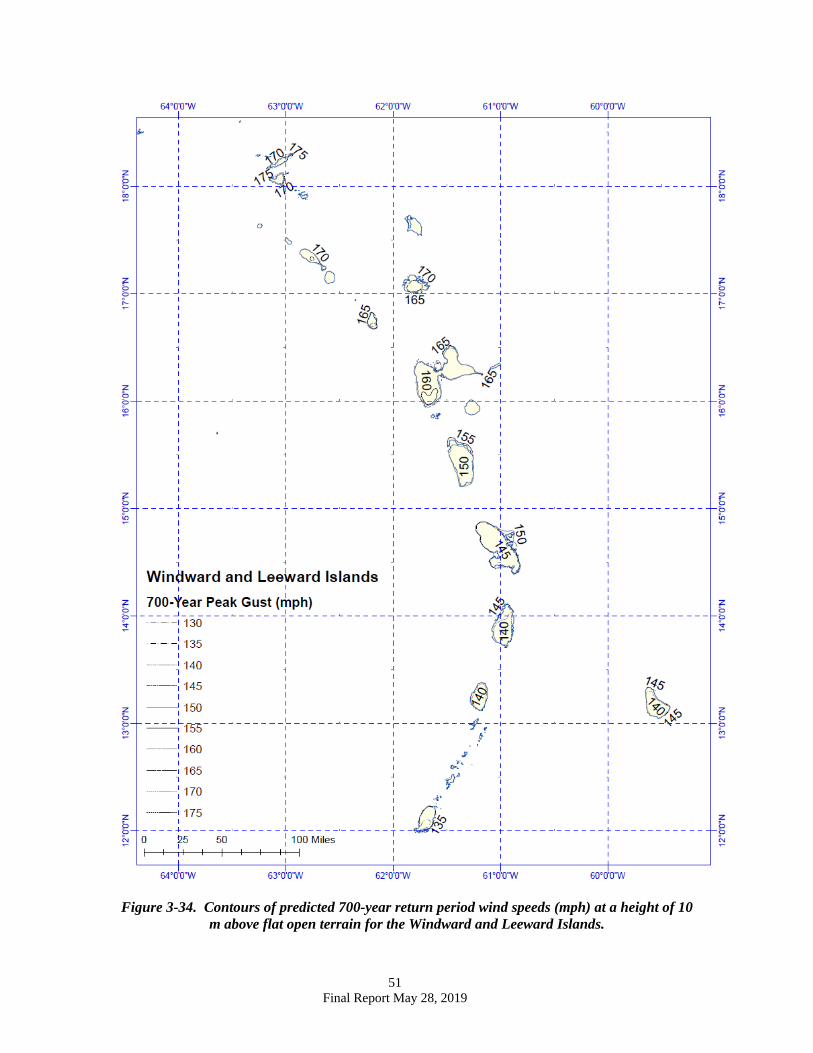
Figure 3-34. Contours of predicted 700-year return period wind speeds (mph) at a height of 10
m above flat open terrain for the Windward and Leeward Islands.

52 Final Report May 28, 2019
Figure 3-35. Contours of predicted 1,700-year return period wind speeds (mph) at a height of
10 m above flat open terrain for the Windward and Leeward Islands.

53 Final Report May 28, 2019
Figure 3-36. Contours of predicted 3,000-year return period wind speeds (mph) at a height of
10 m above flat open terrain for the Windward and Leeward Islands.

54 Final Report May 28, 2019
Figure 3-37. Contours of predicted 300-year return period wind speeds (mph) at a height of 10
m above flat open terrain for the Turks and Caicos Islands
55 Final Report May 28, 2019
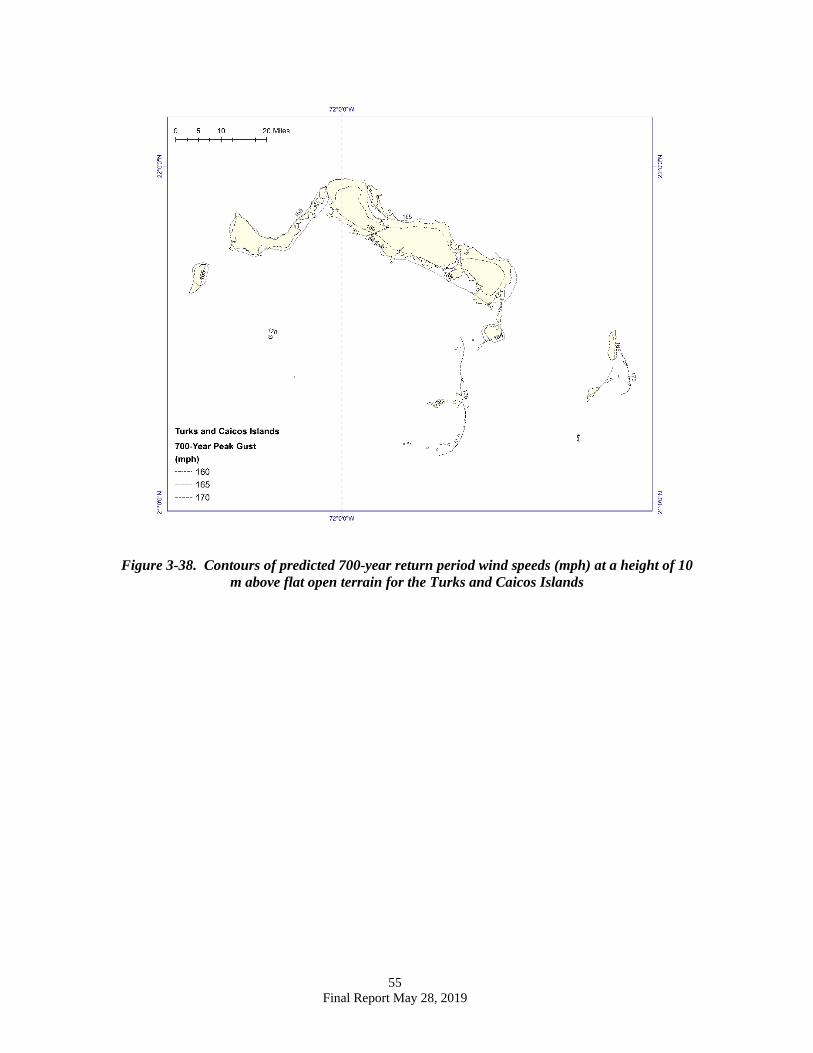
Figure 3-38. Contours of predicted 700-year return period wind speeds (mph) at a height of 10 m above flat open terrain for the Turks and Caicos Islands
56 Final Report May 28, 2019
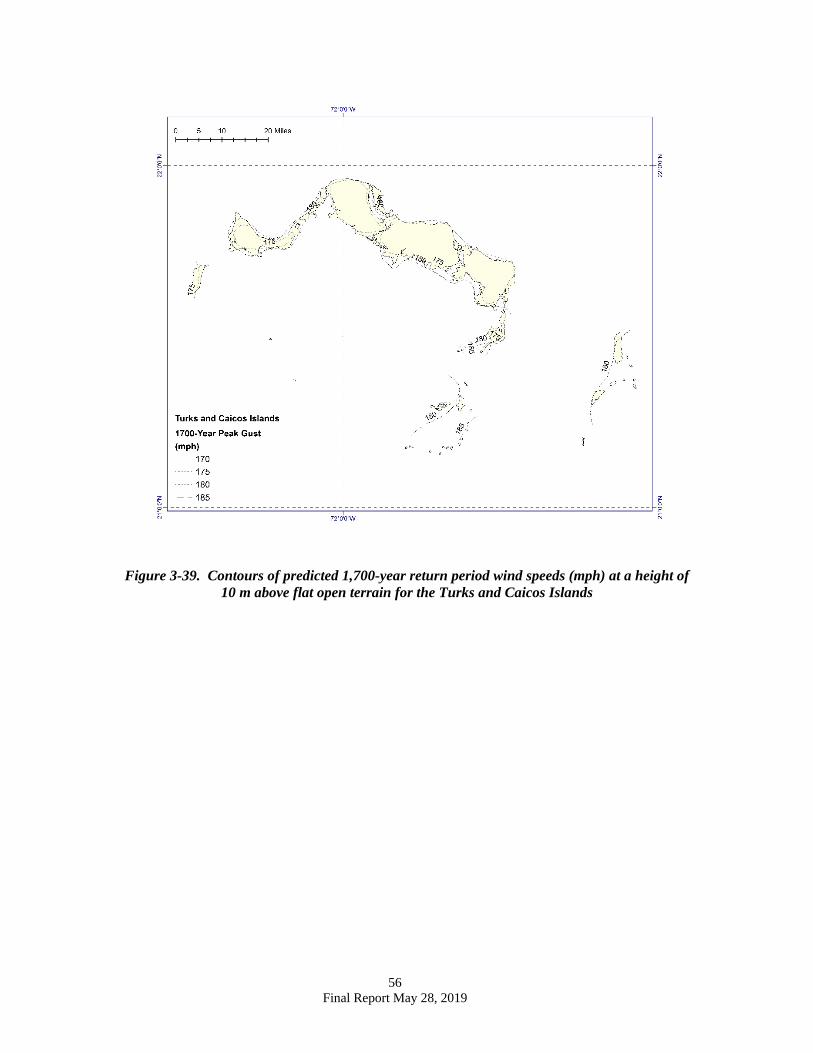
Figure 3-39. Contours of predicted 1,700-year return period wind speeds (mph) at a height of
10 m above flat open terrain for the Turks and Caicos Islands
57 Final Report May 28, 2019
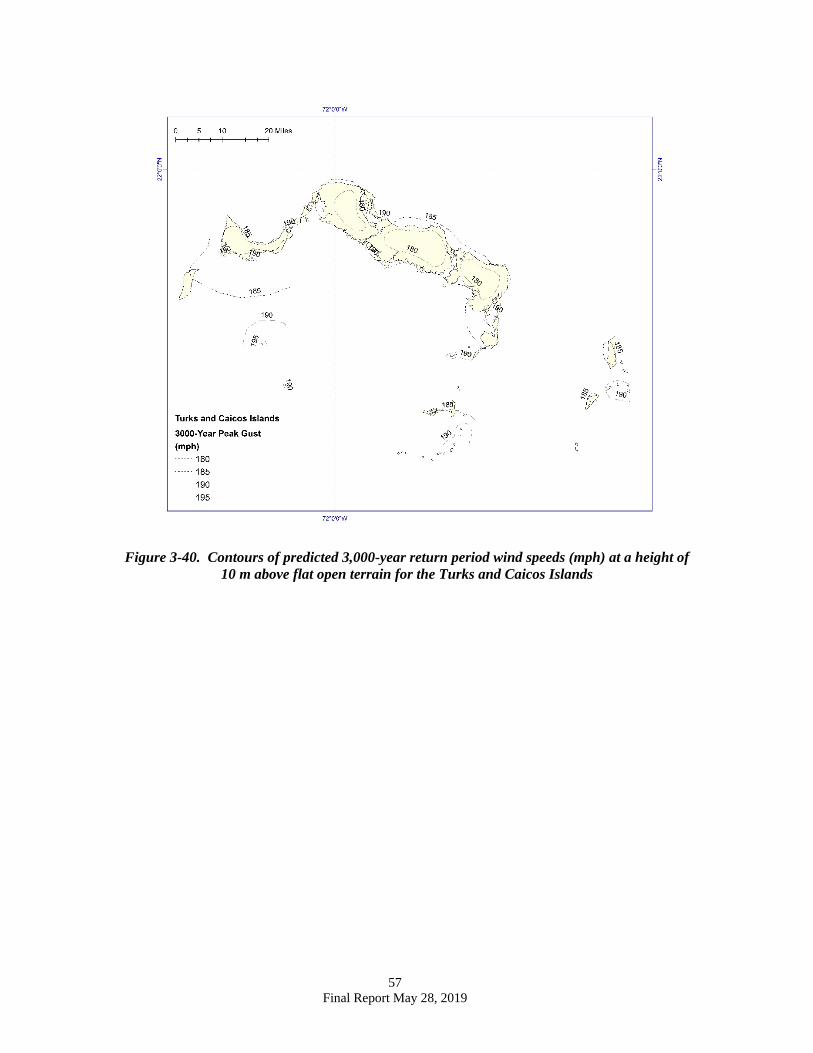
Figure 3-40. Contours of predicted 3,000-year return period wind speeds (mph) at a height of
10 m above flat open terrain for the Turks and Caicos Islands

58 Final Report May 28, 2019
Figure 3-41. Contours of predicted 300-year return period wind speeds (mph) at a height of 10
m above flat open terrain for the Bahamas

59 Final Report May 28, 2019
Figure 3-42. Contours of predicted 700-year return period wind speeds (mph) at a height of 10
m above flat open terrain for the Bahamas

60 Final Report May 28, 2019
Figure 3-43. Contours of predicted 1,700-year return period wind speeds (mph) at a height of 10 m above flat open terrain for the Bahamas

61 Final Report May 28, 2019
Figure 3-44. Contours of predicted 3,000-year return period wind speeds (mph) at a height of 10 m above flat open terrain for the Bahamas
62 Final Report May 28, 2019
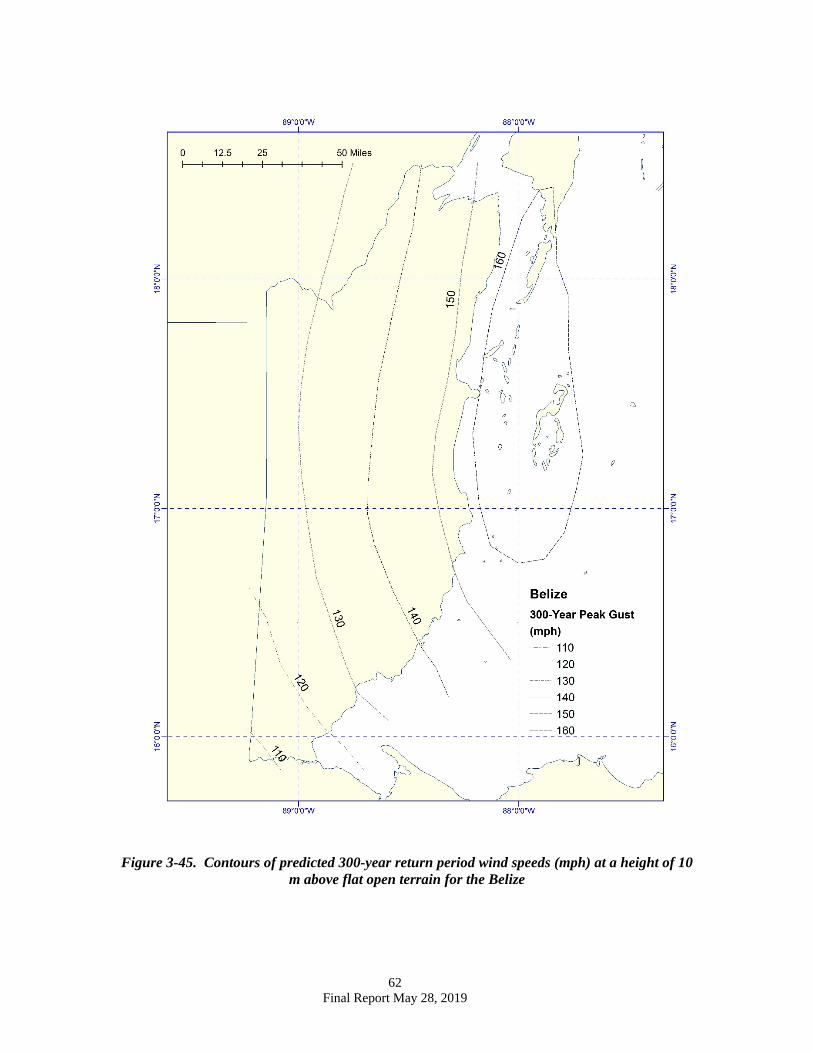
Figure 3-45. Contours of predicted 300-year return period wind speeds (mph) at a height of 10 m above flat open terrain for the Belize
63 Final Report May 28, 2019
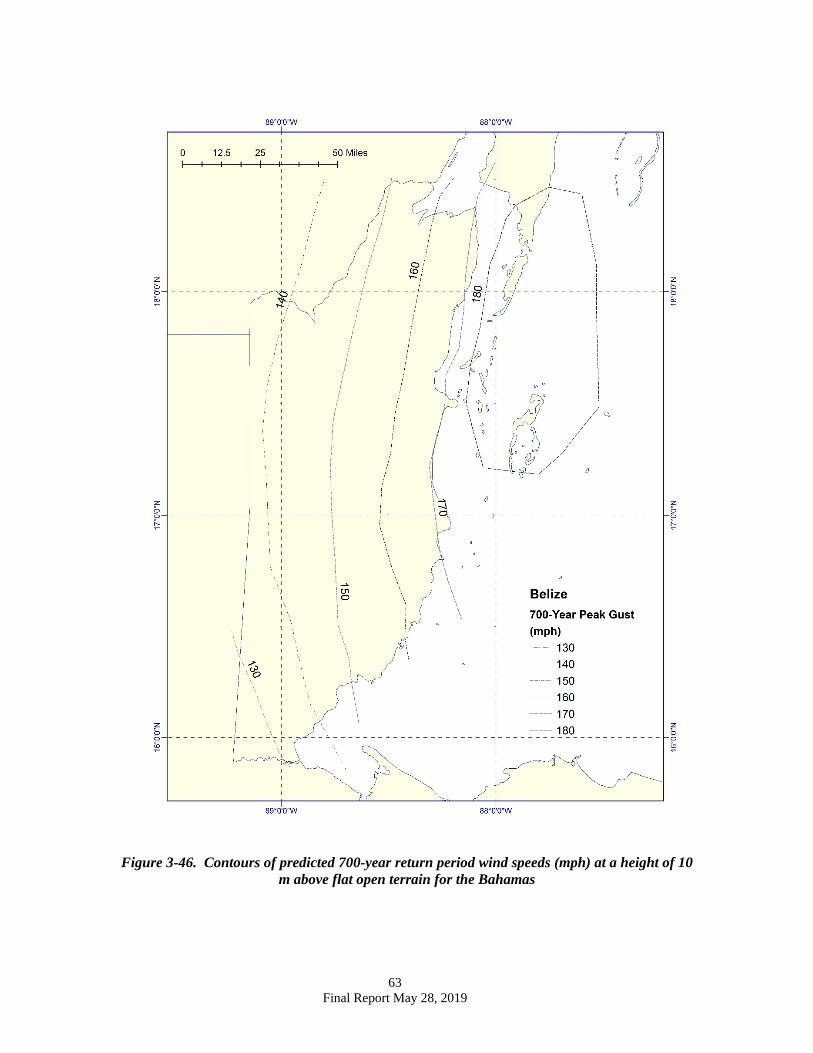
Figure 3-46. Contours of predicted 700-year return period wind speeds (mph) at a height of 10 m above flat open terrain for the Bahamas

64 Final Report May 28, 2019
Figure 3-47. Contours of predicted 1,700-year return period wind speeds (mph) at a height of 10 m above flat open terrain for the Bahamas
65 Final Report May 28, 2019
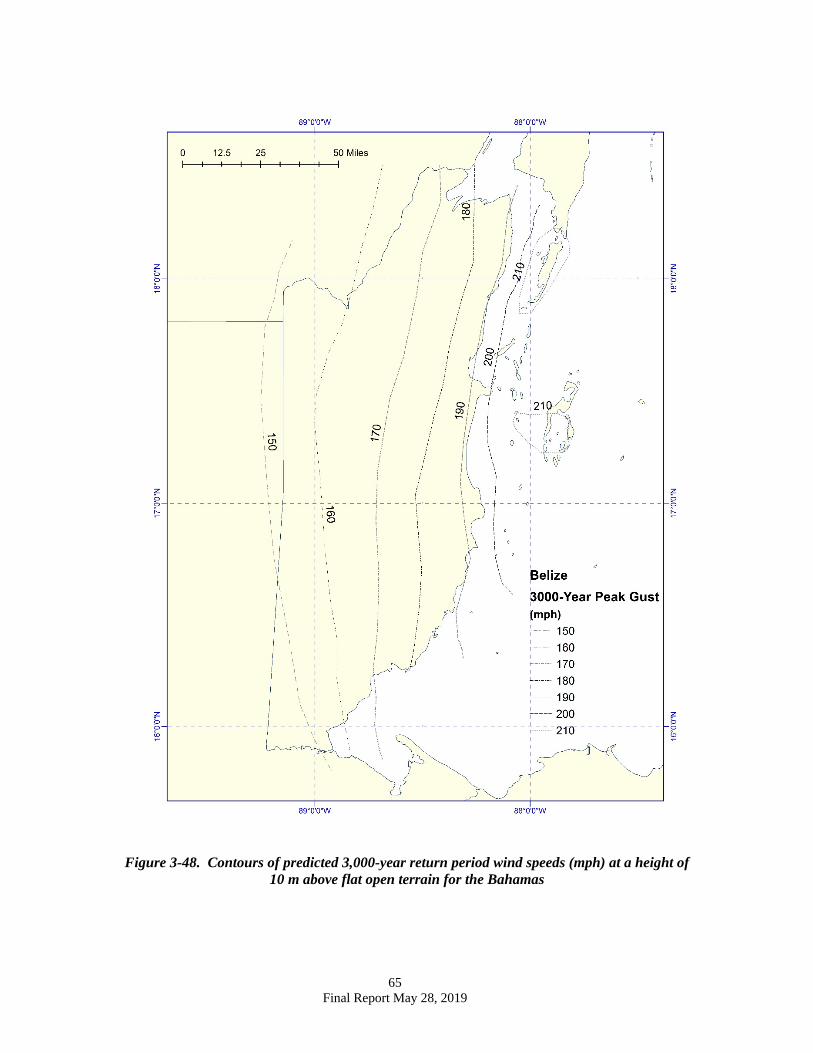
Figure 3-48. Contours of predicted 3,000-year return period wind speeds (mph) at a height of 10 m above flat open terrain for the Bahamas

66 Final Report May 28, 2019
Figure 3-49. Contours of predicted 300-year return period wind speeds (mph) at a height of 10 m above flat open terrain. Wind speeds are representative of a single point located at a distance
of 1 km from the coast in all wind directions.
67 Final Report May 28, 2019
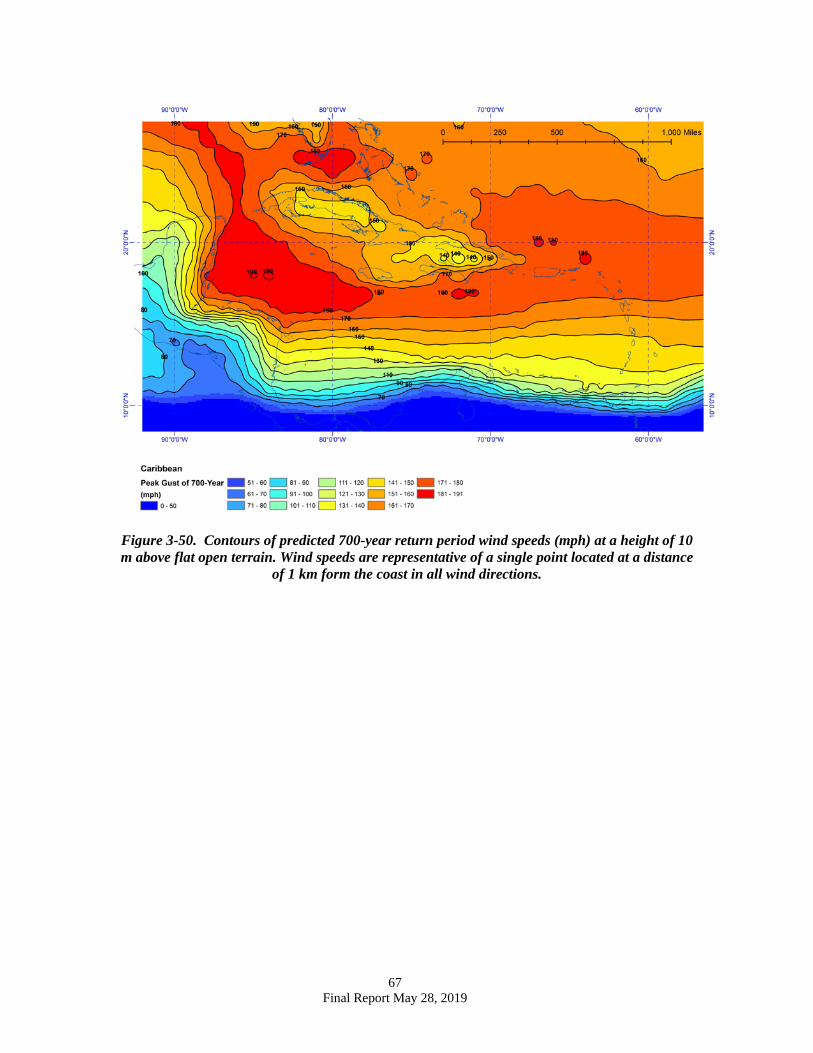
Figure 3-50. Contours of predicted 700-year return period wind speeds (mph) at a height of 10 m above flat open terrain. Wind speeds are representative of a single point located at a distance
of 1 km form the coast in all wind directions.
68 Final Report May 28, 2019
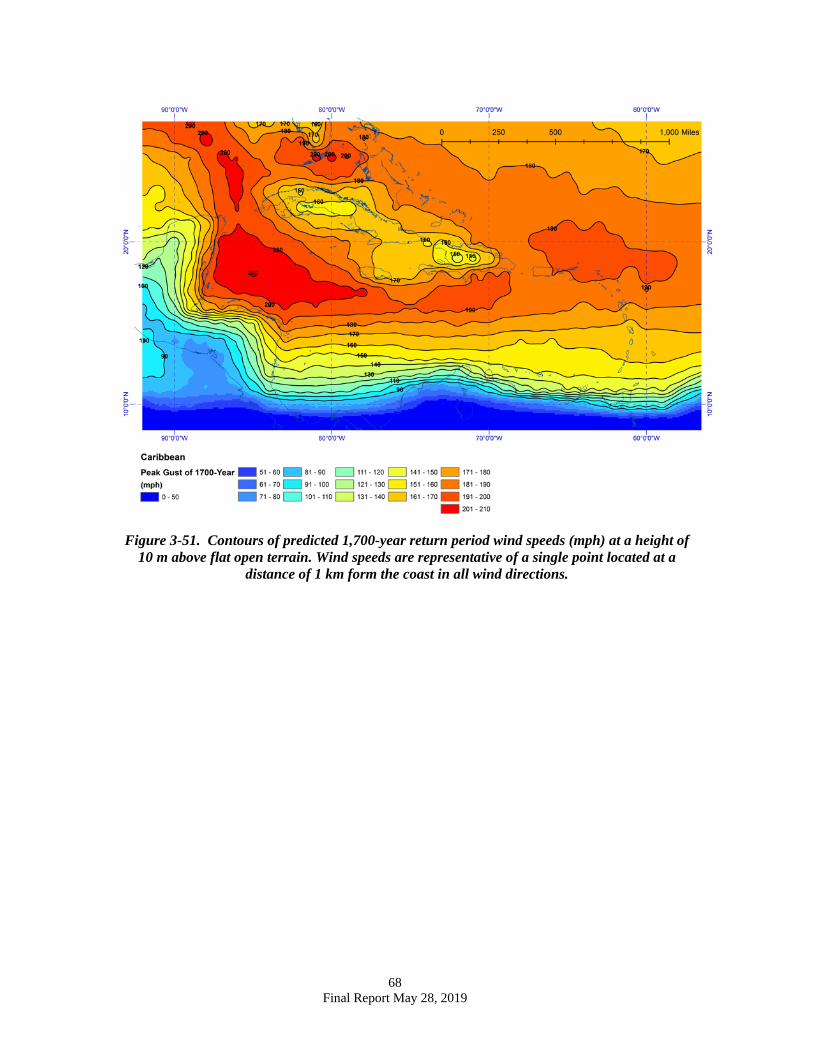
Figure 3-51. Contours of predicted 1,700-year return period wind speeds (mph) at a height of 10 m above flat open terrain. Wind speeds are representative of a single point located at a
distance of 1 km form the coast in all wind directions.

69 Final Report May 28, 2019
Figure 3-52. Contours of predicted 3,000-year return period wind speeds (mph) at a height of 10 m above flat open terrain. Wind speeds are representative of a single point located at a
distance of 1 km form the coast in all wind directions.