Design Tools 6. Introduction 6.1. - Facades · PDF fileand richer graphic output options ......
19
Daylighting design is a creative process. It aims to generate appropriate architectural and/or technical solutions to achieve an enjoyable and productive built environment while simultaneously reducing the energy consumption of buildings through the substitution of daylight for electric light. Daylighting design is both an art and a science. Qualitative information and visual feedback on a given daylighting concept are usually as important for the building designer as the quantitative figures that reflect the engineering aspect of daylighting design. Design tools are intended to help designers with the qualitative and quantitative elements of daylighting design through features that commonly include: • visualisation of the luminous environment of a given daylighting design; • prediction of daylight factors in a space lit by diffuse daylight; • identification of potential glare sources and evaluation of visual comfort indices; • prediction of potential energy savings achievable through daylighting; • control of the penetration of the sun’s rays and visualisation of the dynamic behaviour of sunlight. By providing all information of this type, design tools play a significant role in the decision-making process that characterises daylighting design. These tools support designers throughout the sequence of decisions, from formulation of the daylighting concepts to final implementation of daylighting strategies and innovative techniques in real buildings. 6-1 design tools Design Tools 6. 6-2 Introduction 6.1.
Transcript of Design Tools 6. Introduction 6.1. - Facades · PDF fileand richer graphic output options ......

Daylighting design is a creative process. It aims to generate appropriate architectural and/or
technical solutions to achieve an enjoyable and productive built environment while
simultaneously reducing the energy consumption of buildings through the substitution of
daylight for electric light.
Daylighting design is both an art and a science. Qualitative information and visual
feedback on a given daylighting concept are usually as important for the building designer
as the quantitative figures that reflect the engineering aspect of daylighting design.
Design tools are intended to help designers with the qualitative and quantitative elements
of daylighting design through features that commonly include:
• visualisation of the luminous environment of a given daylighting design;
• prediction of daylight factors in a space lit by diffuse daylight;
• identification of potential glare sources and evaluation of visual comfort indices;
• prediction of potential energy savings achievable through daylighting;
• control of the penetration of the sun’s rays and visualisation of the dynamic
behaviour of sunlight.
By providing all information of this type, design tools play a significant role in the
decision-making process that characterises daylighting design. These tools support
designers throughout the sequence of decisions, from formulation of the daylighting
concepts to final implementation of daylighting strategies and innovative techniques in
real buildings.
6-1design tools
Design Tools 6.
6-2
Introduction 6.1.
6-2 daylight in buildings
Design tools must therefore fit the significant phases of architectural projects during
which important decisions regarding daylighting strategies are made. These tools must
suggest appropriate architectural solutions that meet the architectural objectives of the
project. The capability of design tools to analyse a given daylighting scenario, based on
a detailed physical description of the project, are especially significant when advanced
daylighting systems are considered.
This chapter gives an overview of the state of the art of daylighting design tools. Special
emphasis is placed on tools that address the advanced daylighting systems investigated by
IEA SHCP Task 21.
Simple design tools give a designer clues about basic design decisions without requiring
extensive time or detail. These tools are normally used to check performance or estimate
the impact of specific design elements on daylight performance in an early design stage.
They do not require advanced equipment or knowledge and thus non-experts can use them.
Simple tools cannot model complex daylighting strategies and therefore are not suitable
for fine-tuning daylighting designs.
Many traditional simple tools focus on the daylight factor as a design criterion; these tools
should only be used in predominantly cloudy climates. A new generation of “simple”
computer tools embodies complex evaluation models, though these tools are nonetheless
simple from the user’s point of view. A common characteristic of all simple daylighting
design tools is the restriction of input parameters to key design properties such as interior
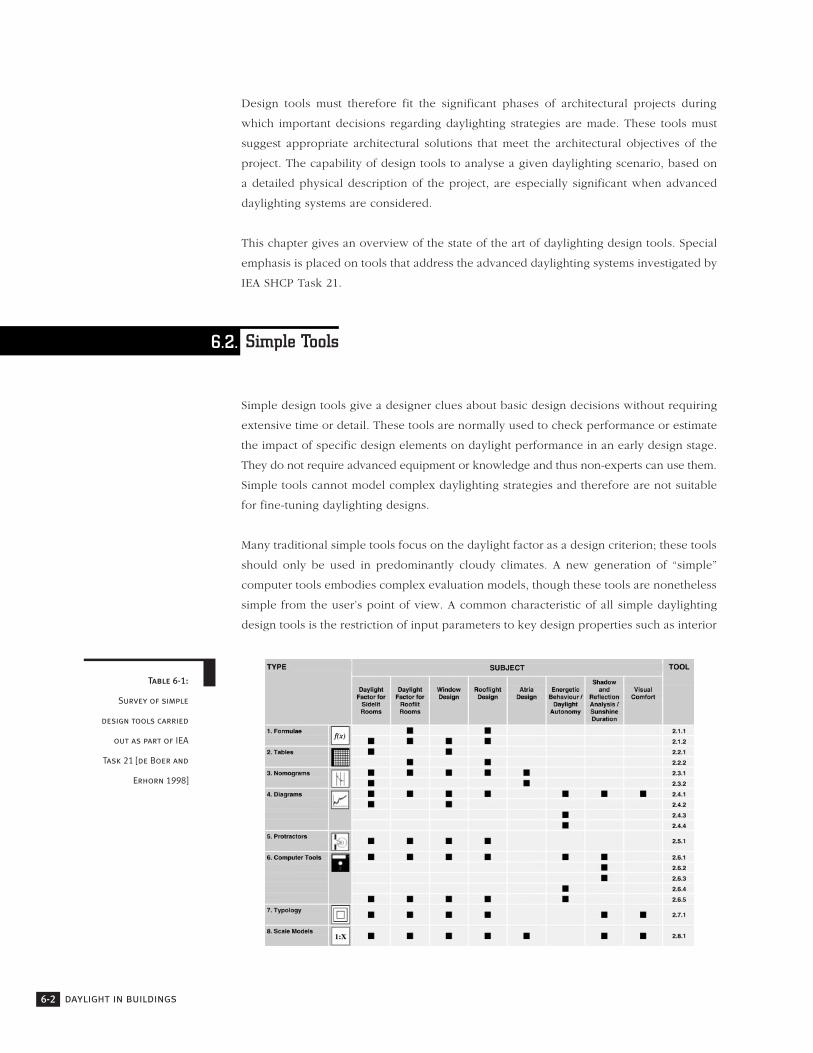
Table 6-1:
Survey of simple
design tools carried
out as part of IEA
Task 21 [de Boer and
Erhorn 1998]
Simple Tools6.2.

reflectance, the size and the location of windows and skylights, and the proportions of the
space and exterior obstructions.
Several surveys have been carried out during the past few years to identify the simple design
tools available to practitioners and to estimate the market impact of these tools [Baker et
al. 1993, McNicholl and Lewis 1994, Kenny and Lewis 1995, Aizlewood and Littlefair
1996]. Table 6-1 gives the results of one such survey, conducted recently as part of IEA
Task 21 [de Boer and Erhorn 1998].
Most of the tools listed in Table 6-1 are based on practical experience or simple calculation
methods, e.g., the lumen input method or the split-flux method [CIBSE 1987]. Although older
tools, such as empirical equations, tables, nomograms, diagrams, and protractors, reflect
historical conditions when computer technology was not available, new simple design tools
are typically computer-based.
Another category of simple tools is dedicated to estimating the impact of obstructions on
daylight availability at a construction site or on a facade. These tools generally provide a
method of superimposing a sun chart or daylight availability chart on a representation of
obstructions. Several instruments have been developed specifically for this purpose, but
none of them has had great success.
A fisheye lens with an equidistant projection offers a quick means of analysing obstructions.
When the camera is positioned at the location in question and the lens is pointed at the
sky’s zenith, the photograph is a circular representation of the sky hemisphere including
all obstructions. This photograph can be superimposed on a sun chart either manually or
by using a computer. Attention should be paid to precisely positioning the sun chart to
the true north of the location. The fisheye representation of the surroundings can also be
generated by using a computer-aided design (CAD) system rather than a camera. In this
case, all obstructions need to be included in the model.
Because decisions in the early stages of building design have a large impact on a building’s
daylight performance, simple design tools are essential to help designers navigate this phase.
Simple tools offer hints about key design parameters but cannot be used to evaluate a
strategy in detail or to model advanced systems.
With the advent of personal computers (PCs), powerful processors that can handle
complex calculation algorithms and lighting simulation techniques are available to nearly
all practitioners. In addition to the first generation of simple design tools, which were
translated into numerical programmes, several new pieces of software have been developed
since the 1980s to address the complexity of light propagation into building spaces.
Computer-Based Tools 6.3.
design tools 6-3

6-4 daylight in buildings
Many of these pieces of more complex software were developed by researchers for main-
frame computers: They have fewer limitations than simple tools in their ability to address
the geometry and the photometry of the modeled architectural space and they offer more
and richer graphic output options (e.g., illuminance contours and mapping). Image-based
daylighting computer tools have improved these output features by providing synthetic
imaging of modeled spaces.
Most of these tools have now been ported to the PC world, mainly for Microsoft Windows
operating systems. Some of them have also been linked to commonly used architectural
CAD programmes, whose graphical means for entering geometric data are much easier to
handle than the conventional numerical input for xyz-coordinate systems used in most of
the older stand-alone daylighting tools. Some tools offer more elaborate graphical user
interfaces which significantly facilitate and speed up the daylighting design and
Table 6-2:
Overview of
daylighting computer
design tools
[Lighting Design and
Application 1996]

Figure 6-1:
Surface elements
exchanging
light (or radiant
energy) in the
radiosity method
6-5design tools
analysis process. Pre- and post-processors extend the capabilities of the core lighting
algorithms — for instance enabling one to link daylighting analysis with the building
energy simulation.
Recent surveys have shown that these tools are increasing in number and use for
architectural design. Table 6-2 gives an overview of the existing daylighting computer design
tools in the more complex category. More recent overviews can be found in the IES
publication, Lighting Design and Application, and in other publications.
Two main categories of computer-based tools can be distinguished based on the calculation
methods they use: the radiosity technique and the ray-tracing technique.
6.3.1. Radiosity Method
The radiosity method is probably one of the first lighting calculation techniques applicable
to the evaluation of the interchange of light among all the surfaces defining an architectural
space. This method has a significant advantage over former analytical techniques because
it allows for light inter-reflections between surface walls.
Originally developed for energy calculations, the radiosity method was used to determine
the energy balance of a set of surfaces exchanging radiant energy (Figure 6-1). Some of
its basic hypotheses and limitations are that:
• wall surfaces must be subdivided into small finite elements characterised by
homogeneous photometric properties (e.g., reflection coefficient);
• all elements must be perfect diffusers (Lambert’s law);
• similar hypotheses must be applied to all of the external obstructions situated in
front of windows and openings.
The radiosity method is used to determine the
illuminance and luminance of a set of points
located at the centres of different surface
elements. This determination can be made
independent of view, before any surface
rendering is made from a desired viewpoint.
The SUPERLITE programme was one of the
first widely available daylighting computer
tools based on the radiosity method. The
current version can handle both daylighting
and electric lighting as well as rather complex room geometries (e.g., L-shaped rooms).
Only perfectly diffusing surfaces can be considered; glazings can be transparent or
diffusing, and windows can have shades.

6-6 daylight in buildings
Figure 6-2 gives an example of a visualisation of a daylighting calculation created
using the radiosity method (SUPERLITE programme): Surface finite elements are visible in
the picture.
In spite of its weaknesses, the radiosity method has some advantages compared to the other
well-known image rendering method, the ray-tracing technique. These include the radiosity
method’s view-independent calculation and the pre-eminence of major light sources in the
images it renders.
6.3.2. Ray-Tracing Techniques
The ray-tracing technique determines the visibility of surfaces by tracing imaginary rays
of light from a viewer’s eye to the objects of a rendered scene. A centre of projection (the
viewer’s eye) and an arbitrary view plane are selected to render the scene on a picture
plane. Thanks to the power of novel computer algorithms and processors, millions of light
rays can be traced to achieve a high-resolution rendered picture.
Originally developed for imaging purposes, some ray-tracing programmes (e.g., RADIANCE,
GENELUX, and PASSPORT) were adapted and optimised for calculation of daylighting
within building spaces [Ward and Rubinstein 1988]. In this case, light rays are traced until
they reach the main daylight source, which is usually the sun position (clear and
intermediate skies) or the sky vault (cloudy skies). Figure 6-3 illustrates the principle of
ray tracing, showing the viewpoint (P) and view direction of the observer as well as the
main light source, represented by the sun.
Figure 6-2:
Visualization of a
daylighting calculation
made using a program
that relies on the
radiosity method
[Compagnon 1993]

6-7design tools
Most daylighting and electric lighting calculation programmes currently use this backward
ray-tracing technique (from the viewpoint to the source). A slightly different technique is
used by some software to improve daylighting calculations, especially for clear sky
conditions (with sun). A forward rather than backward ray-tracing technique is used by
the GENELUX programme to follow rays from the light source to a scene.
The principal features of the ray-tracing technique for all types of light calculations are the
following:
• the method accounts for every optical phenomenon that can be analytically
expressed by physical equations;
• the method can consider specular materials, like window panes and glossy
surfaces;
• the method can effectively simulate non-homogeneous textures and surface
points.
Thanks to their large range of applications, ray-tracing techniques play a significant role
in the design and simulation of advanced daylighting systems. Figure 6-4 shows the
numerical simulation of a room equipped with two different daylighting systems (a
conventional window pane and a zenithal anidolic collector) created by a programme using
a backward ray-tracing technique (RADIANCE); this simulation allows comparison of the
luminous performance of the two daylighting systems.
Figure 6-3:
Tracing light rays
from the viewpoint,
P, to different
surfaces and to the
main light source
(the sun)

6-8 daylight in buildings
Figure 6-4:
Computer simulation
and image of an
office space created
using a ray-tracing
technique.
Top: Reference
room with double-
pane window
Bottom: Anidolic
zenithal collector
Several validations of ray-tracing programmes have demonstrated their reliability for
daylighting performance assessment and advanced systems design [Compagnon 1993,
Fontoynont 1999].
6.3.3. Integrated Software Environments
The use of daylighting and artificial lighting simulation programmes to calculate complex
systems and models in the design practise often is impeded by the fact that the
operation of these programmes, especially the model input, is extremely complicated and
time-consuming. Programmes that are easier to use generally do not have the calculation
capabilities required in practise. A second obstacle arises as the lighting calculations
often do not allow any statements regarding the interactions with the energy and thermal
building performance.

6-9design tools
Both problems are mainly due to a lack of integration of the design tools of other building
design practitioners as well as to insufficient user interfaces. The programme package
ADELINE (Advanced Daylight and Electric Lighting Integrated New Environment) [Erhorn
and Dirksmöller 2000] which has been further developed in the scope of IEA SHC Task
21 presents a promising approach to solving these problems.
The objective was to develop an integrated lighting analysis tool for building design
purposes which is intended to assist the building designer and consultant in all issues
associated with daylighting and electric lighting design. The general structure of the
integrated programme system is depicted in Figure 6-5. The lighting calculations are
executed using the algorithms of Superlite and Radiance. Several different pre- and post-
processors around these core algorithms facilitate daylighting design and analysis during
different design stages:
Simple Input
Early design phases account for the basic and often irreversible decisions concerning the
daylight supply. The general floor layout, size and position of daylight openings decide
whether daylight supply is sufficient or not. A tool to be used at this stage thus should allow
for fast handling and quick access to the requested information while avoiding complex
geometric modeling. ADELINE supports, as shown in Figure 6-6, a set of simple floor plan
layouts which rely only on parametric input. Daylighting studies and design parameter
variations can be performed in a fraction of the time usually required when applying CAD
tools. The parametrically defined layouts can be used within ADELINE as starting point for
more complex models.
Graphical Scene Editor
The graphical scene editor, depicted in Figure 6-7, allows for an interactive graphical
composition of models made up of different predefined objects. Single objects or groups
of objects can be copied, translated, rotated, and scaled. The graphical representation is
based on a wire frame representation with hidden line removal. The scene editor gives direct
access to libraries of furniture, materials, and luminaires. Views which will later be
rendered can be defined — camera-like — directly in the wire frame representation.
Object Libraries
A material database with numerous opaque and transparent or translucent materials is
included. Access to luminaire databases is provided. Using furniture in simulations enables
more realistic and representative visualisations. Individual libraries can be established or
existing ones can be used. More than 350 objects such as tables, chairs, and office
equipment, Figure 6-8, can be selected from a furniture library to allow for representative
visualisations. Selection and preview dialogues allow the convenient placement and
arrangement of objects within the graphical scene editor.

6-10 daylight in buildings
Figure 6-5:
ADELINE 3
Programme System
Comprehensive Graphical Output
Light distributions can be displayed through either two- or three-dimensional graphics, and
results are given as iso-lux or iso-daylight-factors curves as depicted in Figure 6-9. Light
penetration can be analysed through two-dimensional sections of the building. This is very
powerful for estimating the impact of each opening. Radiance renderings allow for detailed
illuminance and luminance analysis as shown in Figure 6-12.
Integrated Energy Approach
SUPERLINK and RADLINK are programmes used to obtain estimates of the interaction
between daylighting, artificial lighting, and the dynamic thermal building performance. The
simulation is based on daylighting calculations with SUPERLITE or RADIANCE. SUPERLINK
and RADLINK produce hourly values for additional artificial lighting input into a building
over a complete year, taking into account:
• several lighting control strategies,
• different lamp types,
• desired work surface illuminance,
• user-defined work schedule,
• hourly sunshine probability.
A typical outcome of this calculation is shown in Figure 6-10. The hourly lighting energy
input can be used to perform hourly thermal simulation with dynamic building simulation
programs such as tsbi5, SUNCODE, DOE2, or TRNSYS.

Figure 6-7:
Wire Frame
representation
of Radiance
Scene Editor
6-11design tools
Figure 6-6:
Parametrically
definable basic
geometries of
the Simple
Input Mode
Figure 6-8:
Examples from
the luminaire
and furniture
database
Figure 6-9:
Iso-contour line
representation
of illuminances in
a working plan

6-12 daylight in buildings
6.3.4. Simple Computer-Based Calculation Tools
From a user’s point of view, the main differences between the advanced computer tools
described above and simple computer-based tools are that the latter allow less freedom
in the complexity and detail of input, and the results are less accurate. Most simple tools
can only handle shoe-box type room geometry, and many permit daylight apertures in only
one wall. Input for these programmes may, however, be very easy.
Simple computer-based design tools can only handle calculations for diffuse skylight,
CIE or uniform luminance distribution or both. The algorithms commonly used for
direct sky and external reflected components are based on the solid angle formulas
derived from double integrals [Hopkinson et al. 1966]. Some tools have “computerised”
simple manual tools, such as BRS protractors, Waldram diagrams, or other diagrams or
tables. For the internal reflected component, these tools will often rely on the BRS split
flux or other applications of the integrating sphere theory, sometimes with some
sophisticated corrections added.
These programmes can produce highly accurate direct and external reflected component
calculations given that the cases to be analysed have very simple geometry. Serious
inaccuracies may, however, result in calculation of the internal reflected component. In
the critical dark deep zones of a room, this component is a major contributor to the daylight
factor. Thus, simple calculation tools have problems with accuracy in this zone.
Although computer design tools can play a substantial role in daylighting design, most
are more appropriate for analysis of daylighting performance. An accurate physical
description is often required for the device to be analysed (e.g., for ray-tracing simulation)
at stages where designers usually need suggestions for appropriate architectural and
technical solutions.
Figure 6-10:
Annual electrical
energy saved as a
function of different
daylight-dependent
artificial lighting
control strategies
results calculated
with SUPERLINK

Figure 6-11:
Fuzzy
characterisation
of the brightness
of walls using
fuzzy subsets
6-13design tools
To overcome this problem and provide users with optimal support during different design
phases, daylighting decision tools were developed based on the theory of information [Paule
et al. 1995]. Fuzzy logic was used to offer the possibility of characterising room geometry
and photometric properties through linguistic values (fuzzy subsets) (Figure 6-11).
The international version of the program LESODIAL, which was developed as part of IEA
Task 21, uses this novel approach. Based on fuzzy logic, this daylighting decision tool,
described in Figure 6-12, has the following features:
• it takes into account imprecise parameters, expressed in vague terms, during
architectural pre-design phases;
• it facilitates problem description through graphical and linguistic expressions;
• it uses fuzzy inference rules to give daylighting diagnosis and recommendations
for a design;
• it compares and outranks architectural reference objects by means of fuzzy
outranking relations from a building database.
In addition, the programme calculates daylight factors and the percentage of the year when
daylight is sufficient by means of an analytical (BRE split-flux) method and statistical climate
data. Diagnosis and recommendations to improve the daylighting design are provided in
the form of graphics and verbal comments. A vocabulary of lighting terminology helps
designers to use the programme with very little tutoring.
Figure 6-12:
Flow chart of
a daylighting
decision tool
based on
fuzzy logic

6-14 daylight in buildings
Table 6-3:
Scale choice as a
function of
daylighting design
purpose
Scale models of buildings are used all over the world for daylighting design. The main
advantages and interest of this approach compared to other design methods are that:
• architects use scale models as design tools to study various aspects of building
design and construction;
• it is a “soft technology,” well known to and shared by architects and other
building professionals;
• when properly constructed, scale models portray the distribution of daylight within
the model room almost as exactly as in a full-size room.
All these features are a result of the extremely small size of light wavelengths (380–780
nanometers). Thus, the physical behaviour of light is absolutely the same for a 1 m2 area
in a full-size room as it is for the corresponding 4 cm2 area of a 1:50 scale model. In other
words, even the smallest of scale models can produce very accurate results.
Construction of a model must be preceded by choice of an appropriate scale, which is
directly related to the model’s particular purpose. Scales ranging from 1:500 to 1:1 can be
considered, as shown by the different activities undertaken as part of IEA Task 21.
Table 6-3 summarises the possible scale choices.
Common rules must be applied, however, in the construction of any model, whatever its
scale. The principal rules are:
Materials
• the walls of the model must be absolutely opaque, and all the joints must be
light proof;
Physical Models6.4.

6-15design tools
• model parts must be movable or replaceable to facilitate comparison of
configurations and allow for the placement of sensors and cables;
• Optical properties of internal (walls, ceiling, and floor) and external surfaces must
be as close as possible to those of the planned building;
• model glazing materials, i.e., thin sheets of glass or clear plastic, should be used
in apertures if the angle of incidence transmissivity of glass is expected to be
important for the distribution of daylight in the internal spaces;
• geometry and sizes must be as accurate as necessary to permit consideration of
the design questions.
Other Criteria
• the overall dimensions and weight of the model must be such that it can be
supported (e.g., on a heliodon) or moved (e.g., movable mock-up rooms);
• the size of the model must be reasonable with regard to the distance to light
sources (e.g., 0.6 m in height for a 5-m-diameter sky dome);
• the fixing of the model parts should be strong enough to allow different
movements (e.g., mock-up rooms) and even vertical positions (e.g., heliodon);
• access to the model’s interior, through apertures or removable parts, must be
possible for placing illuminance sensors or imaging devices.
Because of the difficulty in meeting all these requirements, physical modeling generally
achieves relative rather than absolute results. The search for relative improvements in
performance is thus a more appropriate goal than attempting to obtain accurate quantitative
measurements.
These difficulties are even more important when models are placed under real sky
conditions and not under sky or sun simulators, for example, in the case of on-site
performance assessment and for mock-up room measurements, which depend upon the
sky luminance distribution at the site. The use of a reference facade in conjunction with
the facade is necessary to overcome this difficulty and produce a relative performance
assessment. Indoor and outdoor testing situations will be considered in the following
sections.
6.4.1. Sky Simulators
Sky simulators have been used for decades in daylighting design studies. Their main
advantage is that they offer reliable and reproducible conditions that simulate daylighting
under real skies. To allow comparisons among daylighting design studies carried out on
different simulators, normalised sky luminance distributions (so-called “standard skies”)
are used. Table 6-4 gives an overview of the principal sky simulator configurations.

6-16 daylight in buildings
Table 6-4:
Principle sky
simulator
configurations
Some proposed new sky simulator configurations are based on a scanning process
[Tregenza 1989, Michel et al. 1995]. Of these, one uses a scanning process to rebuild the
overall sky hemisphere, starting with a sixth of a hemisphere. This novel apparatus,
shown in Figure 6-13, was used in IEA Task 21. Its numerous advantages are summarised
in Table 6-4.

6-17design tools
The novel principle on which the scanning sky simulator is based allows accurate
reproduction of the luminance distributions of every type of sky. Some of these distributions,
standardised by the CIE recommendations, are described by analytical functions. These
distributions are used in daylighting studies and, although theoretical, have the important
Figure 6-13:
View of the EPFL
scanning sky
simulator
(Switzerland),
above, and the BRE
mirror sky
(UK), below

6-18 daylight in buildings
Table 6-5:
Principle quantifiable
criteria that depend
on occupants
advantage of allowing comparison of results internationally. The main “standard skies” that
can be reproduced on the simulator are:
• isotropic (uniform) sky
• CIE overcast sky
• CIE clear sky
• CIE intermediate sky
It is possible to reproduce statistical skies in addition to the different standard skies.
Illuminance and luminance distributions of real sky measurements have been made
available through the International Daylight Measuring Program (IDMP). The processing
of these data allows the development of statistical skies that are representative of the
daylight in a particular area. Monthly average skies as well as dynamic daily skies can be
reproduced this way.
6.4.2. Full-Scale Test Rooms
Many quantitative daylighting design parameters can be assessed and optimised using scale
models and simulators. Daylighting projects, however, have not only quantitative objectives
(providing light, saving energy, etc.), but also qualitative requirements (perception of space,
visual comfort, etc.). Some of these qualitative requirements can be formally expressed using
structured, available scientific knowledge, including:
• perception and visual adaptation (ergo-ophthalmology)
• visual comfort and performance (visual ergonomy)
• light propagation, transmission, and reflection (photometry)
Several “occupancy-dependent” criteria and figures, which can be measured by appropriate
physical instruments, can be outlined, which will lead to a relatively objective assessment
of the human response to the luminous environment. Table 6-5 summarises the principal
quantifiable figures that depend on occupants.
Most of these quantifiable figures cannot, unfortunately, be assessed or measured in scale
models because neither the occupants nor some objects that make up the luminous
environment can be reduced in size (documents, view out, etc.). Full-scale test rooms in
outdoor conditions must be used (see Appendix 8.4).
Because lighting conditions depend on the variable luminance distribution of the sky vault,

two modules must generally be constructed:
• one is used as a reference room and equipped with a conventional facade
(double glazing);
• the second is used as a test room and features novel daylighting systems.
A designer can optimise a daylighting system and room configuration using the assessment
data. Most of the information gained by this procedure can be used to increase user
acceptance of the designed system in the real building.
Design tools play a significant role in the decision-making process that characterises
daylighting design in a building project. These tools support designers through the
sequence of decisions that leads from original daylighting concepts to their final
implementation in a building.
To be efficient and accepted by practitioners, design tools must fit the most significant
phases of the architectural projects where crucial decisions regarding daylighting strategies
are made. These tools might even propose appropriate options.
Different types of daylighting design tools are available today for practitioners, providing
qualitative and quantitative information. These tools include:
• simple tools, which are most appropriate for early design phases and are best
suited for basic design problems;
• computer-based tools, which can handle advanced daylighting systems and
provide a vast variety of output (images, visual comfort calculations, etc.);
• physical models, which are well-known and shared by architects and other
building professionals.
No design tool will ever replace designers themselves, who must make the choices
involved in the daylighting design of a building. However, these tools can accompany the
designer in a creative process of devising an enjoyable and productive built environment
while saving energy through the use of daylighting.
6-19design tools
Conclusion 6.5.