Design of Power Wireless Private Network Coverage ...
8
Design of Power Wireless Private Network Coverage Prediction System Qianke Ai 1, a , Wenjiang Feng 2, b , Weinong Wu 1, c , Yuxiang Liu 2, d , Guojin Liu 2, e , Taotao Bao 2, f 1 ICT Branch of Chongqing Electric Power Corp Chongqing, China 2 College of Communication Engineering of Chongqing University Chongqing, China a [email protected], b [email protected], c [email protected], d [email protected], e [email protected], f [email protected]. Abstract. In this paper, according to the practical needs of the electric power wireless network coverage prediction, a propagation model based on real data and revised statistical prediction model (SPM) is proposed to predict the spatial field intensity distribution of the base station and improve the rationality and efficiency of the network planning and construction. The optimal parameters of SPM model parameters are obtained by least square method. On this basis, the coverage prediction with geographic information is proposed. The simulation results show that compared with SPM and LAP model, the proposed scheme can effectively analyze the signal loss intensity around the base station at any location in the map, so as to solve the signal planning problem of the base station. Keywords: radio wave propagation model, coverage prediction, geographic information system. 1. Introduction In recent years, with the rapid advancement of China's smart grid construction, the State Grid and China Southern Power Grid have built a few of 230MHz, 400MHz and 1.8GHz LTE wireless private networks to support the information construction of the distribution of electricity business. The information management level of the power industry has been improved by this power wireless private networks. However, the network planning, construction and operation and maintenance of the above wireless private are built based on experience in the field of coverage prediction, base station location and resource allocation. The base station is randomly selected in two aspects: firstly, the handheld GPS receiver is used to measure the geographical location of the base station. Secondly, the coverage distance and area are visually observed. In the operation and maintenance process, the base station adjustment and relocation is lack of theoretical analysis. Actually, radio wave coverage prediction plays a significant role in base station location selection, the interference analysis, frequency allocation and resource allocation [1]. Radio wave propagation characteristics analysis is important for the design and deployment of power wireless private networks in a specific topographical distribution environment [5]. The coverage prediction of radio waves has been frequently analyzed, and some empirical models of radio wave propagation have been presented [6,7,8,9,10]. These methods can be classified into three categories: theoretical analysis, experimental fitting and computer simulation. In urban, mountainous and indoor scenes, the theoretical analysis method is used in the complex and variable propagation environment with large scale of the scatter and the uneven distribution, resulting in very expensive of computational complexity. The experimental fitting method builds the mathematical model with statistical characteristics through the measured data. The typical model are the follows, Okumura[11], Hata[12] and LEE[13],etc. However, the empirical model is implemented by establishing statistical models from measured data, which is subject to many constraints. The model should be adjusted according to the application environment. Computer simulation method utilizes computer simulation technology to simulate the radio wave propagation process, which can deal with the measured big data with geographical attributes when combined with the experimental fitting method, resulting in effectively predicting the service area, coverage boundary and coverage intensity. 3rd International Conference on Mechatronics Engineering and Information Technology (ICMEIT 2019) Copyright © 2019, the Authors. Published by Atlantis Press. This is an open access article under the CC BY-NC license (http://creativecommons.org/licenses/by-nc/4.0/). Advances in Computer Science Research, volume 87 335
Transcript of Design of Power Wireless Private Network Coverage ...

Design of Power Wireless Private Network Coverage Prediction System
Qianke Ai1, a, Wenjiang Feng2, b, Weinong Wu1, c, Yuxiang Liu2, d, Guojin Liu2, e,
Taotao Bao2, f 1ICT Branch of Chongqing Electric Power Corp Chongqing, China
2College of Communication Engineering of Chongqing University Chongqing, China [email protected], [email protected], [email protected],
d [email protected], e [email protected], f [email protected].
Abstract. In this paper, according to the practical needs of the electric power wireless network coverage prediction, a propagation model based on real data and revised statistical prediction model (SPM) is proposed to predict the spatial field intensity distribution of the base station and improve the rationality and efficiency of the network planning and construction. The optimal parameters of SPM model parameters are obtained by least square method. On this basis, the coverage prediction with geographic information is proposed. The simulation results show that compared with SPM and LAP model, the proposed scheme can effectively analyze the signal loss intensity around the base station at any location in the map, so as to solve the signal planning problem of the base station.
Keywords: radio wave propagation model, coverage prediction, geographic information system.
1. Introduction
In recent years, with the rapid advancement of China's smart grid construction, the State Grid and China Southern Power Grid have built a few of 230MHz, 400MHz and 1.8GHz LTE wireless private networks to support the information construction of the distribution of electricity business. The information management level of the power industry has been improved by this power wireless private networks. However, the network planning, construction and operation and maintenance of the above wireless private are built based on experience in the field of coverage prediction, base station location and resource allocation. The base station is randomly selected in two aspects: firstly, the handheld GPS receiver is used to measure the geographical location of the base station. Secondly, the coverage distance and area are visually observed. In the operation and maintenance process, the base station adjustment and relocation is lack of theoretical analysis. Actually, radio wave coverage prediction plays a significant role in base station location selection, the interference analysis, frequency allocation and resource allocation [1]. Radio wave propagation characteristics analysis is important for the design and deployment of power wireless private networks in a specific topographical distribution environment [5].
The coverage prediction of radio waves has been frequently analyzed, and some empirical models of radio wave propagation have been presented [6,7,8,9,10]. These methods can be classified into three categories: theoretical analysis, experimental fitting and computer simulation. In urban, mountainous and indoor scenes, the theoretical analysis method is used in the complex and variable propagation environment with large scale of the scatter and the uneven distribution, resulting in very expensive of computational complexity. The experimental fitting method builds the mathematical model with statistical characteristics through the measured data. The typical model are the follows, Okumura[11], Hata[12] and LEE[13],etc.
However, the empirical model is implemented by establishing statistical models from measured data, which is subject to many constraints. The model should be adjusted according to the application environment. Computer simulation method utilizes computer simulation technology to simulate the radio wave propagation process, which can deal with the measured big data with geographical attributes when combined with the experimental fitting method, resulting in effectively predicting the service area, coverage boundary and coverage intensity.
3rd International Conference on Mechatronics Engineering and Information Technology (ICMEIT 2019)
Copyright © 2019, the Authors. Published by Atlantis Press. This is an open access article under the CC BY-NC license (http://creativecommons.org/licenses/by-nc/4.0/).
Advances in Computer Science Research, volume 87
335

For this reason, in this paper, the SPM model[15] is improved by least squares fitting, then estimating the model parameters to achieve the power wireless private network coverage forecast requirements. After that, the proposed system fuses the satellite imagery and elevation information. The coverage prediction model based on computer simulation and empirical model is built. Simulation experiments and actual experiments show that compared with SPM method and LAP[14] method, the proposed method is more effective than the above two methods, which can effectively analyze the signal loss intensity around the base station at any location in the map, so as to solve the signal planning problem of the base station.
2. Design of Coverage Prediction Model
2.1 Correction of SPM Model
The path loss of the SPM model can be described as:
1 2 3 4
5 6 7
(dB) lg lg ( )
lg lg lg
pathloss b
b m m clutter
L K K d K h K DiffractionLoss
K h d K h K h h
(1)
where d refers to the distance between base station and terminal; bh refers to effective height of
base station antenna; mh refers to effective height of terminal antenna; Diffraction Loss refers to
non-line-of-sight propagation diffraction loss; clutterh refers to correction factor of terrain factor loss.
1 2 3 4 5 6 7, , , , , , K K K K K K and K refer to the correction factors. In the prediction process, K parameter
could be selected different correction values based on the difference of communication environment and regional terrain and features. The estimation process of K parameter is shown in Fig.1.
Fig.1 The process of K parameters’ acquisition
The distance scale of radio wave propagation can be divided into small scale model and large-
scale model. The large-scale model mainly focuses on the path loss and field intensity distribution of radio wave propagation, which is used to predict the coverage of wireless signals in different geographical environments, resulting in blind areas reduction and the optimal selection of base stations. The small-scale model mainly studies the estimation and prediction of various parameters in different propagation environments, and obtains the median intensity of the received electric field at
Advances in Computer Science Research, volume 87
336
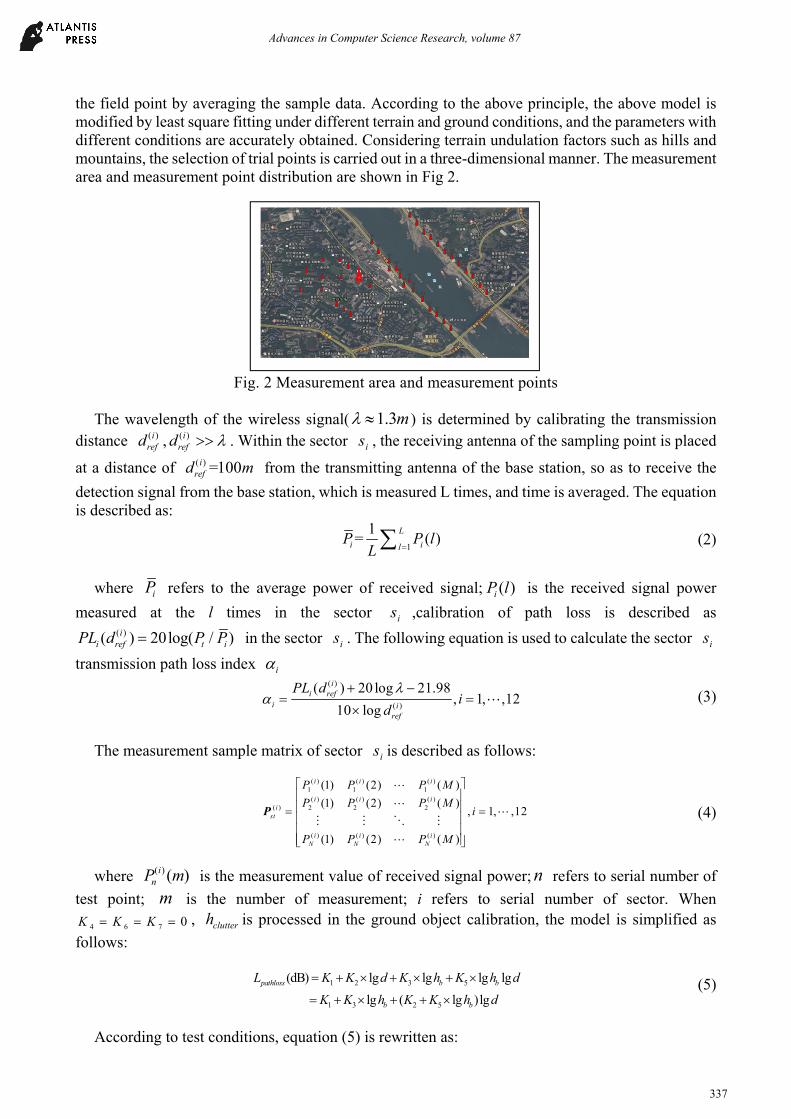
the field point by averaging the sample data. According to the above principle, the above model is modified by least square fitting under different terrain and ground conditions, and the parameters with different conditions are accurately obtained. Considering terrain undulation factors such as hills and mountains, the selection of trial points is carried out in a three-dimensional manner. The measurement area and measurement point distribution are shown in Fig 2.
Fig. 2 Measurement area and measurement points
The wavelength of the wireless signal( 1.3m ) is determined by calibrating the transmission
distance ( )irefd , ( )i
refd . Within the sector is , the receiving antenna of the sampling point is placed
at a distance of ( ) =100irefd m from the transmitting antenna of the base station, so as to receive the
detection signal from the base station, which is measured L times, and time is averaged. The equation is described as:
1
1= ( )
L
i ilP P l
L (2)
where iP refers to the average power of received signal; ( )iP l is the received signal power
measured at the l times in the sector is ,calibration of path loss is described as ( )( ) 20log( / )i
i ref t iPL d P P in the sector is . The following equation is used to calculate the sector is
transmission path loss index i ( )
( )
( ) 20 log 21.98, 1, ,12
10 log
ii ref
i iref
PL di
d
(3)
The measurement sample matrix of sector is is described as follows:
( ) ( ) ( )1 1 1
( ) ( ) ( )( ) 2 2 2
( ) ( ) ( )
(1) (2) ( )
(1) (2) ( ), 1, ,12
(1) (2) ( )
i i i
i i ii
st
i i iN N N
P P P M
P P P Mi
P P P M
P (4)
where ( ) ( )i
nP m is the measurement value of received signal power; n refers to serial number of
test point; m is the number of measurement; i refers to serial number of sector. When
4 6 7 0K K K , clutterh is processed in the ground object calibration, the model is simplified as
follows:
1 2 3 5
1 3 2 5
(dB) lg lg lg lg
lg ( lg )lg
pathloss b b
b b
L K K d K h K h d
K K h K K h d
(5)
According to test conditions, equation (5) is rewritten as:
Advances in Computer Science Research, volume 87
337

1 3 2 5
1 2
(dB) 2.54 ( 2.54 ) lg
lg
pathlossL K K K K d
L L d
(6)
where
1 1 3 2 2 52 .5 4 , 2 .5 4L K K L K K . 1 2,L L could be obtained by the regression curve,
then 3 5,K K could be also obtained to implement model correction.
2.2 System Design of Coverage Prediction Model
Based on the model correction, satellite images, elevation information and raster data are fused to obtain elevation information belonging to the specific coverage area, which provides the foundation for the computer simulation analysis of the wave propagation prediction. The overall architecture of the radio wave coverage system proposed in this paper is shown in Fig 3.
Fig.3 overview of the architecture
3. Results Analysis
3.1 Model Results Analysis
Based on continuous waves measuring, each collection point is set to be visible or not from the base station with two different conditions, LOS (line of sight) and NLOS (no line of sight). and their parameters K needs to be individually modified based on the two conditions.
① LOS The linear least squares algorithm was used to process the data and the results are linked as the
following:
1
2
3 .7 4
4 0 .6 0 3
L
L
(7)
The value of R-square is 0.910, which is substituted into equation (5) and we get
3 56 .4 , 1 .6 9 2K K ② NLOS
The linear least squares algorithm was used to process the data and the results are linked as the following:
1
2
26 .90
39 .304
L
L
(8)
In the case of LOS and NLOS, the effect of model correction is shown in Fig.4, respectively. In
the process of model modification, we adopt the least square method to calculate the linear regression,
Map scene Function menu Parameters read Suspension tools
Map browsingSpatial
measurementStation address
selectionModel selection
Prediction analysis
Coverage topicsCoverage statistics
File export
System parameters
Propagation model
ARCGIS layer data file
User interface layer
Logical function layer
Database access layer
RADIO WAVE COVERAGE PREDICTION SYSTEM FOR POWER PRIVATE NETWORKS
Advances in Computer Science Research, volume 87
338

and consider whether all the measured points are visible or not when the parameters are separated. Then we analyze whether the accuracy of the evaluation model meets the requirements.
Mean error and standard deviation are the main evaluation indexes of model correction. In general, the following conditions should be satisfied for the result of model modification: the range of the average error is : 2 2E dB E dB and the standard error range is : 8E dB . The error of model correction is shown in table 1.
(a)
(b)
Fig.4 SPM model correction results in LOS and NLOS, respectively
As depicted in table, in LOS, the proposed model basically meets the requirements of industry standards whose mean error is 1.21dB and the standard deviation is 5.62 dB; in NLOS, mean error is 0.98dB and the standard deviation is 5.12dB. For the latter, although the proportion of test data is small, the error is not much different from that of the former.
Table 1. The error analysis of SPM model correction result
model model formula average error ( )E dB standard error ( )dB
LOS 12.4 44.9 lg
6.4 lg 1.692 lg lg
p
b b
L d
h h d
1.21 5.62
NLOS 12.4 44.9 lg
5.7 lg 2.203 lg lg
p
b b
L d
h h d
0.98 5.12
3.2 Analysis and Verification in Real Scene
In order to verify the correctness of the model in real scene, we selected the actual geographical location of the power wireless private network for predictive simulation, and compared the simulation results with field investigation and data test.
The base station is located on the roof of the main control building of Yudong 110kV substation, Banan district, Chongqing, China. The antenna is 261 meters above sea level and the height of receiving antenna is 2m. In the actual geographical environment, the terrain around the base station
Advances in Computer Science Research, volume 87
339

is relatively wide and the features are densely distributed and the relative height difference is small, so the selection of the regional category takes into account the irregular terrain and urban area, and the working frequency band is set to be 230MHz. The roof of the main control building of Yudong substation is taken as the view point to analyze visible situation of surrounding regional departments, and the corresponding analysis result is shown in figure 5.
Fig.5 The results of visibility analysis
As depicted in Fig.5, for this viewpoint, Yunzhuanshan mountain shades the southwest of the
covered area. Some parts of which are invisible. At the same time, it is shaded by Nanshan mountain in the east, and some parts of it are not visible. The area around the base station and the rest of the area are visible. The SPM model, LAP model and the proposed model are simulated by computer, which are based on the above conditions, and the results are shown in Fig.6.
As depicted in Fig.6, at the right of the base station, the base station signal is blocked by Yunzhuanshan mountain located from south to north, which causes that the area in the back of the mountain is poorly covered; In the northwest, the signal attenuates greatly due to the absorption of electric waves by the water surface of the Yangtze river; In the east, the area of Nanshan mountain which is back to base station is heavily obscured and can't be covered. By observing the SPM model, we can know that it utilizes the same color representation in the coverage area, which basically cannot implement the coverage prediction. And in LAP model, the predicted coverage area is small. The results of the two models are quite inconsistent with the actual test results. The proposed model can well realize the coverage prediction, whose overall prediction simulation results are in good agreement with the results of field investigation and field measurement.
(a)
Advances in Computer Science Research, volume 87
340

(b)
(c)
Fig.6 The propagation coverage prediction results of three models on Yunzhuanshan mountain converting station, (a)SPM model, (b)LAP model, (c)the proposed model.
Based on the model of coverage prediction, this paper designs the radio wave coverage system of
power wireless private network. Especially, the system has been applied in the construction, operation and maintenance of wireless private power network. The main interface of the system is shown in Fig 7.
Fig.7 Demonstration of the proposed system.
4. Conclusion
In this paper, the model of radio wave coverage propagation is constructed and designed for the coverage prediction system of power wireless network planning, which is corrected through the measured data and integrated with satellite imagery and elevation information. Simulation and actual trial results show that compared with the SPM and LAP methods, the proposed radio wave coverage prediction method has less attenuation loss and can be effectively applied to the site selection of power wireless private network and improve the rationality and efficiency of power wireless private network planning.
Advances in Computer Science Research, volume 87
341

References
[1]. A. Shrawanker J, D. Kulat K. Propagation prediction model for land mobile communication in microcellular environment. International Journal of Computer Applications, 2013, 84(15): 38-41.
[2]. Li L, Wu Z S, Lin L K, et al. Study on the Prediction of Troposcatter Transmission Loss. IEEE Transactions on Antennas & Propagation, 2016, 64(3):1071-1079.
[3]. Ponce F J, Pallares F M, Juan-Llacer L, et al. Educational software tool based on a geographical information system (GIS) for radio wave propagation analysis. IEEE Transactions on Education, 2001, 44(4):355-364.
[4]. C.Y.LEE W, J.Y.LEE D. Integrated wireless propagation models. 2015.
[5]. Tabassum H, Hossain E. Coverage and Rate Analysis for Co-Existing RF/VLC Downlink Cellular Networks. IEEE Transactions on Wireless Communications, 2018, 17(4):2588-2601.
[6]. Sari R, Zayyani H. RSS Localization Using Unknown Statistical Path Loss Exponent Model. IEEE Communications Letters, 2018, (99):1-1.
[7]. Popoola S I, Adetiba E, Atayero A A, et al. Optimal model for path loss predictions using feed-forward neural networks. Cogent Engineering, 2018(1).
[8]. Dalela C, Prasad M, Dalela P K. Tuning of COST-231 Hata model for radio wave propagation predictions. Computer Science and Information Technology (CS & IT), DOI, 2012, 10: 255-267.
[9]. Kitao K, Imai T, Tran N, et al. Path loss prediction model for 800 MHz to 37 GHz in NLOS microcell environment, IEEE International Symposium on Personal, Indoor, and Mobile Radio Communications, 2015:414-418.
[10]. Ara P, Yu K, Cheng S, et al. Human Abdomen Path-Loss Modeling and Location Estimation of Wireless Capsule Endoscope Using Round-Trip Propagation Loss. IEEE Sensors Journal, 2018, PP (99):1-1.
[11]. J.D. Parsons. The mobile radio propagation in mobile radio frequency bands. London: Pentech Press,1992:13-17.
[12]. LEE W C. Mobile communications design fundamentals. John Wiley & Sons, 2010.
[13]. Ballot M. Radio-Wave Propagation Prediction Model Tuning of Land Cover Effects. IEEE Transactions on Vehicular Technology, 2014, 63(8):3490-3498.
[14]. Al-Hourani A, Kandeepan S, Lardner S. Optimal LAP Altitude for Maximum Coverage. IEEE Wireless Communications Letters, 2014, 3(6):569-572.
[15]. Martinez Z O N, Rodriguez C, Arias O M. Propagation characteristics of Managua city based on Standard Propagation Model (SPM) at 850 MHz for 3G-WCDMA systems, Central America and Panama Convention. IEEE, 2015:1-6.
Advances in Computer Science Research, volume 87
342