Design of pharmaceutical tablet formulation for a low water soluble drug
147
Design of pharmaceutical tablet formulation for a low water soluble drug: Search for the critical concentration of starch based disintegrant applying percolation theory and F-CAD (Formulation-Computer Aided Design) Inauguraldissertation zur Erlangung der Wuerde eines Doktors der Philosophie vorgelegt der Philosophisch-Naturwissenschaftlichen Fakultaet der Universitaet Basel von Go Kimura aus Kyoto Japan Kyoto, 2012 Original document stored on the publication server of the University of Basel edoc.unibas.ch This work is licensed under the Creative Commons Attribution-NonCommercial-NoDerivs 2.5 Switzerland License. To view a copy of this license, visit http://creativecommons.org/licenses/by-nc-nd/2.5/ch/ or send a letter to Creative Commons, 444 Castro Street, Suite 900, Mountain View, California, 94041, USA.
Transcript of Design of pharmaceutical tablet formulation for a low water soluble drug

Design of pharmaceutical tablet formulation
for a low water soluble drug:
Search for the critical concentration of starch
based disintegrant applying percolation theory and
F-CAD (Formulation-Computer Aided Design)
Inauguraldissertation
zur
Erlangung der Wuerde eines Doktors der Philosophie
vorgelegt der
Philosophisch-Naturwissenschaftlichen Fakultaet
der Universitaet Basel
von
Go Kimura
aus Kyoto Japan
Kyoto, 2012
Original document stored on the publication server of the University of Basel
edoc.unibas.ch
This work is licensed under the Creative Commons Attribution-NonCommercial-NoDerivs 2.5
Switzerland License. To view a copy of this license, visit
http://creativecommons.org/licenses/by-nc-nd/2.5/ch/ or send a letter to Creative Commons,
444 Castro Street, Suite 900, Mountain View, California, 94041, USA.


Genehmigt von der Philosophisch-Naturwissenschaftlichen Fakultaet
auf Antrag von
Prof. Dr. H. Leuenberger
und
Prof. Dr. I. Caraballo
Basel, den 21. Februar 2012
Prof. Dr. Martin Spiess
Dekan


To my family


Acknowledgements
I wish to express my sincere gratitude to my supervisor, Prof. Dr. H. Leuenberger for
providing me this precious study opportunity as a PhD student in his laboratory. Discussion
with him about “Percolation theory” was invaluable. I would like to express my deepest
appreciation to Prof. Dr. J. Huwyler for giving me the permission to continue my study. I have
pleasure in my sincere thanks to Prof. Dr. I. Caraballo who accepted the co-reference.
I always appreciate the feedback offered by Dr. M. Puchkov. His inspiring thought and
hospitality during my stay in Basel were unforgettable. Thank you very much for the use of F-
CAD as well.
I would like to thank Dr. G. Betz and Dr. K. Chansanroj for their smile, cheer, great
atmosphere during my stay in the Industrial Pharmacy Lab (IPL).
Special thanks to Dr. R. Luginbuehl and Dr. E. Krausbauer for the use of their PhD thesis.
Many thanks are due to Dr. M. Lanz, Dr. M. Plitzko, Dr. J. von Orelli, Ms. S. Tanja, Mr. R.
Alles and Mr. S. Winzap for their laboratory help. Thanks to Dr. J. Saito for his kindness as a
Japanese friend.
I am grateful to Mr. K. Eichler. I have greatly benefited from the numerous workshops in
Technology Training Center. I am also grateful to Mr. C. Kaseda for the use of dataNESIA
software, and to S. T. Japan Inc. for providing the valuable NIR imaging data on my
experiments.
I received the financial support from Shionogi & CO., LTD.
I would like to thank Mr. Y. Katakuse and his group member of the formulation designing
department, and Mr. J. Lim who is director of pharmaceutical sciences in Shionogi Inc. for
their generous understanding.
Finally I am greatly indebted to my family, Kazue, So and Yuki, for their support,
encouragement and sacrifice throughout my PhD works.


“努力できることが才能である”
“Trying hard is an ability”
Cited to the book “The Hideki Matsui Story-Reaching for Your Dream”


Table of contents
i
Table of contents
1 Summary ........................................................................................................ 1
2 Introduction ..................................................................................................... 3
3 Theoretical Introduction .................................................................................. 5
3.1 Formulation design for solid dosage forms..............................................................5
3.1.1 The selection of pharmaceutical dosage form ..................................................5
3.1.2 Definition of low water soluble drug ..................................................................5
3.1.3 Advantages of granulation process...................................................................6
3.1.4 Principle of wet granulation ...............................................................................7
3.1.5 Method of wet granulation.................................................................................8
3.1.6 Flowability of powder or granules......................................................................9
3.1.7 Tablet formulation design and development ...................................................10
3.2 Near infrared (NIR) imaging...................................................................................15
3.2.1 Introduction of NIR and NIR imaging ..............................................................15
3.2.2 Application of NIR imaging in tablet formulation design..................................15
3.3 Response surface methodology ............................................................................16
3.3.1 Response Surface Methodology (RSM) and Design of Experiment (DOE) ....16
3.3.2 dataNESIA software........................................................................................22
3.3.3 Multivariate spline interpolation.......................................................................23
3.4 Percolation theory..................................................................................................24
3.4.1 Principles of percolation theory .......................................................................24
3.4.2 Application of percolation theory in pharmaceutical area................................29
3.5 Percolation threshold of disintegration time with particle packing geometry
considerations........................................................................................................30
3.5.1 Random close packed (RCP) spheres system ...............................................30
3.5.2 Sphere caging and non-caging concept in case of binary RCP system .........31
3.5.3 Sphere caging and non-caging concept for binary drug/disintegrant tablet ....32
3.5.4 Water diffusion network for binary spherical drug/disintegrant tablet..............33
3.5.5 Calculation of critical concentration of disintegrant for spherical binary
drug/disintegrant tablet....................................................................................34
3.5.6 Critical exponent .............................................................................................35
3.5.7 Fractal nature of infinite cluster near percolation threshold ............................36
3.6 F-CAD....................................................................................................................37
3.6.1 Goal of in-silico pharmaceutical formulation design........................................37
3.6.2 F-CAD capability for the pharmaceutical formulation design ..........................38

Table of contents
ii
3.6.3 F-CAD software applications...........................................................................39
3.6.4 F-CAD core algorithm .....................................................................................40
4 Objectives ..................................................................................................... 43
5 Materials and Methods.................................................................................. 45
5.1 Materials ................................................................................................................45
5.2 Physical properties of starting materials ................................................................45
5.3 Granulation ............................................................................................................51
5.4 Tableting ................................................................................................................54
5.5 Granules characterization......................................................................................57
5.5.1 SEM ................................................................................................................57
5.5.2 Moisture determination....................................................................................57
5.5.3 Size distribution and Mean diameter...............................................................57
5.5.4 Bulk, Tapped and Apparent density ................................................................58
5.5.5 Intragranular pore volume ...............................................................................59
5.5.6 MA assay ........................................................................................................59
5.6 Tablet characterization ..........................................................................................60
5.6.1 Hardness and tensile strength ........................................................................60
5.6.2 Calculated Porosity .........................................................................................61
5.6.3 NIR imaging ....................................................................................................61
5.6.4 Disintegration time ..........................................................................................62
5.6.5 Pore size distribution, Median pore diameter and Porosity.............................62
5.7 Data Analysis.........................................................................................................63
5.7.1 Data treatment for NIR imaging ......................................................................63
5.7.2 Response surface methodology......................................................................63
5.7.3 Renormalization ..............................................................................................64
5.7.4 Assumption of disintegration time computed by F-CAD..................................65
5.7.5 F-CAD operation .............................................................................................65
6 Results and Discussion................................................................................. 69
6.1 Physical properties of starting materials ................................................................69
6.2 Granules characterization......................................................................................69
6.2.1 Influence of loading volume of MA on granule characteristics ........................69
6.2.2 SEM of granules with increasing loading volume of MA .................................73
6.2.3 Intrusion volume of mercury into granules with increasing loading volume of
MA...................................................................................................................74
6.3 Tablet characterization ..........................................................................................76
6.3.1 Influence of loading volume of MA on compression behaviour.......................76
6.3.2 Visual inspection on tablet characteristics using NIR imaging ........................85

Table of contents
iii
6.3.3 MA domain size with increasing loading volume of MA in tablet.....................89
6.3.4 Tablet disintegration time ................................................................................90
6.3.5 Pore size distribution, Median pore diameter and porosity .............................92
6.4 Focus on searching the critical concentration of MS .............................................93
6.5 Renormalization technique considerations ............................................................98
6.6 Critical concentration of MS for MA tablets..........................................................100
6.7 Critical volume fraction of MS for MA tablets .......................................................102
6.8 Critical concentration of MS for 0% v/v MA tablets ..............................................104
6.9 Comparison of critical volume fraction for MA tablets and Caffeine tablets.........105
6.10 Critical exponent for disintegration behavior........................................................106
6.11 Computing the disintegration time of MA tablet by F-CAD ..................................109
6.11.1 Particle Arrangement and Compaction (PAC) operation ..............................109
6.11.2 Comparison of experimental and F-CAD computed disintegration time of MA
tablets............................................................................................................109
6.11.3 Response surfaces close to the percolation threshold of sensitive tablet
properties such as the disintegration time.....................................................113
7 Conclusions ................................................................................................ 118
8 Further perspectives ................................................................................... 121
9 References ................................................................................................. 122


Summary
1
1 Summary
The topic of this PhD work is to search the critical concentration of starch based
disintegrant applying percolation theory and F-CAD (Formulation-Computer Aided Design) in
order to design a pharmaceutical tablet formulation for a low water soluble drug. Critical
concentration of maize starch (MS) for a ternary mefenamic acid (MA) tablet formulation with
respect to a minimum disintegration time is investigated. Additionally implemented
application of F-CAD to compute the disintegration time of MA tablet formulation is presented.
This topic is related to push forward the idea of Quality by Design (QbD) of FDA (Food and
Drug Administration) / EMEA (European Medicines Agency) / PMDA (Pharmaceuticals and
Medical Devices Agency) and the exploration of the design space according to ICH
(International Conference of Harmonization) Q8.
The results of this work shows that the application of percolation theory is not limited to
binary tablet formulation. The critical concentration of MS described by the renormalized MS
concentration, MS/(MS+MA) applying the renormalization technique is always equal 0.198
(dimensionless). Moreover the critical concentration of MS is optimized using the spline
approximation with the dataNESIA software. It is leading to a minimum disintegration time at
0.206, dimensionless, renormalized, which is very close to the experimental value of 0.198.
According to the percolation theory, a minimum disintegration time corresponds to the
formation of a continuous water-conducting cluster through the entire tablet. The critical
volume fraction of an ‘infinite cluster’ that water can diffuse through the entire MA tablets are
calculated with taking into account for the geometrical considerations between MS and MA
particles based on random close packed (RCP) spheres system. The critical volume fraction
of MS is calculated by the multiplication of critical concentration of MS and the solid fraction
of MA tablets; which is within the range of 0.16 ± 0.01 (v/v). It is concluded that the critical
volume fraction for three dimensional lattices is equal to 0.16 ± 0.01 (v/v); which is useful for
the calculation of the critical concentration of starch based disintegrant in order to design the
pharmaceutical tablet formulation based on scientific approach proposed by ICH Q8
guidance.
In addition, the disintegration behavior in the neighborhood of the percolation threshold is
explained mathematically by the basic equation of the percolation theory, yielding a critical
exponent q equal to 0.28 ± 0.06 (Quality of fit: r2 = 0.84). This value is close to the critical
exponent for three dimensional lattices (q = 0.4). Thus, it is important, within a planned
experimental design to optimize the disintegrant to take into account the percolation theory.
However it has to be kept in mind that the determination of the percolation threshold and
critical exponent does not give an answer about the absolute value of the disintegration time.
Dissolution Simulation (DS) module, which is the one of F-CAD based on cellular automata

Summary
2
algorithm is used to simulate the disintegration time of a MA tablet. Disintegration time of
tablet is assumed as the time elapsed till the water is detected at the geometric center of the
virtual tablet. Comparison of experimental disintegration time of MA tablet and computed
specific time point for water to reach the geometric center of the tablet by using F-CAD
software has been carried out and shown an acceptable correlation (Correlation coefficient: r
= 0.81). The detailed evaluation of the data shows that there is still a need for optimization of
F-CAD for the calculation of the disintegration time in order to achieve a similar or the same
performance like in the prediction of the dissolution profile of a tablet formulation. It is
concluded that F-CAD software is the only software so far, which is capable of computing the
disintegration time of tablets. The software has a great potential to be improved and to be not
only used for the safe prediction of the dissolution profile of a tablet formulation but also for a
safe prediction of the disintegration time. Thus, such a software is one of the tools for the
substitution of laboratory experiments for the purpose of the design and development of new
pharmaceutical solid dosage forms. The replacement of expensive laboratory experiments by
in-silico experiments is an important issue to reduce development costs and to comply with
the requirements of ICH Q8 exploring the design space with response surface methodology.
The results of this thesis show in addition that the application of percolation theory is a must
in order to detect percolation thresholds. It is important to know the response surfaces close
to the percolation threshold of sensitive tablet properties such as the disintegration time to
get information about the robustness of the selected formulation. In this context one has to
put the question forward if the application of percolation theory should be an integral part of
the guidelines of ICH Q8 exploring the formulation design space.

Introduction
3
2 Introduction
For the pharmaceutical formulation design and process development, the scientific
understanding of those attributes that influence their quality should be provided while taking
into account for quality by design (QbD) in International Conference on Harmonization (ICH)
guidance Q8 (R2) [1]. The use of scientific approaches for the understanding of quality
attributes, such as statistical design of experiment (DOE), response surface methodology
(RSM), optimization modeling, multivariate data analysis and chemometrics in combination
with the knowledge management system is required.
Pharmaceutical formulations for solid dosage forms are complex and heterogeneous
disordered particular system, i.e., multi-particulate and multi-component. Topological
modeling is necessary to be taken into account for a geometrical description. Percolation
theory is, in fact, one of the suitable topological modeling tools to predict and simulate the
geometric phase transitions in complex system, such as a tablet formulation. Thus,
percolation theory allows finding the regions where the system undergoes the geometrical
phase transition. It happens at critical concentration of the components where a component
percolates (percolation threshold). In terms of tablet formulation design, such regions are
usually linked to external values of properties such as water uptake, disintegration time, and
dissolution rate.
Nowadays, because of the advance of combinatorial chemistry and high throughput
screening, the number of poorly water soluble drug candidates has increased tremendously.
More than 40% of newly discovered drugs are poorly water soluble. It has to be kept in mind
that up to now there is no universal science-based formulation design for low water soluble
drugs. In many cases disintegration is a limiting factor on the dissolution process of tablets.
Disintegrant is used to aid the disintegration of tablets. Determination of the critical
concentration of disintegrant is an important parameter for a tablet formulation design,
especially for low water soluble drugs. Therefore, several research groups have reported the
critical concentration of disintegrant that is required to achieve the minimum disintegration
time [2-7]. In our laboratory, the percolation theory has been applied to determine the critical
concentration of disintegrant in binary tablets [8-12]. However the further investigation is
needed to determine the critical concentration of disintegrant not only for binary tablets but
also for multicomponent tablets in order to design a pharmaceutical tablet formulation based
on the scientific approach.
Mefenamic acid (MA) is used as a model substance of a low water soluble drug. Fifteen
types of granules and tablets are prepared at different loading volume of MA (0-74.1% v/v) in
exchange of lactose (LA) (7.7-90.9% v/v) as a filler and maize starch (MS) (8.5-30.3% v/v) as
a disintegrant corresponding to a truly ternary tablet formulation. In order to guarantee a
Introduction
4
quality of a tablet formulation, however, it is not sufficient to evaluate to look only at one
important characteristic such as the disintegration time, because other tablet properties need
to fulfill the necessary requirements as well. In this respect, it has to be kept in mind that an
optimization of disintegration time may jeopardize other important tablet properties such as
the tensile strength. Thus, it is a prerequisite to study at least at the same time the weight,
diameter, thickness, and hardness of a tablet. The weight, diameter, and thickness of tablets
together with the measurement of apparent density of granules determine the porosity of the
tablets. In order to get the more scientific understanding of the tablet characteristics, near
infrared (NIR) imaging technology has been applied to visualize the components distribution
on the tablet surface.
The tablet quality is not only influenced by its materials [13-19] but also by tableting process
parameters [20-22] when compressed. For an optimal formulation design, it would be
desirable to manufacture the tablets on an industrial rotary tableting machine. However,
because of the lack of a large amount of a drug substance at the earlier formulation design
and development phases, these experiments are not possible. For this reason, the
PressterTM [23] equipment, which needs only a small amount of powder material, was used to
simulate mechanically a rotary tableting machine.
Finding the rule for pharmaceutical tablet formulation design is necessary from the
development cost and scientific approach point of view. Critical concentration of MS for a
ternary MA tablet formulation with respect to a minimum disintegration time and the critical
exponent of the disintegration behavior based on the percolation theory are discussed.
Additionally implemented application of F-CAD to compute the disintegration time of MA
tablet formulation is presented in this thesis.

Theoretical Introduction
5
3 Theoretical Introduction
3.1 Formulation design for solid dosage forms
3.1.1 The selection of pharmaceutical dosage form
On the basis of the information about the target profile, clinical indication and pre-
formulation study, for example solubility, water-octanol partition coefficient, pKa, and stability
in solution and in solid state of the new chemical entity (NCE), the dosage form for NCEs
would be selected as oral dosage forms, parenteral dosage forms, topical dosage forms and
so on.
NCEs are rarely administrated alone and are almost always given as a pharmaceutical
dosage forms. The oral route is the one most frequently used for drug administration and
tablets are the most common pharmaceutical dosage forms today. Tablets are popular for
several reasons. First the patient's point of view, tablets are convenient to handle because
they are portable and easy to be administered. Second the cost of manufacturing, packaging
and shipping is relatively low from manufacture's point of view. The third point is that tablet
formulation enables high dose of active substances to design smaller than capsule
formulation containing granules or powder as well as granules or powder themselves.
The most important is however the fourth point, that solid dosage forms such as tablets,
capsules etc. show a much higher physical and chemical stability than any other dosage
form especially if compared with liquid formulations.
3.1.2 Definition of low water soluble drug
Nowadays, because of the advance of combinatorial chemistry and high throughput
screening, the number of poorly water soluble drug candidates has increased tremendously.
More than 40% of newly discovered drugs are poorly water soluble. The solubility in gastro-
intestinal fluids of a drug is an important factor affecting its bioavailability. Solid drugs
administered orally for systemic activity must be dissolved in the gastro-intestinal fluids prior
to their absorption site. European Pharmacopoeia (Ph. Eur.) 7.0 categorizes the solubility
from the view point of milliliters of solvent required for dissolving 1 g of solute referred to a
temperature between 15°C and 25°C. If 1 g of solid drug requires more than 10,000 mL, this
drug is classed as practically insoluble (Table 1) [24].

Theoretical Introduction
6
Table 1 European Pharmacopoeia (Ph. Eur.) 7.0 descriptive terms of solubility [24]
Descriptive Term Approximate volume of solvent in milliliters
per gram of solute
Very soluble less than 1
Freely soluble From 1 to 10
Soluble From 10 to 30
Sparingly soluble From 30 to 100
Slightly soluble From 100 to 1,000
Very slightly soluble From 1,000 to 10,000
Practically insoluble more than 10,000
On the other hand, the solubility for a classification in the Biopharmaceutics Classification
System (BCS) is defined by FDA in 2000 (Table 2) [25]. Drugs are defined as highly soluble
when the highest dose strength is soluble in 250 mL or less of an aqueous media over a pH-
range of 1.0-7.5. Drugs are defined as highly permeable when the extent of absorption is
determined to be 90% or more of an administered dose based on a mass balance
determination or in comparison to an intravenous dose. According to the FDA, the
permeability class can be determined by humans, animal models (e.g. rat), in-vitro
permeation studies with human or animal excised tissue or the use of cultured cell models
(e.g. Caco-2 cells).
Table 2 Biopharmaceutics Classification System (BCS)
Solubility / Permeability High Low
High Class I Class III
Low Class II Class IV
3.1.3 Advantages of granulation process
The formulation designing and development for low water soluble drugs aiming to improve
the dissolution behavior and thus bioavailability with common approaches is desirable for the
pharmaceutical industry to shorten time to market. One common approach is granulation,
which has several advantages, such as improved wettability and in vitro dissolution behavior
of active ingredient [26], and improved flowability and compaction properties [27] of the
whole formulation.
Granulation methods can be divided into wet granulation, which is use a granulation liquid
during its process, and dry granulation in which no granulation liquid is used. This dry
granulation is used for the active pharmaceutical ingredients which are sensitive to water.

Theoretical Introduction
7
3.1.4 Principle of wet granulation
Wet granulation process is that liquid is added to the powder mixture and will be distributed
and then powder is agglomerated at the certain amount of liquid [28, 29]. Formation of
granules results from a process classically defined by different states of saturation of liquid-
bound particles (Figure 1) [30, 31]. These wet bridges are only temporary states during wet
granulation. However they are a prerequisite for the formation of solid bridges formed by
adhesive in the presence of liquid or by materials that dissolve in the granulation liquid.
Otherwise powder will be obtained after drying process.
Pendular state
Empty space between particles is partly filled with binding liquid, which forms
concave films between the particles. This state corresponds to the nucleation phase
when nuclei are formed from isolated particles, which when wetted by the binding
liquid form between particles by pendular linkage.
Funicular state
With increasing the quantity of liquid, the liquid bridges (concave films) coalesce.
However, air is still present in the empty space. Drying this phase, the nuclei formed
grow via two mechanisms;
- Isolated particles adhere to a nucleus by a pendular linkage
- Two nuclei collide and form a large nucleus
At the end of this stage many small granules of ranging sizes are obtained.
Capillary state
The binding liquid totally fills the empty space between the particles, which are held
together by the capillary suction at the liquid-air interface at the surface of the
granules. This stage corresponds to further accretion;
- The largest granules break up and recombine with small particles
- Two granules coalesce
- Small particles combine selectively
- Particles adhere to large granules
Droplet state
Continued wetting of particles can result in particles are suspended in the binding
liquid. This must be totally avoided to obtain granules. On the other hand, this will be
important for the process of granulation by spray drying of a suspension.

Theoretical Introduction
8
Funicular state
Capillary state Droplet state
Not required,undesirable
Dry stateprior to granulation
Pendular state
Figure 1. The difference states of saturation of liquid-bound particles.
3.1.5 Method of wet granulation
Wet granulation process mainly divided into using a high-speed granulation or a fluidized
bed granulation. Critical factor in wet granulation is the amount of granulation liquid used to
get the prerequisite size of granules. There are many reports describing how to detect the
end point of wet granulation. The way to detect the end point of high-speed granulation is to
measure the power consumption of impeller [32, 33, 34], to measure the granules particle
size by CCD [35] camera and acoustic measurement [36]. The same approach has been
investigated to measure the particle size by CCD camera [34] and acoustic signal detected
by sensor as shown in Figure 2 [37] for the fluidized bed granulation.
Figure 2. Sensor in fluidized bed granulator [37].
(1) Condenser microphone, (2) Fuse, (3) Platelet, (4) Cable, (5) Potting,
(6) Container
The advantage to use a fluidized bed granulator over high-speed granulator is that a mixing,
granulation and drying are performed in one unit as well as operators are in safe side by

Theoretical Introduction
9
closed unit [38]. On the other hand, disadvantage to use a fluidized bed granulator over high-
speed granulator is that there are a lot of parameter affecting granules characteristics related
to apparatus, process and product [39].
This complexity leads to the problems when this process is scaled up. Leuenberger has
proposed the quasi-continuous granulation process by using Glatt® MulticellTM which consists
of a horizontal high-speed granulator and three fluidized bed granulator to avoid scale up
problem as currently trended [40, 41].
When compared with high-speed granulation, granules manufactured by fluidized bed
granulator shows superior compressibility and less granules hardness due to the porous with
small bulk density [42]. It is necessary to use the fluidized bed granulator if tablet includes
the component which leads to cracking and capping tendency such as mefenamic acid (MA)
[43].
3.1.6 Flowability of powder or granules
There are many pharmaceutical manufacturing processes that require powder or granules
to be moved from one location to another location. This is achieved by many kind of ways
such as to use gravity force, mechanical feeding, pneumatic transfer and fluidization air. The
flowability of powers or granules is a critical parameter in the production site of
pharmaceutical dosage forms. In common, flowability can be evaluated by measurements of
bulk density. Bulk density is a simple test developed to evaluate the flowability by comparing
the poured density and tapped density of a powder or granules.
A useful empirical index is given by Carr (Equation 1) [44].
Carr’s index (%) =
100
tapped
bulktapped
Equation (1)
where tapped is tapped density (g/cm3), bulk: bulk density (g/cm3).
This index can be interpreted in Table 3.
Table 3 Carr’s index as an indication of powder flow
Carr’s index (%) Type of flow
5 - 15 Excellent
12 - 16 Good
18 - 21 Fair to passable
23 - 35 Poor
33 - 38 Very poor
> 40 Extremely poor

Theoretical Introduction
10
A similar index has been introduced by Hausner (Equation 2) [45].
Hausner ratio = bulk
tapped
Equation (2)
where tapped is tapped density (g/cm3), bulk: bulk density (g/cm3).
This index can be interpreted in Table 4.
Table 4 Hausner ratio as an indication of powder flow
Hausner ratio Type of flow
< 1.25 Powder flows like granules
1.25 - 1.5 Powder is of intermediate nature
> 1.5 Powder is cohesive
3.1.7 Tablet formulation design and development
Tablets are the most common pharmaceutical dosage form today as described before.
Pharmaceutical dosage forms compose both active pharmaceutical ingredients (API) and
inactive ingredient so called excipients. The information on the compression properties of the
API is extremely useful. Thus, if the API is high dose and it has plastic deformation, the
chosen excipients should be brittle (e.g. lactose). If the drug is brittle or elastic, the excipients
should be plastic, (e.g. microcrystalline cellulose). When the compression force is increased
to the particles, deformation (particles change of form) will occur. If the deformation
disappears completely (it means return to original shape) when the stress is released, it is an
elastic deformation. A deformation that does not completely disappear after release of the
stress is a plastic deformation. A characteristic for brittle material is the fact the plastic
deformation is followed by a breaking of the materials. The deformation is dependent on the
properties of the particles.
Especially a disintegrant is added to most tablet formulations and very critical to facilitate
disintegrating tablet into small particles in order to increase the surface area of API when
tablet is exposed to the gastrointestinal fluids. Therefore, the appropriate type and amount of
disintegrant is in many cases the critical factor to determine the tablet quality, although
particle size, particle shape and packing geometry of disintegrant in a tablet has to be taken
into account.
The optimal selection of disintegrant is an important step, which needs a lot of laboratory
experiments for the tablet formulation design based on the formulator's expertise and
experience.

Theoretical Introduction
11
3.1.7.1 Classification of disintegrant
Main properties for a good disintegrant were pointed out [46].
Strong hydrophilicity (to set up the continuous hydrophilic network in a tablet)
Weak hydrosolubility
Weak mucilaginous behavior in contact with water
Good flowability and good compressibility
From the above mentioned point of view, disintegrants can be divided into mainly four
groups: the native starches, modified starches, cross-linked polyvinylpyrrolidone, cellulose
and modified cellulose [46].
Native starches
Native starches are potato, maize and rice starches. The typical concentration range
of starch in a tablet is up to 15% w/w. Starch particles can swell when it contacts with
water and facilitate disintegration by particle-particle reputation.
Modified starches
Sodium carboxymethyl starch (Primojel®, Explotab®) are developed as a high-
swelling disintegrants which are included in a tablet at relatively low concentration,
typically 1-5% w/w. According to the carboxymethylation and cross-linkage, the starch
can be improved swelling capacity more or less up to a certain point.
Partly pregelatinized starch (StaRX 1500®) is a maize starch physically modified by
heating with/without pressure in the presence of water. Flowability and compressibility
is improved in comparison with starch.
Cross-linked polyvinylpyrrolidone
Because of its high molecular weight and cross-linked structure, this
polyvinylpyrrolidone is insoluble in water but it is highly hydrophilic. It can absorb
more than 50% of its own weight in water. Two kinds of Cross-linked
polyvinylpyrrolidone (Polyplasdone XL®, Kollidon CL®) are available on the market.
Cellulose and Modified cellulose
Croscarmellose sodium (Ac-Di-Sol®), Carmellose calcium (ECG-505®), Carmellose
(NS300®), Low-substituted hydroxypropylcellulose (L-HPC®) are representatives. Due
to their origin from the pulp of woody plant, their structure is fibrous. This fibrous
structure is highly hydrophilic because of the numerous hydroxyl groups that allow for
fast suction of water.
3.1.7.2 Mechanism of tablet disintegration
Several mechanisms of disintegration are suggested, such as swelling of disintegrants,
disintegrant deformation recovery, wicking water into the pore between particles, reputation
to break up the particle-particle bonding in tablet and exothermic wetting reaction [47].

Theoretical Introduction
12
No simply theory was satisfactorily applied to all disintegrant process, however the four
principle mechanisms are accepted as shown in Figure 3 [47]. However it is an universally
fact that fast water diffusion into the tablet is necessity.
Swelling
Particles swell and break up the tablet from within; swelling sets up localized
stresses that spread throughout the tablet.
Deformation
Particles swell to pre-compression size and break up the tablet.
Wicking
Water is pulled into pores by the disintegrant and reduces the physical bonding
forces between particles.
Repulsion
Water is drawn into pores, and particles repulse each other because of the resulting
electrical force.
Figure 3. Mechanisms of action for tablet disintegrants.
3.1.7.3 Factors influencing tablet quality
The tablet quality is not only influenced by the particle size [18], particle shape [13],
crystallinity [14], particle deformation properties [15-17] and its composition [19] but also by
tableting conditions, such as compression force [21] and tableting speed [20, 22]. Therefore
constant and robust tablet quality is still a challenge for the pharmaceutical industry.
There are two types of tablet press in common use in pharmaceutical company. One is the
single station eccentric press and another is multi station rotary tablet press. There are both
mainly three steps of tablet compression on a rotary press.

Theoretical Introduction
13
Die filling
The die is filled by powder or granules when the lower punch is in the lowest
position, then the lower punch is moved to its target position and excess material is
scraped off. The placement of powder or granules in the die depends on its flowability,
on its physical properties (size, shape, density, etc.) and on the flow conditions
(hopper shape, centrifugation forces, machine vibration itself).
Tablet formation (Pre-compression and Main-compression)
The upper punch descends and enters the die and the powder or granules are
compressed until a tablet is formed. The lower punch can be stationary or move
upwards in the die. After maximum applied force the upper punch leaves the powder
or granules. Tanino et al. reported that pre-compression helps in removal of
entrapped air and improves bonding between particles during the compaction phase
[48].
Tablet ejection and Take off
The lower punch rises and the tablet is removed by a pushing device. A lubricant
plays important role to minimize the stress between tablet and punch and/or die
during ejection.
Because of the lack of a large amount of API at the earlier formulation design and
development phase, the experiments to use the multi station rotary tablet press are not
possible. What the most difference between the multi station rotary tablet press and the
single station eccentric tablet press is the dwell time during the tableting. The dwell time of
the single station eccentric press is much longer as compared with the multi station rotary
tablet. The difference of dwell time is the possibility to change the packing geometry related
to the porosity of tablet.
3.1.7.4 Introduction of PressterTM
Tablet properties such as a hardness, disintegration or dissolution behavior may change
when a tableting process is changed from one machine to another. In short, important
parameters such as porosity, pore size and pore volume depending on compression force
and compression speed [49-51] are related to the dwell time (Figure 4). As mentioned above,
it would be desirable to manufacture the tablets on a rotary tableting machine for industrial
use for an optimal formulation designing. However, because of the lack of a large amount of
API at the earlier formulation designing and development phase, these experiments are not
possible. For this reason, the MCC (Metropolitan Computing Corporation) PressterTM
equipment [23], which needs only a small amount of powder material, was used to simulate
mechanically a rotary tableting machine. An excellent concept of PressterTM is a linear-type
rotary tableting machine replicator so that one single station tablet press (Figure 5) with

Theoretical Introduction
14
standard tooling can move with high speed by mimicking the industrial multi station rotary
tablet press. PressterTM is instrumented with Linear Variable Differential Transformers
(LVDT) for upper and lower punch displacement measurement. Moreover strain gauges were
installed for force measurement during pre-compression and main compression, for die wall
expansion measurement with instrumented die, for ejection force and for tablet take-off force.
The scale up factors PressterTM are helpful for designing a tablet formulation, but cannot
completely simulate an industrial multi station rotary due to the following differences:
Feeding protocol
Distance between pre-compression roll and main compression roll
Turret heating effect and Centrifugal force effect due to linear construction
Vibration effects
B
C
A
A : Contact timeB : Dwell timeC : Upper punch movement
Figure 4. Schematic explanations of contact time and dwell time.
Figure 5. Schematic of PressterTM.

Theoretical Introduction
15
3.2 Near infrared (NIR) imaging
3.2.1 Introduction of NIR and NIR imaging
The US Food and Drug Administration (FDA) strongly advocated that Process Analytical
Technology (PAT) initiative [52] has promoted the idea of improving the quality of the
pharmaceutical products by deeper understanding processes involved in drug manufacturing.
The ultimate goal is to achieve quality by design of pharmaceutical dosage forms.
Spectroscopic techniques such as near infrared (NIR) are nowadays used for process
control and quality assurance due to the advantage of their rapid, nondestructive analysis.
NIR spectrophotometer was listed in European pharmacopoeia as a general monograph in
1997. It has a wide variety of applications for both chemical and physical analysis according
to the European pharmacopoeia (Ph. Eur.), for example identification of active substances
and excipients [53].
NIR spectral range extends from about 780 nm to about 2500 nm (from about 12800 cm-1
to about 4000 cm-1). NIR spectra are dominated by C-H, N-H, O-H and S-H overtone
resonances and combination of fundamental vibrational modes [53]. In NIR spectroscopy,
only one spectrum per sample is obtained. However the technique to acquire several
thousand spectra per one measurement has developed in order to provide spatial
information of a data cube which is hyperspectral NIR imaging as shown in Figure 6.
Hyperspectral image (data cube)
NIR spectrum Single wavelength image
High intensity
Low intensity
Figure 6. Diagram of hyperspectral NIR imaging [54].
3.2.2 Application of NIR imaging in tablet formulation design
There are various parameters established well in the modern pharmacopeia in order to
assess the tablet quality such as its appearance, weight, thickness, hardness (tensile
strength), friability, moisture, assay, content uniformity, disintegration time, dissolution
profiles. On the other hand, NIR imaging in pharmaceuticals has nowadays developed as an
analytical tool for pharmaceutical formulation [55] insight in order to get more scientific

Theoretical Introduction
16
understanding. NIR imaging provides spatial, chemical, structural, and functional information.
The increased understanding at the micro-scale such as the particle size of the APIs in the
formulation and how it distributes relative to other components can improve the formulation
characteristics. Several applications of NIR imaging in pharmaceuticals during formulation
development have been reported. For example, it was used to show the content uniformity
problems attributed to the large API agglomeration in powder blend [56], to detect the
chemical composition of granules [57], it was also applied to monitor the coating thickness of
tablets [58]. However a few physical characteristics related to the tablet quality have been
reported. It was to assess the density or porosity in tablet when the compression force was
different [59], to demonstrate the disintegrant cluster size increased with increasing the
compression force in order to explain the alteration of the product dissolution [60]. In this
thesis, NIR imaging technology has applied to visualize multi component distribution on the
tablet surface according to the loading volume of MA in order to get the more scientific
understanding of the tablet characteristics.
3.3 Response surface methodology
3.3.1 Response Surface Methodology (RSM) and Design of Experiment (DOE)
Response surface methodology (RSM) is one of the useful approaches for selecting the
optimum pharmaceutical formulation design on the basis of the experimental data.
Leuenberger and Guitard published in 1978 from Sandoz Pharmaceutical Research Labs the
article “Drug Delivery Systems for Patient Compliance” [61] with a DOE using central
composite design (CCD) manufactured 27 batches, i.e. an orthogonal factorial design with
five factors, which was able to show a response surface with a quadratic polynomial equation.
DOE is recommended by FDA [1, 52] as mentioned by Ajaz Hussain, at that time deputy
director, who visited the laboratories of the Institute of Pharmaceutical Technology at the
University of Basel in 2004 with Helen Winkle [62], the actual Director of FDA’s Office of
Pharmaceutical Science of the Center for Drug Evaluation and Research (CDER). DOE
should replace “Trial and Error” experiments in the Pharmaceutical R & D laboratories
(Figure 7) [62]. The DOE using central composite designs (CCD) has the intrinsic property to
check the response surface if a minimum or a maximum or a saddle is part of the surface
(Figure 8 and 9) [61]. DOE can be also used for drug-excipient compatibility studies [63].
Thus, RSM and DOE enable to explore the behavior of a formulation by changing the
concentration of the excipients, drug substance and process parameters according to today’s
requirements of ICH Q8 [1, 52, 64, 65].
Such a study can be called a “sensitivity analysis” of the robustness of a formulation to be
marketed. A “sensitivity analysis” is in general an integral part of an F-CAD (Formulation-
Computer Aided Design, see section 3.6.2) in-silico analysis searching the most robust tablet

Theoretical Introduction
17
formulation for a specific drug dissolution profile in different buffer media (pH 1.2, pH 6.8, pH
7.2 etc.). In the present study, F-CAD was tentatively applied to give an estimate for the
tablet disintegration time as the drug substance has extremely low water solubility.
Figure 7. Knowledge pyramid (according to Dr. A. Hussain, FDA) [62]
Figure 8. Hardness of a tablet as a function of compression force and concentration of
corn starch [61].

Theoretical Introduction
18
Figure 9. Hardness of a tablet as a function of compression force and concentration of
magnesium stearate [61].
Table 5 Three Dimensions on the Critical Path [64, 65]

Theoretical Introduction
19
Table 6 Working in Three Dimensions on the Critical Path [64, 65]
(C) H Leuenberger University of Basel Slid
FDA Whitepaper March 2004 Three Dimensions of the Critical Path
The simplest 2n design with two factors A, B including the Yates scheme is described below
in Table 7 and Figure 10. Table 7 and Figure 10 are part of Leuenberger’s lecture in
University of Basel for undergraduate students. Yates scheme of a 22 Design with A =
amount of maize starch (MS, lower level -: 10 mg, upper level +: 15 mg) and B =
compressional force (lower level -: 6 kN, upper level +: 8 kN). Please note that this is a
“tutorial” and the Results included in Table 7 corresponding to the percentage of drug release
after 1 hour. According to the Yates scheme, the effect of 2A, 2B and the interaction 2AB
between the factor A and B can be quantified. This is the most important point of using
factorial designs that it is possible to check for possible interactions and possible to quantify
such interactions. The evaluation of the above very simple design leads to the result below:
Table 7 2n design with n = two factors A, B including the Yates scheme
Yates A B AB Results
(1) - - + 82
a + - - 82
b - + - 78
ab + + + 95
Σ 2A 2B 2AB T/4

Theoretical Introduction
20
Figure 10. Graphical representation of the evaluation of the above Yates scheme with the
factor A = amount of maize starch (Menge Maisstärke) A0 and A1 and the factor
B (Presskraft) with the compressional force p0 and p1.
It is possible to write down the mathematical model F(x1, x2) of a 2n design with n = 2
factors (variable x1 corresponding to factor A, variable x2 corresponding to factor B) as
follows:
21122211021 ),( xxbxbxbbxxF Equation (3)
Equation 3 is called “summarizing equation” of the 22 design with b0 = T/4, b1 = A/2, b2 =
B/2 and b12 = AB/2 (interaction term). The values of A, B and AB can be simply calculated
using the Yates scheme of Table 7. Thus, e.g. the value of 2A is equal to the sum of the
column of the Results taking care of the plus or minus signs in the Table 7:
i.e. - 82% + 82% - 78% + 95% = 17% = 2A, - 82% - 82% + 78% + 95% = 9% = 2B
+ 82% - 82% - 78% + 95% = 17% = 2AB
i.e. b0 = T/4 = 84.25%, b1 = 4.25%, b2 = 2.25%, b12 = 4.25%
leading to the Equation 4:
)%..(),,( 21 dissolvedeixxF
2121 %25.4%25.2%25.4%25.84 xxxx Equation (4)

Theoretical Introduction
21
With the values of x1, x2 according to the coded values in Table 7, i.e. +1 or -1, evidently,
the summarizing equation is able to reproduce the result of each experiment [(1), a, b, ab] in
Table 7. Due to the fact that the 2n design is orthogonal, the value of the coefficients b1, b2,
and b12 can be compared directly. Please note that the value of b12, i.e. the interaction term
AB has the same magnitude, in fact identical in this case, as the effect of the factor A, which
is described with the value b1. Thus, it is important in pharmaceutical sciences that
interactions can play an important role, which can be detected with DOE but can be missed
by just doing a conventional experiment with changing only one factor a time and keeping
constant the remaining factors. However it has to be kept in mind in Table 7 that no
replicates of the experiments have been performed, i.e. the mathematical model F(x1, x2) is a
first approximation of the reality.
The simplest central composite design (CCD) with just two factors A, B (Table 8) is called a
“3 x 3” design which leads to the following nine experiments with the following factor levels; -
1 (lower level), +1 (upper level), 0 (mean of the levels +1, -1) and the level α, which depends
whether the central composite design (CCD) is orthogonal or rotatable. In case of two factors
A, B, the value of α is equal to 1.414 for a rotatable and equal to 1 for an orthogonal CCD.
Table 8 Central composite design (CCD) with just two factors A, B
Factor Experiment No.
A B
1 -1 -1
2 +1 -1
3 -1 +1
4 +1 +1
5 -α 0
6 +α 0
7 0 -α
8 0 +α
9 0 0

Theoretical Introduction
22
It is also possible to write down for a CCD as a summarizing equation (Equation 5), which
looks as follows for the factors A and B using the transformed variables z:
2222111112122211021 ),( zazazazazaaxxF Equation (5)
With z1 = x1 - m(x1), z2 = x2 - m(x2), z12 = x1 x2 - m(x1 x2), z11 = x12 – m(x1
2), z22 = x22 - m(x2
2),
m(x) means mean value of x, the value of x is again coded, i.e. -α, -1, 0, +1, -α in case of the
orthogonal CCD α is equal to 1. For the purpose that the coefficients a0, a1, a11, a12 and a22
are orthogonal, the mean of x12 and x2
2 needs to be equal to (4 + 2α)/9 = m(x12) = m(x2
2) [66].
It is important to keep in mind that the summarizing equation (Equation 5) of a CCD is only
able in a second approximation of the reality to yield as a response surface, which shows a
minimum a saddle point or a maximum. If the grid of the lattice is too large, it is possible that
a minimum surface may not be detected (see second CCD in section 6.11.3).
Please note that a formulation which contains three components such as maize starch (MS),
lactose (LA) and mefenamic acid (MA) can be easily reduced to a two component system
consisting of MS (disintegrant) and of the ratio LA/MA, which is the ratio of the hydrophilic
filler LA and the hydrophobic drug substance MA. Thus, it is possible to construct the
simplest CCD with two factors MS and LA/MA (see section 6.11.3).
For the evaluation of the CCDs in section 6.11.3, it is possible to use the software Design-
Expert 7®, which is able to calculate the r2 values among others, i.e. the percentage of the
data, which are explained by the mathematical model and is able to plot the corresponding
response surface in three dimensions.
3.3.2 dataNESIA software
Conventional RSM typically uses a linear regression model and a partial least square
regression (PLSR) model and a quadratic polynomial equation approximation to generate a
response surface from experimental data. However the prediction of pharmaceutical
responses based on the conventional RSM is often resulting in poor estimations for optimum
pharmaceutical formulation design because pharmaceutical formulations for solid dosage
forms are complex and heterogeneous disordered particles systems, which have non-linear
characteristics [67, 68]. Artificial neural network (ANN) may be used for pharmaceutical
formulation design which has non-linear characteristics; however it is laborious and time-
consuming task to find the optimum modeling [68].
Yamatake & Co., LTD. and Takayama [67, 68] have developed new RSM incorporating
multivariate spline interpolation (RSM-S) represented by a spline approximation (biharmonic
spline or thin-plate spline) [68-70], in order to interpolate the experimental data distributed at
random in a multidimensional space for the response surface generation.

Theoretical Introduction
23
3.3.3 Multivariate spline interpolation
Multivariate spline interpolation has been effectively used as a tool to interpolate altimeter
data in the field of geophysics. The basic concept of multivariate spline interpolation involves
a boundary element method which can be considered as the transformation equation of
elasticity such as a thin elastic beam shown in Figure 11 as an example [67].
Figure 11. A function y that passes through the data points y1 located at x1 is found by
applying point forces α1 to a thin elastic beam [67].
The experimental data were also considered as the variations at each point, and the spline
approximation gives the solution of transformation equation of elasticity to be minimized the
elastic strain energy (Equation 6) [70].
dsxfE s
22 Equation (6)
where ∇2 is the Laplacean and ∫s ds is the integration over all ranges
Green functions were used for solving Equation 6. The biharmonic spline used in this thesis
was expressed in Equation 7 [70].
in
ii dgy
1
Equation (7)
where n is the number of data points, di is the standardized Euclidian distance between x
corresponding to number i data point and the optimal x, g(di) is the green function whose
variables are di.
The definition of this function is changed by the dimensions of the input variable (x). αi is a
coefficient calculated by a linear matrix operation.

Theoretical Introduction
24
3.4 Percolation theory
3.4.1 Principles of percolation theory
Pharmaceutical formulations for solid dosage forms are complex and heterogeneous
disordered particular systems. Topological modeling is necessary to be taken into an account
for a geometrical description. Percolation theory is, in fact, one of the suitable topological
modeling tools to predict and simulate the geometric phase transitions in complex systems,
such as a tablet formulation [8]. Geometrical phase transitions are independent of physical
and chemical properties of the components. In other word, the geometrical phase transitions
have universally happened and this facilitates the modeling. Thus, percolation theory allows
finding the regions where the system undergoes the geometrical phase transition. It happens
at critical concentration of the components where a component percolates (percolation
threshold, pc) and where the system property often shows a great change, which is called as
catastrophic change in this thesis. In terms of tablet formulation design, such regions usually
linked to external value of properties such as water uptake, disintegration time, and
dissolution rate. It is essential to note that a percolation threshold is a volumetric (not a
mass) ratio (v/v) of the components from the view point of geometrical aspect. Percolation
theory itself is an instrument of probability theory.
This introduction to percolation theory cannot be exhaustive and follows the lines given by
Stauffer and Aharony. For detail understanding, it is recommended to read “Introduction to
percolation theory” [71]. There is the excellent Japanese translated textbook by Odagiri [72].
Percolation theory deals with the number and properties of those clusters [71]. The
underlying idea of cluster and its percolation is to see a system as composed of subunits
(site) that are distributed randomly on a two dimensional lattice. In the simplest case, the
lattice is square (Figure 12) and the squares are either occupied or empty. There are mainly
two kinds of cluster types, site cluster and bond cluster.
Site cluster
Some sites are occupied with a certain probability (ps) and some are empty with
certain probability (1 - ps). Site clusters are defined as groups of neighboring occupied
site shown as groups of circles in Figure 12.
Bond cluster
Each sites of the lattice are occupied, and some of them are connected though line
shown as circles connected by thick bars in Figure 12.
Gray colored circles represent the percolated cluster in the square lattice [73].

Theoretical Introduction
25
Figure 12. Groups of circles are defined as a site clusters and circles connected by thick
bars are defined bond clusters. Gray colored circles represent the percolated
cluster in the square lattice [73].
For the tablet formulation design, we assume that the packing geometry of particles in the
tablet is more important to consider than the collision of particle each other. Thus, this thesis
deals almost with site percolation.
In site percolation, the formation of clusters is a function of the occupation probability (p) of
the lattice chosen. Figure 13 and 14 show that a site percolation phenomenon with an
occupation probability (p) below and above the percolation threshold (pcs = 0.592746) in
square lattice respectively [71]. The percolation threshold is defined as an occupation
probability (p) where for the first time a percolating cluster is formed. Below percolation
threshold (pcs), only isolated clusters exist. However near the percolation threshold (pcs) an
‘infinite cluster’ is formed spanning the whole lattice from left to right and from top to bottom.
This ‘infinite cluster’ leads to the catastrophic change in the system.

Theoretical Introduction
26
Figure 13. Square lattice (site percolation, i.e. random occupation of lattice sites) with an
occupation probability (p) below the critical concentration, i.e. percolation
threshold (pc). No 'infinite cluster' is formed. Two finite clusters are shown [71].
Figure 14. Square lattice (site percolation) with an occupation probability (p) below the
critical concentration, i.e. percolation threshold (pcs). An 'infinite cluster'
percolates the system [71].

Theoretical Introduction
27
There are other lattices not only in two dimensions but also in three or more [71]. Examples
of two dimensions (a, b) and three dimensions (c-g) lattices are shown in Figure 15.
(a) Honeycomb (b) Triangular (c) Bethe (d) Simple cubic
(f) Face centered cubic (FCC)(e) Body centered cubic (BCC)
(g) Hexagonal close packing (h) Diamond
Figure15. Examples of two dimensions (a, b) and three dimensions (c-g) lattices.
(a) Honeycomb, (b) Triangular, (c) Bethe (coordination number z=3)
(d) Simple cubic, (e) Body centered cubic (BCC), (f) Face centered cubic (FCC)
(g) Hexagonal close packing, (h) Diamond
The main postulate of percolation theory is the probability (p) of forming an infinite cluster
spanning through the infinite lattice is the Kolmogorov's zero-one law [11]. As a small
isolated cluster grows, there will be a point, when for the first time it spans through the
system. The percolation threshold (pc) is a so-called as an infinite cluster through the system.
At or near the percolation threshold (pc), catastrophic change in the system occurs. A typical

Theoretical Introduction
28
example of catastrophic change can be seen in a particle mixture containing black particles
which are electrically conductive, and white particles which are insulators and are no
electrical conductivity. It is known that site percolation threshold on simple cubic lattice is
0.311608 [71]. If black/white particles system described in Figure 16 is composed to a tablet,
the tablet became electrically conductive just at the percolation threshold [74, 75].
Figure 16. A typical example of catastrophic changes in the system at or near the
percolation threshold (pcs = 0.311608).
where p is probability of black powder, I is electrical conductivity [75].
The percolation threshold (pc) is a quantity for a system depending on the lattice type, the
dimension of the system and on the type of percolation [71] (non-universality).
Three dimensions lattices should be considered for the designing of pharmaceutical tablets.
Critical parameters on three dimensional lattices are summarized in Table 9. For three
dimensional lattices face-centered cubic (FCC), body-centered cubic (BCC), simple cubic
(SC), diamond and random close packed (RCP), the threshold values have been calculated
[76, 77, 78, 79]. The threshold values for bond (pcb) and site (pcs) percolation are different
from the different lattices.
However, the key point is that critical volume fraction (c) is nearly constant, varying by just
a few percent from three dimensions lattice to lattice. The critical volume fraction (c) is close
to 0.16 (v/v) for the three dimensions as shown in Table 9, and is close to 0.45 (v/v) for the
two dimensions (universality) [77].

Theoretical Introduction
29
The relationship between c and pcs is expressed in Equation 8.
csc pf Equation (8)
where f is the filling factor of the lattice which represents the solid fraction of the volume,
and pcs is site percolation threshold (= critical concentration).
Table 9 Critical parameters on three dimensional lattices
Lattice pcb pcs Coordination
Number, z
Filling
Factor, f
z pcb f pcs
(c)
FCC 0.119[77] 0.198[77] 12[77] 0.7405[76, 77] 1.43 0.15
BCC 0.179[77] 0.245[77] 8[77] 0.6802[76, 77] 1.43 0.17
SC 0.247[77] 0.311[77] 6[77] 0.5236[76, 77] 1.48 0.16
Diamond 0.388[77] 0.428[77] 4[77] 0.3401[76, 77] 1.55 0.15
RCP 0.27[77] 6[78] 0.64[79] 1.62 0.17
Average 1.5 ± 0.1 0.16 ± 0.01
Thus, critical volume fraction (c = 0.16 ± 0.01, v/v) can predict the site percolation
threshold. Experiments were carried out to determine the conductivity threshold composed of
metallic and insulating spheres for random close packed (RCP). In this context, it is important
to realize, that the two components in the focus (metallic and insulating spheres) need to
have different properties to show the percolation effect such as an electric conductivity or
being an insulator. The critical volume fraction of metric sphere was in rough agreement with
0.16 (v/v) [80, 81, 82]. In addition, Wu and McLachalan [83] studied that critical volume
fraction (c) of graphite/boron-nitride composite was 0.15 (v/v), which was also close to 0.16
(v/v).
3.4.2 Application of percolation theory in pharmaceutical area
Percolation theory was introduced to design the pharmaceutical formulation by
Leuenberger [8, 84] for not only solid dosage form but also liquid dosage form [85]. Caraballo
et al. has applied the percolation theory to explain the influence of main formulation factors
on drug release from hydroxypropyl methylcellulose (HPMC) matrix system [86].
The percolation threshold of the water uptake [9, 10, 12], disintegration time [9-12] and
intrinsic dissolution rate [9, 10] of binary tablets has been investigated in our laboratory. In
case of disintegration time, the critical concentration of disintegrant for which the
disintegration time reaches a minimum was observed. Remarkably, the critical volume
fraction of continuous water conducting cluster as the value of 16 (% v/v) was concluded to
show the critical concentration of disintegrant in the random close packed (RCP) spherical

Theoretical Introduction
30
binary tablets [11, 12]. In order to design a pharmaceutical tablet formulation, the critical
concentration of disintegrant should be determined not only for binary tablets but also for
multicomponent tablets. Caraballo and Leuenberger et al. reported that the existence of a
‘combined percolation threshold’ of sum of all the hydrophilic substance was at ca. 35% v/v
in the ternary controlled release matrix system containing KCl, polyvinylpyrrolidone cross-
linked (PVP-CL) and Eudragit RS-PM [87]. No one, however, has reported experimentally
the location of critical concentration of disintegrant for a ternary immediate release
pharmaceutical tablet formulation.
3.5 Percolation threshold of disintegration time with particle packing
geometry considerations
Disintegration process of tablet in case of non-fibrous disintegrant, e.g. maize starch (MS)
is under the following conditions;
A disintegrant with swelling properties is present in the tablet.
The disintegrant itself is able to conduct water.
There is porous structure in the tablet which can conduct water by wicking.
Further theoretical postulates are based on the following assumptions regarding to the
particle packing geometry;
Pharmaceutical tablet is a random close packed (RCP) spheres system.
Drug and disintegrant particles are assumed to be spherical.
Particle size distributions are narrow but can be different for each component.
There is no significant deformation of drug particle within the compact.
3.5.1 Random close packed (RCP) spheres system
Particles in a pharmaceutical tablet are arranged in a disordered close packing. It is
assumed that spherical compacted particles can be placed at random and are in close
contact with their direct neighbors. Such a system is named random close packed (RCP)
spheres system. Macro observations of spheres in RCP reveals that the most stable,
probable and smallest local packing of spheres are hexagonal close packing or simple cubic
close packing highlighted by red in Figure 17.

Theoretical Introduction
31
Figure 17. Two dimensional view of a RCP spheres system with example (circle in red) of
the two smallest and most probable local packing: hexagonal close packing or
simple cubic close packing [12].
It has to be pointed out that a RCP system can be composed of different size. A few local
hexagonal close packing or simple cubic close packing can still be identified in a tablet.
3.5.2 Sphere caging and non-caging concept in case of binary RCP system
When RCP system is the binary system composed of small and bigger spheres, it is easier
to understand the concept of the sphere caging and non-caging concept [11, 12]. If the size
difference between two spheres is large enough, small sphere (red) can be caged by bigger
spheres (black) in a hexagonal close packing (Figure 18 (a)-1 or (a)-2). If a small sphere
(red) is too large for being caged but is still below the critical caging size, this sphere (red)
can be caged by bigger spheres (black) as a part of body centered cubic (BCC) (Figure 18
(b)). Above this critical caging size, caging by black spares in simple cubic (SC) is not
possible any more (Figure 18 (c)-1). The caging sphere (black) will be apart and caged
sphere (red) will be closer each other (Figure 18 (c)-2).
Thus sphere caging in RCP system can be distinguished as two classes. If the small
spheres can be caged by bigger sphere in hexagonal close packing or simple cubic close
packing, it is defined as case I. If not, it is defined as case II.

Theoretical Introduction
32
(a)-1 (a)-2 (b) (c)-1 (c)-2
Case I Case II
Figure 18. Sphere caging and non-caging for RCP system [12].
The radius r of the small sphere (red) that can be caged by four other bigger spheres
(black) of radius R in simple cubic (SC) can be calculated by Equation 9.
Rr 13 Equation (9)
According to Equation 9, if the r/R ratio is less or equal to 0.732 it is defined as case I. If not,
it is defined as case II.
3.5.3 Sphere caging and non-caging concept for binary drug/disintegrant tablet
When tablet is the binary system composed of spherical drug and disintegrant particles, it is
easier to understand how to apply previous concept of the sphere caging and non-caging for
binary RCP system into the pharmaceutical area. The case I and II described previously are
applied to the caging of disintegrant particles by drug particles. If a disintegrant particles can
be caged by drug particles as a part of body centered cubic (BCC) or simple cubic (SC), it is
classified as case I. If a disintegrant particles is too large for being caged by drug particles as
a part of body centered cubic (BCC), it is classified as case II. Thus, the drug particles will be
apart and disintegrant particles will be closer each other, and it is possible to create an
infinite cluster through a tablet depending on its probability. If r is the mean particle radius of
disintegrant and R is the mean particle radius of drugs, particle caging in a tablet in case of
binary system of spherical drug/disintegrant is classified by Equation 10 and 11.
Case I: Rr 13 Equation (10)
Case II: r > R13 Equation (11)

Theoretical Introduction
33
3.5.4 Water diffusion network for binary spherical drug/disintegrant tablet
When tablet is the binary system composed of spherical drug and disintegrant particles, it is
easier to understand how the water can diffuse into the previous concept of sphere caging
and non-caging in binary RCP system. Because it is important to consider and classify the
water diffusion networks in a tablet according to the percolation theory. According to the
percolation theory, a minimum disintegration time corresponds to the formation of a
continuous water-conducting cluster through the entire tablet. The water can diffuse between
drug particles by wicking (porous network) and through disintegrant particles (solid network).
In case I (left in Figure 19), the network created by disintegrant particles consists of the
porous network between drug particles caging disintegrant particles and disintegrant solid
network.
In case II (right in Figure 19), porosity and disintegrant represent two independent networks
for the water diffusion. However the porous network is assumed to be occupied by swelling
of big disintegrant particle.
Figure 19. Left: Water diffusion porous networks in case I, Right: Water diffusion solid
networks in case II.

Theoretical Introduction
34
3.5.5 Calculation of critical concentration of disintegrant for spherical binary
drug/disintegrant tablet
As shown in Table 9, critical volume fraction (c) of an ‘infinite cluster’ for random close
packing (RCP) spheres system is equal to 0.16 ± 0.01 (v/v). This value can be used for the
calculation of the critical concentration of spherical disintegrant in order to achieve the
minimum disintegration time of tablet.
When tablet is the binary spherical drug and disintegrant particles system, it is easier to
understand how to calculate the critical concentration of spherical disintegrant based on the
sphere caging and non-caging concept.
In the case I, the critical volume fraction of continuous water-conducting cluster involves
both critical volume fraction of disintegrant and critical volume fraction of pore. If it is
assumed that the porosity is constituted only by the pore between drug particles and pore is
spherical, the critical concentration of the disintegrant (v/v) can be calculated by Equation 12.
11,, disporecdiscc X
1
cdisX Equation (12)
where Xdis is the critical concentration of disintegrant in powder mixture (v/v), c is the
critical volume fraction of an ‘infinite cluster’ 0.16 ± 0.01 (v/v), c,dis is the critical volume
fraction of disintegrant (v/v), c,pore is the critical volume fraction of pore (v/v) and ε is the
tablet porosity (v/v).
In case II, porosity and disintegrant represent two independent networks for the water
diffusion. However the porous network is assumed to be occupied by swelling of big
disintegrant particles. The water diffusion through disintegrant particles is only taken into
account. Critical concentration of the disintegrant (v/v) can be calculated by Equation 13.
1, disdiscc X
1
,discdisX Equation (13)
where Xdis is the critical concentration of disintegrant in powder mixture (v/v), c is the
critical volume fraction of an ‘infinite cluster’ 0.16 ± 0.01 (v/v), c,dis is the critical volume
fraction of disintegrant (v/v) and ε is the tablet porosity (v/v).

Theoretical Introduction
35
Equation 14 represents a generalized model to determine the critical concentration of
spherical disintegrant for drug/disintegrant RCP sphere system.
1
c ; if 13 R
r CaseI
disX Equation (14)
1
c if R
r> 13 CaseII
where Xdis is the critical concentration of disintegrant in powder mixture (v/v), c is 0.16 ±
0.01 (v/v) and ε is the tablet porosity (v/v).
3.5.6 Critical exponent
Various system properties (X) related to the cluster is decided by the occupation probability
(p) of cluster in the system. System property related to the occupation probability (p) of
cluster can be described by the fundamental power law of percolation theory [74, 84] in
Equation 15.
qcppSX Equation (15)
where X is a system’s property, S is a proportionally constant (= scaling factor), p is an
occupation probability, pc is a critical concentration (= percolation threshold), q is a critical
exponent, close to the percolation threshold. Please note that the difference (p - pc) in
Equation 15 is considered as an absolute value, i. e. there are no negative value.
It is important to know that the critical exponent only depends on the dimension of the
system but neither on lattice type nor on percolation type (universality). For example, the
strength of the infinite cluster for probability p above the percolation threshold can be
described by Equation 16, the mean cluster size below the percolation threshold can be
described by Equation 17. System properties (X) and the corresponding critical exponents for
two dimensions (d = 2) and three dimensions (d = 3) are summarized in Table 10.
For this reason there are two approaches to predict the region of catastrophic change in
complex system by Equation 15 either to find the percolation threshold or to find the critical
exponents of the system.

Theoretical Introduction
36
Table 10 System properties X and the corresponding critical exponents for d = 2 and d = 3
[71, 73]
Critical exponent System property (X) Equation Exponent
d = 2 d = 3
Strength of infinite cluster |p-pc|β (16) β 5/36 0.4
Mean finite cluster size |p-pc|-γ (17) γ 43/18 1.8
Correlation length |p-pc|-ν (18) ν 4/3 0.9
Cluster number density |p-pc|2-α (19) α -2/3 -0.6
3.5.7 Fractal nature of infinite cluster near percolation threshold
Figure 20 and 21 show an infinite cluster at the percolation threshold in two dimensions [74,
88] and three dimensions [89, 90] respectively. The infinite cluster at the percolation
threshold exhibits a self-similar structure, which is a prerequisite to define a fractal dimension.
The fractal nature of a system is related to a certain scale length, which corresponds to the
correlation length ξ [74]. The fractal geometry introduced by Mandelbrot [91] was applied to
quantify the complexity of internal pore structure in a matrix type controlled release system
[92, 93].
The cluster mass Mξ in the volume ξd is proportional to ξdf by definition with df the fractal
dimension. A lattice of linear size L contain (L/ξ)d such volumes. Thus the total mass M∞ of
such a lattice is proportional to ξdf (L/ξ)d. The strength (P) of the infinite cluster is proportional
to M∞/Ld. Thus the following relationship holds (Equation 20) [74];
)()( dfdc
ddfd
ppL
MP Equation (20)
The critical exponent of the strength (P) of the infinite cluster is equal to β. Thus the fractal
dimension of the infinite cluster df can be calculated as follows for d = 2 and d = 3 (Equation
21):
/ dd f Equation (21)
where β and ν are indicated in Table 10, which are universal.

Theoretical Introduction
37
Figure 20. The infinite cluster at the percolation threshold exhibits a self-similar structure,
i.e. has a fractal dimension df = d - (β/ν) = 91/48 for d =2 [74, 88].
Figure 21. An idealized three dimensional network of a pore system (Menger sponge) with
the fractal dimension of d = 2.72 [89, 90].
3.6 F-CAD
3.6.1 Goal of in-silico pharmaceutical formulation design
The guideline published by the FDA (2004) [52] concerning the PAT-initiative presents a
framework with two components:
Set of scientific principles and tools supporting innovation.
Strategy for regulatory implementation that will accommodate innovation.
The goal of FDA’s PAT initiative is to achieve scientifically based decisions, i.e. to design
the quality of the product and not to “test-in” the quality by eliminating the bad items at the
end of the production creating waste of time and money [62]. The PAT-initiative is however a
recommendation to the pharmaceutical industry and not a compulsory regulation. In this
sense, FDA promotes as well the use of better manufacturing toolkit, in particular IT tools as
below; “Scientists involved in reviewing medical devices at FDA report an urgent need for
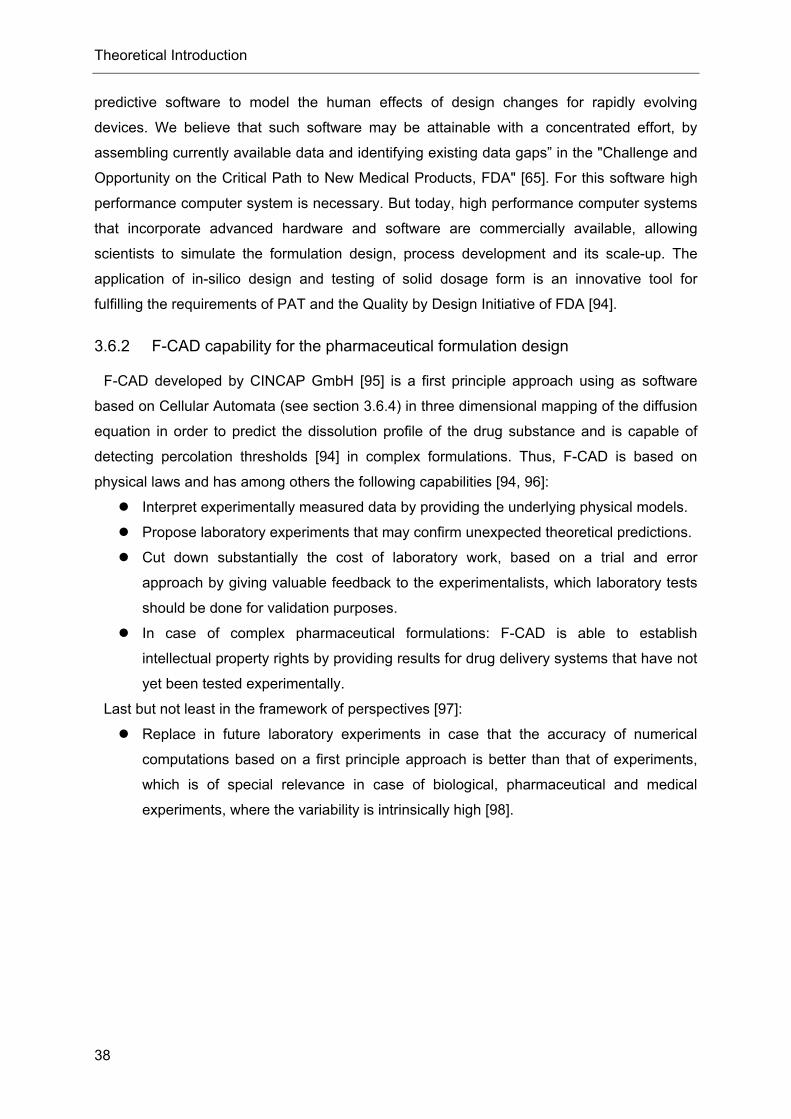
Theoretical Introduction
38
predictive software to model the human effects of design changes for rapidly evolving
devices. We believe that such software may be attainable with a concentrated effort, by
assembling currently available data and identifying existing data gaps” in the "Challenge and
Opportunity on the Critical Path to New Medical Products, FDA" [65]. For this software high
performance computer system is necessary. But today, high performance computer systems
that incorporate advanced hardware and software are commercially available, allowing
scientists to simulate the formulation design, process development and its scale-up. The
application of in-silico design and testing of solid dosage form is an innovative tool for
fulfilling the requirements of PAT and the Quality by Design Initiative of FDA [94].
3.6.2 F-CAD capability for the pharmaceutical formulation design
F-CAD developed by CINCAP GmbH [95] is a first principle approach using as software
based on Cellular Automata (see section 3.6.4) in three dimensional mapping of the diffusion
equation in order to predict the dissolution profile of the drug substance and is capable of
detecting percolation thresholds [94] in complex formulations. Thus, F-CAD is based on
physical laws and has among others the following capabilities [94, 96]:
Interpret experimentally measured data by providing the underlying physical models.
Propose laboratory experiments that may confirm unexpected theoretical predictions.
Cut down substantially the cost of laboratory work, based on a trial and error
approach by giving valuable feedback to the experimentalists, which laboratory tests
should be done for validation purposes.
In case of complex pharmaceutical formulations: F-CAD is able to establish
intellectual property rights by providing results for drug delivery systems that have not
yet been tested experimentally.
Last but not least in the framework of perspectives [97]:
Replace in future laboratory experiments in case that the accuracy of numerical
computations based on a first principle approach is better than that of experiments,
which is of special relevance in case of biological, pharmaceutical and medical
experiments, where the variability is intrinsically high [98].

Theoretical Introduction
39
3.6.3 F-CAD software applications
F-CAD software has three main parts: tablet geometry designer (TGD), process simulation
(PS), and 3-D rendering, analysis and playback (RAP) module [99]. Tablet geometry
designer (TGD) is specially focused on the pharmaceutical tablet design [100].
Disintegrant Optimization (DO)
This module calculates the critical concentration of disintegrant for a tablet
formulation based on the percolation theory. The percolation threshold of the
disintegration time is strongly dependent on the physical properties of the
components. Thus it can be estimated on the basis of geometrics and physical
consideration only.
Required information for calculation is;
- Volume of tablet
- Weight of tablet
- Mean particle size of the components
- True densities of the components
Dissolution Simulation (DS)
Cellular automate algorism is used to simulate tablet dissolution. Tablet to dissolve
in-silico must be previously designed by Tablet Designer (TD) module and Particle
Arrangement and Compaction (PAC) module. The release profile of the API is
calculated for each time point in accordance to initial setting value of individual
component.
Tablet Designer (TD)
This module serves to design tablet pattern and to transform it into a discrete 3D
virtual tablet. The shape of a tablet is not limited to classical ovals or circles but also
complex geometry.
Particle Arrangement and Compaction (PAC)
The arrangement of particles and their location in a tablet can be designed by this
module. Growth algorism is used to correspond to design the different size of
particles.

Theoretical Introduction
40
3.6.4 F-CAD core algorithm
F-CAD is mainly based on percolation theory and special core algorithm cellular automata
(CA) which is a sophisticated algorithm taken from nature phenomenon for the particulate
formulation design. This is the reason why F-CAD cannot be compared to existing "Expert
Systems" or "Artificial Neural Networks" [101, 102].
3.6.4.1 Cellular Automata
Cellular automata were first introduced by Von Neuman and Ulam in 1940s. They had been
looking for simple mathematical models describing phenomena in nature [103]. A cellular
automaton (CA) is one of the topological optimization techniques [104], which can be applied
in percolation theory. The underlying idea of cellular automata is to see a system as
composed of subunits (square cell) that are discrete regularly on a lattice. In other words, a
cellular automaton is a discrete model consisting of a regular domain of cells on a lattice.
This scheme is very close to the concepts used in percolation theory. Each cell is
characterized by a certain state, which typically consists of a finite domain. The system of
cells evolves, in discrete time step, like simple automata which only know a simple recipe to
compute their new state. New state of a cell at time t is a function of the states of a finite
domain composed of target cell and its neighborhood at time t-1 according to the locale rules
which depends only on the state of the cell and of the state of neighboring cell. The success
of the application of CA in deferent domains is mostly related to its ability to take into account
of the local interaction between spatial target cell and its neighborhood.
Thus CA is considered to be suitable tool to calculate the percolation threshold in case of
difficulty to calculate the percolation threshold by using percolation equation which can show
the entire system's characteristic or behavior.
3.6.4.2 Simplest examples of cellular automata application
An attempt to use the cellular automata for designing the pharmaceutical formulation was
conducted by CINCAP GmbH in 2007. Solid particle and liquid or porosity is represented of
the individual cell controlled by certain rule which guides its state changes. For example, the
solid particle cell is gradually changing its state after taking the liquid or porosity during the
disintegration of tablet. The rate at which the solid particle takes liquid or porosity is governed
by its solubility or volumetric change (swelling) rate constant which is unique for every API as
well as for new excipient and to be determined through a calibration routine. It is important to
note that the calibration routines for F-CAD are not necessary to be repeated every time the
system used before [100].

Theoretical Introduction
41
Now, one of the simplest one-dimensional cellular automata (CA) rule is introduced in order
to understand CA and its application, which is a preferred procedure in nature. Elementary
cellular automata have two possible states for each cell labeled 0 (white) and 1 (black)
(Upper Figure 22). New state of a cell at time t will be formed depending on the states of a
finite domain composed of target cell and its neighborhood at time t-1. Thus there are 2 x 2 x
2 = 8 possible states for the target cell as well as its neighborhood. The rule defining the
cellular automaton must specify the resulting state for each of these possibilities. Wolfram
[103] proposed the rule of cellular automata. Below show graphically the rule 30 and 16
updates of the system. The "00011110" is written 30 in binary. This is the reason why it is
called rule 30. A picture of a seashell pattern (Lower Figure 22) resembles the system
following the rule 30. Many other examples of similarity between CA based model and nature
behavior were exciting [100]. It is suggested that CA based models are capable of imitating
the behavior of nature system properties such as dissolution of tablet [100].
Figure 22. Upper: pattern of one dimensional cellular automata generated with rule 30
[103], Lower: natural pattern of a dangerous sea snail.

Theoretical Introduction
42
3.6.4.3 Application of cellular automata in pharmaceutical area
Cellular automata (CA) has been used for the sustained drug release modeling from
bioerodible polymer system by its surface erosion [105, 106], from non-erodible polymeric
system [107], polymer membrane system [107] and from swelling polymer system which
polymer absorbs water and creates the hydrogel layer [108]. In these models, each square
cell is ruled to be updated two dimensionally.
The handicap of two dimensional CA is considered that it is only able to show the
percolation threshold for a two dimensional system. Kier et al. investigated a CA model for
the dynamic two dimensional system (square lattice). In his report, the percolation threshold
spanning the cluster entire system was observed at the range of 0.512 to 0.661 [109]. This
was close to the site percolation threshold of square lattice, 0.592746, not for the three
dimensional system. On the other hand, each cubic cell in F-CAD is ruled to be updated for
three dimensional systems. F-CAD has more advantages to simulate the percolation
threshold or dissolution profile such as a three dimensional tablet. However the rule of CA to
simulate the drug release from three dimensional systems in F-CAD has not been disclosed
yet.

Objectives
43
4 Objectives
The objective of this PhD work is to search the critical concentration of starch based
disintegrant applying percolation theory and F-CAD (Formulation-Computer Aided Design) in
order to design a pharmaceutical tablet formulation for a low water-soluble drug. For the
pharmaceutical formulation design and process development, the use of scientific
approaches for the understanding of quality attributes in combination with the knowledge
management system are required for the purpose of quality by design (QbD) based on ICH
Q8.
Critical concentration of maize starch (MS) for a ternary mefenamic acid (MA) tablet
formulation with respect to a minimum disintegration time is investigated. The critical volume
fraction (c) for three dimensions investigated is equal to 0.16 ± 0.01 (v/v); which was
demonstrated to predict the conductivity threshold in the area of the material sciences. In our
laboratory, the critical volume fraction (c) for three dimensions (0.16 ± 0.01, v/v) has been
investigated to calculate the critical concentration of non-fibrous disintegrant, StaRX1500® for
the binary mixture of caffeine or paracetamol/StaRX1500® tablet [11, 12]. However the
further investigation is needed to determine the critical concentration of non-fibrous
disintegrant for not only binary tablets but also for pharmaceutical tablet formulation. No one,
however, has reported experimentally the location of critical concentration of disintegrant for
a ternary immediate release pharmaceutical tablet formulation. Percolation theory can lead to
the percolation threshold and critical exponent of disintegrate behavior but it does not give an
answer about the absolute value of the disintegration time. Thus, the Dissolution Simulation
(DS) module which is part of F-CAD being based on a cellular automata (CA) approach is
implemented to simulate the disintegration time of MA tablet. F-CAD is able to calculate,
applying CA with the number n of updates, ti necessary till water is detected at the geometric
center of the virtual tablet. Thus, it is possible to define a time t, i.e. the “time elapsed” till
water molecules have reached the center of the tablet. In a very first approximation, the
value of the calculated “time elapsed” can be considered as an estimate of the real
disintegration time. However, it has to be kept in mind that “time unit” for the updating event
has to be defined in an arbitrary, but reasonable way. In an earlier study (see PhD thesis of
Krausbauer [12] and Figure 9 of the paper in SWISS PHARMA [96]), a reasonable guess
was made for the updating “time unit” resulted in the fact that the real disintegration time
occurred after the water is detected at the geometrical center of the virtual tablet. It is evident
that there may be a link between the “time elapsed” to reach the geometrical center of the
tablet and the disintegration process, which may be different for non-fibrous starch type
disintegrants and for other types of disintegrants such as the “superdisintegrant” Ac-Di-Sol”.

Objectives
44
Comparison of experimental disintegration time and computed specific time point for water
to reach the geometric center of the tablet by using F-CAD software is useful to show the
capability of F-CAD for a tablet formulation design in order to save money by replacing
laboratory experiments. Thus, classical trial and error experiments can be avoided and only a
fraction of laboratory experiments need to be made for the validation of the best in-silico
formulations.

Materials and Methods
45
5 Materials and Methods
5.1 Materials
Mefenamic acid (2-[(2,3-Dimethylphenyl)amino]benzoic acid, Figure 23), hereinafter MA,
was purchased from Fluka Chemie GmbH, Lot No. 023K0927 (Buchs, Switzerland). Lactose
monohydrate (LA) (Lot No. 083451, USP/EP; Pharma 200/15, Alpavit, Lauben/Allgaeu,
Germany) and maize starch (MS) (Lot No. 41951073, USP/EP; Maisita 21.000-50, Agrana,
Gmuend, Austria) were used in the formulation of the ternary system with hydroxypropyl
cellulose (HPC SL) (Lot No. NCH-0911, EP/JP; HPC SL, Nippon soda, Tokyo, Japan) as a
binder for the wet granulation process. Magnesium stearate (Mg-St) (Lot No. K2 41155,
Actelion Pharma Schweiz AG, Allschwil, Switzerland) was used as a lubricant for tableting.
Figure 23. Chemical formula of mefenamic acid (MA)
5.2 Physical properties of starting materials
The physical properties of the above mentioned materials are compiled in Table 11. MA, LA,
MS and Mg-St was used as API, filler, disintegrant and lubricant respectively. The shape of
MA (Figure 24), LA (Figure 25), MS (Figure 26) and Mg-St (Figure 27) were examined by the
Scanning Electron Microscope (SEM) using JSM-5310LV (JEOL, Tokyo, Japan, Figure 28)
under the conditions described below;
Vacuum pressure:27 Pa (Low vacuum condition)
Accelerated voltage:15 kV
Current load:104 A
Table 11 Physical properties of the starting materials
Mean diameter True density SSA,
(m) (g/cm3) (m2/g)
MA 6.57 1.264 1.87
LA 39.4 1.556 0.33
MS 25.0 1.537 0.31
Mg-St 4.15 1.088 20.2

Materials and Methods
46
Figure 24. SEM of mefenamic acid (MA).
Figure 25. SEM of lactose monohydrate (LA).
Figure 26. SEM of maize starch (MS).

Materials and Methods
47
Figure 27. SEM of magnesium stearate (Mg-St).
Figure 28. Scanning Electron Microscope (JSM-5310LV, JEOL, Tokyo, Japan).
The mean diameter by volume of starting material was determined with a laser
diffractometer (HEROS & LODOS, Sympatec, Clausthal-Zellerfeld, Germany, Figure 29) at
500 mm focal length. The dispersing pressure was 0.2 MPa and the injector suction was 0.01
MPa. The particle size distribution of MA, LA and MS are shown in Figure 30, 31 and 32
respectively. The true density was measured by a helium pycnometer (AccuPyc 1330,
Micromeritics, Norcross, GA, USA, Figure 33) at room temperature. The cell and expansion
volume were 12.0563 cm3 and 8.4153 cm3, respectively. The equilibration rate was 0.01
psig/min, i.e. 68.91 Pa/min. The specific surface area (SSA) was determined by nitrogen
adsorption method using an automatic surface area analyzer (Gemini 2360, Micromeritics,
Norcross, GA, USA, Figure 34). For this purpose, MA, LA, MS and Mg-St MA was dried for 1
hour at 100 °C, LA for 1 hour at 80 °C, MS for 28 hours under vacuum at room temperature
(MS) and Mg-St for 2 hours at 40 °C, respectively. The measurements were performed using
a 6-point Brunauer-Emmett-Teller (BET) mode with nitrogen gas and a relative pressure
range between 0.05 and 0.30. Data were calculated according to BET methods [110].

Materials and Methods
48
Figure 29. Laser diffractometer (HEROS & LODOS, Sympatec, Clausthal-Zellerfeld,
Germany).
Figure 30. MA particle size distribution.
Materials and Methods
49
Figure 31. LA particle size distribution.

Materials and Methods
50
Figure 32. MS particle size distribution.
Figure 33. Pycnometer (AccuPyc 1330, Micromeritics, Norcross, GA, USA).

Materials and Methods
51
Figure 34. Automatic surface area analyzer (Gemini 2360, Micromeritics, Norcross, GA,
USA).
5.3 Granulation
Granulation was performed with 125 g batch per batch by fluidized bed granulator Mini-
Glatt (Glatt, Binzen, Germany, Figure 35). The starting compositions and quantity per batch
for the granulation are shown in Table 12 and 13 respectively. The compositions are
indicated by both % w/w, and % v/v. The composition of MA was increased by 10% w/w in
exchange of LA/MS (7/3) as excipients from Granule A to H. The composition of MS was
kept at 15% w/w, 21% w/w and 9% w/w from Granule I to K, L to M and N to O respectively.
The HPC SL solution of 6% w/v was top-sprayed as a granulating binder. The content of
HPC SL in the final granulate was kept at 3.5% (w/w) for all batches. The spraying rate of
HPC SL solution was kept at 6.4-10.6 g/min (Sci-Q pump, 323U/D, Watson-Marlow Bredel
Pumps, Falmouth, UK); the atomizing air pressure was kept at 0.04 MPa for all batches. The
inlet air temperature was varied within 70-80 °C; the fluidization air pressure was varied
within the range of 0.012-0.03 MPa. During the granulation, the product temperature and
relative humidity in the powder bed were monitored using a hygrometer (HMI41/HMP42,
VAISALA, Helsinki, Finland). Temperature and relative humidity (R.H.) were in the range of
22.6-33.3 °C and 46.3-85.7% R.H., respectively. Granulation time was kept within the range
of 753-1133 seconds. Drying was stopped when the product relative humidity (R.H.) was
below 5.0%.

Materials and Methods
52
Figure 35. Fluidized bed granulator Mini-Glatt (Glatt, Binzen, Germany).
Table 12 Starting compositions for wet granulation
Composition (%)
MA LA MS
(w/w) (v/v) (w/w) (v/v) (w/w) (v/v)
A 0 0 70 69.7 30 30.3
B 10 12.0 63 61.4 27 26.6
C 20 23.5 56 53.4 24 23.1
D 30 34.5 49 45.7 21 19.8
E 40 45.0 42 38.4 18 16.6
F 50 55.1 35 31.3 15 13.6
G 60 64.8 28 24.6 12 10.6
H 70 74.1 21 18.1 9 7.8
I 0 0 85 84.8 15 15.2
J 30 34.5 55 51.3 15 14.2
K 70 74.1 15 12.9 15 13.0
L 0 0 79 78.8 21 21.2
M 70 74.0 9 7.7 21 18.3
N 0 0 91 90.9 9 9.1
O 30 34.5 61 57.0 9 8.5

53
Table 13 Quantity per batch for granulation
Quantity per batch (g)
A B C D E F G H I J K L M N O
MA 0 12.5 25.0 37.5 50.0 62.5 75.0 87.5 0 37.5 87.5 0 87.5 0 37.5
LA 87.5 78.75 70.0 61.25 52.5 43.75 35.0 26.25 106.25 68.75 18.75 98.75 11.25 113.75 76.25
MS 37.5 33.75 30.0 26.25 22.5 18.75 15.0 11.25 18.75 18.75 18.75 26.25 26.25 11.25 11.25
Subtotal 125.0 125.0 125.0 125.0 120.5 125.0 125.0 125.0 125.0 125.0 125.0 125.0 125.0 125.0 125.0
HPC SL 4.38 4.38 4.38 4.38 4.38 4.38 4.38 4.38 4.38 4.38 4.38 4.38 4.38 4.38 4.38
Total 129.4 129.4 129.4 129.4 129.4 129.4 129.4 129.4 129.4 129.4 129.4 129.4 129.4 129.4 129.4

Materials and Methods
54
5.4 Tableting
For this study the resulting granules were fractionated in order to remove the fines (< 90
m) and the fraction above 500 m. Thus ensembles of the particles with the size between
90 m and 500 m were used for compression. They were mixed with 0.5% w/w of Mg-St in
a Turbula mixer (Type T2A, Willy A. Bachofen, Basel, Switzerland, Figure 36) for 2 minutes
and then compressed to a 416 mg (± 1.0%) tablets as described in Table 14. The mixtures
were compressed to tablets by using a compaction simulator (PressterTM, Metropolitan
Computing Corporation, East Hanover, NJ, Figure 37), mechanically simulating a high-speed
industrial rotary tableting press, Korsch PH 336 at the turret speed of 35 rpm corresponding
to the output capacity of 75,600 tablets per hour. The diameter of pre-compression roll and
compression roll was identical with those of Korsch PH 336, which are 110 mm and 300 mm,
respectively. The ejection angle was set to 7.6 °. Tablets were compressed at approximately
7.0 kN (6.6-7.4 kN), 5.0 kN (4.7-5.3 kN) and 3.0 kN (2.7-3.3 kN) with the dwell time of 16.9
ms using 10 mm flat-faced standard IPT B-tooling. Pre-compression force was kept between
0.6-1.7 kN. The dwell time (ms) was calculated by Equation 22 [23].
Dwell timeOCPCD
NSL
000,600,3 Equation (22)
where L is the diameter of the flat portion of the punch head (12.7 mm in the case of IPT,
Industrial Pharmaceutical Technology, standard B tooling), NS is the number of stations ,
PCD is the pitch circle diameter of the turret and OC is the output capacity in tablets per
hour.

Materials and Methods
55
Figure 36. Turbula mixer (Type T2A, Willy A. Bachofen, Basel, Switzerland).
Figure 37. Compaction simulator (PressterTM, Metropolitan Computing Corporation, East
Hanover, NJ)

56
Table 14 Tablet compositions
Quantity per tablet (mg)
A B C D E F G H I J K L M N O
MA 0 40 80 120 160 200 240 280 0 120 280 0 280 0 120
LA 280 252 224 196 168 140 112 84 340 220 60 316 36 364 244
MS 120 108 96 84 72 60 48 36 60 60 60 84 84 36 36
HPC SL 14 14 14 14 14 14 14 14 14 14 14 14 14 14 14
Subtotal 414 414 414 414 414 414 414 414 414 414 414 414 414 414 414
Mg-St 2 2 2 2 2 2 2 2 2 2 2 2 2 2 2
Total 416 416 416 416 416 416 416 416 416 416 416 416 416 416 416

Materials and Methods
57
5.5 Granules characterization
5.5.1 SEM
The shape of granule A, D, F and H were examined by the Scanning Electron Microscope
(SEM) using JSM-5310LV (JEOL, Tokyo, Japan) under the conditions described below;
Vacuum pressure:27 Pa (Low vacuum condition)
Accelerated voltage:15 kV
Current load:104 A
5.5.2 Moisture determination
Loss on drying of 1.5 g samples was measured at 80 °C for one hour using an infrared
drying unit (LP 16, Mettler, Greifensee, Switzerland, Figure 38).
Figure 38. Infrared drying unit (LP 16, Mettler, Greifensee, Switzerland).
5.5.3 Size distribution and Mean diameter
The size distribution of granule was evaluated by sieve analysis method using the 710, 500,
355, 250, 180, 125, and 90 m ISO-norm sieves. The sieves were vibrated at 50 Hz for 5 min
by using a sieve shaker (Vibro, Retsch, Haan, Germany, Figure 39). The sieve load was 25.0
g. The fraction remaining on each sieve was determined by weighing. The mean diameter
was calculated as 50% in diameter by plotting the cumulative percentage oversize against
sieve size on log-probability graph.

Materials and Methods
58
Figure 39. Sieve shaker (Vibro, Retsch, Haan, Germany).
5.5.4 Bulk, Tapped and Apparent density
Bulk and tapped density was calculated as the ratio of the weight to the volume of granules
poured into a glass cylinder without or with tapping using a Jolting volumeter (J. Engelsmann,
Ludwigshafen/Rhein, Germany, Figure 40) at a tapping rate of 247 taps per minute for one
minute. Apparent density of the granules (90-500 m) was measured using a pycnometer
(AccuPyc 1330, Micromeritics, Norcross, GA, USA) with helium gas at room temperature.
The cell and expansion volume were 12.0563 cm3 and 8.4153 cm3, respectively. The
equilibration rate was 0.01 psig/min, i.e. 68.91 Pa/min.
Figure 40. Jolting volumeter (J. Engelsmann, Ludwigshafen/Rhein, Germany).

Materials and Methods
59
5.5.5 Intragranular pore volume
Intrusion volume of mercury into the particle size fraction of granules (90-500 m) was
determined using a mercury porosimeter (Poresizer 9320, Micromeritics, Norcross, GA,
Figure 41) at different pressure ranging from 1.5 to 30,000 psia, i.e. from 10.34 kPa to
206.73 MPa, corresponding to the pore diameters between 120 m and 6 nm. Equilibration
time was 10 seconds at each pressure. The pore diameter corresponding to the intrusion
volume of mercury under a certain pressure was calculated by Equation 23 using mercury
porosimetry [111].
PKD washburm
cos4 Equation (23)
where D is the pore diameter (m), Kwashburn is the washburn constant, , γ is the surface
tension of mercury (485 × 10-5 N/cm), θ is the contact angle (130°) and P (psia) is the
pressure.
The pore diameter less than 14 m is assumed to be an intragranular pore open to the
surface [112].
Figure 41. Mercury porosimeter (Poresizer 9320, Micromeritics, Norcross, GA).
5.5.6 MA assay
414 mg of the particle size fraction of granules (90-500 m) was accurately weighed in a
volumetric flask. 30.0 mL of distilled water was added and shaken at the speed of 150 cycles
per minute (cpm) in a water bath at 37 °C for 30 min. 0.1 N NaOH was added accurately until
100.0 mL and filtered (HLC-DISK 13, 0.45 m, Kanto Chemical, Tokyo, Japan). The filtrate
was diluted to the range of 8-20 g/mL as MA concentration with 0.1 N NaOH and measured
by UV spectrophotometer (DU® 530, Beckman Coulter, Fullerton, CA, Figure 42) at 285 nm.

Materials and Methods
60
Figure 42. UV spectrophotometer (DU® 530, Beckman Coulter, Fullerton, CA).
5.6 Tablet characterization
5.6.1 Hardness and tensile strength
The hardness of six tablets was measured with a tablet tester (8M, Dr. Schleuniger
Pharmatron, Solothurn, Switzerland, Figure 43). The tensile strength of each tablet was
calculated by Equation 24 [113].
TD
HTS
2 Equation (24)
where TS is the tensile strength (N/cm2), H is the hardness (N), D is the diameter (cm)
and T is the thickness (cm) of a tablet, respectively. The diameters and thicknesses of the
tablets were measured with a digital caliper (Figure 44).
Figure 43. Tablet tester (8M, Dr. Schleuniger Pharmatron, Solothurn, Switzerland).

Materials and Methods
61
Figure 44. Digital caliper.
5.6.2 Calculated Porosity
The porosity of the tablets was calculated according to Equation 25 [112].
1001
1
V
M Equation (25)
where ε is the porosity (% v/v) of a tablet, M is the tablet weight (g), V is the tablet volume
(cm3) and ρ is the apparent density of granules (g/cm3) used for tableting.
5.6.3 NIR imaging
One faces of each tablet were imaged by chemical imaging system (Sapphire, Malvern
Instruments Ltd., UK, Figure 45). The instrument consists of a liquid crystal tunable filter
(LCTF) for wavelength selection, and cooled indium antimony (InSb) focal plane array (FPA)
detector with 256 × 320 pixels. The system includes an appropriate optics to preferentially
capture diffusely reflected light from each specimen, while minimizing background specular
reflection off polished mounting plate. Four tungsten source lamps illuminate the imaging
target field. The NIR imaging data of the diffuse reflection spectra were collected 10 nm
intervals in the 1200-2400 nm regions with 32 co-added scans at each wavelength point. The
spatial resolution of NIR imaging data in this experiment was 40 m/pixel, so the field of view
was 10.2 × 12.8 mm. The size of domain of each component which was defined as a group
of each component were measured based on the pixel size.

Materials and Methods
62
Optical parts
LCTF
FPA Detector
Sample
Sources
Figure 45. Chemical imaging system (Sapphire, Malvern Instruments Ltd., UK) [55].
5.6.4 Disintegration time
The disintegration time of the triplets of the tablets was measured by using the SOTAX
disintegration testing equipment (DT 2, Sotax, Allschwil/Basel, Switzerland, Figure 46)
without disk. The medium consisting of 750 mL distilled water was kept at 37 ± 0.5 °C. The
frequency of the basket-rack movement was kept at 30 cycles per minute.
Figure 46. Disintegration testing equipment (DT 2, Sotax, Allschwil/Basel, Switzerland).
5.6.5 Pore size distribution, Median pore diameter and Porosity
The pore diameter of tablet corresponding to the intrusion volume of mercury under a
certain pressure was calculated by Equation 23 using a mercury porosimeter. The median
pore diameter by volume was defined as the pore diameter at which 50% of the mercury
volume intruded up to 30,000 psia (VHg,30,000psia) [114]. The compact volume of tablet and

Materials and Methods
63
porosity (%) were measured by Equation 26 and Equation 27 respectively [111]. Tablets
before and after using a mercury porosimeter are pictured in Figure 47.
psiaHgCELLSAMPLE VVV 25, Equation (26)
1001 000,30,
SAMPLE
psiaHgSAMPLE
V
VVPorosity Equation (27)
where VSAMPLE is the sample volume (mL), VCELL is the sample cell volume (mL), VHg,25psia is
the mercury volume (mL) intruded up to 25 psia, i.e. 172.28 kPa.
Figure 47. Tablet before and after using a mercury porosimeter.
5.7 Data Analysis
5.7.1 Data treatment for NIR imaging
Data were treated using chemical imaging software (ISys, Malvern Instruments Ltd., UK).
That enables the simultaneous manipulation of 81,920 pixels from a single field of view. For
imaging analyses, the second derivative spectra calculated from the original data before
proceeding with further analyses were used. The concentration of the each component in
tablet was estimated by using the partial least square regression (PLSR) technique. No
concentration standards are required for this experiment, as the spectra of starting materials
were taken for reference.
5.7.2 Response surface methodology
The response surface of the disintegration time of tablet as a function of MA volume (%,
v/v) and maize starch volume (%, v/v), was established by dataNESIA software (Yamatake,
Fujisawa, Japan). Given method is based on the spline approximation incorporating the
multivariate interpolation.

Materials and Methods
64
5.7.3 Renormalization
The current study is focused as ternary formulation: MA, LA, MS in order to establish the
connectivity to the binary systems, the following renormalization leading to a dimension
reduction was applied (Equation 28):
MAMS
MSMS XX
XX
' Equation (28)
where X’MS is a volumetric part of maize starch recalculated for a binary system, XMS, XMA
are volumetric parts of maize starch and mefenamic acid, respectively.
The renormalization is mainly a technique to map three dimensional data down to two
dimensions. This dimension reduction is only possible and allowed due to the dominating
effect of MA in the tablet for concentrations of MA >> 23.5 % (v/v), i.e. for concentrations,
that exceed the percolation threshold of MA (pcMA). Thus, in practice it is important and
prerequisite to look only at formulations with a high dose of MA, i.e. with an MA load larger
than 20% (w/w). It has to be noted that proposed renormalization is independent on the
nature of a third component in the mixture. However, there are limitations. Thus, the
renormalization procedure should be applied with caution.
Depending on the situation, a renormalization process is not an absolute necessity as the
comparison between Figure 57 and 61 is documenting. Both figures show clearly the
behavior of the disintegration time of tablets compressed at 7 kN and the existence of the
percolation threshold. In case of Figure 57 as a function of the content of MA and in case of
Figure 61 as a function of the renormalized concentration of MS/(MS+MA). Instead of the
renormalization process mentioned above, an elegant solution for a reduction of one factor is
to introduce a ratio for one of the factors. Thus, in the case of three components MS, LA and
MA the reduction is as follows: factor A = MS and factor B= LA/MA. It is evident that the
second and the third component should not have a similar function as the disintegrant, which
is studied, i.e. the third as well as the second component should not show a swellability or
showing a function in competition with the excipient studied.
It has to be kept in mind that renormalization is possible if number of particles of third
component is significantly less than of the particles of the other components in the mixture. In
the present case this is guaranteed by high load of MA above the percolation threshold.
Another limitation is that the particles of the third component should preferably have a non-
fibrous structure, i.e. should look in an ideal case like a sphere. In addition, it should be kept
in mind that the majority of pharmaceutical formulations, which consist in reality of more than
two components can be reduced to two component systems in a really straight-forward way.

Materials and Methods
65
It is often absolutely correct to do the following abstraction from a complex tablet formulation
consisting of one single drug substance and e.g. seven other excipients. For the scientific
formulator, it will be important, at which volume fraction the drug substance will percolate.
Thus, it will be important to know the particle size distribution of the drug substance and the
particle size distribution of all other excipients involved. In other words, the scientific
formulator has reduced the complex, multi-component system to a simple binary system. The
same procedure can be applied for any other component in the system such as the
disintegrant. The system becomes more complicated if two different disintegrants are
involved in a complex formulation.
5.7.4 Assumption of disintegration time computed by F-CAD
Disintegrant Optimization (DO) module of F-CAD currently is used to calculate the critical
concentration of disintegrant in a tablet for a minimum disintegration time based on the
percolation theory. F-CAD cannot calculate the disintegration time because the mechanical
destructive force in disintegration testing [115] and/or the experimental method used in the
laboratory for example, with disk or without disk is not able to be taken into account.
In this PhD work, Dissolution Simulation (DS) module, which is the one of F-CAD are used
to simulate the disintegration time of a MA tablet compressed at 7 kN which is assumed that
the time elapsed till water is detected at the geometric center of the virtual tablet.
5.7.5 F-CAD operation
There are mainly three F-CAD operations [100] are required to compute the specific time
the water is detected at the geometric center of the virtual tablet.
Three dimensional design of MA tablet in order to create the wall constraint by Tablet
Designer (TD) module.
Packing the components of MA tablet into the hollow tablet by Particle Arrangement
and Compaction (PAC) module.
Compute the specific time elapsed until the water is detected at the geometric center
of the virtual tablet by Dissolution Simulation (DS) module.

Materials and Methods
66
5.7.5.1 Tablet Designer (TD) operation
Figure 48 shows the wall appearance of Tablet F (flat-face) compressed at 7 kN created by
TD module. Inputted parameters for Tablet F compressed at 7 kN are described as a sample
followings;
Number of Handles: 32
Smooth point: 5
Smooth (mm): 0
Circle, Radius (mm): 4.985
Flat portion, height (mm): 4.47
Elliptic Cap Radi. (mm): 4.985
Figure 48. Wall appearance of Tablet F compressed at 7 kN created by TD module of F-
CAD with permission from CINCAP GmbH.
5.7.5.2 Particle Arrangement and Compaction (PAC) operation
The second stage of F-CAD operation is an arrangement of MA granules and St-Mg and
their location in a tablet created by TD module. Before that, tablet created by TD module has
to be discretized in order to put the prerequisite number of three dimensional cells into it. In
this study, the number of three dimensional cell inside of the tablet was 104 which size was
96.15 m/cube side.
In order to simulate that granules are arranged into tablet, the ‘Swiss cheese’ procedure
developed by CINCAP GmbH was applied [100] because it is assumed that granulated
particle should be grown until a specified or sized size at limited location in a tablet as
competed with direct compressive tablet from powder mixture.

Materials and Methods
67
Figure 49 shows the top view of Tablet F (flat-face) compressed at 7 kN created by PAC
module. The order the each component was arranged is described below;
i. Grow LA
ii. Grow MS
iii. Distri. MA
iv. Distri. HPC SL
v. Distri Mg-St
vi. Remove LA and Grow LA (‘Swiss cheese’ procedure)
vii. Remove MA and MS
viii. Distri. MA and MS
Figure 49. The top view of Tablet F (flat-face) compressed at 7 kN created by PAC module
of F-CAD with permission from CINCAP GmbH.
Red: MA, Green: LA, Blue: MS, Yellow: HPC SL and Gray: Mg-St.

Materials and Methods
68
5.7.5.3 Dissolution Simulation (DS) operation
DS module can compute the specific time elapsed until the water is detected at the
geometric center of the virtual tablet in accordance to setting value of individual component
regarding to the water-solubility, swellability and hydrophilicity of pores defined in Table 15
as a surrogate as “Pore water solubility”. However, it is not currently possible to compute this
specific time in case there is no API in the tablet created by PAC modules. From a principal
point of view, it would be possible to calculate with F-CAD the dissolution profile of lactose
(LA) as a hydrophilic and well soluble ingredient (filler) and to determine the specific time till
the water molecules have reached the geometrical center of the tablet. However, in this PhD
work the dissolution profile of lactose was not calculated.
Table 15 Setting value of individual component
Setting values Components
(F-CAD classification) Water-solubility Swellability
MA (API) 27,000 0
LA (Non-swelling, soluble fillers) 65 0
MS (Spherical disintegrant, swelling) 500 5
HPC SL (Non-swelling, soluble binders) 690 5
Mg-St (Hydrophobic ingredient) 65,000 0
Porosity (Pore) 5 0

Results and Discussion
69
6 Results and Discussion
6.1 Physical properties of starting materials
MA, is a nonsteroidal anti-inflammatory agent classified as Class II on the basis of the
biopharmaceutical classification system [25, 116] because of its poor solubility over the pH
range 1.2 to 7.5 (Solubility: 0.2 g/mL (pH 1.2), 0.029 mg/mL (JP 2, pH 6.8), 0.12 mg/mL (pH
7.5)) [117, 118] and high permeability in Caco-2 cell model (Permeability coefficient = 17.9 ±
0.4 × 10⁻⁶ cm/sec) [118].
The mean diameter of MA, LA and MS was 6.57, 39.4, and 25.0 m, respectively. MA was
agglomerated by fine powder. The shape of each component was almost spherical, not
fibrous according to their SEM pictures. The true density of MA was determined to be 1.26
g/cm3 which was much lower than that of LA and MS. Specific surface area (SSA) of MA was
found to be 1.87 m2/g, which was much higher than that of LA and MS.
6.2 Granules characterization
6.2.1 Influence of loading volume of MA on granule characteristics
The characteristics of granules with increasing loading volume of MA in exchange of
lactose/maize starch (7/3) [42] as excipients from Granule A to H are given in Table 16a.
During the granulation process it was important to adopt the relatively low fluidized air
pressure in order to avoid adherence of starting materials to the upper part of the fluidized
bed granulator. MA is well known to be difficult to handle in fluidized bed granulation and
tableting processes due to the tendency to stick to surfaces [119]. Special attention was paid
to keep the bed expansion constant during the whole granulation process. The apparent
density of granules was decreasing with increasing loading volume of MA, although the
mean diameter, bulk and tapped density was independent thereof. In terms of granules
flowability, the flowability was no issue on the basis of Carr's index and Hausner ratio
regardless of the loading volume of MA.
The MA content of Granule B-C, D-E and F-H were determined to be 85-87%, 91-94% and
97-98% in comparison with the theoretical content, respectively. The decrease of MA content
determined to be 85-94% for the loading volume from 12.0-45.0% v/v can be explained by
the attachment of MA particles to the inner surface of the fluidized bed granulator. This was
attributed to the tendency of MA to stick to any type of surface. The decrease of MA content
with the loading volume from 55.1-74.1% v/v can be explained that a small fraction, i.e. 2-3%,
of MA powder can pass through the filter unit which has a pore size of 10 m. It should be
kept in mind that MA due to electrostatic effects easily forms agglomerates with a diameter

Results and Discussion
70
larger than 10 m. The loading volume of MA has to be taken into account for the
manufacturing process of fluidized bed granulation.

71
Table 16a Characteristics of Granule A to H
Granule (Loading volume of MA, % v/v)
/ Particle Size distribution (%)
A (0) B (12.0) C (23.5) D (34.5) E (45.0) F (55.1) G (64.8) H (74.1)
710 m on 0.6 0.04 0 0.04 0.04 0 0.2 0
500 m on 0.2 0.5 0.4 0.2 0.5 0.04 0.3 0.2
355 m on 4.8 10.7 5.9 4.3 6.4 2.0 12.0 5.0
250 m on 27.0 45.5 42.1 31.2 40.7 25.7 39.9 34.7
180 m on 40.8 29.4 31.6 39.0 30.2 39.0 22.3 29.4
125 m on 15.5 9.0 13.1 15.9 14.8 20.2 14.8 16.7
90 m on 6.1 2.4 5.5 5.8 4.4 8.5 5.9 8.0
90 m pass 5.0 2.4 1.2 3.7 3.0 4.6 4.6 6.0
Mean diameter (m) 223 267 250 230 247 212 253 228
Powder moisture before granulation (%) 2.32 2.13 2.78 2.32 2.68 2.50 1.37 0.79
Granules moisture after drying (%) 1.89 1.99 3.20 2.49 2.04 1.61 1.39 1.08
Yield (%) 97.0 95.0 94.6 91.5 93.8 93.9 90.4 92.1
Bulk density (g/cm3) 0.387 0.329 0.320 0.308 0.335 0.315 0.358 0.342
Tapped density (g/cm3) 0.426 0.373 0.363 0.354 0.382 0.363 0.413 0.392
Hausner ratio 1.1 1.1 1.1 1.1 1.1 1.2 1.2 1.2
Carr Index (%) 9.1 11.8 11.8 12.9 12.1 13.2 13.2 12.6
Yield (500-90 m, %) 91.4 92.2 93.0 87.9 90.5 89.6 85.7 86.4
Apparent density (g/cm3) 1.558 1.534 1.502 1.475 1.446 1.419 1.389 1.365
Assay (%) 0 84.6 86.9 91.2 93.7 97.8 97.0 97.9

72
Table 16b Characteristics of Granule I to O
Granule (Loading volume of MA, % v/v)
/ Particle size distribution (%)
I (0) J (34.5) K (74.1) L (0) M(74.0) N (0) O (34.5)
710 m on 0 0 0 0 0 0 0
500 m on 0.5 0.2 0 0.4 0.1 0.8 0.2
355 m on 9.8 3.2 0.6 10.2 0.6 13.2 3.8
250 m on 44.8 32.0 20.9 43.9 14.5 48.4 32.3
180 m on 28.2 36.8 41.4 30.0 36.0 27.8 38.0
125 m on 9.4 13.6 21.0 10.7 27.3 7.7 17.3
90 m on 3.3 8.2 7.2 3.0 13.4 1.8 5.4
90 m pass 4.0 6.0 8.9 2.0 8.0 0.4 3.1
Mean diameter (m) 261 223 199 263 184 281 230
Powder moisture before granulation (%) 1.23 2.50 1.59 2.49 1.57 1.80 1.22
Granules moisture after drying (%) 1.32 0.80 0.69 1.78 1.93 1.48 0.89
Yield (%) 91.8 93.4 88.1 95.6 89.6 99.1 95.2
Bulk density (g/cm3) 0.381 0.317 0.314 0.312 0.327 0.329 0.314
Tapped density (g/cm3) 0.436 0.365 0.365 0.361 0.385 0.377 0.370
Hausner ratio 1.1 1.2 1.2 1.2 1.2 1.1 1.2
Carr Index (%) 12.6 13.2 14.0 13.6 15.1 12.7 15.1
Yield (500-90 m, %) 87.6 87.6 80.2 93.3 82.3 98.0 92.1
Apparent density (g/cm3) 1.571 1.468 1.355 1.556 1.349 1.561 1.472

Results and Discussion
73
6.2.2 SEM of granules with increasing loading volume of MA
The SEM of MA granules A, D, F and H corresponding to 0%, 34.5%, 55.1% and 74.1% v/v
of MA magnified x 100 and x 350 are given in Figure 50a, 50b, 50c and 50d respectively.
The LA and MS particles were clearly observed in Granule A. MA particles were granulated
with nuclei of LA and MS particles in Granule D, F and H. In Granule H, however, almost LA
and MS particles were covered by MA particle. The dissolution rate of MA from granules
covered by MA such as Granule H is assumed to be slow.
Figure 50a. Left: Granule A (x 100) composed of 0% v/v MA. Right: Granule A (x 350)
composed of 0% v/v MA.
Figure 50b. Left: Granule D (x 100) composed of 34.5% v/v MA. Right: Granule D (x 350)
composed of 34.5% v/v MA.

Results and Discussion
74
Figure 50c. Left: Granule F (x 100) composed on 55.1% v/v MA. Right: Granule F (x 350)
composed on 55.1% v/v MA.
Figure 50d. Left: Granule H (x 100) composed on 74.1% v/v MA. Right: Granule H (x 350)
composed on 74.1% v/v MA.
6.2.3 Intrusion volume of mercury into granules with increasing loading volume of
MA
Intrusion volume of mercury into the granules prepared with increasing loading volume of
MA showed that the volume of intragranular pore which is assumed to be lower than 14 m
in diameter [112] was increasing with increasing loading volume of MA. It is assumed that
MA particles attached each other by only the effect of binder, which is HPC SL in this study,
without dissolving each other in the granules. The relationship between intragranular pore
volume and apparent density of granules are shown in Table 17 and Figure 51. With
increasing loading volume of MA, intragranular pore volume was increasing and apparent
density of granules was decreasing, although mean diameter, bulk and tapped density of
granules was independent thereof (Table 16a). This was attributed to the true density of MA
powder determined to be 1.26 g/cm3 (Table 11), which was much lower than that of LA and
MS in the granules.

Results and Discussion
75
Table 17 Intrusion volume of mercury into granules with increasing loading volume of MA
Granule Intrusion volume (mL/g)
(Loading volume of MA, % v/v)
Apparent density
(g/cm3) Total > 14 m < 14 m
A (0) 1.558 1.921 1.729 0.193
B (12.0) 1.534 2.112 1.837 0.275
C (23.5) 1.502 2.308 2.014 0.294
D (34.5) 1.475 2.485 2.213 0.272
E (45.0) 1.446 2.189 1.849 0.340
F (55.1) 1.419 2.427 2.038 0.388
G (64.8) 1.389 2.114 1.704 0.411
H (74.1) 1.365 2.170 1.781 0.389
Loading volume of MA (% v/v)
App
aren
t den
sity
, g/c
m3
(▲)
Intr
agra
nula
r po
re v
olum
e, m
L/g
(●
)
1.35
1.4
1.45
1.5
1.55
1.6
0.15
0.2
0.25
0.3
0.35
0.4
0.45
0 10 20 30 40 50 60 70 80
r2 = 0.8844
r2 = 0.9982
Figure 51. Relationship between intragranular pore volume (●) and apparent density (▲)
of granules.

Results and Discussion
76
6.3 Tablet characterization
6.3.1 Influence of loading volume of MA on compression behaviour
The characteristics of the tablets compressed at 7.0 kN from granules with increasing
loading volume of MA in exchange of LA/MS (7/3) as excipients from Tablet A to H are given
in Table 18a. The tensile force of Tablet A, B-E and F-H were 103, 128-134 and 142-143
N/cm2 respectively (Figure 52). Tensile strength of MA tablet can be divided into two groups
either Tablet B-E or F-H depending on the loading volume of MA. This was related to the
following considerations;
Porosity of MA tablet gradually decreased (Table 18a).
MA particles in a tablet increased, which particle size was smaller than that of LA and
MS (Table 11).
MA particles in a tablet increased due to the brittle behavior of MA during
compression [119].
Increasing intragranular porosity of granules was observed because the
fragmentation of lactose granules with a high intragranular porosity before
compaction was leading to smaller intergranular pores in the tablet [120, 121].
Linear increasing of thickness of tablets was also observed with increasing loading volume
of MA (Figure 52). It was increasing with decreasing of apparent density of granules
compressed into tablet as shown in Table 19 and Figure 53. It can be concluded that
thickness of tablet is completely decided by the apparent density of granules used for
compression.
The ejection force of tablets which is the friction between the die wall and the tablet surface
resulting from compression process increased with increasing loading volume of MA (Figure
54). This was also attributed to the tendency of MA to stick to any type of surface [119]. The
ejection force of tablet has to be taken into account for the manufacturing process of
tableting although there was no capping of tablet tendency in this experiment due to the
granules manufactured by fluidized bed granulator with spraying the HPC SL binder solution
[43].

77
Table 18a Characteristics of Tablet A to H compressed at 7 kN
Tablet
(Loading volume of MA, % v/v)
Weight
(mg)
Diameter
(mm)
Thickness
(mm)
Tensile strength
(N/cm2)
Cal. Porosity
(%)
Ejection force
(N)
A (0) 417.7 ± 0.82
(n=6)
10.0 ± 0.00
(n=6)
4.30 ± 0.01
(n=6)
103 ± 3.20
(n=6)
20.6 ± 0.32
(n=6)
109 ± 11.4
(n=26)
B (12.0) 416.5 ± 1.10
(n=6)
10.0 ± 0.01
(n=6)
4.24 ± 0.01
(n=6)
128 ± 4.64
(n=6)
18.2 ± 0.21
(n=6)
231 ± 8.57
(n=19)
C (23.5) 415.6 ± 1.07
(n=7)
9.96 ± 0.01
(n=7)
4.28 ± 0.01
(n=7)
133 ± 3.60
(n=7)
17.0 ± 0.28
(n=7)
357 ± 18.1
(n=20)
D (34.5) 417.5 ± 1.32
(n=7)
9.96 ± 0.01
(n=7)
4.35 ± 0.01
(n=7)
132 ± 3.89
(n=7)
16.6 ± 0.28
(n=7)
505 ± 18.6
(n=19)
E (45.0) 416.5 ± 0.73
(n=6)
9.97 ± 0.01
(n=6)
4.41 ± 0.01
(n=6)
134 ± 3.35
(n=6)
16.2 ± 0.20
(n=6)
593 ± 12.2
(n=18)
F (55.1) 416.7 ± 1.40
(n=6)
9.97 ± 0.01
(n=6)
4.47 ± 0.01
(n=6)
143 ± 7.14
(n=6)
15.8 ± 0.24
(n=6)
703 ± 22.5
(n=18)
G (64.8) 417.7 ± 0.55
(n=6)
9.97 ± 0.00
(n=6)
4.56 ± 0.00
(n=6)
142 ± 4.76
(n=6)
15.5 ± 0.14
(n=6)
697 ± 27.9
(n=18)
H (74.1) 416.9 ± 1.72
(n=6)
10.0 ± 0.01
(n=6)
4.65 ± 0.01
(n=6)
143 ± 3.52
(n=6)
16.4 ± 0.37
(n=6)
802 ± 19.6
(n=18)

78
Table 18b Characteristics of Tablet I to O compressed at 7 kN
Tablet
(Loading volume of MA, % v/v)
Weight
(mg)
Diameter
(mm)
Thickness
(mm)
Tensile strength
(N/cm2)
Cal. Porosity
(%)
Ejection force
(N)
I (0) 416.6 ± 0.43
(n=6)
10.0 ± 0.00
(n=6)
4.26 ± 0.01
(n=6)
97.6 ± 2.71
(n=6)
20.6 ± 0.16
(n=6)
209 ± 11.0
(n=24)
J (34.5) 415.0 ± 0.62
(n=6)
10.0 ± 0.00
(n=6)
4.34 ± 0.02
(n=6)
135 ± 2.10
(n=6)
17.0 ± 0.26
(n=6)
583 ± 12.9
(n=24)
K (74.1) 414.6 ± 1.02
(n=6)
10.0 ± 0.00
(n=6)
4.66 ± 0.02
(n=6)
129 ± 1.95
(n=6)
16.3 ± 0.32
(n=6)
989 ± 18.9
(n=25)
L (0) 417.5 ± 0.31
(n=6)
9.99 ± 0.01
(n=6)
4.27 ± 0.01
(n=6)
118 ± 1.96
(n=6)
19.7 ± 0.15
(n=6)
188 ± 18.6
(n=14)
M (74.0) 416.6 ± 0.75
(n=6)
9.99 ± 0.00
(n=6)
4.70 ± 0.01
(n=6)
131 ± 2.17
(n=6)
16.2 ± 0.11
(n=6)
1094 ± 38.4
(n=17)
N (0) 417.2 ± 0.48
(n=6)
9.99 ± 0.00
(n=6)
4.28 ± 0.02
(n=6)
125 ± 4.07
(n=6)
20.4 ± 0.47
(n=6)
323 ± 8.59
(n=16)
O (34.5) 417.2 ± 0.62
(n=6)
10.0 ± 0.01
(n=6)
4.38 ± 0.01
(n=6)
133 ± 4.58
(n=6)
17.4 ± 0.29
(n=6)
729 ± 17.8
(n=22)

79
Table 18c Characteristics of Tablet A to H compressed at 5 kN
Tablet
(Loading volume of MA, % v/v)
Weight
(mg)
Diameter
(mm)
Thickness
(mm)
Tensile strength
(N/cm2)
Cal. Porosity
(%)
Ejection force
(N)
A (0) 416.1 ± 0.31
(n=3)
9.94 ± 0.01
(n=3)
4.62 ± 0.01
(n=3)
58.3 ± 0.16
(n=3)
25.4 ± 0.22
(n=3)
183 ± 6.46
(n=18)
B (12.0) 415.6 ± 0.95
(n=3)
9.93 ± 0.01
(n=3)
4.62 ± 0.01
(n=3)
67.5 ± 2.14
(n=3)
24.3 ± 0.28
(n=3)
265 ± 8.24
(n=18)
C (23.5) 415.4 ± 0.75
(n=3)
9.93 ± 0.01
(n=3)
4.64 ± 0.01
(n=3)
70.1 ± 2.12
(n=3)
23.0 ± 0.14
(n=3)
342 ± 7.21
(n=18)
D (34.5) 416.4 ± 0.06
(n=3)
9.92 ± 0.01
(n=3)
4.66 ± 0.02
(n=3)
80.4 ± 1.77
(n=3)
21.6 ± 0.16
(n=3)
423 ± 7.14
(n=18)
E (45.0) 415.1 ± 0.83
(n=3)
9.93 ± 0.00
(n=3)
4.71 ± 0.01
(n=3)
79.0 ± 1.28
(n=3)
21.2 ± 0.07
(n=3)
495 ± 9.85
(n=18)
F (55.1) 416.1 ± 0.60
(n=3)
9.93 ± 0.01
(n=3)
4.77 ± 0.01
(n=3)
88.4 ± 0.86
(n=3)
20.5 ± 0.20
(n=3)
633 ± 16.5
(n=18)
G (64.8) 416.4 ± 0.12
(n=3)
9.94 ± 0.01
(n=3)
4.86 ± 0.01
(n=3)
84.8 ± 1.36
(n=3)
20.5 ± 0.22
(n=3)
701 ± 13.8
(n=18)
H (74.1) 417.2 ± 0.76
(n=3)
9.93 ± 0.00
(n=3)
4.95 ± 0.01
(n=3)
92.5 ± 0.53
(n=3)
20.2 ± 0.05
(n=3)
865 ± 13.3
(n=18)

80
Table 18d Characteristics of Tablet I to O compressed at 5 kN
Tablet
(Loading volume of MA, % v/v)
Weight
(mg)
Diameter
(mm)
Thickness
(mm)
Tensile strength
(N/cm2)
Cal. Porosity
(%)
Ejection force
(N)
I (0) 416.5 ± 0.64
(n=3)
9.99 ± 0.00
(n=3)
4.48 ± 0.02
(n=3)
70.2 ± 1.87
(n=3)
24.5 ± 0.36
(n=3)
190 ± 12.1
(n=20)
J (34.5) 416.0 ± 0.76
(n=3)
9.99 ± 0.01
(n=3)
4.60 ± 0.00
(n=3)
91.5 ± 1.34
(n=3)
21.3 ± 0.10
(n=3)
495 ± 13.6
(n=19)
K (74.1) 415.3 ± 0.78
(n=3)
9.99 ± 0.01
(n=3)
4.96 ± 0.01
(n=3)
83.5 ± 2.70
(n=3)
21.2 ± 0.28
(n=3)
816 ± 22.8
(n=18)
L (0) 413.7 ± 0.61
(n=3)
9.99 ± 0.00
(n=3)
4.53 ± 0.01
(n=3)
69.9 ± 1.76
(n=3)
25.1 ± 0.10
(n=3)
190 ± 5.06
(n=18)
M (74.0) 414.2 ± 0.06
(n=3)
10.0 ± 0.00
(n=3)
4.94 ± 0.01
(n=3)
87.2 ± 0.70
(n=3)
20.9 ± 0.09
(n=3)
807 ± 21.8
(n=19)
N (0) 416.3 ± 0.62
(n=3)
9.98 ± 0.01
(n=3)
4.46 ± 0.02
(n=3)
87.4 ± 1.83
(n=3)
23.4 ± 0.48
(n=3)
221 ± 9.04
(n=19)
O (34.5) 415.6 ± 0.95
(n=3)
9.99 ± 0.00
(n=3)
4.58 ± 0.02
(n=3)
90.4 ± 1.33
(n=3)
21.4 ± 0.09
(n=3)
482 ± 18.5
(n=18)

81
Table 18e Characteristics of Tablet A to H compressed at 3 kN
Tablet
(Loading volume of MA, % v/v)
Weight
(mg)
Diameter
(mm)
Thickness
(mm)
Tensile strength
(N/cm2)
Cal. Porosity
(%)
Ejection force
(N)
A (0) 416.2 ± 0.57
(n=3)
9.94 ± 0.01
(n=3)
5.03 ± 0.00
(n=3)
28.0 ± 0.02
(n=3)
31.6 ± 0.03
(n=3)
119 ± 4.54
(n=18)
B (12.0) 416.3 ± 0.55
(n=3)
9.93 ± 0.00
(n=3)
5.01 ± 0.01
(n=3)
36.3 ± 0.68
(n=3)
30.0 ± 0.08
(n=3)
170 ± 3.89
(n=18)
C (23.5) 415.8 ± 1.18
(n=3)
9.93 ± 0.01
(n=3)
5.00 ± 0.01
(n=3)
38.5 ± 0.06
(n=3)
28.5 ± 0.28
(n=3)
238 ± 7.33
(n=18)
D (34.5) 416.2 ± 0.62
(n=3)
9.93 ± 0.01
(n=3)
5.02 ± 0.01
(n=3)
43.5 ± 1.26
(n=3)
27.4 ± 0.11
(n=3)
292 ± 5.82
(n=18)
E (45.0) 416.8 ± 0.64
(n=3)
9.93 ± 0.00
(n=3)
5.03 ± 0.01
(n=3)
48.4 ± 1.28
(n=3)
26.0 ± 0.12
(n=3)
342 ± 17.6
(n=18)
F (55.1) 415.0 ± 0.56
(n=3)
9.92 ± 0.01
(n=3)
5.09 ± 0.02
(n=3)
52.6 ± 2.12
(n=3)
25.6 ± 0.28
(n=3)
432 ± 11.9
(n=18)
G (64.8) 416.8 ± 0.55
(n=3)
9.92 ± 0.01
(n=3)
5.21 ± 0.01
(n=3)
52.2 ± 0.83
(n=3)
25.5 ± 0.34
(n=3)
457 ± 8.79
(n=18)
H (74.1) 416.6 ± 0.61
(n=3)
9.93 ± 0.01
(n=3)
5.28 ± 0.01
(n=3)
56.9 ± 0.82
(n=3)
25.2 ± 0.11
(n=3)
580 ± 12.4
(n=18)

82
Table 18f Characteristics of Tablet I to O compressed at 3 kN
Tablet
(Loading volume of MA, % v/v)
Weight
(mg)
Diameter
(mm)
Thickness
(mm)
Tensile strength
(N/cm2)
Cal. Porosity
(%)
Ejection force
(N)
I (0) 416.1 ± 0.38
(n=3)
9.99 ± 0.00
(n=3)
4.87 ± 0.01
(n=3)
34.9 ± 0.78
(n=3)
30.5 ± 0.08
(n=3)
118 ± 7.43
(n=18)
J (34.5) 416.4 ± 0.55
(n=3)
9.99 ± 0.01
(n=3)
4.99 ± 0.01
(n=3)
47.7 ± 0.85
(n=3)
27.4 ± 0.29
(n=3)
347 ± 15.0
(n=19)
K (74.1) 415.7 ± 0.36
(n=3)
10.0 ± 0.00
(n=3)
5.38 ± 0.01
(n=3)
46.2 ± 2.01
(n=3)
27.3 ± 0.10
(n=3)
540 ± 16.1
(n=18)
L (0) 415.5 ± 1.00
(n=3)
9.99 ± 0.00
(n=3)
4.93 ± 0.02
(n=3)
34.9 ± 1.30
(n=3)
30.9 ± 0.09
(n=3)
141 ± 8.26
(n=18)
M (74.0) 415.9 ± 0.71
(n=3)
10.0 ± 0.00
(n=3)
5.39 ± 0.01
(n=3)
43.3 ± 1.88
(n=3)
27.2 ± 0.26
(n=3)
551 ± 11.7
(n=19)
N (0) 417.0 ± 0.38
(n=3)
9.98 ± 0.00
(n=3)
4.88 ± 0.01
(n=3)
41.9 ± 0.09
(n=3)
30.0 ± 0.20
(n=3)
169 ± 7.62
(n=19)
O (34.5) 417.1 ± 0.40
(n=3)
9.99 ± 0.00
(n=3)
4.98 ± 0.02
(n=3)
50.4 ± 0.84
(n=3)
27.3 ± 0.25
(n=3)
300 ± 13.5
(n=18)

Results and Discussion
83
120
125
130
135
140
145
150
4.2
4.3
4.4
4.5
4.6
4.7
0 10 20 30 40 50 60 70 80
Loading volume of MA, % (v/v)
Tens
ile s
tren
gth,
N/c
m2
(▲)
Thi
ckne
ss,
mm
(●
)
r2 = 0.9786
Figure 52. Thickness and tensile strength of tablets compressed at 7.0 kN from granules
with increasing loading volume of MA.
Table 19 Relationship between apparent density of granules and tablet thickness
compressed at 7.0 kN
Granule Thickness (mm)
(Loading volume of MA, % v/v)
Apparent density
(g/cm3) Average S.D.
A (0) 1.558 4.30 0.01
B (12.0) 1.534 4.24 0.01
C (23.5) 1.502 4.28 0.01
D (34.5) 1.475 4.35 0.01
E (45.0) 1.446 4.41 0.01
F (55.1) 1.419 4.47 0.01
G (64.8) 1.389 4.56 0.004
H (74.1) 1.365 4.65 0.01

Results and Discussion
84
1.35
1.4
1.45
1.5
1.55
1.6
4.2
4.3
4.4
4.5
4.6
4.7
0 10 20 30 40 50 60 70 80
Loading volume of MA, % (v/v)
App
aren
t den
sity
(g/c
m3 )
(▲)
Thi
ckne
ss,
mm
(●
)
r2 = 0.9786
r2 = 0.9994
Figure 53. Relationship between apparent density of granules and tablet thickness
compressed at 7.0 kN.
Loading volume of MA (% v/v)
Eje
ctio
n fo
rce
(N)
0
150
300
450
600
750
900
0 10 20 30 40 50 60 70 80
r2 = 0.9772
Figure 54. Relationship between loading volume of MA and ejection force of tablets
compressed at 7.0 kN.

Results and Discussion
85
6.3.2 Visual inspection on tablet characteristics using NIR imaging
In order to get the more scientific understanding of the tablet characteristics, especially for
tensile strength of tablet, near infrared (NIR) imaging technology has been applied to
visualize their component distribution on the tablet surface compressed at 7.0 kN according
to the loading volume of MA. Figure 55 shows the distribution of the predicted concentration
for MA, LA, MS by partial least square regression (PLSR) technique on one surface of each
tablet from A to H. The intensity spectral from a second derivative calculation was illustrated
as a color. MA, LA and MS were showed by Red, Green and Blue respectively and overlaid
as a Red-Green-Blue (RGB) imaging [55].
MA has been well distributed homogenously with increasing the loading volume of MA from
RGB imaging visually. In Tablet H, LA and MS particles are located on the surface of tablet
although LA and MS particles are covered by MA particles in the Granules H. LA and MS
particles should be located in order to induce the water into tablet for the disintegration.
A
millimeter
mill
imet
er
Figure 55a. RGB imaging of Tablet A (MA: 0% w/w).

Results and Discussion
86
B
millimeter
mill
imet
er
Figure 55b. RGB imaging of Tablet B (MA: 10% w/w, 12.0% v/v).
C
mill
imet
er
millimeter
Figure 55c. RGB imaging of Tablet C (MA: 20% w/w, 23.5% v/v).

Results and Discussion
87
Dm
illim
eter
millimeter
Figure 55d. RGB imaging of Tablet D (MA: 30% w/w, 34.5% v/v).
E
mill
imet
er
millimeter
Figure 55e. RGB imaging of Tablet E (MA: 40% w/w, 45.0% v/v).

Results and Discussion
88
F
millimeter
mill
imet
er
Figure 55f. RGB imaging of Tablet F (MA: 50% w/w, 55.1% v/v).
G
millimeter
mill
imet
er
Figure 55g. RGB imaging of Tablet G (MA: 60% w/w, 64.8% v/v).

Results and Discussion
89
H
millimeter
mill
imet
er
Figure 55h. RGB imaging of Tablet H (MA: 70% w/w, 74.1% v/v).
6.3.3 MA domain size with increasing loading volume of MA in tablet
Mean domain size of each component on the surface of tablets compressed at 7.0 kN was
determined by the pixel size of NIR imaging as shown in Table 20 and Figure 56. The
domain size of MA was increasing up to the 45.0% v/v (Tablet E) loading volume of MA.
Then its domain size was decreasing with increasing the loading volume of MA up to the
74.1% v/v (Tablet H) although the domain size of LA and MS was kept constant. This
revealed that the decreasing the domain size of MA also resulted in increasing the tensile
strength of tablet due to increase the number of MA particle in tablet because the tensile
strength of tablet has jumped from Tablet E to F corresponding to 45.0% v/v to 55.1% v/v of
MA in Figure 52. It is concluded MA is key attribute on the tablet characteristics in terms of
thickness and tensile strength as compared with LA and MS.

Results and Discussion
90
Table 20 Mean domain size of MA, LA and MS on the tablet surface
Tablet Mean domain size (m)
(Loading volume of MA, % v/v) MA LA MS
A (0) ― 104 94.3
B (12.0) 171 95.2 83.4
C (23.5) 193 97.1 74.0
D (34.5) 211 104 83.0
E (45.0) 211 111 85.3
F (55.1) 177 123 81.4
G (64.8) 137 138 74.8
H (74.1) 83.2 118 82.9
50
75
100
125
150
175
200
225
0 10 20 30 40 50 60 70 80
Loading volume of MA, % (v/v)
Mea
n d
omai
n si
ze, m
Figure 56. Mean domain size of MA (●), LA (▲) and MS (■) on the tablet surface with
increasing loading volume of MA.
6.3.4 Tablet disintegration time
The disintegration process is an important factor for drug dissolution, especially for drugs
with low solubility in water or in gastrointestinal fluids. The disintegration time of tablets
compressed at 7.0 kN was roughly constant up to 34.5% v/v (Tablet D) loading volume of MA,
and then decreased to a minimum with 55.1% v/v (Tablet F) loading volume of MA and finally
increased again with increasing the loading volume of MA up to 74.1% v/v (Tablet H) as
shown in Table 21 and Figure 57. The decreasing volume of MS in the tablet as a
disintegrant from 30.3% v/v to 13.6% v/v corresponding to the increasing loading volume of

Results and Discussion
91
MA from 0% v/v to 55.1% v/v is suggested to have a positive influence on the disintegration
process [122].
Leuenberger et al. found the amount (% v/v) of StaRX1500® corresponded to the critical
concentration, i.e. to the percolation threshold in terms of percolation theory, of StaRX1500®
for binary mixture: caffeine or paracetamol - StaRX1500® [9-12]. It is important to mention
here that percolation threshold of disintegrant is also found for an immediate release of a
realistic pharmaceutical tablet formulation in this study.
Table 21 Disintegration time of tablets compressed at 7.0 kN
Tablet
(Loading volume of MA, % v/v)
Disintegration time (sec.)
(n=3)
A (0) 550 ± 23
B (12.0) 596 ± 8
C (23.5) 616 ± 6
D (34.5) 604 ± 21
E (45.0) 428 ± 16
F (55.1) 266 ± 8
G (64.8) 453 ± 24
H (74.1) 758 ± 15
0
100
200
300
400
500
600
700
800
900
0 10 20 30 40 50 60 70 80
Loading volume of MA (% v/v)
Dis
inte
grat
ion
tim
e (
sec.
)
(30.3)
(26.6) (23.1) (19.8)
(16.6)
(13.6)
(10.6)
(7.8)
Figure 57. Disintegration time of tablets compressed at 7.0 kN with increasing loading
volume of MA. The volume (% v/v) of MS in tablet is represented in brackets.

Results and Discussion
92
6.3.5 Pore size distribution, Median pore diameter and porosity
In order to consider the other factors related to the minimum disintegration time of tablet
compressed at 7.0 kN, which was found with 55.1% v/v (Tablet F) loading volume of MA
[122], the pore size distribution, median pore diameter by volume and porosity of tablet were
investigated. The pore diameter of tablets compressed from granules prepared at different
loading volumes of MA corresponding to the intrusion volume of mercury was plotted to show
the pore size distribution of tablet (Figure 58). With increasing loading volume of MA, the
volume of large pore of tablet was decreasing and the peak of pore size distribution was
shifting towards the smaller pore diameter. The median pore diameter and porosity are
shown in Table 22. The median pore diameter and porosity of tablets was gradually
decreasing with increasing loading volume of MA which was same results with when porosity
was calculated by Equation 25. It is suggested that the calculated porosity is enough to
evaluate the tablet properties in this study. This linear trend was not observed with the
results obtained by measuring the disintegration time of the tablets. It can be concluded that
the pore diameter and porosity of tablet was not a significant parameter in this study to
explain the minimum disintegration time which was found with 55.1% v/v (Tablet F) loading
volume of MA. Further, it can be concluded that the dominant factor on disintegration for MA
tablets was the swelling property of MS in the tablet. The critical concentration of disintegrant
(% v/v) can exert the swelling property on the surrounding particles and induce water for
more effective disintegration of the tablet.
Below and above the critical concentration of disintegrant, the disintegration time was
increasing, giving a typical V-shape curve. The increase of disintegration time above the
critical concentration of disintegrant was assumed so far as followings;
There is not enough space for disintegrant particles to expand in the tablet. The
excess of disintegrant particles might start retarding the swelling properties of MS
each other [122].
The continuous cluster of disintegrant particles or pores conducting water might starts
to extend by forming dead-end arms from the backbone (excess of disintegrant). The
increased complexity of the network retards the penetration of water within the tablet
as compared with the continuous cluster at the percolation threshold [12].

Results and Discussion
93
0
0.01
0.02
0.03
0.04
0.05
0.06
0.1110
ABCDEFGH
Pore diameter (m)
Intr
usio
n vo
lum
e of
mer
cury
(m
L/g
)
Figure 58. Pore size distribution of tablets compressed at 7.0 kN with increasing loading
volume of MA.
Table 22 Median pore diameter, Porosity of tablets compressed at 7.0 kN
Median pore diameter (m)
(n=1)
Porosity (%)
(n=1)
Cal. Porosity (% v/v)
(n=6-7)
∆ %
A 1.365 22.3 20.6 ± 0.32 1.7
B 0.893 20.4 18.2 ± 0.21 2.2
C 0.620 19.6 17.0 ± 0.28 2.6
D 0.483 19.4 16.6 ± 0.28 2.8
E 0.341 18.6 16.2 ± 0.20 2.4
F 0.307 18.5 15.8 ± 0.24 2.7
G 0.255 18.1 15.5 ± 0.14 2.6
H 0.232 17.9 16.4 ± 0.37 1.5
6.4 Focus on searching the critical concentration of MS
The minimum disintegration time (266 ± 8 sec.) of tablet compressed at 7.0 kN for MA
tablet has been determined for a ternary composition of 55.1% v/v (50% w/w) MA, 31.3% v/v
(35% w/w) LA and 13.6% v/v (15% w/w) MS [122]. However, it has to be kept in mind that it
was not a truly ternary components system as the ratio of LA/MS (7/3) was kept constant
[122]. In the following section, the ratio of LA to MS has been extended to correspond to a
truly ternary components tablet formulation [123]. It also has to be kept in mind again that up

Results and Discussion
94
to now there is no universal science-based formulation technique for low water soluble drugs.
Therefore several research groups reported about the critical concentration of disintegrant
that is required to achieve the minimum disintegration time [2-6]. Determination of the critical
concentration of disintegrant is an important parameter for design of a tablet formulation,
especially for low water soluble drugs as mentioned above, to increase the specific surface
area by an optimal and fast disintegration.
Ringard and Guyot-Hermann [7] have introduced the following equation for the calculation
of the most effective disintegrant concentration by taking into account the geometrical
description of the involved particles (drug or filler, disintegrant) and the change of the particle
size of the disintegrant due to swelling (Equation 29).
ss D
D
D
DM
1
1
3
2
1
2
1 1132.0
Equation (29)
where Ms is an optimal amount of disintegrant (w/w), ρ1, ρ2 (g/cm3) are true densities of
disintegrant and active substance respectively; D1, D2 are average diameters (Ferret’s
diameters) of dry disintegrant particles and active substance, respectively; D1s is an
average diameter of the swollen disintegrant particle.
This equation was described by assuming that the fine particles of the disintegrant form an
“infinite” network and cover totally the surface of the coarser drug particles.
Krausbauer, Puchkov and Leuenberger [11, 12] have finally proposed the caging and non-
caging concept (Equation 14) in order to calculate the critical concentration of non-fibrous
disintegrant in a binary tablets composed of caffeine or paracetamol and partially
pregelatinized maize starch, StaRX1500®.
However the further investigation is needed to determine the critical concentration of non-
fibrous disintegrant not only for binary tablets but also for ternary pharmaceutical tablets. No
one, however, has reported experimentally the location of critical concentration of
disintegrant for a ternary immediate release pharmaceutical tablet formulation.
The holistic description is an important issue as formulations are complex systems such as
pharmaceutical tablet formulation and its quality of the product depends on the variability of
the manufacturing processes involved and on the variability of the physical and chemical
quality of the components in the tablet. The number of compositions has increased and each
composition of granules was compressed at not only 7 kN but also 5 kN and 3 kN. Thus the
results of the tensile strength, porosity and disintegration time are listed in Table 23 as a
physical description and documentation of the tablet quality.
Figure 59 shows the response surfaces of disintegration MA tablets compressed at 7 kN, 5
kN and 3 kN as a function of MA (% v/v) and MS (% v/v). Minimum disintegration time of

Results and Discussion
95
tablets compressed at 7 kN and 5 kN was found for the Tablet O, F and M corresponding to
34.5% v/v, 55.1% v/v and 74.0% v/v of MA respectively. The minimum disintegration time of
MA tablets was surprisingly observed at a ratio of MS/MA = 0.25. However, a catastrophic
change reading to disintegration time of MA tablets compressed at 3 kN was not strongly
observed. The dominant network that the water can diffuse for the disintegration of MA tablet
is considered through the disintegrant network, not through the porous network. On the other
hand, the disintegration time of Tablet A, I, L and N corresponding to 0% v/v of MA was
almost constant regardless of the porosity of tablet.
A
BC
D E F G
H
KM
JO
L
I
N
Figure 59a. Response surfaces of disintegration MA tablets compressed at 7 kN as a
function of MA (% v/v) and MS (% v/v).

Results and Discussion
96
300
350
400
450
500
550
600
650
0 10 20 30 40 50 60 70
10
15
20
25
30
MA (% v/v)
MS
(%v/
v)
344.4576
381.
6619
381.6619
418.8661
418.8661
456.0704
456.
0704
456.0704
493.
274
6
493.
2746
493.2746
493.2746
530.
4789
530.
4789
530.4789
530.4789
567.6831
567.6831
567.
6831
567.
6831
604.8874
604.8874
604.
8874
604.
8874
642.0916
642.
0916
Figure 59b. Response surfaces of disintegration MA tablets compressed at 5 kN as a
function of MA (% v/v) and MS (% v/v).
300
400
500
600
700
800
0 10 20 30 40 50 60 70
10
15
20
25
30
MA (% v/v)
MS
(%v/
v)
298.3658
35
6.935
2415.5047
474.0741
474.0741
532.6436
532.6
436
591.213
591.213
591.213
649.7825
649.7
825
649.
7825
649.7825
708.35
19
708.3519
708.3519
708.
3519
766.9214
766.9214
825.4908
Figure 59c. Response surfaces of disintegration MA tablets compressed at 3 kN as a
function of MA (% v/v) and MS (% v/v).

97
Table 23 Holistic investigation of characteristics of MA tablets
7 kN 5 kN 3 kN
MS/MA
Porosity TS TDis Porosity TS TDis Porosity TS TDis
Composition (% v/v)
(% v/v) (N/cm2) (sec.) (% v/v) (N/cm2) (sec.) (% v/v) (N/cm2) (sec.)
MA LA MS (n=6-7) (n=6-7) (n=3) (n=3) (n=3) (n=3) (n=3) (n=3) (n=3)
A 0 69.7 30.3 - 20.6 ± 0.32 103 ± 3.20 550 ± 23 25.4 ± 0.22 58.3 ± 0.16 517 ± 22 31.6 ± 0.03 28.0 ± 0.02 554 ± 28
B 12 61.4 26.6 2.217 18.2 ± 0.21 128 ± 4.64 596 ± 8 24.3 ± 0.28 67.5 ± 2.14 573 ± 23 30.0 ± 0.08 36.3 ± 0.68 593 ± 21
C 23.5 53.4 23.1 0.983 17.0 ± 0.28 133 ± 3.60 616 ± 6 23.0 ± 0.14 70.1 ± 2.12 644 ± 14 28.5 ± 0.28 38.5 ± 0.06 715 ± 71
D 34.5 45.7 19.8 0.574 16.6 ± 0.28 132 ± 3.89 604 ± 21 21.6 ± 0.16 80.4 ± 1.77 627 ± 8 27.4 ± 0.11 43.5 ± 1.26 734 ± 19
E 45.0 38.4 16.6 0.369 16.2 ± 0.20 134 ± 3.35 428 ± 16 21.2 ± 0.07 79.0 ± 1.28 589 ± 25 26.0 ± 0.12 48.4 ± 1.28 728 ± 31
F 55.1 31.3 13.6 0.247 15.8 ± 0.24 143 ± 7.14 266 ± 8 20.5 ± 0.20 88.4 ± 0.86 418 ± 11 25.6 ± 0.28 52.6 ± 2.12 619 ± 21
G 64.8 24.6 10.6 0.164 15.5 ± 0.14 142 ± 4.76 453 ± 24 20.5 ± 0.22 84.8 ± 1.36 403 ± 11 25.5 ± 0.34 52.2± 0.83 658 ± 25
H 74.1 18.1 7.8 0.105 16.4 ± 0.37 143 ± 3.52 758 ± 15 20.2 ± 0.05 92.5 ± 0.53 461 ± 15 25.2 ± 0.11 56.9 ± 0.82 518 ± 15
I 0 84.8 15.2 - 20.6 ± 0.16 97.6 ± 2.71 379 ± 7 24.5 ± 0.36 70.2 ± 1.87 312 ± 7 30.5 ± 0.08 34.9 ± 0.78 281 ± 14
J 34.5 51.3 14.2 0.412 17.0 ± 0.26 135 ± 2.10 535 ± 12 21.3 ± 0.10 91.5 ± 1.34 633 ± 23 27.4 ± 0.29 47.7 ± 0.85 737 ± 24
K 74.1 12.9 13.0 0.175 16.3 ± 0.32 129 ± 1.95 413 ± 8 21.2 ± 0.28 83.5 ± 2.70 392 ± 25 27.3 ± 0.10 46.2 ± 2.01 783 ± 15
L 0 78.8 21.2 - 19.7 ± 0.15 118 ± 1.96 373 ± 36 25.1 ± 0.10 69.9 ± 1.76 339 ± 11 30.9 ± 0.09 34.9 ± 1.30 339 ± 54
M 74.0 7.7 18.3 0.247 16.2 ± 0.11 131 ± 2.17 290 ± 2 20.9 ± 0.08 87.2 ± 0.70 373 ± 17 27.2 ± 0.26 43.3 ± 1.88 713 ± 25
N 0 90.9 9.1 - 20.4 ± 0.47 125 ± 4.07 232 ± 20 23.4 ± 0.48 87.4 ± 1.83 276 ± 25 30.0 ± 0.20 41.9 ± 0.09 256 ± 37
O 34.5 57.0 8.5 0.246 17.4 ± 0.29 133 ± 4.58 420 ± 9 21.4 ± 0.09 90.4 ± 1.33 561 ± 17 27.4 ± 0.25 50.4 ± 0.84 589 ± 10

Results and Discussion
98
6.5 Renormalization technique considerations
The current study is focused on ternary formulation: MA, LA, MS. In order to establish the
connectivity to the binary systems, the renormalization leading to a dimension reduction was
applied. The renormalization is mainly a technique to map three dimensional data down to
two dimensions (Figure 60). Each volumetric percentage of MA and MS were expressed by
MS/(MS+MA) as X axis. It is called as renormalized MS concentration.
Figure 61 shows a plot of disintegration time of MA formulations compressed at 7 kN, 5 kN,
and 3 kN with respect to renormalized MS concentration. This dimension reduction is only
possible and allowed due to the dominating effect of MA in the formulation for concentrations
of MA >> 23.5% (v/v), i.e. for concentrations (see Figure 60), that exceed the percolation
threshold of MA (pcMA). Thus, in practice it is important and prerequisite to look only at
formulations with a high dose of MA, i.e. with an MA load larger than 20% (w/w). It has to be
noted that proposed renormalization is independent on the nature of a third component in the
mixture. However, it should be applied with limitations. Reducing of third component is
possible if the amount of third component’s particles is significantly less than of the particles
of other components in the mixture. In the present case this is guaranteed by high load of MA.
Another limitation is that third component should not have fibrous structure.
It also has to be kept in mind that the evaluation of the Equation 15 according to the
percolation theory is only allowed in the vicinity of the percolation threshold [74]. The regions
of an initial steep fall and a following sharp rise of a tablet disintegration time are
corresponding to the interval of the MS/(MS+MA) ratio from around 0.1 till 0.3 as shown in
Figure 61. This region is followed by the leveling off the disintegration time at a constant
value which is not shown in following section of this PhD work [cut off at 0.3].

99
0 10 20 30 40 50 60 70
10
15
20
25
30
MA (% v/v)
MS
(%v/
v)
311.026
311.
026
311.026
360.689836
0.68
98
410.3536
410.
3536
410.
3536
410.
3536
410.3536
460.0174
460.0174
460.
0174
460.017
4509.6811
509.6811
509.
6811
509.
6811
559.3449
559.
3449
559.
3449
609.0087
609.
0087
460.0174509.6811
261.
3623
0.125 0.15 0.175 0.2 0.225 0.25 0.275MS
・・・・・・・・・・・・・・・・・・MS + MA , v・v100
200
300
400
500
600
700
Ttnised
.Hces.L
sec.
Figure 60. Mapping from three dimensional data down to two dimensions when MA concentrations >> 23.5 % (v/v) regarding to the
disintegration time of MA tablets compressed at 7 kN.

Results and Discussion
100
0
100
200
300
400
500
600
700
800
900
0 0.2 0.4 0.6 0.8 1 1.2
MS/(MS+MA), (v/v)
Dis
inte
grat
ion
time,
(se
c.)
7kN
5kN
3kN
Figure 61. Plot of disintegration time of MA formulations compressed at 7, 5, and 3 kN with
respect to renormalized MS concentration.
6.6 Critical concentration of MS for MA tablets
The minimum disintegration time of tablets compressed at 7 kN and 5 kN was found for the
Tablet O, F and M corresponding respectively to 34.5% v/v, 55.1% v/v and 74.0% v/v of MA
was expressed at a renormalized MS concentration; MS/(MS+MA) = 0.198 using only the
experimental values (Table 24). In fact, the renormalized MS concentration; MS/(MS+MA) =
0.198 for high dose, i.e. > 20% (w/w) MA tablets corresponds to the critical concentration of
MS and represents the percolation threshold of MS. Below and above this percolation
threshold of the disintegration time was increasing. The absolute minimum of the
disintegration time (266 ± 8 sec.) was found for MA tablet compressed with the force of 7 kN.
This data set exhibits the most distinct percolation event with the sharper minimum of the
disintegration time. For this reason this dataset was used for the evaluation of Equation 15.
In Figure 62, the critical concentration of MS was calculated using the spline function with
the dataNESIA software. It was leading to a slightly different minimum at 0.206, which was
very close to 0.198.

101
Table 24 Holistic investigation of characteristics of MA tablets for renormalized MS concentrations
7 kN 5 kN
MS/
(MS+MA) Porosity TS TDis Porosity TS TDis
Composition (% v/v)
(% v/v) (N/cm2) (sec.) (% v/v) (N/cm2) (sec.)
MA LA MS (n=6-7) (n=6-7) (n=3) (n=3) (n=3) (n=3)
A 0 69.7 30.3 1 20.6 ± 0.32 103 ± 3.20 550 ± 23 25.4 ± 0.22 58.3 ± 0.16 517 ± 22
B 12 61.4 26.6 0.689 18.2 ± 0.21 128 ± 4.64 596 ± 8 24.3 ± 0.28 67.5 ± 2.14 573 ± 23
C 23.5 53.4 23.1 0.497 17.0 ± 0.28 133 ± 3.60 616 ± 6 23.0 ± 0.14 70.1 ± 2.12 644 ± 14
D 34.5 45.7 19.8 0.365 16.6 ± 0.28 132 ± 3.89 604 ± 21 21.6 ± 0.16 80.4 ± 1.77 627 ± 8
E 45.0 38.4 16.6 0.27 16.2 ± 0.20 134 ± 3.35 428 ± 16 21.2 ± 0.07 79.0 ± 1.28 589 ± 25
F 55.1 31.3 13.6 0.198 15.8 ± 0.24 143 ± 7.14 266 ± 8 20.5 ± 0.20 88.4 ± 0.86 418 ± 11
G 64.8 24.6 10.6 0.141 15.5 ± 0.14 142 ± 4.76 453 ± 24 20.5 ± 0.22 84.8 ± 1.36 403 ± 11
H 74.1 18.1 7.8 0.096 16.4 ± 0.37 143 ± 3.52 758 ± 15 20.2 ± 0.05 92.5 ± 0.53 461 ± 15
I 0 84.8 15.2 1 20.6 ± 0.16 97.6 ± 2.71 379 ± 7 24.5 ± 0.36 70.2 ± 1.87 312 ± 7
J 34.5 51.3 14.2 0.292 17.0 ± 0.26 135 ± 2.10 535 ± 12 21.3 ± 0.10 91.5 ± 1.34 633 ± 23
K 74.1 12.9 13.0 0.15 16.3 ± 0.32 129 ± 1.95 413 ± 8 21.2 ± 0.28 83.5 ± 2.70 392 ± 25
L 0 78.8 21.2 1 19.7 ± 0.15 118 ± 1.96 373 ± 36 25.1 ± 0.10 69.9 ± 1.76 339 ± 11
M 74.0 7.7 18.3 0.198 16.2 ± 0.11 131 ± 2.17 290 ± 2 20.9 ± 0.08 87.2 ± 0.70 373 ± 17
N 0 90.9 9.1 1 20.4 ± 0.47 125 ± 4.07 232 ± 20 23.4 ± 0.48 87.4 ± 1.83 276 ± 25
O 34.5 57.0 8.5 0.198 17.4 ± 0.29 133 ± 4.58 420 ± 9 21.4 ± 0.09 90.4 ± 1.33 561 ± 17

Results and Discussion
102
0.125 0.15 0.175 0.2 0.225 0.25 0.275MS
・・・・・・・・・・・・・・・・・・MS + MA , v・v100
200
300
400
500
600
700
Ttnised
.Hces.L
SEC.
Figure 62. Experimentally obtained results (•) showing critical concentration of MS at
0.198 and spline (dataNESIA/DesignNESIA) approximated data (—) at 0.206
for renormalized MS concentrations regarding to the disintegration time of MA
tablets compressed at 7 kN.
6.7 Critical volume fraction of MS for MA tablets
The percolation threshold of MS described by renormalized MS concentration;
MS/(MS+MA) applying the renormalization technique was always equal 0.198 for 34.5 (%
v/v), 55.1 (% v/v) and 74.1 (% v/v) MA tablet compressed at 7 kN and 5 kN. The critical
volume fraction of MS (c,MS) for 34.5 (% v/v), 55.1 (% v/v) and 74.1 (% v/v) MA tablets
compressed at 7 kN and 5 kN was within the range of 0.156-0.167 (v/v). It was calculated by
Equation 30 from the basis of Equation 8 and compiled in Table 25 and 26.
MSc, 198.0 Porosity1 of MA tablet Equation (30)
In fact, Equation 30 corresponds to the case II of Equation 14 described below because the
ratio of the radius of MS/MA (r/R) is 3.81 > 0.732. According to the percolation theory, a
minimum disintegration time corresponds to the formation of a continuous water-conducting
cluster through the entire tablet. In case II, porosity and disintegrant represent two
independent water diffusion network. There are two possibilities for water to diffuse through
the entire MA tablets: through a percolating cluster of pores or through an infinite cluster of

Results and Discussion
103
MS. However the dominant network that the water can diffuse for the disintegration of MA
tablet is considered through the disintegrant network, not through the porous network
according to the results of section 6.4. This situation that the particle size of inactive
ingredient is bigger than that of API should be necessary for low water soluble drugs
because they are normally milled in order to reduce the particle size and increase the
dissolution rate. It is concluded that case II of Equation 14 is available not only for the binary
tablets but also for the truly ternary pharmaceutical tablet formulation. Moreover the random
close packed (RCP) system is also the best model for the pharmaceutical tablet formulation
in case of spherical particles regardless the compressed particles are or powder or granules.
1
,discdisX ; if
R
r> 13 CaseII Equation (14)
where Xdis is the critical concentration of disintegrant in powder mixture (v/v), c,dis is 0.16
± 0.01 (v/v) and ε is the tablet porosity (v/v).
Regarding to Tablet O, the dominant components in terms of volumetric percentage in the
tablet is LA, not MA. The case I of Equation 14 has to be taken into account for calculating
the critical concentration of MS because the ratio of the radius of MS/LA (r/R) is 0.635 ≤
0.732 which means the MS particles might be caged by LA. However the critical
concentration of MS can be calculated by the case II of Equation 11. It might be considered
that the ratio of the radius of MS/LA (r/R) being 0.635 is close to 0.732. The particle size of
filler and disintegrant should be close to each other for the robust tablet formulation design.
Table 25 Critical volume fraction of MS (c,MS) for MA tablets compressed at 7 kN
Composition (% v/v)
MA LA MS
MS/(MS+MA)
Porosity
(% v/v)
Disintegration time
(sec.)
c,MS
(v/v)
F 55.1 31.3 13.6 0.198 15.8 266 0.167
M 74.0 7.7 18.3 0.198 16.2 290 0.166
O 34.5 57.0 8.5 0.198 17.4 420 0.164
Table 26 Critical volume fraction of MS (c,MS) for MA tablets compressed at 5 kN
Composition (% v/v)
MA LA MS
MS/(MS+MA)
Porosity
(% v/v)
Disintegration time
(sec.)
c,MS
(v/v)
F 55.1 31.3 13.6 0.198 20.5 418 0.157
M 74.0 7.7 18.3 0.198 20.9 373 0.157
O 34.5 57.0 8.5 0.198 21.4 561 0.156

Results and Discussion
104
6.8 Critical concentration of MS for 0% v/v MA tablets
Tablet A, I, L and N were consisted of LA and MS without MA. Critical concentration of MS
in these tablets compressed at 7 kN and 5 kN were calculated respectively in Table 27 and
28 according to the case I of Equation 14 because the radius of MS/LA (r/R) is 0.635 ≤ 0.732.
1
cdisX ; if 13
R
r CaseI Equation (14)
where Xdis is the critical concentration of disintegrant in powder mixture (v/v), c is 0.16 ±
0.01 (v/v) and ε is the tablet porosity (v/v).
Calculated critical concentration of MS for Tablet A, I, L and N compressed at 7 kN and 5
kN was about 1% v/v (Table 27) and 0% v/v (Table 28). For this reason, the minimum
disintegration time was found in a Tablet N which contained the lowest volume of MS in a
tablet. However it is still unclear the effect of porosity of tablet on the critical concentration of
MS when the porosity of tablet is more than 16% v/v for case I as this study. It is suggested
that the porosity of tablet for case I should be much below 16% v/v from its hardness and
robustness point of view because the porosity of tablet can be easily changed by tableting
condition for example.
Table 27 Critical concentration of MS in 0% v/v MA tablets compressed at 7 kN
Composition (% v/v)
MA LA MS
Porosity
(% v/v)
Disintegration time
(sec.)
Xdis
(% v/v)
A 0 69.7 30.3 20.6 550 0% - 0.81%
I 0 84.8 15.2 20.6 379 0% - 0.81%
L 0 78.8 21.2 19.7 373 0% - 1.47%
N 0 90.9 8.5 20.4 232 0% - 0.96%
Table 28 Critical concentration of MS in 0% v/v MA tablets compressed at 5 kN
Composition (% v/v)
MA LA MS
Porosity
(% v/v)
Disintegration time
(sec.)
Xdis
(% v/v)
A 0 69.7 30.3 25.4 517 0%
I 0 84.8 15.2 24.5 312 0%
L 0 78.8 21.2 25.1 339 0%
N 0 90.9 8.5 23.4 276 0%

Results and Discussion
105
6.9 Comparison of critical volume fraction for MA tablets and Caffeine
tablets
For a close comparison with the results obtained in case of the MA tablets, we take into
account so far unpublished results of the thesis of Luginbuehl [10].
Luginbuehl studied in his thesis the binary system of caffeine (anhydrous) - StaRX1500® at
different size fractions. The binary mixtures were directly compressed by using the universal
material tester Zwick 1478 (Zwick GmbH & Co). The exact procedure for the tableting
process is described in the reference Luginbuehl and Leuenberger [10], where caffeine
(anh.) granulate with an average particle size of 727 m was compressed with StaRX1500®
(average particle size of 76 m). In this case, a critical concentration of StaRX1500® was
found and interpreted as a percolation threshold pc = 0.071 (v/v). On the other hand, the
caffeine (anh.) granulate with an average particle size of 47 m was compressed with
StaRX1500® (average particle size of 76 m). In this case, a critical concentration of
StaRX1500® was found and interpreted as a percolation threshold pc = 0.194 (v/v). Critical
volume fraction (c) was calculated by Equation 14 and compiled in Table 29. Critical volume
fractions (c) for both cases were also within the range of 0.16 ± 0.01 (v/v).
Table 29 Critical volume faction depending on the case
Average particle size (m)
StaRX1500® Caffeine
(anh.)
Case
(r/R)
Critical concentration of
StaRX1500® (v/v) Porosity
(% v/v)
c
(v/v)
76 727 I (0.10) 0.071 12 ± 0.2 0.168
76 47 II (1.62) 0.194 12 ± 0.2 0.170
The following data [10] refer to a caffeine (anh.) powder with the average particle size of 47
m which was compressed together with StaRX1500® having the average particle size of 76
m (case II). The present investigation was done in the range ca. 0.1-0.4 volume of
StaRX1500® in the vicinity of a percolation threshold. In Figure 63, the critical concentration
of StaRX1500® was calculated using the spline function with the dataNESIA software. It was
leading to very close to 0.195 (v/v). It is important to mention here that the solubility of API
does not affect the location of critical concentration of non-fibrous disintegrant.

Results and Discussion
106
0.1 0.15 0.2 0.25 0.3 0.35 0.4StaRX1500 ®,Hv・vL
20
30
40
50
60
70
Ttnised
.Hces.L SEC.
Figure 63. Experimentally obtained results (•) showing critical concentration of
StaRX1500® at 0.194 (v/v) and spline (dataNESIA/DesignNESIA)
approximated data (—) at 0.195 (v/v) regarding to the disintegration time of
caffeine tablets for case II.
6.10 Critical exponent for disintegration behavior
In this study the percolation thresholds pc describe the location of the minimum value of the
disintegration time. These pc-values were kept constant for the further evaluation of Equation
15. For the determination of the critical exponent q of Equation 15, a non-linear curve fitting
method was applied by using the Levenberg-Marquardt [124] algorithm for both spline
approximated and raw datasets of MA tablets compressed at 7 kN (Figure 64) and caffeine
tablets (Figure 65) for case II (critical exponent of caffeine tablets for disintegration behavior
in case I was reported as 0.30 ± 0.05 [10]). Equation 15 includes the percolation threshold pc
as an important parameter describing the microstructure and critical concentration of the
disintegrant. The second parameter is the critical exponent q which depends, in general, on
the system property related to the probability (p) of cluster [71], in other word on nature of the
(disintegration) process [97]. Critical exponent for binary (caffeine tablets) and
multicomponent tablets (MA tablets) with non-fibrous types of disintegrant (StaRX1500® and
MS) are 0.30 and 0.28 very close to each other (average values are: q = 0.28 ± 0.06, see
Table 30).

Results and Discussion
107
0.1 0.15 0.2 0.25 0.3MS
・・・・・・・・・・・・・・・・・・MS + MA , v・v100
200
300
400
500
600
700
Ttnised
.Hces.L SEC.
Figure 64. Results of fitting Equation 15 for MA tablets compressed at 7 kN; figure shows
fitting (—) with spline approximated data (dotted line) and raw experimental
data (•).
0.1 0.15 0.2 0.25 0.3 0.35 0.4StaRX1500 ®,Hv・vL
20
30
40
50
60
70
Ttnised
.Hces.L SEC.
V
•
•
•
•
•
•
••
•
•
••
•
•
•
Figure 65. Results of fitting Equation 15 for caffeine tablets for case II, fitting (—) with
spline approximated data (dotted line) and raw experimental data (•).

Results and Discussion
108
Table 30 Critical exponent and goodness of fit
Data type q r2
MA 7kN raw data 0.28 0.91
MA 7kN spline approximated data 0.35 0.77
MA 5kN raw data 0.23 0.92
MA 5kN spline approximated data 0.19 0.84
Caffeine raw data 0.30 0.78
Caffeine spline approximated data 0.33 0.79
Average values ± standard deviation 0.28 ± 0.06 0.84
The behavior of the disintegration time in the neighbourhood of the percolation threshold
can be mathematically explained with the basic equation of the percolation theory (Equation
15) yielding a critical exponent q was equal to 0.28 ± 0.06 (The quality of fit: r2 = 0.84).
Please note that with one exception, the quality of fit, i.e. the r2 values are significantly better
in case of using the raw data and not the approximated (smoothened) data achieved with the
dataNESIA method. The average value in Table 30 is close to 0.3, has the same magnitude
as β (see Table 10), but is different from 0.4. In the context of the publication of Luginbuehl
and Leuenberger [9] the critical exponent indicates that the presence and the strength of
infinite cluster for its concentration above the percolation threshold plays a role. It is
suggested that the disintegration behavior is related to the strength of disintegrant cluster [9,
71]. Disintegration time decreases with increasing the disintegrant volumetric percentage (%
v/v) of the mixture until percolation threshold. After this percolation threshold of disintegrant,
disintegration time increases again with increasing disintegrant volumetric percentage. The
excess of disintegrant particles in fact makes disintegration time slower due to the swelling of
the excess amount of disintegrant, which slows down the entrance of water by the diffusion
process. Thus the critical exponent of disintegration behavior is considered lower than 0.4 [9].

Results and Discussion
109
6.11 Computing the disintegration time of MA tablet by F-CAD
There are mainly two software to simulate the dissolution profile either F-CAD (algorithm is
cellular automata) or DDDPlusTM from Simulation Plus, Inc. (algorithm is mathematical
modeling) [125]. DDDPlusTM is commercially available for the pharmaceutical industry.
However, so far, there does not exist a specific software to simulate the disintegration time of
a solid dosage form as a function of its formulation. In this work, Dissolution simulation (DS)
module, which is the one of F-CAD is used to get an estimate of the disintegration time of a
MA tablet. It is assumed that the “time elapsed” till water is detected at the geometric center
of the virtual tablet is proportional to the disintegration time. The “time elapsed” happens
before the disintegration of the tablet is completed .It has to be kept in mind that F-CAD 's
core module being based on the cellular automata is following a "first principle" approach
(see Figure 7) [62, 94, 96, 100].
6.11.1 Particle Arrangement and Compaction (PAC) operation
According to Table 11, the mean diameter of MA, LA and MS was 6.57, 39.4, 25.0 m,
respectively. LA and MS particles are six times and four times bigger than MA. Thus the
growth function was used for arranging the LA and MS particles into the tablet created by TD
module until LA and MS were grown to ca. 550 m and 350 m respectively, because the
distributed MA particle size was 96.15 m/cube side. In order to simulate LA granules were
arranged into the virtual tablet, LA was once removed and grown again to follow the ‘Swiss
cheese’ procedure [100]. Because it is assumed that granulated particle should be grown at
limited location in a tablet as competed with direct compressive tablet of powder mixture.
According to the appearance of granules by SEM in Figure 50b, 50c and 50d, it was
observed that MA and MS particles were granulated around LA particles. Thus MA and MS
particles were removed and distributed again after LA was grown in order to simulate
granules observed by SEM.
6.11.2 Comparison of experimental and F-CAD computed disintegration time of MA
tablets
Comparison of experimental disintegration time of tablets compressed at 7 kN and
computed specific time point for water to reach the geometric center of the tablet by F-CAD
software has been carried out. Experimental disintegration time and computed specific time
point for water to reach the geometric center of the virtual tablet are shown in Table 31 and
Figure 66. If all data in Figure 67 (including Tablet K and M) are submitted to a linear
regression analysis, no correlation can be found (r2 = 0.0154). However, if the Tablets K and
M are not taken into consideration, ca. 66% (r2 = 0.6564) of the data can be explained with a

Results and Discussion
110
linear regression, yielding a correlation coefficient of r = 0.81 (Figure 68), however this is
much less than expected from the excellent results of F-CAD to simulate the dissolution
profile of many different formulations [12, 94, 96, 100]. The reason that it was difficult to
compute the disintegration time of Tablet K and M by F-CAD might be related to the fact that
the loading volume of MS was higher than that of LA (see Table 31). In other word, MS
particles were nice to be grown instead of LA. According to the percolation theory, a
minimum disintegration time corresponds to the formation of a continuous water-conducting
cluster through the entire tablet. When the MS particle was grown for Tablet M instead of LA,
the disintegration time of Tablet M by F-CAD was 116 ± 9 (n=6) sec., which was much closer
to the experimental disintegration time. The way of disintegrant particle arrangement in the
virtual tablet has to be taken into account in order to compute the disintegration time of tablet
by F-CAD if the disintegrant was granulated as a tableting granules as a further investigation.
Table 31 Experimental disintegration time of tablets compressed at 7 kN and computed
specific time point for water to reach the geometric center of the tablet by using
F-CAD
Composition (% v/v) Disintegration time (sec.)
MA LA MS
MS/(MS+MA)
Experimental data
(n=3)
F-CAD data
(n=6)
B 12.0 61.4 26.6 0.698 596 ± 8 338 ± 10
C 23.5 53.4 23.1 0.497 616 ± 6 408 ± 7
D 34.5 45.7 19.8 0.365 604 ± 21 448 ± 14
E 45.0 38.4 16.6 0.27 428 ± 16 395 ± 14
F 55.1 31.3 13.6 0.198 266 ± 8 191 ± 13
G 64.8 24.6 10.6 0.141 453 ± 24 432 ± 19
H 74.1 18.1 7.8 0.096 758 ± 15 785 ± 24
J 34.5 51.3 14.2 0.292 535 ± 12 382 ± 10
K 74.1 12.9 13.0 0.15 413 ± 8 596 ± 9
M 74.0 7.7 18.3 0.198 290 ± 2 897 ± 8
O 34.5 57.0 8.5 0.198 420 ± 9 350 ± 13

Results and Discussion
111
MA tablet
0
100
200
300
400
500
600
700
800
900
1000
B C D E F G H J K M O
Dis
inte
grat
ion
tim
e of
tab
let
(sec
.)
Figure 66. Comparison of experimental disintegration time of tablets compressed at 7 kN
(black bar) and computed specific time point for water to reach the geometric
center of the tablet by F-CAD (white bar).
0
100
200
300
400
500
600
700
800
0 200 400 600 800 1000
Tablet M
Specific time point for water to reach the geometric center of the tablet by F-CAD (sec.)
Exp
erim
enta
l d
isin
tegr
atio
n ti
me
of ta
blet
(se
c.)
Tablet K
Figure 67. The relationship of the experimental disintegration times and F-CAD computed
specific time points for water to reach the geometric center of the virtual tablet.
Please note that no significant linear regression can be calculated, if the
results of Tablet K and M are included (r2 = 0.0154).

Results and Discussion
112
Specific time point for water to reach the geometric center of the tablet by F-CAD (sec.)
Exp
erim
enta
l d
isin
tegr
atio
n ti
me
of ta
blet
(se
c.)
y = 0.7382x + 213.82r = 0.81
0
100
200
300
400
500
600
700
800
0 100 200 300 400 500 600 700 800
Figure 68. The relationship of the experimental disintegration time and F-CAD computed
specific time point for water to reach the geometric center of the virtual tablet
in case, that Tablet K and M were excluded (r2 = 0.66, r = 0.81).

Results and Discussion
113
6.11.3 Response surfaces close to the percolation threshold of sensitive tablet
properties such as the disintegration time
Figure 69 shows the typical behavior for a percolation effect. The percolation threshold of
MS expressed by renormalized MS concentration with respect to the minimum F-CAD
disintegration time was observed at 0.198.
Renormalized MS concentration
Dis
inte
grat
ion
tim
e of
tab
let
(sec
.)
Tablet M
Tablet K
0
100
200
300
400
500
600
700
800
900
0 0.1 0.2 0.3 0.4 0.5 0.6 0.7 0.8
Figure 69. Experimental disintegration time (●) and F-CAD values (△) as a function of the
renormalized MS concentration. Please note that the Tablets: E, F, G, J, K, M,
and O show close to the percolation threshold of MS, a similar behavior for the
values of the experimental disintegration time and for the F-CAD calculated
values.
It is important to realize that F-CAD is capable of detecting this percolation threshold
(Figure 69). Due to the fact, that F-CAD can be applied without performing any laboratory
experiment, it has been decided to explore with F-CAD the behavior of the F-CAD calculated
disintegration time in the very close neighborhood of the percolation threshold. Such an
exploration is difficult and cost intensive to perform in a laboratory but can be done without
major problems in-silico. For this reason, two additional in-silico experiments followed by the
central composite design (CCD) with two factors, i.e. MS (% v/v) and the ratio of LA/MA
corresponding to the ratio of hydrophilic excipient/hydrophobic drug substance, have been
performed, which are described below in Table 32 and 33. The response surfaces (Figure 70
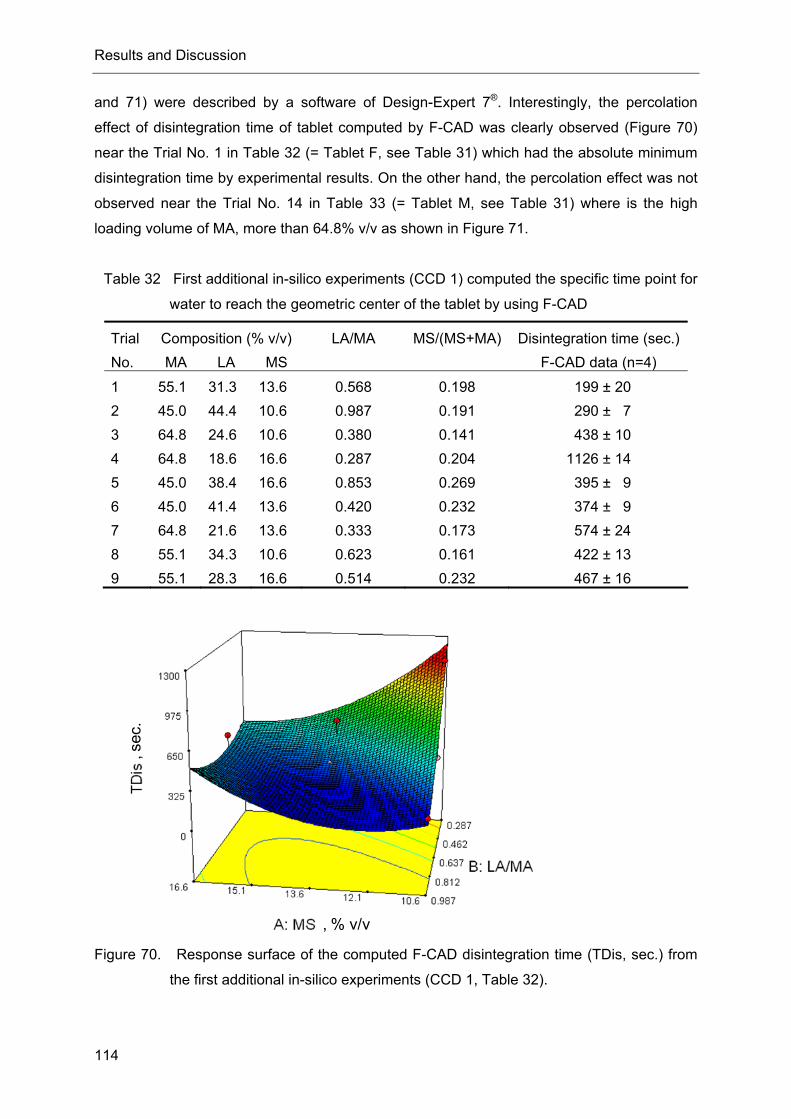
Results and Discussion
114
and 71) were described by a software of Design-Expert 7®. Interestingly, the percolation
effect of disintegration time of tablet computed by F-CAD was clearly observed (Figure 70)
near the Trial No. 1 in Table 32 (= Tablet F, see Table 31) which had the absolute minimum
disintegration time by experimental results. On the other hand, the percolation effect was not
observed near the Trial No. 14 in Table 33 (= Tablet M, see Table 31) where is the high
loading volume of MA, more than 64.8% v/v as shown in Figure 71.
Table 32 First additional in-silico experiments (CCD 1) computed the specific time point for
water to reach the geometric center of the tablet by using F-CAD
Composition (% v/v) Disintegration time (sec.)Trial
No. MA LA MS
LA/MA MS/(MS+MA)
F-CAD data (n=4)
1 55.1 31.3 13.6 0.568 0.198 199 ± 20
2 45.0 44.4 10.6 0.987 0.191 290 ± 7
3 64.8 24.6 10.6 0.380 0.141 438 ± 10
4 64.8 18.6 16.6 0.287 0.204 1126 ± 14
5 45.0 38.4 16.6 0.853 0.269 395 ± 9
6 45.0 41.4 13.6 0.420 0.232 374 ± 9
7 64.8 21.6 13.6 0.333 0.173 574 ± 24
8 55.1 34.3 10.6 0.623 0.161 422 ± 13
9 55.1 28.3 16.6 0.514 0.232 467 ± 16
, % v/v
, sec
.
Figure 70. Response surface of the computed F-CAD disintegration time (TDis, sec.) from
the first additional in-silico experiments (CCD 1, Table 32).

Results and Discussion
115
Table 33 Second additional in-silico experiments (CCD 2) computed the specific time point
for water to reach the geometric center of the tablet by using F-CAD
Composition (% v/v) Disintegration time (sec.)Trial
No. MA LA MS
LA/MA MS/(MS+MA)
F-CAD data (n=4)
10 72.4 12.3 15.3 0.170 0.174 668 ± 21
11 79.4 8.3 12.3 0.104 0.134 1070 ± 21
12 70.7 17.0 12.3 0.240 0.148 1103 ± 70
13 65.9 15.8 18.3 0.240 0.217 1232 ± 20
14 74.0 7.7 18.3 0.104 0.198 896 ± 22
15 76.7 8.0 15.3 0.104 0.166 1133 ± 23
16 68.3 16.4 15.3 0.240 0.183 1143 ± 31
17 75.0 12.7 12.3 0.170 0.141 777 ± 16
18 69.8 11.9 18.3 0.170 0.208 1726 ± 46
, % v/v
, sec
.
Figure 71. Response surface of the computed F-CAD disintegration time (TDis, sec.) from
the second additional in-silico experiments (CCD 2, Table 33).

Results and Discussion
116
The need to eliminate Tablet M and Tablet K results show clearly that there is a necessity
for further investigations and for an improvement of the method to calculate the F-CAD
disintegration time. In fact, it has to be questioned, whether the F-CAD disintegration time is
the right surrogate to simulate the experimental disintegration time. The very rigorous PhD
study of Luginbuehl [10] with the main scientific findings published in 1994 [9] show as
results the behavior of the water uptake constant K. The disintegration time tdis and the
intrinsic dissolution rate of the active substance close to the percolation threshold.
Interestingly, neither the percolation thresholds pci nor the corresponding critical exponents qi
were identical for the three different properties i of the tablet. However, it can be noted that
the parameters pci and qi are different, but close to each other. It may be possible that the F-
CAD disintegration time, which simulates the “time elapsed” till the water molecules reach
the center of the tablet, should be better compared with the “water uptake” constant K as
described in the study of Luginbuehl [9]. However, as already stated in the study of
Luginbuehl [9] one cannot expect to find identical percolation thresholds and in addition
especially not identical critical exponents for different properties of the compact. F-CAD
software is the only software so far, which is capable of computing the disintegration time of
tablets. The software has a great potential to be further improved and to be not only used for
the safe prediction of the dissolution profile of a tablet formulation but also for a safe
prediction of the disintegration time. However, it has to be kept in mind that such an
application of F-CAD is only possible, if there is the awareness, that for a safe exploration of
the design space according to ICH Q8 it is a prerequisite to take into account the effect of
percolation theory. This means in practice that the exploration of the design space needs to
be done with the appropriate resolution, i.e. the “mesh size” of the lattice points to be
investigated in the design space needs to be fine enough. In addition close to the percolation
threshold, it is necessary to apply the basic equation of the percolation theory, i.e. the power
law, with the parameters pc and q, (percolation threshold and critical exponent). It is not
sufficient to use a simple 2n design or a central composite design as both type of designs
yield as a “summarizing equation” by a first or second orders approximation of the reality.
Thus, “Dangerous canyon” close to the percolation threshold leading to a high variability of a
sensitive tablet property may not be detected by only response surface methodologies. The
difference in the resolution of the exploration of the design space becomes visible by
comparing Figure 70 and Figure 71. Both response surfaces are the result of a CCD (central
composite design) with different a “mesh size” of the lattice points in the design space
explored. The minimum in Figure 70 is more prominent than in Figure 71.
It is evident that such a design space exploration with classical laboratory experiments is
extremely difficult to realize and would be extremely expensive. In this respect, the

Results and Discussion
117
application of F-CAD opens a new research avenue, i.e. a “new kind of science” in the
language of Stephan Wolfram (Princeton University) [103].
The results of this thesis show that the application of percolation theory is a must in order to
detect percolation thresholds. It is important to know the response surfaces close to the
percolation threshold of sensitive tablet properties such as the disintegration time to get
information about the robustness of the selected formulation. In this context one has to put
the question forward if the application of percolation theory and the use of F-CAD to detect
the percolation thresholds should be an integral part of the guidelines of ICH Q8 exploring
the formulation design space.

Conclusions
118
7 Conclusions
The present study shows among others that the application of percolation theory is not
limited to typical and formal binary tablet formulations. The critical concentration of maize
starch (MS) for the truly ternary pharmaceutical mefenamic acid (MA) tablet formulations,
has been described by the renormalized MS concentration; MS/(MS+MA) applying the
renormalization technique. The following result is obtained for the critical concentration in
terms of the renormalized dimensionless concentration: 0.198.
In case dataNESIA software is applied, there is the advantage that the data of a response
surface analysis can be smoothed by interpolation of the measured data with a spline
function. It leads to a minimum disintegration time at 0.206, which is very close to 0.198.
According to the percolation theory, a minimum disintegration time corresponds to the
formation of a continuous water-conducting cluster through the entire tablet. The critical
volume fraction of cluster that water can diffuse through the entire MA tablets are calculated
with taking into account the geometrical considerations between MS and MA particles based
on random close packed (RCP) spheres system. The critical volume fraction of MS is
calculated by the multiplication of critical concentration of MS and the solid fraction of MA
tablets; which is within the range of 0.16 ± 0.01 (v/v). It is concluded that the critical volume
fraction for three dimensional lattices is equal to 0.16 ± 0.01 (v/v); which is useful for the
calculation of the critical concentration of starch based disintegrant in order to design the
pharmaceutical tablet formulation based on scientific approach proposed by ICH Q8
guidance.
In addition, the disintegration behavior in the neighborhood of the percolation threshold is
explained mathematically by the basic equation of the percolation theory, yielding a critical
exponent q equal to 0.28 ± 0.06 (Quality of fit: r2 = 0.84). This value is close to the critical
exponent for three dimensional lattices (q = 0.4); which indicates the strength of infinite
cluster for its concentration above the percolation threshold.
The comparison of these results between MA tablets and caffeine tablets lead to very
similar values for the critical concentration of non-fibrous disintegrant and critical exponent
for disintegration behavior. These results can lead to the following conclusions:
1. The solubility of the drug substance does not affect the location of critical
concentration of non-fibrous disintegrant and critical exponent for disintegration
behavior.
2. The critical exponent q is close to q ≈ 0.3 for the disintegration behavior of
pharmaceutical tablets.

Conclusions
119
From the point of view to choose the best the experimental design to find the critical
concentration of the disintegrant, it is highly recommended to take into account the
percolation theory. Thus, among others, the experimental range can be narrowed. However it
has to be kept in mind that the determination of the percolation threshold and critical
exponent does not give an answer about the absolute value of the disintegration time.
Due to the steadily rising costs for developing and finally for registering a new drug
substance, the pharmaceutical industry starts to use for a rapid pharmaceutical development
more and more software tools. Such an approach is not new and has been successfully
introduced in the automotive industry with Toyota as a pioneer using the principle of “Quality
by Design” [126]. Today, not only cars but also aircrafts such as the Boeing 777 and the
Airbus 380 are first constructed and tested in-silico. Such an approach is considered as best
practice. In the present study the software F-CAD (Formulation-Computer Aided design) [95]
is used to calculate in-silico the expected time of disintegration. F-CAD has been very
successfully applied so far to predict the dissolution profile of a tablet [94, 96, 100] and there
is a conjecture, that the “time elapsed” till water molecules reach the center of the tablet,
which can be calculated by F-CAD could be a surrogate for the effectively measured
disintegration time. Thus, the Dissolution Simulation (DS) module of F-CAD, which is based
on cellular automata algorithm has been used to simulate the disintegration time of a MA
tablet. In the present study, the experimental disintegration time of tablet is compared with
the calculated specific time point for water to reach the geometric center of the tablet. In
general, there is not a specific problem to calculate these specific times. However, the Tablet
K and M show difficulties to compute the F-CAD disintegration time. Interestingly, if these two
Tablets are not taken into account, a correlation between the real disintegration time and the
F-CAD estimate a correlation between the two tablet formulation properties could be
obtained with a correlation coefficient: r = 0.81. Compared to the much better achievements
of F-CAD by calculating the dissolution profile of a tablet formulation, it become evident that
there is a need for further studies and an improvement of F-CAD. It has to be noted, on the
other hand, that there is so far no other software available, which is able to predict the
disintegration time. The disintegration is the key property, especially for low water soluble
drugs. Often the disintegration test can reduce the number of dissolution runs for the design
and process development of immediate release tablet formulation at the early stage such as
phase I and II before POC study [127].
It is concluded that F-CAD software is one of the tools for the substitution of laboratory
experiments for the purpose of the design and development of new pharmaceutical solid
dosage forms. The replacement of expensive laboratory experiments by in-silico experiments
is an important issue to reduce development costs and to comply with the requirements of
ICH Q8 exploring the design space with response surface methodology. The results of this

Conclusions
120
thesis show in addition, that the application of percolation theory is a must in order to detect
percolation thresholds. It is important to know the response surfaces close to the percolation
threshold of sensitive tablet properties such as the disintegration time to get information
about the robustness of the selected formulation. In this context one has to put the question
forward if the application of percolation theory should be an integral part of the guidelines of
ICH Q8 exploring the formulation design space.

Further perspectives
121
8 Further perspectives
In our laboratory, the critical concentration of fibrous disintegrant was found at about 3% v/v
in a binary compact consisting of caffeine or indomethacin and Ac-Di-Sol® [12]. Fibrous
disintegrant is also used for intra-granular excipient in a pharmaceutical tablet. It is important
to know the effect of wet granulation on the critical concentration of fibrous disintegrant.
Moreover it is also important to investigate the critical concentration of disintegrant if it is
used for extra-granular excipient in order to establish the rule of pharmaceutical tablet
formulation design.

References
122
9 References
[1] ICH Harmonized Tripartite Guideline: Pharmaceutical Development Q8(R2), Current Step 4 version: http://www.ich.org/fileadmin/Public_Web_Site/ICH_Products/Guidelines/Quality/Q8_R1/Step4/Q8_R2_Guideline.pdf (accessed December 2011).
[2] Patel, N.R.; Hopponen, R.E. Mechanism of action of starch as a disintegrating agent in aspirin tablets.
J. Pharm. Sci. 1966, 55(10), 1065-1068. [3] Nogami, H.; Hasegawa, J.; Miyamoto, M. Studies on powdered preparations. XX. Disintegration of
the aspirin tablets containing starches as disintegrating agent. Chem. Pharm. Bull. 1967, 15(3), 279-289.
[4] Commons, K.C.; Bergen, A.; Walker, G.C. Influence of starch concentration on the disintegration
time of tolbutamide tablets. J. Pharm. Sci. 1968, 57(7), 1253-1255. [5] Nakai, Y.; Nakajima, S. Relationship between configuration of starch grains in tablet and tablet
disintegration. Yakugaku Zasshi 1977, 97(11), 1168-1173. [6] Yuasa, H.; Kanaya, Y. Studies on internal structure of tablets. ΙΙ. Effect of the critical disintegrator
amount on the internal structure of tablets. Chem. Pharm. Bull. 1986, 34(12), 5133-5139. [7] Ringard, J.; Guyot-Hermann, A.M. Calculation of disintegrant critical concentration in order to
optimize tablets disintegration. Drug Dev. Ind. Pharm. 1988, 14(15-17), 2321-2339. [8] Leuenberger, H.; Rohera, B.D.; Hass, Ch. Percolation theory-a novel approach to solid dosage form
design. Int. J. Pharm. 1987, 38, 109-115. [9] Luginbuehl, R.; Leuenberger, H. Use of percolation theory to interpret water uptake, disintegration
time and intrinsic dissolution rate of tablets consisting of binary mixtures. Pharm. Acta. Helv. 1994, 69, 127-134. (Pharm. Acta. Helv. is no longer existing, article can however be downloaded from http://www.ifiip.ch/content/de/downloads/articles-download.html).
[10] Luginbuehl, R. Anwendung der Perkolationstheorie zur Untersuchung des Zerfallsprozesses, der
Wasseraufnahme und der Wirkstofffreisetzung von binaeren Tablettensystemen. PhD Thesis; University of Basel: Basel, 1994.
[11] Krausbauer, E.; Puchkov, M.; Leuenberger, H. Rational estimation of the optimum amount of non-
fibrous disintegrant applying percolation theory for binary fast disintegrating formulation. J. Pharm. Sci. 2008, 97(1), 529-541.
[12] Krausbauer, E. Contributions to a science based expert system for solid dosage form design. PhD
Thesis; University of Basel: Basel, 2009. [13] Nakai, Y.; Fukuoka, E., Nakagawa, H. Preferred orientation of crystalline particle within tables II.
Effect of shape of aspirin crystals on their orientation within tablets and breaking strength of tablets. Yakugaku Zasshi 1978, 98(2), 184-190.
[14] Nakai, Y.; Fukuoka, E., Nakajima, S., Hasegawa, J. Crystallinity and physical characteristics of
microcrystalline cellulose. Chem. Pharm. Bull. 1977, 25(1), 96-101. [15] Leuenberger, H. The compressibility and compactibility of powder systems. Int. J. Pharm. 1982, 12,
41-55. [16] Jetzer, W., Leuenberger, H. The compressibility and compactibility of pharmaceutical powders.
Pharm. Technol. 1983, 7 (4), 33-39. [17] Leuenberger, H., Jetzer, W. The compactibility of powder systems. Power Technol. 1984, 37, 209-
218. [18] Roberts, R.J.; Rowe, R.C. Brittle/ductile behaviour in pharmaceutical materials used in tabletting. Int.
J. Pharm. 1987, 36, 205-209.

References
123
[19] Alderborn, G.; Lang, P. O., Sagstroem, A., Kristensen. Compression characteristics of granulated materials. I. Fragmentation propensity and compactibility of some granulations of a high dosage drug. Int. J. Pharm. 1987, 37, 155-161.
[20] Roberts, R.J.; Rowe, R.C. The effect of punch velocity on the compaction of a variety of materials. J.
Pharm. Pharmacol. 1985, 37, 377-384. [21] Alderborn, G.; Pasanen, K.; Nystroem, C. Studies on direct compression of tablets. XI.
Characterization of particle fragmentation during compaction by permeametry measurement of tablets. Int. J. Pharm. 1985, 23, 79-86.
[22] Armstrong, N.A.; Palfrey, L.P. The effect of machine speed on the consolidation of four directly
compressible tablet diluents. J. Pharm. Pharmacol. 1989, 41, 149-151. [23] Metropolitan Computing Corporation. www.mcc-online.com/ (accessed October 2011). [24] EDQM. European Pharmacopoeia (Ph. Eur.) 7th edition, 2011. [25] FDA/CDER. Waiver of in vivo bioavailability and bioequivalence studies for immediate release solid
oral dosage forms based on a biopharmaceutics classification system. Guidance for Industry, August 2000.
[26] Von Orelli, J.; Leuenberger, H. Search for technological reasons to develop a capsule or a tablet
formulation with respect to wettability and dissolution. Int. J. Pharm. 2004, 287, 135-145. [27] Kawashima, Y.; Imai, H.; Takeuchi, H.; Yamamoto, H.; Kamiya, K. Development of agglomerated
crystals of ascorbic acid by the spherical crystallization technique for direct tableting and evaluation of their compactibilities. KONA 2002, 20, 251-262.
[28] Leuenberger, H. Granulation, new techniques. Pharm. Acta. Helv. 1982, 57(3), 72-82. (Pharm. Acta.
Helv. is no longer existing, article can however be downloaded from http://www.ifiip.ch/content/de/downloads/articles-download.html).
[29] Leuenberger, H.; Imanidis, G. Monitoring mass transfer processes to control moist agglomeration.
Pharmaceutical Technology 1986, March, 56-73. [30] Newitt, D. M.; Conway-Jones, J.M. A contribution to the theory and practice of granules. Trans. I.
Chem. Eng. 1958, 36, 422-441. [31] York, P. M.; Rowe, R.C. Monitoring granulation size enlargement process using mixer torque
rheometry. First International Particle Technology Forum, Denver, USA, 1994. [32] Terashita, K.; Watano, S.; Miyanami, K. Determination of end-point by frequency analysis of power
consumption in agitation granulation. Chem. Pharm. Bull.1990, 38 (11), 3120-3123. [33] Betz, G.; Buergin, S. J.; Leuenberger, H. Power consumption profiles analysis and tensile strength
measurement during moist agglomeration. Int. J. Pharm.2003, 252, 11-25. [34] 鈴木 祐介.PAT はパラダイムシフトにあらず,“品質は工程で造り込む”の延長上にあり.第 4 回創薬
工業シンポジウム,2004. [35] Watano, S.; Numa, T.; Koizumi, I.; Osaka, Y. Feedback control in high shear granulation of
pharmaceutical powders. Eur. J. Pharma. Biopharma. 2001, 52(3), 337-345. [36] Briens, L.; Daniher, D.; Tallevi, A. Monitoring high-shear granulation using sound and vibration
measurements. Int. J. Pharm.2007, 331, 54-60. [37] Monney, D. Ein Beitrag zur Prozessueberwachung bei der Wirbelschichtgranulierung. PhD Thesis;
University of Basel: Basel, 2000. [38] Dussert, A, Chulia, D.; Jeannin, C.; Ozil, P. Parametric study of fluidized-bed granulation of a low
density micronized powder. Drug Dev. Ind. Pharm. 1995, 21 (12), 1439-1452.

References
124
[39] Gao, J. Z. H., Jain, R., Motheram, R.; Gray, D. B., Hussain, M.A. Fluid bed granulation of a poorly water soluble, low density, micronized drug: comparison with high shear granulation. Int. J. Pharm. 2002, 237, 1-14.
[40] Leuenberger, H.; 綿 野 哲 訳 ・監 修 . How to avoid scale-up problems in manufacturing
pharmaceutical granules: The Glatt® MulticellTM Concept. Pharm Tech Japan 2001, 17 (10), 67-73. [41] Vervaet, C., Remon, J. R. Continuous granulation in the pharmaceutical industry. Chem. Eng. Sci.
2005, 60, 3949-3957. [42] Sunada, H.; Hasegawa, M.; Makino, T.; Sakamoto, H.; Fujita, K.; Tanino, T.; Kokubo, H.; Kawaguchi,
T. Study of standard tablet formulation based on fluidized-bed granulation. Drug Dev. Ind. Pharm. 1998, 24 (3), 225-233.
[43] Adam, A.; Schrimpl, L.; Schmidt, P.C. Factors influencing capping and cracking of mefenamic acid
tablets Drug Dev. Ind. Pharm. 2000, 26 (5), 489-497. [44] Carr, R. L. Evaluating flow properties of solids. Chem. Eng. 1965, 18, 163-168. [45] Hausner, H. H. Friction conditions in a mass of metal powder. Int. J. Powder Metall. 1967, 3, 7-13. [46] Guyot-Hermann, A. M. Tablet disintegration and disintegration agents. S. T. P. Pharma Sciences,
1992, 2 (6), 445-462. [47] Kanig, J. L.; Rudnic, E. M. The mechanisms of disintegrant action. Pharmaceutical Technology 1984,
April, 50-63. [48] Tanino, T.; Aoki, Y.; Furuya, Y.; Sato, K.; Takeda, T.; Mizuta, T. Occurrence of capping due to
insufficient air escape during tablet compression and method to prevent it. Chem. Pharm. Bull. 1995, 43 (10), 1772-1779.
[49] Juppo, A.M. Relationship between breaking force and pore structure of lactose, glucose and mannitol
tablets. Int. J. Pharm. 1996, 127, 95-102. [50] Juppo, A.M. Porosity parameters of lactose, glucose and mannitol tablets obtained by mercury
porosimetry. Int. J. Pharm. 1996, 129, 1-12. [51] Juppo, A.M. Change in parameters of lactose, glucose and mannitol granules caused by low
compression force. Int. J. Pharm. 1996, 130, 149-157. [52] FDA. PAT-A framework for innovative pharmaceutical development, manufacturing, and quality
assurance. Guidance for Industry, September 2004. [53] EDQM. Near-Infrared Spectophotometry. European Pharmacopoeia (Ph. Eur.) 7th edition, 2011. [54] Maurer, L. Near infrared spectroscopy / imaging and terahertz pulsed spectroscopy / imaging for
analysis of solid dosage forms. PhD Thesis; University of Basel: Basel, 2008. [55] Terashita, K. Near-infrared chemical imaging and the PAT initiative. Pharm Tech Japan 2005, 21 (5),
7-15. [56] Li, W.; Woldu, A.; Kelly, R.; McCool, J.; Bruce, R.; Rasmussen, H.; Cunningham, J.; Winstead, D.
Measurement of drug agglomeration in powder blending simulation samples by near infrated chemical imaging. Int. J. Pharm. 2008, 350, 369-373.
[57] Sasic, S. Chemical imaging of pharmaceutical granules by Raman global illumination and near-
infrared mapping platforms. Ana. Chim. Acta. 2008, 611, 73-79. [58] Maurer, L.; Leuenberger, H. Terahertz pulsed imaging and near infrared imaging to monitor the
coating process of pharmaceutical tablets. Int. J. Pharm. 2009, 370, 8-16. [59] Shah, R. B.; Tawakkul, M. A.; Khan, M. A. Process analytical technology: Chemometrics analysis of
raman and near infra-red spectroscopic data for predicting physical properties of extended release matrix tablets. J. Pharm Sci. 2007, 96, 1356-1365.

References
125
[60] Clark, F. Extracting process-related information from pharmaceutical dosage forms using near infrared microscopy. Vib. Spectrosc., 2004, 34, 25-35.
[61] Leuenberger, H.; Guitard, P. Delivery systems for patient compliance. “Pharmaceutical Medicine-The
Future” Lahon, H.; Rondel,R. K.; Krotochvil, C. editors, 3rd International Meeting of Pharmaceutical Physicians, Brussels, October 1978, 4-6, 358-372. (Article to be downloaded from http://www.ifiip.ch/content/de/downloads/articles-download.html, as the book has not been reprinted.).
[62] Leuenberger, H.; Lanz, M. Pharmaceutical Powder Technology-from Art to Science: the challenge of
FDA’s PAT initiative. Adv. Powder Technol. 2005, 16, 1-36. [63] Leuenberger, H.; Becher, W. A factorial design for compatibility studies in preformulation work.
Pharm. Acta. Helv. 1975, 50, 88-91. (Pharm. Acta. Helv. is no longer existing, article can however be downloaded from http://www.ifiip.ch/content/de/downloads/articles-download.html).
[64] Leuenberger’s lecture at Albi, France in 2007. [65] FDA. Challenge and opportunity on the critical path to new medical products. FDA report, March
2004. [66] Leuenberger, H. Chapter “Versuchsplanung und Optimierstrategien” in the textbook of Sucker, Fuchs,
Speiser, Pharmazeutische Technologie, Georg Thieme Verlag, Stuttgart, 1978, 64-80. [67] Takayama, K. Formulation design and optimization of solid dosage forms based on a multivariate
spline interpolation. Pharm Tech Japan 2002, 18 (10), 139-146. [68] Kaseda, Ch. Response surface methodology using a spline algorithm. Geometric modeling and
computing; Lucian, M.L., Neamtu, M., Eds.; Seattle, 2003, 341-352. [69] Wahba, G. Spline models for observational data. Roy. Stat. Soc. Ser. B; Society for industrial and
applied mathematics: Philadelphia, PA, 1990. [70] Arai, H.; Suzuki, T.; Kaseda, C.; Ohyama, K.; Takayama, K. Bootstrap re-sampling technique to
evaluate the optimal formulation of theophylline tablets predicted by non-linear response surface method incorporating multivariate spline interpolation. Chem. Pharm. Bull. 2007, 55 (4), 586-593.
[71] Stauffer, D.; Aharony, A. Introduction to Percolation Theory, Revised 2nd edition. Taylor & Francis
Group, 1994. [72] Stauffer, D.; Aharony, A. 小田垣 孝 訳,パーコレーションの基本理論,原書第 2 版・修訂版,吉岡書
店,2001. [73] Niimura H. A role for percolation theory in analysis of gas permeability of magma. Japanese
Magazine of Mineralogical and Petrogical Sciences 2006, 35, 153-165. [74] Leuenberger, H. The application of percolation theory in powder technology. Adv. Powder Technol.
1999, 10(4), 323-353. [75] 小田垣 孝, 九州大学 エクセレント・スチューデント・イン・サイエンス 公開講演会,2010. [76] Scher, H.; Zallen, R. Critical density in percolation processes. J. Chem. Phys. 1970, 53, 3759-3761. [77] McLachlan, D. S.; Blaszkiewicz, M.; Newnham, R. E. Electrical resistivity of composites. J. Am.
Ceram. Soc. 1990, 73(8), 2187-2203. [78] Powell, M. J. Site percolation in random packed spheres. Phys. Rev. B. 1979, 20(10), 4194-4198. [79] Sherman, R. D.; Middleman, L. M.; Jacobs, S. M. Electron transport processes in conductor-filled
polymers. Polym. Eng. Sci. 1983, 23(1), 36-46. [80] Fitzpatrick, J. P.; Malt, R. B.; Spaepen, F. Percolation theory and conductivity of random close
packed mixture of hard spheres. Physics letters. 1974, 47A, 207-208.

References
126
[81] Ottavi, H.; Clerc, J. P.; Giraud, G.; Roussenq, J.; Guyon, E.; Mitescu, C. D. Electrical conductivity of conducting and insulating spheres: an application of some percolation concepts. J. Phys. C: Solid State Phys. 1978, 11, 1311-1328.
[82] Lee, S. I.; Song, Y.; Noh, T. W.; Chen, X. D.; Gaines, J. R. Experimental observation of nonuniversal
behavior of the conductivity exponent for three-dimensional continuum percolation systems. Phys. Rev. B. 1986, 34, 6719-6724.
[83] Wu, J.; McLachlan, D. S. Percolation exponents and thresholds in two nearly ideal anisotropic
continuum systems. Physica A. 1997, 241, 360-366. [84] Holman, L. E.; Leuenberger, H. The relationship between solid fraction and mechanical properties of
compacts - the percolation theory model approach. Int. J. Pharm. 1988, 46, 35-44. [85] Hernandez-Perni, G.; Leuenberger, H. The characterization of aprotic polar liquids and percolation
phenomena in DMSO/water mixture. Eur. J. Pharma. Biopharma. 2005, 61, 201-213. [86] Caraballo, I. Factors affecting drug release from hydroxypropyl methylcellulose matrix systems in the
light of classical and percolation theories. Expert Opin. Drug Deli. 2010, 7(11), 1291-1301. [87] Caraballo, I.; Fernandez-Arevalo, M.; Millan, M.; Rabasco, A. M.; Leuenberger, H. Study of
percolation thresholds in ternary tablets. Int. J. Pharm. 1996, 139, 177-186. [88] Bunde, A.; Roman, H. E. Gesetzmaessigkeiten der Unordnung, Physik in unserer Zeit 1996, 27, 246-
256. [89] Mandelbrot, B. B. Die Fraktale Geometrie der Natur, Birkhaeuser, Basel, 1987. [90] Leuenberger, H.; Holman, L.; Usteri, M.; Winzap, S. Percolation theory, fractal geometry, and dosage
form design. Pharm. Acta. Helv. 1989, 64, 34-39. (Pharm. Acta. Helv. is no longer existing, article can however be downloaded from http://www.ifiip.ch/content/de/downloads/articles-download.html).
[91] Mandelbrot, B. B. The Fractal Geometry of Nature, W. H. Freeman and Company, San Francisco,
1982. [92] Bonny, J. D.; Leuenberger, H. Determination of fractal dimensions of matrix-type solid dosage forms
and their relation with drug dissolution kinetics. Eur. J. Pharm. Biopharm. 1993, 39, 31-37. [93] Saito, K.; Yamane, S.; Takayama, K.; Nagai, T. Involvement of fractal structure of hydrophilic
polymer matrix in drug release behavior. Yakuzaigaku 1998, 58(4), 203-212. [94] Leuenberger, H.; Leuenberger, M. N.; Puchkov, M. Right First Time: Computer-Aided Scale-up for
manufacturing solid dosage forms with a shorter time to market. SWISS PHARMA 2010, 32(7-8), 3-13.
[95] CINCAP GmbH. www.cincap.ch/ (accessed December 2011). [96] Leuenberger, H.; Leuenberger, M. N.; Puchkov, M. Implementing virtual R & D reality in industry: In-
silico design and testing of solid dosage forms. SWISS PHARMA 2009, 31(7-8), 18-24. [97] Leuenberger, H. Pharmaceutical technology: drug delivery, formulation, and process research.
Chimia 2006, 60, 40-45. [98] Pharma 2020: Virtual R & D - Which path will you take?, PricewaterhouseCoopers, 2008. [99] Puchkov, M.; Leuenberger, H. Improving tablet coating yield and quality via computer-based
simulations. Tablet & Capsule 2010, 20-23. [100] Puchkov, M.; Leuenberger, H. Computer-aided design of pharmaceutical formulations: F-CAD
software and a mathematical concept. Glatt International Times 2011, 31, 2-6. [101] Bourquin, J.; Schmidli, H.; Van Hoogevest, P. Leuenberger, H. Basic concepts of artificial neural
networks (ANN) modeling in the application to pharmaceutical development. Pharm. Dev. Technol. 1997, 2(2), 95-109.

References
127
[102] Bourquin, J.; Schmidli, H.; Van Hoogevest, P. Leuenberger, H. Application of artificial neural networks (ANN) in the development of solid dosage forms. Pharm. Dev. Technol. 1997, 2(2), 111-121.
[103] Wolfram, S. A New Kind of Science, Wolfram Media Inc., 2002. [104] Kita, E.; Toyoda, T. Structural design using cellular automata. Struct. Multidisc. Optim. 2000, 19, 64-
73. [105] Zygourakis, K.; Markenscoff, P. A. Computer-aided design of bioerodible devices with optimal
release characteristics: a cellular automata approach. Biomaterials 1996, 17, 125-135. [106] Barat, A.; Ruskin, H. J.; Crane, M. Probabilistic models for drug dissolution. Part 1. Review of Monte
Carlo and stochastic cellular automata approaches. Simul. Model. Pract. Theory 2006, 14, 843-856. [107] Laaksonen, T.; Laaksonen, H.; Hirvonen, J.; Murtomaekj, L. Cellular automata model for drug
release from binary matrix and reservoir polymetric devices. Biomaterials 2009, 30, 1978-1987. [108] Laaksonen, H.; Hirvonen, J.; Laaksonen, T. Cellular automata model for swelling-controlled drug
release. Int. J. Pharm. 2009, 380, 25-32. [109] Kier, L. B.; Cheng, C.-K.; Testa, B. A cellular automata model of the percolation process. J. Chem.
Inf. Comput.Sci. 1999, 39, 326-332. [110] Brunauer, S.; Emmett, P.H.; Teller, E. Adsorption of gases in multimolecular layers. J. Am. Chem.
Soc. 1938, 60, 309-319. [111] Micromeritics Corporate. PoreSizer 9320 Operator’s Manual, March 2001, Appendix J: Automatic
data reduction. [112] Juppo, A.M.; Yliruusi, J. Effect of amount of granulation liquid on total pore volume and pore size
distribution of lactose, glucose and mannitol granules. Eur. J. Pharm. Biopharm. 1994, 40(5), 299-309.
[113] Fell, J.T.; Newton, J.M. The tensile strength of lactose tablets. J. Pharm. Pharmacol. 1968, 20, 657-
658. [114] Dees, P.J.; Polderman, J. Mercury porosimetry in pharmaceutical technology. Powder Technol. 1981,
29, 187-197. [115] Kamba, M.; Seta, Y.; Takeda, N.; Kusai, A.; Nakane, H.; Nishimura, K. Measurement of agitation
force in dissolution test and mechanical destructive force in disintegration test. Int. J. Pharm. 2003, 250(1), 99-109.
[116] Amidon, G.L.; Lennernaes, H.; Shah, V.P.; Crison, J.R. A theoretical basis for a biopharmaceutic
drug classification: The correlation of in vitro drug product dissolution and in vivo bioavailability. Pharm. Res. 1995, 12 (3), 413-420.
[117] Tokumura, T. A screening system of solubility for drug design and discovery. Pharm Tech Japan
2000, 16(13), 19-27. [118] Yazdanian, M.; Briggs, K.; Jankovsky, C.; Hawi, A. The “high solubility” definition of the current FDA
guidance on biopharmaceutical classification system may be too strict for acidic drugs. Pharm. Res. 2004, 21 (2), 293-299.
[119] Adam, A.; Schrimpl, L.; Schmidt, P.C. Some physicochemical properties of mefenamic acid. Drug
Dev. Ind. Pharm. 2000, 26(5), 477-487. [120] Wikberg, M.; Alderborn, G. Compression characteristics of granulated materials. IV. The effect of
granule porosity on the fragmentation propensity and the compactibility of some granulations. Int. J. Pharm. 1991, 69, 239-253.
[121] Zuurman, K.; Bolhuis, G.K.; Vromans, H. Effect of binder on the relationship between bulk density
and compactibility of lactose granulations. Int. J. Pharm. 1995, 119, 65-69.

References
128
[122] Kimura, G.; Betz, G.; Leuenberger, H. Influence loading volume of mefenamic acid on granules and tablet characteristics using a compaction simulator. Pharm. Dev. Technol. 2007, 12, 627-635.
[123] Kimura, G.; Puchkov, M.; Betz, G.; Leuenberger, H. Percolation Theory and the Role of Maize Starch
as a Disintegrant for a Low Water-Soluble Drug. Pharm. Dev. Technol. 2007, 12, 11-19. [124] Marquardt, D. W. An algorithm for least-squares estimation of non-linear parameters. J. Soc. Ind.
Appl. Math. 1963, 11, 431-441. [125] Simulations Plus, Inc. www.simulations-plus.com/ (accessed December 2011). [126] Morgan, J. M.; Liker, J. K. The Toyota product development system: Integrating people, process and
technology, Kindle edition, Productivity Press Inc., 2006. [127] Sally Grieb, S. Opportunities for the Application of Quality by Design to Dissolution Strategy in
Commercial Formulation Development. PASG 2010 Spring Conference.

Curriculum vitae
129
Curriculum vitae
Name Go Kimura
Date of Birth 18th March, 1975
Nationality Japan
Education:
Since Feb, 2004 PhD study under the supervision of Prof. Dr. H. Leuenberger at the
Institute of Pharmaceutical Technology, University of Basel, Switzerland
Sep, 2003 Visiting scientist from Shionogi & Co., Ltd. under the supervision of
Prof. Dr. H. Leuenberger at the Institute of Pharmaceutical Technology,
University of Basel, Switzerland
Mar. 1999 Master of Science in Pharmacy from Kyoto Pharmaceutical University
Master thesis is “Sustained release technology by delivering drugs in the
colon” under the direction of Prof. K.Takada
May 1997 Registered Pharmacist in Japan
Mar. 1997 Bachelor of Science in Pharmacy from Kyoto Pharmaceutical University
Career:
Since Apr. 1999 Shionogi & Co., Ltd.
Engaged in;
Solid dosage form design and process development for NCEs,
OTC products and life cycle management.
Site change and CAPA of deviation for existing products of
Shionogi Japan, Shionogi Taiwan and Shionogi Inc.


Achievements
131
Achievements
Publications (in English)
[1] Go Kimura, Maxim Puchkov, Hans Leuenberger. : An attempt to calculate in-silico disintegration time of tablets containing mefenamic acid, a low water soluble drug. In preparation, 2012.
[2] Go Kimura, Maxim Puchkov, Gabriele Betz, Hans Leuenberger. : Percolation Theory and the Role of
Maize Starch as a Disintegrant for a Low Water-Soluble Drug. Pharm. Dev. Technol., 12, 11-19, 2007.
[3] Go Kimura, Gabriele Betz, and Hans Leuenberger. : Influence of Loading Volume of Mefenamic Acid
on Granules and Tablet Characteristics Using a Compaction Simulator. Pharm. Dev. Technol., 12, 627-635, 2007.
[4] Nobuhito Shibata, Tatsuharu Shimokawa, Zhi-Qiang Jiang, Young-Il Jeong, Tomoya Ohno, Go
Kimura, Yukako Yoshikawa, Kenji Koga, Masahiro Murakami, Kanji Takada. : Characteristics of intestinal absorption and disposition of glycyrrhizin in mice. Biopharmaceutics & Drug Disposition, 21 (3), 95–101, 2000.
[5] Zhaopeng Hu, Shunsuke Mawatari, Tatsuharu Shimokawa, Go Kimura, Yukako Yoshikawa,
Nobuhito Shibata and Kanji Takada. : Colon delivery efficiencies of intestinal pressure-controlled colon delivery capsules prepared by a coating machine in human subjects. J. Pharm. Pharmacol., 52, 1187-1193, 2000.
[6] Yukako Yoshikawa, Zhaopeng Hu, Go Kimura, Masahiro Murakami, Hiroshi Yoshikawa and Kanji
Takada. : A dissolution test for a pressure-controlled colon delivery capsule: Rotating beads method. J. Pharm. Pharmacol., 51, 979-989, 1999.
[7] Zhaopeng Hu, Tatsuharu Shimokawa, Tomoya Ohno, Go Kimura, Shun-suke Mawatari, Megumi
Kamitsuna, Yukako Yoshikawa, Shigeki Masuda and Kanji Takada. : Characterization of norfloxacine release from tablet coated with a new pH-sensitive polymer, P-4135F. J. Drug Target, 7, 223-232, 1999.
[8] Zhaopeng Hu, Go Kimura, Yoshiaki Ito, Mawatari Syunsuke, Tatsuharu Simokwa, Hiroshi Yoshikawa,
Yukako Yoshikawa and Kanji Takada. : Technology to obtain sustained-release characteristics of drugs after delivered to the colon. J. Drug Target, 6, 439-448, 1999.
[9] Zhaopeng Hu, Go Kimura, Shun-suke Mawatari, Tatsuharu Shimokawa, Yukako Yoshikawa and
Kanji Takada. : New preparation method of intestinal pressure-controlled colon delivery capsules by coating machine and evaluation in beagle dogs. J. Controlled Release, 56, 293- 302, 1998.
[10] Tomohiro Takaya, Kiyoshi Niwa, Motoki Muraoka, Ikuo Ogita, Noriko Nagai, Ryo-ichi Yano, Go
Kimura, Yukako Yoshikawa, Hiroshi Yoshikawa and Kanji Takada. : Importance of dissolution process on systemic availability of drugs delivered by colon delivery system. J. Controlled Release, 50, 111-122, 1998.
Oral presentations (in English)
[1] Influence of loading amount of mefenamic acid on granulation and tablet characteristic using a
compaction simulator. Go Kimura, Gabriele Betz, Hans Leuenberger. 8th International Symposium on Agglomeration, Bangkok, Thailand, March 16-18 2005.
[2] Influence of loading amount of mefenamic acid on granulation and tablet characteristic using a
compaction simulator. Go Kimura, Gabriele Betz, Hans Leuenberger. Continuing Education Course of the Center of Pharmaceutical Sciences Basel-Zurich, 2004.

Achievements
132
Posters (in English)
[1] Percolation theory and the role of maize starch as a disintegrant for a low water soluble drug
formulation. Go Kimura, Maxim Puchkov, Gabriele Betz, Hans Leuenberger. 2nd International Technical Forum Inspiring Powder Technology, Makuhari, Japan, Nov. 9 2006.
[2] Understanding the factors influencing tablet qualities by NIR chemical imaging. Go Kimura, Takashi
Hayashi, Ryuichi Kume, Tsuyoshi Furukawa, Shukichi Ochiai. 125th Annual Meeting of the Pharmaceutical Society of Japan, Sendai, Japan, March 28-30 2006.
[3] Influence of amount of maize starch on the disintegration time of mefenamic acid containing tablet
using a compaction simulator. Go Kimura, Maxim Puchkov, Gabriele Betz, Hans Leuenberger. Pharmaceutical Sciences Fair, Nice, France, June 12-17 2005.
[4] Influence of compression force on the disintegration time of mefenamic acid containing tablet using a
compaction simulator. Go Kimura, Gabriele Betz, Hans Leuenberger. 3rd World Conference on Drug Absorption, Transport and Delivery, Barcelona, Spain, April 18-20 2005.
[5] Influence of loading amount of mefenamic acid on granule characteristic and compression behavior
using a compaction simulator. Go Kimura, Gabriele Betz, Hans Leuenberger. 12th International Pharmaceutical Technology Symposium, Istanbul, Turkey, Sep. 12-15 2004.
[6] Preparation and evaluation of sustained-release colon delivey capsule containing 5-aninosalicylic
acid in beagle dogs. Go Kimura, Zhaopeng Hu, Yumi Goto, Wataru Hagihara, Yukako Yoshikawa, Kanji Takada. 9th Japanese-American Conference on Pharmacokinetics and Biopharmaceutics, Nagoya, Japan, Sep. 1998.
[7] New preparation method of intestinal pressure-controlled colon delivery capsules by coating machine
and evaluation in beagle dogs. Zhaopeng Hu, Go Kimura, Motoki Muraoka, Shun-suke Mawatari, Tatuharu Shimokawa, Yukako Yoshikawa and kanji Takada. 9th Japanese-American Conference on Pharmacokinetics and Biopharmaceutics, Nagoya, Japan, Sep. 1998.
[8] Design and evaluation of intestinal pressure-controlled colon delivery capsules (PCDC) in beagle
dogs and human subjects. Motoki Muraoka, Zhaopeng Hu, Go Kimura, Tomohiro Takaya and Kanji Takada. CRS-CPS Joint Workshop on Recent Advances in Drug Delivery Science and Technology, Beijing, China, Sep. 1997.
Publications (in Japanese)
[1] 木村 豪,胡 兆鵬,馬渡 俊輔,下川 達張,高田 寛治:大腸ターゲッティング徐放性製剤技術.
Drug Delivery System, 1999, 14, 191-196. [2] 胡 兆鵬,木村 豪,馬渡 俊輔,萩原 由紀,高田 寛治,荒川 彰,吉田 佳一.生体磁気計測装置
による磁気化大腸デリバリーカプセルのヒトにおける大腸送達性の評価:γ-シンチグラフィーに代わる
非侵襲的手法の試み.臨床薬理,1999, 30(1), 253-254. [3] 胡 兆鵬,木村 豪,馬渡 俊輔,下川 達張,高田 寛治.大腸内圧崩壊型大腸デリバリーカプセル
intestinal luminal pressure-controlled colon delivery capsule (PCDC) のコーティング機による量産法の
確立とその大腸送達性評価.Drug Delivery System, 1999, 14, 123-127. [4] 村岡 元樹,木村 豪,胡 兆鵬,高田 寛治.炎症性大腸疾患.日本臨牀,1998, 56 (3), 788-794. [5] 胡 兆鵬,木村 豪,吉川 由佳子,高田 寛治.蛋白分解酵素阻害薬を利用した薬物吸収改善法.日本
臨牀,1998, 56 (3), 595-600. [6] 村岡 元樹,木村 豪,胡 兆鵬,高田 寛治.大腸特異的疾患の経口療法.綜合臨床,1997, 46,
2326-2331.

Achievements
133
Oral presentations (in Japanese)
[1] 木村 豪,胡 兆鵬,馬渡 俊輔,下川 達張,吉川 由佳子,高田 寛治.大腸ターゲティング後の徐
放性付与に関する研究~大腸デリバリー製剤の応用研究~第 14 回日本 DDS 学会(横浜),1998, 7. [2] 木村 豪,胡 兆鵬,村岡 元樹,馬渡 俊輔,下川 達張,高田 寛治.O-157 腸管出血性大腸菌感染
症治療薬への大腸デリバリー技術の適用 第 3 回腸管出血性大腸菌感染症シンポジウム(東京),1998, 7.
[3] 木村 豪,胡 兆鵬,伊東 良晃,馬渡 俊輔,吉川 由佳子,高田 寛治.潰瘍性大腸炎治療薬 5-
aminosalicylic acid (5-ASA) の大腸ターゲティング徐放性製剤の設計と評価 日本薬学会第 118 年会(京
都),1998, 3.
Posters (in Japanese)
[1] 吉川 由佳子,村岡 元樹,木村 豪,胡 兆鵬,伊東 良晃,大谷 仁恵,熊野 栄治,浜田 圭子,
小川 典子,壽山 晴香,高田 寛治.大腸デリバリーカプセルからの薬物溶出試験法の検討:in vitro 評価法の確立と in vivo との相関 日本薬剤学会第 13 年会(山梨),1998, 2.
[2] 山田 秀徳,福澄 正規,木村 豪,杉山 真紀,藤田 卓也,山本 昌,村西 昌三.消化管粘膜から
の有機アニオン分泌機構に関する検討. 日本薬学会第 117 年会(東京),1997 3. [3] 山田 秀徳,福澄 正規,木村 豪,杉山 真紀,続 正芳,西岡 純子,藤田 卓也,山本 昌,村西
昌三.消化管粘膜からの有機アニオン排出機構に関する研究 第 11 回日本薬物動態学会年会(金沢),
1996 10.
Patents
[1] Satoshi Sakuma, Takuo Sugita, Go Kimura. TABLET CONTAINING VANCOMYCIN HYDROCHLORIDE.
PCT disclosed on Oct. 22, 2006 (WO/2009/128489), PCT applied on Apr. 16, 2009 (PCT/JP2009/057632) ,特許出願 2008-107608
[2] 木村 豪,谷口 陽一,塚田 隆之.ビタミン B1 誘導体組成物.
特許 4573542 号(特許公開 2005-247693,特許出願 2004-055752) [3] 谷口 陽一,塚田 隆之,木村 豪.混合顆粒剤の製造方法.
特許 4462476 号(特許公開 2005-060276,特許出願 2003-290503)
END


![Solubility Enhancement and Formulation Development of ......formulation also showed comparative dissolution profile to commercial tablet formulation. References [1] Deshmukh SS, Potnis](https://static.fdocuments.in/doc/165x107/6104f6bccf640b78a16bf083/solubility-enhancement-and-formulation-development-of-formulation-also-showed.jpg)