Cancer Cell Culturing and Cytotoxicity Assays for Anticancer Screening at City of Hope

Design of Neural Network models for
screening anticancer activities in Taxol
analogues
Stan Svojanovsky, PhD Bioinformatics Coordinator
Research Associate Professor
Department of Molecular and Integrative Physiology
University of Kansas, Medical Center
Kansas City, KS 66160 USA

Bioinformatics at KUMC
Our mission is to advance the
understanding of integrative functions in
biological systems, including human,
through the application of computational
models and data analysis with focus on
microarray analysis.
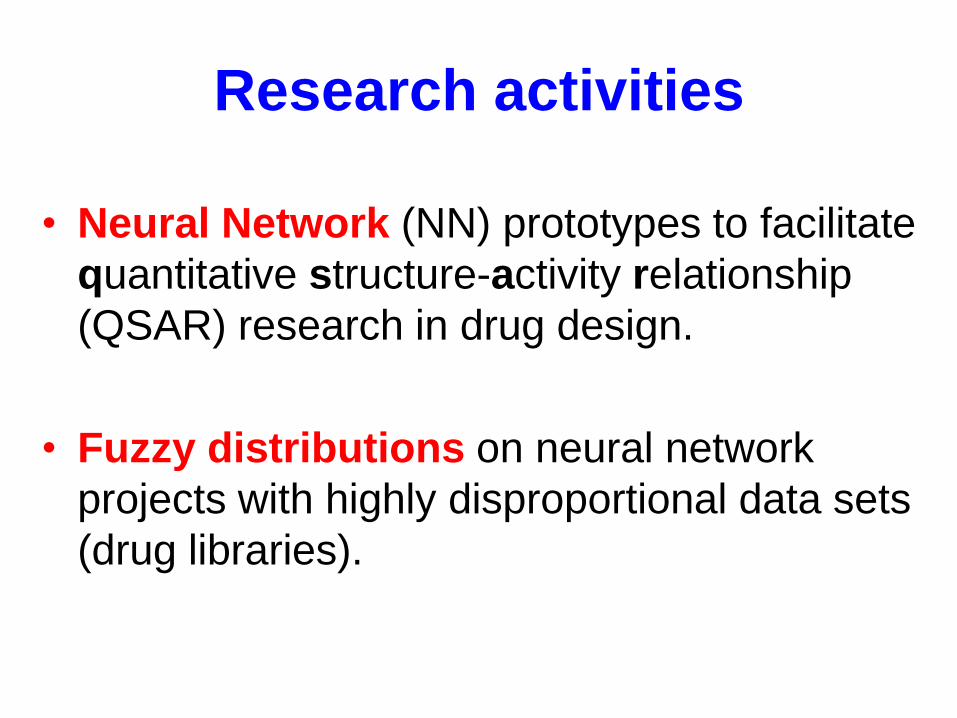
Research activities
• Neural Network (NN) prototypes to facilitate
quantitative structure-activity relationship
(QSAR) research in drug design.
• Fuzzy distributions on neural network
projects with highly disproportional data sets
(drug libraries).

Experimental design
• Goals: To design neural network models to
screen taxol analogues for anticancer activity
(based on QSAR) with the prediction of
potential pharmaceutical target compound.
• The application of neural network prototype
for a sample of 50 taxol analogues (NCI data)
with known chemical structure and
anticancer activity.
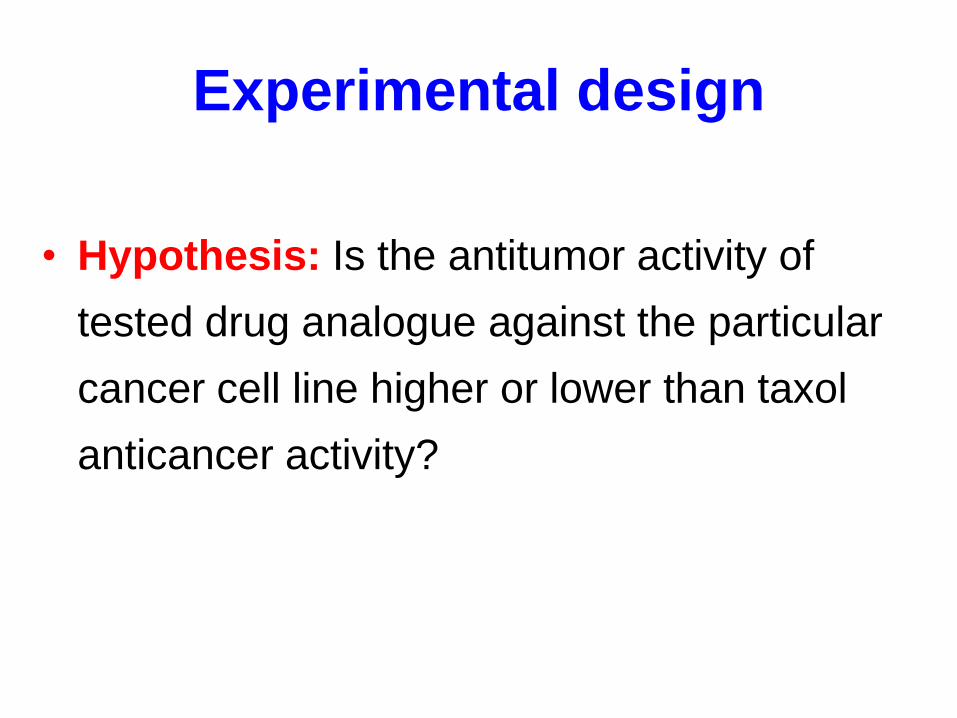
Experimental design
• Hypothesis: Is the antitumor activity of
tested drug analogue against the particular
cancer cell line higher or lower than taxol
anticancer activity?
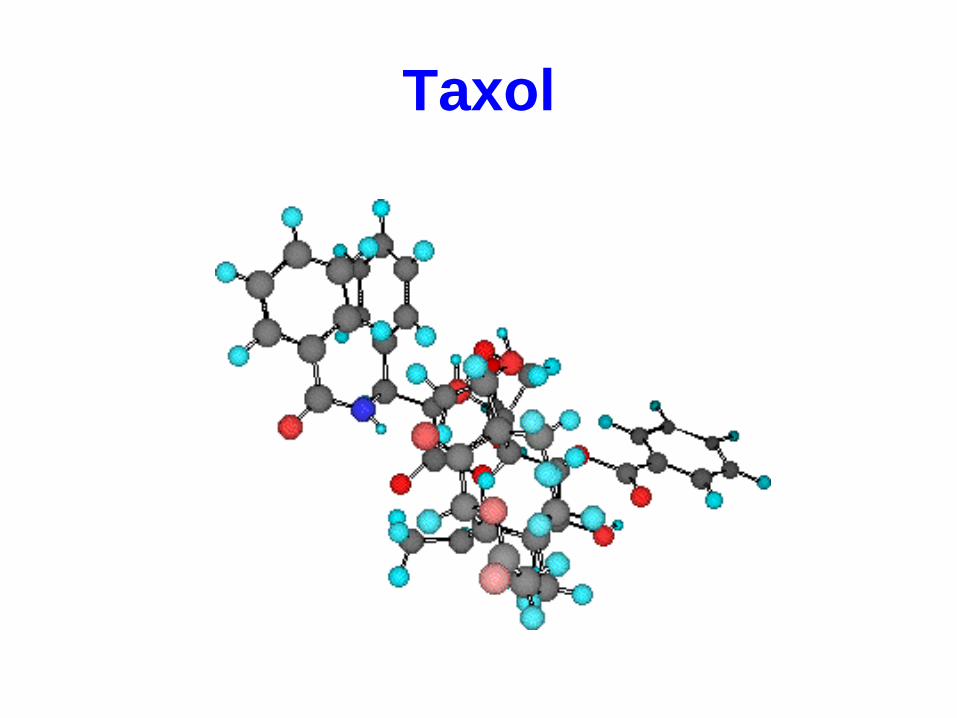
Taxol

Taxol
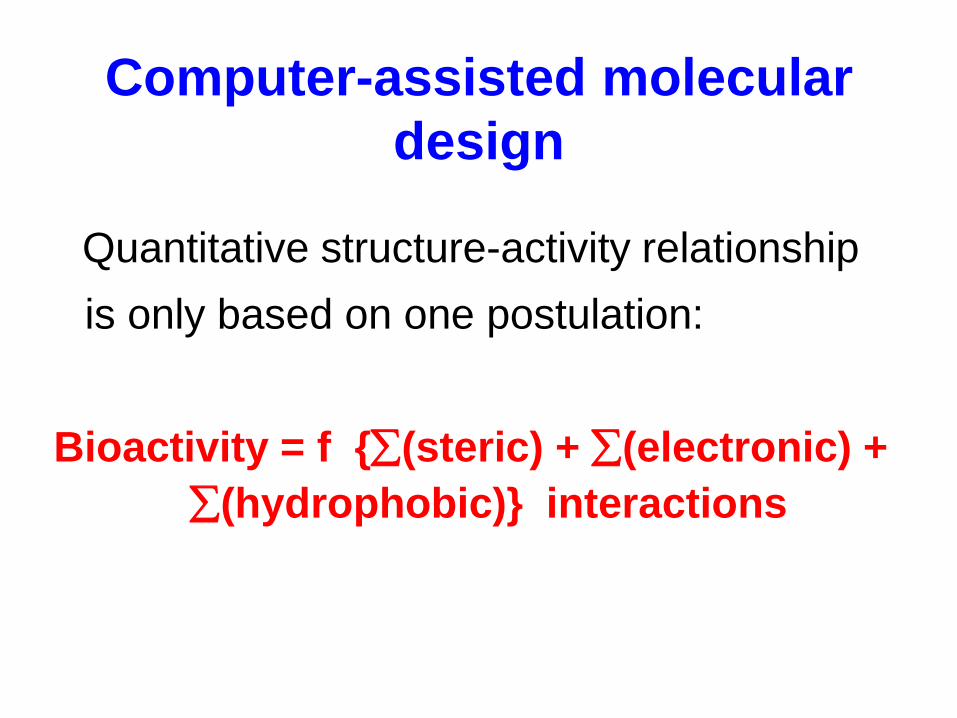
Computer-assisted molecular
design
Quantitative structure-activity relationship
is only based on one postulation:
Bioactivity = f {(steric) + (electronic) +
(hydrophobic)} interactions

QSAR
Chemical
structure Activity
Prediction
Description
Properties:
steric
electronic
hydrophobic
Anticancer activity of 50
compounds in vitro screened
against a panel of 20 human
cancer cell lines (binary data
in 0, 1 format)

Neural network
System composed of many simple elements
operating in parallel whose function is
determined by network design, connection
weights (strengths), and supervised
processing performed at computing elements
(nodes).
Neural network
The intensity of signals produced by the
neurons can differ depending on the
intensity of their stimulus (inputs).
The fundamental assumption is that the
transfer signals are not linearly dependent
on the input values.
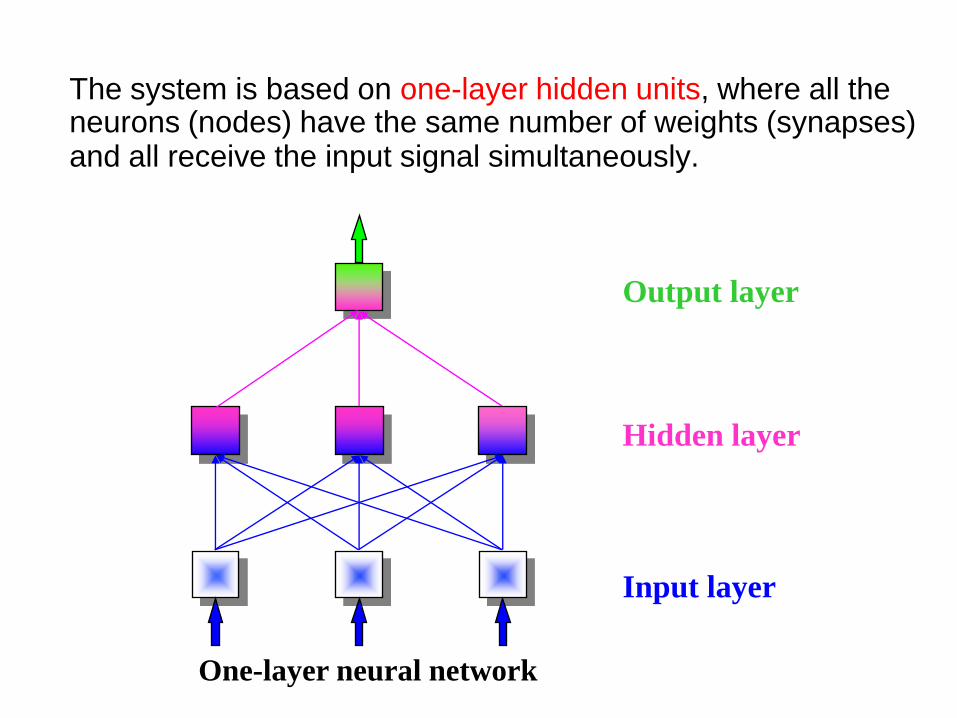
The system is based on one-layer hidden units, where all the neurons (nodes) have the same number of weights (synapses) and all receive the input signal simultaneously.
One-layer neural network
Output layer
Hidden layer
Input layer

Back-propagation Neural Network (BPNN)
f (x)
Formal neuron (node)
)]exp(1/[1)( xxf
w2
w3
o1
o2
Action of formal neuron consists in summing weighted inputs and producing output signal(s) via the activation function. In BPNN it is the sigmoid function:
w1

Computer Assisted Drug Design
Desktop software package (Oxford Molecular, CA) is
used for a ‘structure description’. Based only on the
chemical structure, the potential of the compound can
be established prior to the synthesis.
Chemical
structure
CADD Feature vector
with 27 descriptors
INPUT DATA

Input data
• We use : atom and bond count, MW, conf.
min. E, connectivity index (0,1,2), steric E,
LogP, dipole moment, heat of form., HOM E,
LUM E, molar refractivity, molecular shape
index order (1,2, and 3), and valence
connectivity index (0,1, and 2).
Optimization procedures
• Input data: dimensionality reduction via:
correlation matrix, principal component
analysis, and pattern analysis to eliminate
the variables without any serious loss of
information.
• NN design: Selection of the NN parameters
(learning rate, momentum, number of
training epochs, and initial weights).
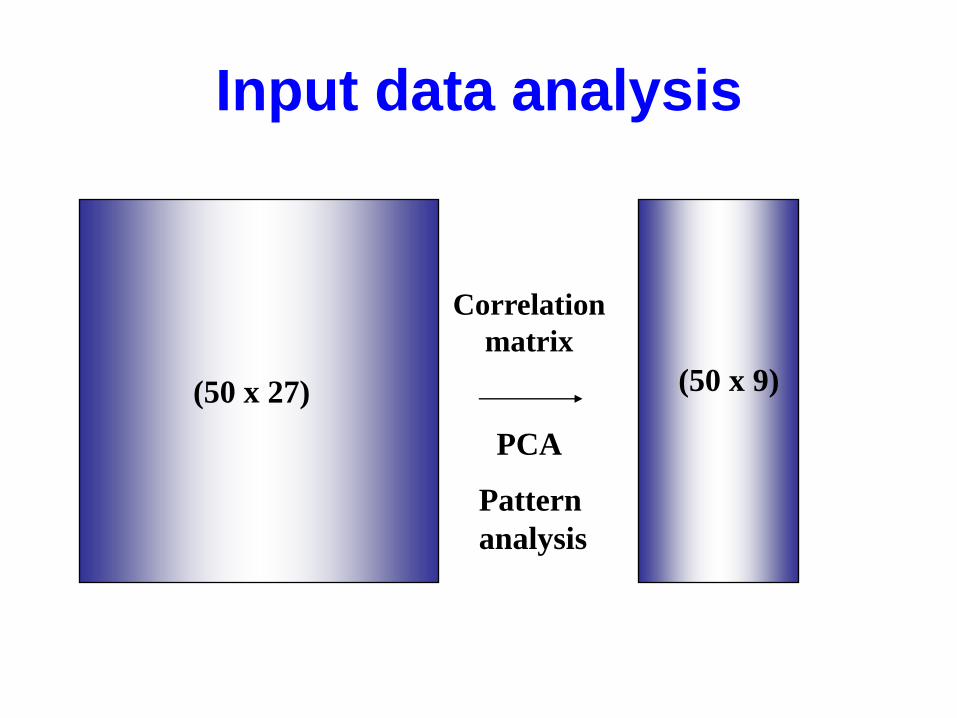
Correlation
matrix
(50 x 27) (50 x 9)
PCA
Pattern
analysis
Input data analysis
Optimization procedures
• Random selection of the training and
validation set (40 + 10 feature vectors).
• Selection of the NN type and architecture
(feed-forward back propagation by
MATLAB software).
• Analysis of the prediction accuracy with
error = = ± 0.1
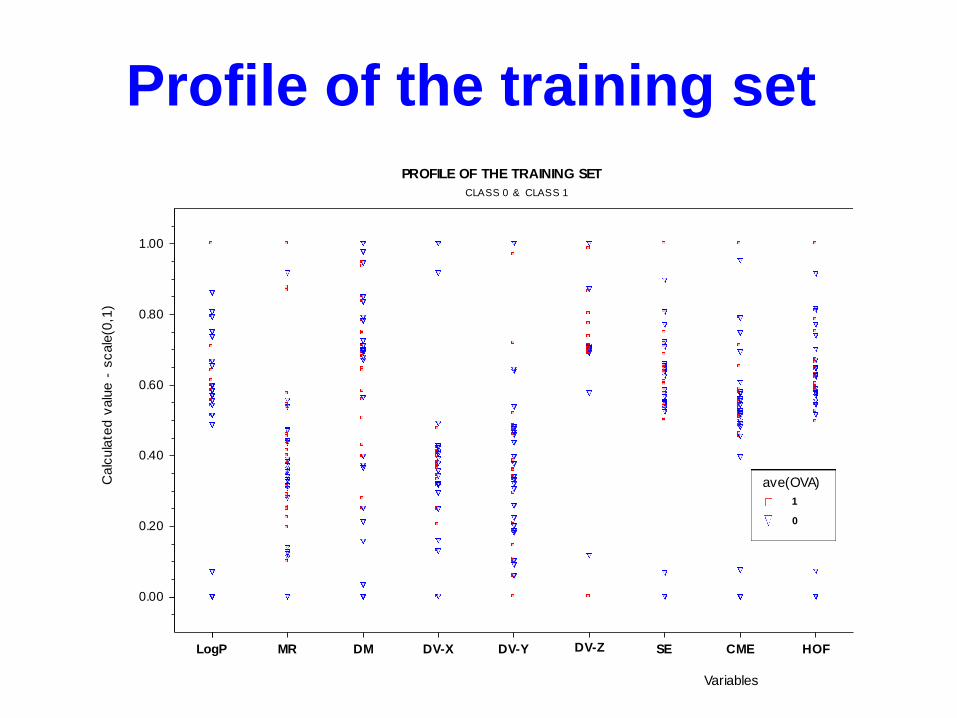
Profile of the training set
HOFCMESEDV-ZDV-YDV-XDMMRLogP
Variables
1.00
0.80
0.60
0.40
0.20
0.00
Ca
lcu
late
d v
alu
e -
sc
ale
(0,1
)
PROFILE OF THE TRAINING SET
CLASS 0 & CLASS 1
ave(OVA)
1
0
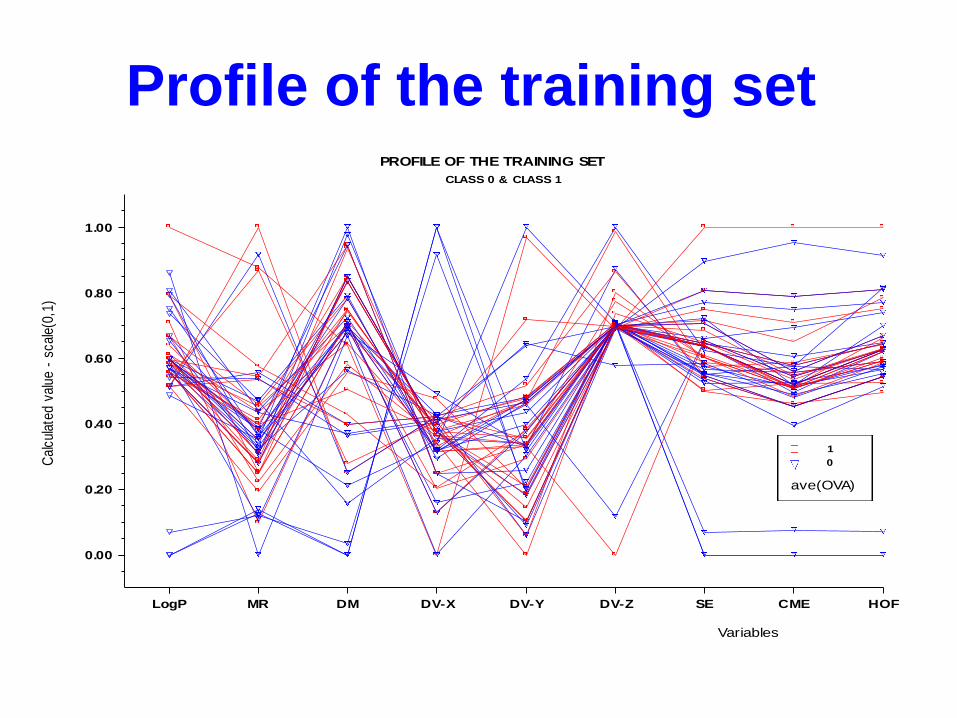
Profile of the training set
HOFCMESEDV-ZDV-YDV-XDMMRLogP
Variables
1.00
0.80
0.60
0.40
0.20
0.00
Cal
cula
ted
valu
e -
scal
e(0,
1)
PROFILE OF THE TRAINING SET
CLASS 0 & CLASS 1
ave(OVA)
1
0
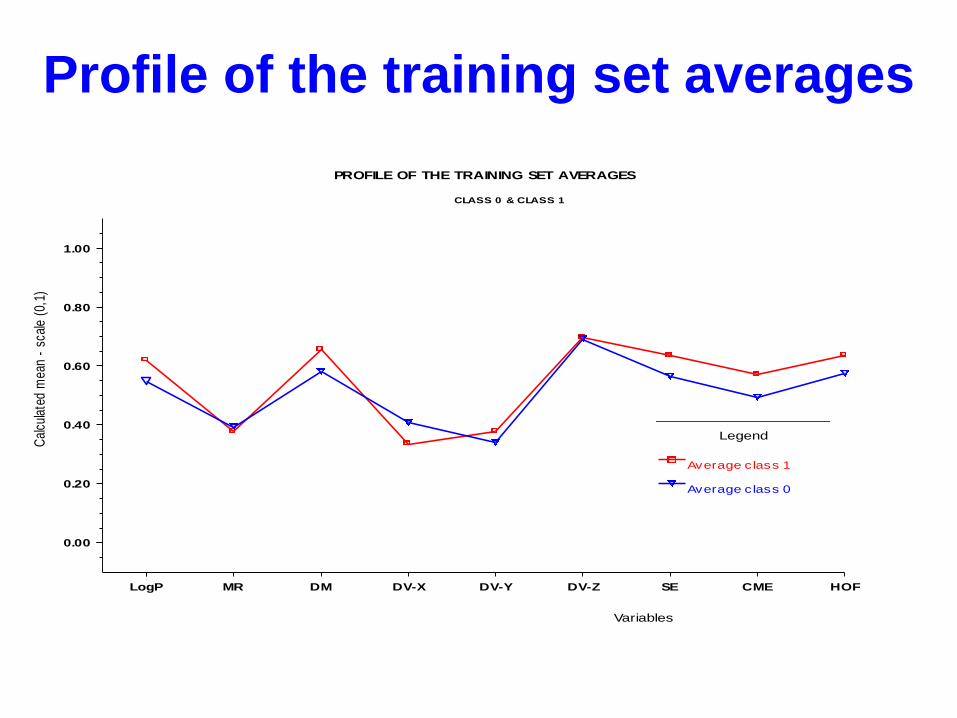
Profile of the training set averages
HOFCMESEDV-ZDV-YDV-XDMMRLogP
Variables
1.00
0.80
0.60
0.40
0.20
0.00
Cal
cula
ted
mea
n -
scal
e (0
,1)
PROFILE OF THE TRAINING SET AVERAGES
CLASS 0 & CLASS 1
Legend
Average class 1
Average class 0
Results
• Feed-forward back-propagation NN
system was used on MATLAB software for
testing the anticancer activity of taxol
analogues against a panel of 4 cell lines of
breast/ovarian cancer.
• There are 2 errors (out of 10 compounds
in validation set) in classification by neural
network model while the discriminant
analysis made 4 errors.

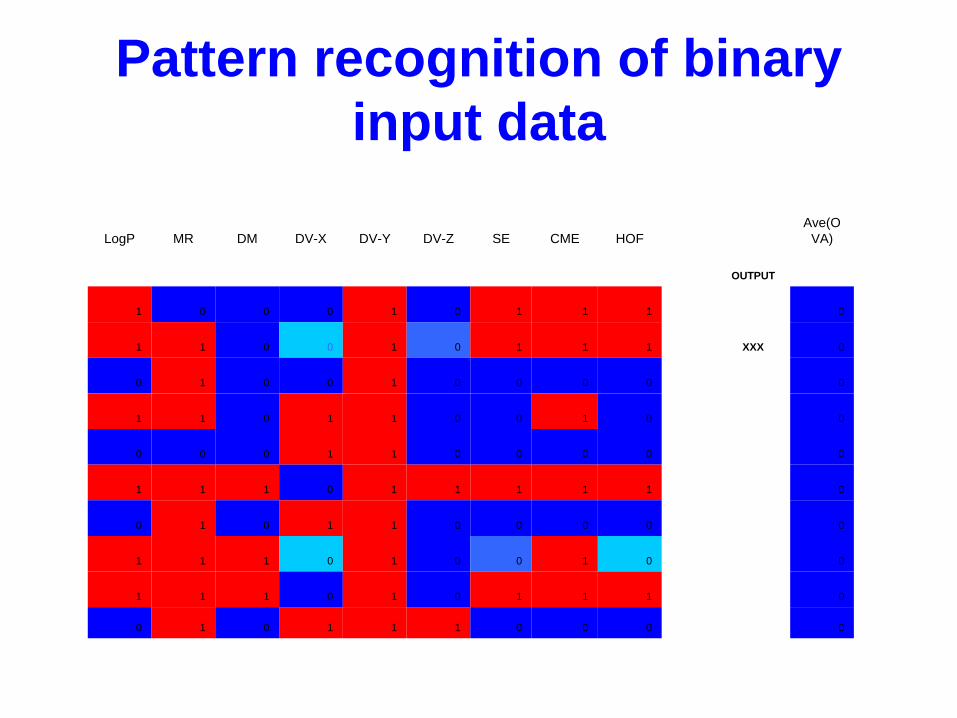
Pattern recognition of binary
input data
LogP MR DM DV-X DV-Y DV-Z SE CME HOF OUTPU
Ave(OV
A)
INPUT
1 1 1 1 1 1 1 1 1 1
1 1 0 0 1 0 0 1 0 1
1 1 0 0 0 0 1 1 1 1
0 1 0 1 1 0 0 0 0 1
1 0 0 0 1 0 1 1 1 1
1 1 0 0 1 0 0 1 1 1
1 1 0 0 1 0 1 1 1 XXX 1
0 1 0 0 1 0 0 1 0 1
1 0 0 0 1 0 0 1 1 1
0 0 0 1 1 0 0 0 0 1
1 1 1 0 1 0 1 1 1 1
1 1 0 1 1 0 0 1 0 1
1 0 0 0 1 1 0 1 1 1
1 1 0 1 1 0 0 1 0 1
1 1 1 0 1 0 0 1 1 1
LogP MR DM DV-X DV-Y DV-Z SE CME HOF
Ave(O
VA)
OUTPUT
1 0 0 0 1 0 1 1 1 0
1 1 0 0 1 0 1 1 1 XXX 0
0 1 0 0 1 0 0 0 0 0
1 1 0 1 1 0 0 1 0 0
0 0 0 1 1 0 0 0 0 0
1 1 1 0 1 1 1 1 1 0
0 1 0 1 1 0 0 0 0 0
1 1 1 0 1 0 0 1 0 0
1 1 1 0 1 0 1 1 1 0
0 1 0 1 1 1 0 0 0 0
Pattern recognition of binary
input data

Results
Analogue Measured
activity
1. 10y110939 1.7
2. 10y110943 2.3
3. 10y110963 12.7
4. 10y110964 7.7
5. 10y110905 0.8
6. 10y110913 1.9
7. 10y110937 1.1
8. 07y001119 1.8
9. 10y001127 1.4
10. 10y110938 2.0

More information
Stan Svojanovsky, PhD
The University of Kansas, Medical Center
Phone: (913) 588-7266
KUMC Bioinformatics Core:
http://www.kumc.edu/kinbre/bioinformatics.html

Acknowledgement
• Supported by the K-INBRE Bioinformatics
Core, Grant Number P20 RR016475 from
the National Center for Research
Resources (NCRR), a component of the
National Institutes of Health (NIH).
• Supported by the Kansas IDDRC, P30
NICHD HD 02528.

Grazie per la vostra
attenzione